
Our website uses cookies to enhance your browsing experience.


We have carried out a thorough comparison of four analyzers for C/C++ code: CppCat, Cppcheck, PVS-Studio, and Visual Studio's built-in analyzer. In this article, we will discuss in detail, the comparison methodology and the results.
Unfortunately, we are no longer developing or supporting the CppCat static code analyzer. Please read here for details.

We have mentioned a number of times [1, 2] that comparing static code analyzers is a very complicated task. It can't be reduced to simply counting the number of diagnostic rules from the documentation. It also can't be reduced to counting the number of diagnostic messages generated by analyzers on one test project. The only reliable method is to check several different projects with all the analyzers, and compare the number of bugs found by each. It is a huge, and very labor-intensive task, but this technique alone allows one to carry out a reliable comparison of different analyzers.
We should say that we have done a lot work. There were 4 of us working on this task, and we spent a total of 170 man-hours. It's more than a months worth of one programmer's work!
Why did it take us 170 hours to accomplish the comparison? There were quite a few nuances to it, invisible and boring, yet time-consuming. For example, we didn't include into our report the Steamworks SDK project's analysis results. The PVS-Studio and CppCat analyzers caught one single bug in it, while the other analyzers didn't find anything at all. It turned out to be pointless, including this project's check results into the report, but we had had to spend some time on downloading and checking that project before we knew that. Here's another example. Visual Studio's built-in analyzer caused the IDE to crash a number of times, so we had to relaunch the analysis. There were numerous trifling problems like these, which made up a huge amount of work.
Here are the labor-intensiveness metrics of various stages of our investigation:
The following analyzers took part in the comparison:
Each analyzer was used with the recommended settings:
We checked the following open-source projects:
We purposefully don't specify the project versions. The objective of our comparison was the comparison itself, not catching bugs in the latest versions of the projects. Complete analysis of the projects took quite a while, so their source code may have well changed by now. At the very least, the number of lines of code is almost sure to have changed.
That's why we suggest that projects' authors check the latest version of their source code themselves.
Notice also that we didn't distinguish between bugs found in the projects themselves, and bugs found in third-party libraries utilized by the projects. Such a distinction would be irrelevant to our task.
This subject is not easy to explain. Analyzer-generated warnings suggest that the user should thoroughly investigate certain code fragments. Although they very often turn out to be false positives, they are still worth examining, as some refactoring can be done to them, to make the code clear not only to the analyzer, but to other programmers too.
However, what we actually wanted to compare is the number of genuine or potential bugs found by each analyzer.
It's difficult to draw a distinctive line between crucial and non-crucial defects. We can't give a formal definition of what to consider a really dangerous code fragment. We had to rely on our intuition, and we hope it hasn't let us down.
Here is an example to illustrate this idea.
There are a few diagnostic warnings that a certain function uses too much stack memory, say, 16 Kbytes (programs use a 2 Mbyte stack size by default). It can happen when a local array "double x[2000]" is declared in the function. Is it a bug or is it not? Programmers use such functions pretty often and they usually don't cause any troubles. So we decided to ignore such warnings.
And here's another example: a warning about a call to the alloca() function inside a loop. The alloca() function allocates memory to the stack. What is convenient about this, the allocated memory is automatically freed after use. But when called from a loop, it may consume the whole stack pretty quickly. Whether or not it will occur is unknown. We find such constructs more dangerous than one-time stack allocation when entering a function, so we took note of messages like that.
We tried to stick to the following rule:
A diagnostic message is considered crucial if it points to an evident error or, code fragment, which may easily turn into a bug after refactoring.
Let's take a look at a few examples to understand this point.
An example of an evident error:
if (memcmp(&(beentry->st_clientaddr), &zero_clientaddr,
           sizeof(zero_clientaddr) == 0))
A parenthesis is written in the wrong place, which results in the memcmp() function comparing 0 bytes.
An example of a potential error:
const ULONG END_BUCKET = (~0) << 1;Shifting negative values causes undefined behavior. This code will work as the programmer expects with certain compilers, but it is actually sheer luck. At any moment, this code may fail. That's why we find such warnings crucial, and worth mentioning.
An example of a code fragment which we decided to skip:
size_t length = ....;
fb_assert(ptr && length >= 0 && length < 9);
The 'length' variable is unsigned. Formally, the "length >= 0" comparison is pointless, and therefore redundant. We didn't take notice of such warnings.
At first we wanted to include information about false positives in our report. But if we had just mentioned the total number of false warnings generated by each analyzer, the readers might have got it wrong. You see, for some projects certain analyzers generated a huge number of false positives, which were actually easy to eliminate.
No, we are not trying to show PVS-Studio or CppCat in a good light - they did well anyway. It was Visual Studio that showed poor results.
All the analyzers employ a certain mechanism to cut the number of warnings. If a suspicious code fragment is located in an *.h file, the diagnostic message is generated only once, regardless of how many times this header files are included into *.cpp files. There's no sense in showing one and the same warning again and again. Visual Studio's built-in analyzer uses this mechanism as well.
The trouble with this, is that in Visual Studio this works only within the scope of a project, not the entire solution under analysis. As a result, you may sometimes face a problem such as the one described below.
The Eigen solution contains over 500 projects. There are several header files included into all these projects. These header files contain suspicious code fragments that trigger Visual Studio's warnings. Since message filtering is performed only for an individual project, each of these warnings is repeated about 500 times.
As a result, instead of 3 more or less useful warnings, you get about 1900 warnings on those ill-fated header files.
We don't feel like sharing such negative results with you. The problem can be easily solved by modifying the header files. But we will face a dilemma then: it's not fair to pay more attention to one tool without helping the others.
After all, the characteristics of CppCat, Cppcheck and PVS-Studio can also be significantly enhanced through minimum configuration. For example, PVS-Studio may sometimes generate a warning on each code line where a suspicious macro is used. The article "PVS-Studio vs Chromium. 3-rd Check" describes an example where turning off warnings for the DVLOG macro, helped us eliminate 2300 false positives in one fell swoop.
The same goes for the Cppcheck analyzer. So it turns out that minimum customization may help significantly improve the tools' capabilities.
So, here is a useful conclusion:
One can't discuss the number of false positives produced by different tools without carrying out a prior minimum customization of them. Some tiny and annoying nuances may show the picture in a much worse light than it actually is.
So, as we have concluded, we needed some minimum customization of the analyzers. But we didn't know how to improve all the analyzers' results equally. One could easily blame us for having paid more attention to one tool over the others. That's why we decided to ignore the "number of false positives" metric altogether.
There was also another reason we found it difficult to reliably estimate this metric. As we have already mentioned, we had to distinguish between crucial and non-crucial messages. And it was not clear whether to refer non-crucial messages to false positives. They would have just messed it all up even more.
We tried to be unbiased. But you can't be completely unbiased when comparing a tool that you have developed on your own, to other tools.
But trust us, we honestly tried to make the comparison as objective as possible. Besides, CppCat and PVS-Studio really found much more errors than the other analyzers, so there was no sense in artificially boosting their rating.
Aspects where our bias could show
We are more familiar with our own analyzers, CppCat and PVS-Studio, than with any other tool. Because of that, we can tell easily and quickly when they catch genuine bugs. It's not that easy and quick with other analyzers, so we may have missed something important.
Compensation
Being aware of that possibility, we tried to compensate for this effect. For example, we didn't think the following defect to be crucial:
unsigned int x = ....;
printf("%d", x);
"%u" should be used instead of "%d" here. This code will become harmful if the algorithm is handling large numbers (larger than INT_MAX). But in a real-life application, this code is unlikely to cause trouble. That's why PVS-Studio generates a 3-rd level warning, and we didn't include warnings of this level into the report.
In our opinion, similar messages generated by the other analyzers were also non-crucial. However, Cppcheck found this bug to be of high importance, so we took note of such messages from this analyzer, though ignoring them from PVS-Studio.
We hope that the comparison was fair enough due to such compensation.
Quite unexpectedly we discovered that the "analysis speed" metric was totally useless, in isolation from a particular project. Depending on the project, the performance of analyzers may vary greatly.
The following examples confirm this very well:
It's a very large dispersion. On one project, the Cppcheck analyzer is 8 times faster than PVS-Studio, while PVS-Studio is 7 times faster than Cppcheck on another project.
We could calculate some average value, of course, and we did it.
But keep in mind that a programmer works with a concrete real-life project, not just some abstract "average" code. You cannot predict which of the analyzers will show the best performance on your project. Remember that.
Below is a table, with the analysis speed figures for different projects:

Table 1 - Analysis time for different projects (in minutes)
On average, Cppcheck proved to be the fastest, while Visual Studio proved to be the slowest. CppCat is actually a bit faster than PVS-Studio as it has fewer diagnostics to check. But the difference was so insignificant (a few dozen seconds) that we found it pointless to reflect it in the table.
We didn't face any serious troubles when checking the test projects. It was rather the task of examining all the diagnostic messages, and picking out interesting ones that was most difficult.
Unfortunately, we had to skip certain groups of messages for certain projects: when we found a few dozen false positives of one type, we gave up further investigation. Of course, we could have missed some genuine bugs because of this. But we could not afford to waste time closely studying each and every warning. Since all the analyzers took on the role of "a loser" at different times, the reliability of the investigation is unlikely to have been affected due to mutual compensation of the results.
Here's an example for you to understand in which cases we stopped further examination of warnings.
On one of the projects, Visual Studio generated over 500 warnings of the following type:
C6011 Dereferencing NULL pointer 'obj'. test_cppbind
    ghost.hxx  714
    'obj' may be NULL (Enter this branch)      705
    'obj' is dereferenced, but may still be NULL      714
Let's pick some simple function, and find out the reason for the warning:
static raw_type& requireObject(naContext c, naRef me)
{
  raw_type* obj = getRawPtr( fromNasal(c, me) );
  naGhostType* ghost_type = naGhost_type(me);
  if( !obj )
    naRuntimeError
    (
      c,
      "method called on object of wrong type: "
      "is '%s' expected '%s'",
      ghost_type ? ghost_type->name : "unknown",
      _ghost_type.name
    );
  return *obj;
}
There are actually no issues in here. Let's peek into the naRuntimeError() function:
void naRuntimeError(naContext c, const char* fmt, ...)
{
    va_list ap;
    va_start(ap, fmt);
    vsnprintf(c->error, sizeof(c->error), fmt, ap);
    va_end(ap);
    longjmp(c->jumpHandle, 1);
}
This function must print an error message, and call the longjmp function. This is an alternative to the exception throwing mechanism.
What matters to us is that the naRuntimeError() function doesn't pass the control back, so the null pointer will never be dereferenced. Visual Studio's analyzer just cannot figure it all out, and generates a pile of false positives.
We checked the first 20 messages, and they all turned out to be false positives of one type related to the call of the naRuntimeError() function. So we dropped further examination of diagnostic messages with the code C6011 (Dereferencing null pointer).
Is it possible that we missed a few genuine bugs among the rest of the 500 messages of that type? Yes, it is. But on the other hand, we didn't feel like spending several hours on it, just to find that all 500 warnings were false positives. In the example above, you can quickly tell there's no bug there, but large functions take much more time and effort to figure out.
So, once again, it doesn't seem to be a serious problem to us. We had to skip certain groups of messages for each of the analyzers. Sometimes it was Visual Studio that generated a pile of false positives, and sometimes it was Cppcheck, or PVS-Studio, or CppCat. Due to this, the final results were mutually compensated for.
Finally we can take a look at the comparison results. We arranged them in a summary table:
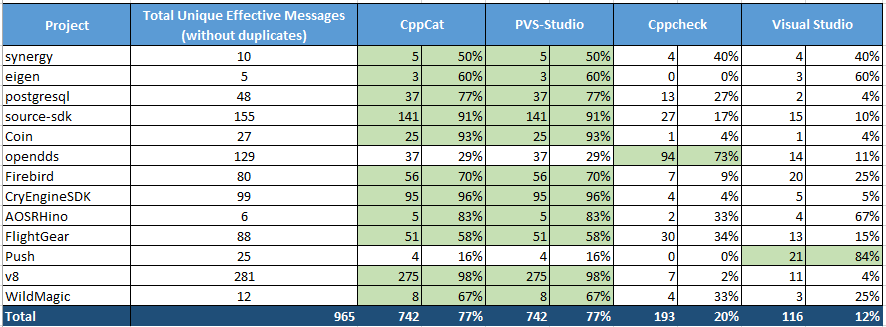
Table 2 - Comparing diagnostic capabilities of different analyzers. Click on the picture to view in full size.
This Excel table was built in the following way. We had four Excel sheets (one sheet per analyzer), and filled in the corresponding messages from each analyzer to get four tables. Then we combined them manually into one table titled "CppCat + PVS-Studio + Cppcheck + Visual Studio (including duplicate messages)". Of course, simply joining the table's results in duplicate messages, which we eliminated with Excel tools. Thus we obtained a fifth table titled "CppCat + PVS-Studio + Cppcheck + Visual Studio (without duplicate messages)". It was this table that we used as a template when building the final tables, with the results for each of the projects, from all the analyzers. The final tables on all of the checked projects were combined into one summary table shown above (Table 2).
The summary table (Table 2) contains the following information:
You can download this Excel file with the list of all the detected bugs here: SCA_Comparison.xlsx.
The article doesn't show any differences between PVS-Studio and CppCat, because PVS-Studio's operation under recommended settings is in no way different from that of CppCat.
To learn about the differences between the two analyzers, see the article "An Alternative to PVS-Studio at $250".
Were there any bugs that PVS-Studio caught and CppCat missed? Yes, there were. For example, the third-level diagnostics caught a few errors. Here is the list of all those errors, just for the sake of reference: PVS_Studio_Level3.txt. We noted down a total of 52 crucial warnings of the third level.
We hadn't studied the third-level warnings with much attention, so we could well have missed something. Speaking of diagnostic messages related to 64-bit errors and microoptimizations, we hadn't studied them at all.
It would be impolite to praise our own analyzers, CppCat and PVS-Studio, so let us only mention that they have found the largest number of defects at a moderate ratio of false positives.
Among Cppcheck and Visual Studio, we would certainly prefer Cppcheck. Visual Studio's analyzer is pretty raw, at the very least. A number of times, we witnessed crashes in Visual Studio, when examining diagnostic messages. You just click on the next message, and the IDE crashes. Considering that an analysis report can't be saved in Visual Studio, those crashes annoyed us very much, as we had to recheck the whole project.
Besides this, we found Cppcheck's diagnostic messages much more comprehensible than those of Visual Studio. What's interesting, Visual Studio's analyzer employs the code coloring mechanism when selecting a message in the list. We find this option useless for medium and large functions, while the messages themselves are quite vague in their meaning, making them difficult to grasp.
As you can see, comparing static analyzers is a very difficult and complex task. We believe that we have done an objective investigation, and have come away with reliable results. We hope they will be of use and interest to all who are interested in static analysis.
0
0
0
0