
Our website uses cookies to enhance your browsing experience.

One of the most difficult things about using static analysis tools is managing false positives. There are a number of ways to eliminate them using the analyzer's settings or changing the code itself. I took a small project Apple II emulator for Windows as an example to show you how you can handle PVS-Studio's analysis report, and demonstrate by a number of examples how to fix errors and suppress false positives.

I will be describing an ideal process of integrating the static analysis methodology into one's software project. The aim of this process is to eliminate all the false positives and genuine errors so that the analyzer finally generates 0 warnings. It is exactly this approach we were sticking to when working on the Unreal Engine 4 project.
In practice, you can seldom achieve an ideal workflow, though. That's why, when working on a large-scale project, it would be more sensible to use an alternative approach: you can hide all the current warnings and set the analyzer to display only those triggered by freshly written or modified code. For this purpose, the PVS-Studio analyzer provides a special mechanism storing the information related to warnings in a special base. To learn more, see the article Integrating Static Analysis into a Project with over 10 Mbytes of Source Code.
Now that you have all the diagnostic messages hidden, you can focus on the quality of code being written. While catching and fixing bugs in new code, you will quickly get to value the might and usefulness of the static analysis methodology. And when you have spare time for that, you can get back to fixing old, hidden, warnings, thus gradually implementing all the necessary edits in the project.
But let's get back to our ideal happy world. Imagine we can afford taking our time to comfortably work with the warnings output by the PVS-Studio analyzer.
In this article, I'm going to show you how to manage the analyzer's warnings, leading you through the entire process - from the first analysis to the moment when we get 0 messages in the message output window.
This is the reason why I picked a small project. I could choose a larger one, but then it'd be too tiresome for me to write the article and for you to read it. Well, it's going to be tiresome anyway. Even with a small project, the article would inevitably turn out large, but please read it carefully. It may help you use our code analyzer with more efficiency.
Our today's laboratory rat is the Apple II emulator for Windows project. The choice was absolutely random, so we won't discuss it. I didn't really care what project we'd take; the only requirement was that it should be small but at the same time buggy enough for us to find some interesting examples.
The project characteristics are the following:
After the first launch of the analyzer, we've got the following diagnostic messages:

Figure 1. Diagnostic messages output at the first launch of the PVS-Studio analyzer on the Apple II emulator for Windows project.
In this article, I will only discuss warnings of the 1-st and 2-nd severity levels from the general analysis (GA) rule set. We could manage the 3-rd level as well, but the article would be just too huge then. So I'll only give a brief overview of Level 3 diagnostics but won't fix anything there.
Microoptimizations (OP) are of no interest for us at this point.
As for 64-bit diagnostics, there is no 64-bit configuration of this project, so they are not relevant either.
Having checked the project, I sorted all the warnings by their codes. You can do it by clicking on the "Code" column (see Figure 2).

Figure 2. PVS-Studio message window. The messages are sorted by the diagnostic number.
Message sorting by code makes it easier to work with the warnings: you have similar messages arranged in groups, so having figured out the reasons behind one message, you will find it easier to deal with the others in the same group.
Note. Some readers may wonder why we haven't enabled this type of message sorting by default. You see, we want to let our users see messages as they appear in the list while the analysis is still running. If we got them sorted right away, new messages would appear in different random places of the list instead of its end. That would result in the messages "jumping" all around and you not being able to work comfortably with such a "jerking" list.
The solution consists of three projects (you can see them in the Solution Explorer window in Figure 2). Two of these - zlib and zip_lib - are of no interest to us, so we need to exclude them from analysis. You can actually exclude only zip_lib as zlib is by default added into the exceptions list. Excluding certain files from analysis is done in PVS-Studio's settings window (section Don't Check Files):

Figure 3. The zip_lib project excluded from analysis.
I excluded the irrelevant project in advance, but you can easily do the same after the analysis. Moreover, you don't need to open the settings window to do this. Just call the drop-down menu and click on the corresponding command to quickly hide all the messages related to a certain file or folder. That's very convenient indeed. I recommend studying the article "PVS-Studio for Visual C++": it describes this and many other features that will allow you to efficiently and comfortably use the tool.
Now we have everything set up for working on the messages. We'll start with the instances of the V501 diagnostic and go on down the list. In total we'll discuss 32+49 = 81 messages. It's quite a lot, so we'll discuss some of them in detail and only briefly touch upon others.
The first 6 messages are triggered by complex macros ADDXXREG, ADCHLREG, SBCHLREG, SBCHLREG. When they are expanded, excessive constructs appear which make the analyzer generate messages like this:
V501 There are identical sub-expressions to the left and to the right of the '^' operator: (tmp >> 8) ^ reg_ixh ^ reg_ixh z80.cpp 3444
The ADDXXREG macro is pretty large and consists of other macros, so I won't cite it here.
What matters to us is the fact that the XOR operation is executed over the reg_ixh variable twice. Therefore, the expression can be reduced to (tmp >> 8). However, there is actually no bug here; it's just an excessive expression when substituting certain macro arguments:
ADDXXREG(reg_ixh, reg_ixl, reg_ixh, reg_ixl, 15, 2);
These are false positives and we need to eliminate them. I suggest suppressing all the warnings associated with them. To do this, I added the following comments in the header file containing the definitions of these macros:
To learn more about this message suppression mechanism, see the corresponding documentation section.
We could actually do with just one comment. Since all the macros' names contain the letter sequence "REG", we can add only one comment //-V:REG:501 to suppress all the V501 warnings in any lines containing the "REG" sequence. But it's not a very good idea because you risk accidentally hiding a useful message that has nothing to do with those macros. A little better way is to add a parenthesis for the search mechanism: //-V:REG(:501. But as for this particular case, I believe we should overcome our laziness and insert the 4 comments as suggested at first.
sprintf( sText, "%s %s = %s\n"
  , g_aTokens[ TOKEN_COMMENT_EOL  ].sToken
  , g_aParameters[ PARAM_CATEGORY ].m_sName
  , g_aParameters[ eCategory ]
  );
The analyzer's diagnostic message: V510 The 'sprintf' function is not expected to receive class-type variable as fifth actual argument. debug.cpp 2300
Indeed, the fifth actual argument of the function is represented by a structure of the Command_t type. I suspect that what should be used instead is the following: g_aParameters[eCategory].m_sName. I've fixed the code accordingly.
The next message tells us about an incompletely filled array: V512 A call of the 'memset' function will lead to underflow of the buffer 'pHDD->hd_buf'. harddisk.cpp 491
BYTE  hd_buf[HD_BLOCK_SIZE+1]; // Why +1?
ZeroMemory(pHDD->hd_buf, HD_BLOCK_SIZE);
The last byte can't be cleared. I'm not sure if this is an error or not. Note the comment: it seems like even the developers themselves don't know for sure what size the array should be and if it should be zeroed entirely.
Code like that is called "smelling". It doesn't necessarily contain a bug but it does look strange and suspicious and may cause some troubles later.
I will simply suppress this warning by a comment. You can fix the code yourself or use the drop-down menu command "Mark selected messages as False Alarms":

Figure 3. Inserting comments in the code to suppress diagnostic messages.
Selecting this command will make the analyzer automatically insert the comment:
ZeroMemory(pHDD->hd_buf, HD_BLOCK_SIZE); //-V512unsigned char random[ 256 + 4 ];
memcpy( &memmain[ iByte ], random, 256 );The memcpy() function copies only part of the 'random' buffer. The analyzer doesn't like it and honestly warns us about it. In this particular case, the analyzer is wrong - there is no error. I have suppressed the warning by a comment like in the previous case. It doesn't look neat but I'm not sure if I can do a better thing in code that isn't mine.
nAddress_ = 0;
nAddress_ = (unsigned)*(LPBYTE)(mem + nStack);
nStack++;
nAddress_ += ((unsigned)*(LPBYTE)(mem + nStack)) << 8;
The analyzer's diagnostic message: V519 The 'nAddress_' variable is assigned values twice successively. Perhaps this is a mistake. Check lines: 568, 569. debugger_assembler.cpp 569
The analyzer has noticed that the nAddress_ variable is assigned different values several times on end. There is no error here, it's just excessive code. I've removed the first line where the variable is assigned 0. Another way to get rid of the warning is to replace the second assignment with "+=".
A similar issue can be found in two other files:
File video.cpp (see lines 3310 and 3315). I've removed the unnecessary operation "pSrc += nLen;".
File Debug.cpp (see lines 5867 and 5868). I've replaced the following code:
char *p = sLine;
p = strstr( sLine, ":" );
with
char *p = strstr( sLine, ":" );There's no need to speak in more detail about these fragments.
The next diagnostic, V519, points at a really serious error. Although it is a classic one and everyone knows of it, programmers still tend to make it in every kind of program.
switch( c )
{
  case '\\':
    eThis = PS_ESCAPE;
  case '%':
    eThis = PS_TYPE;
    break;
  default:
    sText[ nLen++ ] = c;
    break;
}
The analyzer's diagnostic message: V519 The 'p' variable is assigned values twice successively. Perhaps this is a mistake. Check lines: 5867, 5868. debug.cpp 5868
The 'break' operator is missing after "eThis = PS_ESCAPE;". Because of that, the value of the 'eThis' variable will immediately change to PS_STYPE. And this is definitely an error. To fix it, I've added the 'break' operator.
inline static ULONG ConvertZ80TStatesTo6502Cycles(UINT uTStates)
{
  return (uTStates < 0) ?
      0 : (ULONG) ((double)uTStates / uZ80ClockMultiplier);
}
The analyzer's diagnostic message: V547 Expression 'uTStates < 0' is always false. Unsigned type value is never < 0. z80.cpp 5507
The programmer wanted to protect the code from the issue when a negative value is passed into the function. The protection won't work, however, because the 'uTStates' variable is unsigned.
I've added an explicit conversion to the 'INT' type:
return ((INT)uTStates < 0) ?
0 : (ULONG) ((double)uTStates / uZ80ClockMultiplier);In the next function, the analyzer worries about a possible array overrun.
void SetCurrentImageDir(const char* pszImageDir)
{
  strcpy(g_sCurrentDir, pszImageDir);
  int nLen = strlen( g_sCurrentDir );
  if( g_sCurrentDir[ nLen - 1 ] != '\\' )
  ....
}
The analyzer's diagnostic message: V557 Array underrun is possible. The value of 'nLen - 1' index could reach -1. applewin.cpp 553
If you pass an empty string into the function, its length will become zero and an array overrun will occur: g_sCurrentDir[ 0 - 1 ].
The analyzer doesn't know if this situation is possible or not, so it warns you just in case.
I don't know that either. If it is possible, then the analyzer has found a real bug; if not, then it's just a false positive.
I decided to treat it as the latter. But instead of adding a comment to suppress the warning, it will be better to fix the code itself. So I made an additional check in the function:
if (nLen == 0)
  return;
There is another fragment with a potential array overrun, but I must take care not to turn this article into a reference book. So I won't discuss this second fragment which I have simply suppressed by a comment. See the same file, line 556.
if ((bytenum == 3) && (byteval[1] = 0xAA))
{
The analyzer's diagnostic message: V560 A part of conditional expression is always true: (byteval[1] = 0xAA). diskimagehelper.cpp 439
I'm sure the programmer actually wanted the '==' operation, not '='. If it were an assignment, they'd make it in a much more natural and sensible way:
if (bytenum == 3)
{
  byteval[1] = 0xAA;
So this is an error and it must be fixed:
if ((bytenum == 3) && (byteval[1] == 0xAA))if ((TRACKS_MAX>TRACKS_STANDARD) && ....)The analyzer's diagnostic message: V560 A part of conditional expression is always true: ((35 + 5) > 35). diskimagehelper.cpp 548
If we expand the macros, we'll get the expression ((35 + 5) > 35). It is always true, but that's not an error.
This is the case when I'm not sure at all what I'd better do about the code. OK, I won't bother too much and will simply suppress the false positive by a comment: //-V560.
During code refactoring, some variables may get "lost". They are used in the code somehow but you don't need them actually. This is, I guess, what happened to the bForeground variable:
BOOL    bForeground;
....
bForeground = FALSE;
....
if( bForeground )
  dwCoopFlags |= DISCL_FOREGROUND;
else
  dwCoopFlags |= DISCL_BACKGROUND;
....
if( hr == DIERR_UNSUPPORTED && !bForeground && bExclusive )
The 'bForeground' variable is not changed or used anywhere, anymore. And it makes the analyzer generate the warning: V560 A part of conditional expression is always true: !bForeground. mouseinterface.cpp 690
This example is interesting from the philosophical viewpoint. Is this message false or not? Even a human can't answer for sure. The analyzer is right as it has detected an anomaly; but from the human viewpoint, this fragment may as well be just unfinished code and then everything is OK.
As for us, let's treat it as another example of "smelling code". I've deleted the 'bForeground' variable.
*(mem+addr++) =
  (opcode >= BENCHOPCODES) ? 0x00 : ((addr >> 4)+1) << 4;
The analyzer's diagnostic message: V567 Undefined behavior. The 'addr' variable is modified while being used twice between sequence points. cpu.cpp 564
You don't know how exactly the expression will be calculated:
The correct code should look as follows:
*(mem+addr) =
  (opcode >= BENCHOPCODES) ? 0x00 : ((addr >> 4)+1) << 4;
addr++;There are a few errors related to the issue when an incorrect number of actual arguments is passed into formatted output functions. In total there were 10 errors of this kind but we'll discuss only one of them:
wsprintf( sText, TEXT("%s full speed Break on Opcode: None")
  , sAction
  , g_iDebugBreakOnOpcode
  , g_aOpcodes65C02[ g_iDebugBreakOnOpcode ].sMnemonic
);
The analyzer's diagnostic message: V576 Incorrect format. A different number of actual arguments is expected while calling 'wsprintfA' function. Expected: 3. Present: 5. debug.cpp 939
When forming the string, the two last parameters are not taken into account. As an outside observer, I can't say for sure if these parameters are excess or the error is in the format string.
I accepted the first version and removed the parameters.
Similar issues can be found in the following code fragments:
There are a couple of other fragments where "%08X" is used to print the pointer values. On the 32-bit system, it works well; but on the 64-bit one, the pointer will be printed only partially. The correct way is to use "%p". The following are the code fragments where other similar defects were found:
Though it's not its fault, the analyzer generated two false messages for repeating conditions. Let's discuss one of them:
if (nAddress <= _6502_STACK_END)
{
  sprintf( sText,"%04X: ", nAddress );
  PrintTextCursorX( sText, rect );
}

if (nAddress <= _6502_STACK_END)
{
  DebuggerSetColorFG( DebuggerGetColor( FG_INFO_OPCODE ));
  sprintf(sText, "  %02X",(unsigned)*(LPBYTE)(mem+nAddress));
  PrintTextCursorX( sText, rect );
}
The analyzer's diagnostic message: V581 The conditional expressions of the 'if' operators situated alongside each other are identical. Check lines: 2929, 2935. debugger_display.cpp 2935
There is no error; the programmer just divided the actions into two separate groups. From the analyzer's viewpoint, this code is strange: what if the conditions should be different? Anyway, we need to do something about the false positive. I decided to unite two conditional operators into one:
if (nAddress <= _6502_STACK_END)
{
  sprintf( sText,"%04X: ", nAddress );
  PrintTextCursorX( sText, rect );

  DebuggerSetColorFG( DebuggerGetColor( FG_INFO_OPCODE ));
  sprintf(sText, "  %02X",(unsigned)*(LPBYTE)(mem+nAddress));
  PrintTextCursorX( sText, rect );
}
I don't think the code has become less comprehensible because of this, but we have certainly got rid of the false positive.
The second message deals with a similar issue: V581 The conditional expressions of the 'if' operators situated alongside each other are identical. Check lines: 2237, 2245. debugger_display.cpp 2245

Figure 5. They advise showing some picture in the middle of a long article so that the readers could rest a bit. I'm not sure about what picture to add that would suit the subject of this article, so here you are this nice cat.
In total the analyzer output 3 warnings related to this type of issues. Unfortunately, the code is pretty complicated in those fragments, so instead of the real code I will cite shorter and simpler pseudocode. For the first 2 warnings, it looks something like this:
int ZEXPORT unzGetGlobalComment(char *szComment)
{
  ....
  if (A)
  {
    *szComment='\0';
     return UNZ_ERRNO;
  }
  ....
  if ((szComment != NULL) && X)
  ....
}
The analyzer's diagnostic message: V595 The 'szComment' pointer was utilized before it was verified against nullptr. Check lines: 1553, 1558. unzip.c 1553
As you can see, the passed pointer 'szComment' can equal NULL - it is indicated by the (szComment != NULL) check.
However, there is a code fragment where the programmer bravely dereferences the pointer without checking it. That's dangerous. Perhaps 'szComment' can never become equal to 0 in practice, but the code is still dangerous and must be fixed.
Another similar issue: V595 The 'pToken_' pointer was utilized before it was verified against nullptr. Check lines: 811, 823. debugger_parser.cpp 811
And as for the last, third, case, it's a bit more complicated. I'm sick and tired of explaining to everyone that code like that is incorrect and must be fixed. The function is short, so here it is in full:
bool ArgsGetValue ( Arg_t *pArg,
                    WORD * pAddressValue_, const int nBase )
{
  TCHAR *pSrc = & (pArg->sArg[ 0 ]);
  TCHAR *pEnd = NULL;

  if (pArg && pAddressValue_)
  {
    *pAddressValue_ =
      (WORD)(_tcstoul( pSrc, &pEnd, nBase) & _6502_MEM_END);
    return true;
  }
  return false;
}
The analyzer's diagnostic message: V595 The 'pArg' pointer was utilized before it was verified against nullptr. Check lines: 204, 207. debugger_parser.cpp 204
The 'pArg' pointer can equal zero, which is indicated by the presence of the "if (pArg && pAddressValue_)" condition. But before being checked, it is used in the following expression:
TCHAR *pSrc = & (pArg->sArg[ 0 ]);This expression leads to undefined behavior. You just can't dereference null pointers.
Many will argue that code like that doesn't access any memory but just calculates some address - therefore, there is no problem with it. Well, this interpretation of undefined behavior is just too narrow. Don't make guesses about how the compiler can or cannot behave and how the code will or won't work. Just keep in mind that you can't write it that way and there's no sense arguing why exactly.
Undefined behavior in code like that doesn't only have to do with accessing a zero address (which may never happen, indeed). It's that the compiler, for instance, is allowed to reduce the check condition to "if (pAddressValue_)". Since there is the "pArg->xxx" expression in the code, then the pointer is certainly not null and doesn't need to be checked.
It's pointless discussing this matter in more detail. If you want to learn more, see a special article on the subject: Null Pointer Dereferencing Causes Undefined Behavior.
The code is easy to fix - you just need to move the variable declaration inside the 'if' block.
The analyzer was confused by the following expression:
if ((cx > 4) & (cx <= 13))The analyzer's diagnostic message: V602 Consider inspecting the '(cx > 4)' expression. '>' possibly should be replaced with '>>'. debug.cpp 8933
The analyzer sees that the operands of the '&' operator are variables of the 'bool' type. This is strange. In cases like this, a special logical operator '&&' is usually used.
It is a common practice to use the '&' operator for bitwise operations. That's why the analyzer has assumed that the programmer, too, intended to work with bits in this code:
if ((cx >> 4) & (cx <= 13))It has been too precautious and turned out to be wrong, though. But there is some fault of the programmer as well. This code smells. A much more sensible way to write it is as follows:
if (cx > 4 && cx <= 13)It's unknown what exactly shifting negative values to the right will result in. You'd better never do that because the code's behavior may vary depending on the compiler.
const short SPKR_DATA_INIT = (short)0x8000;
if (g_nSpeakerData == (SPKR_DATA_INIT >> 2))
The analyzer's diagnostic message: V610 Unspecified behavior. Check the shift operator '>>'. The left operand 'SPKR_DATA_INIT' is negative. speaker.cpp 450
A way out is to declare the SPKR_DATA_INIT constant as unsigned. However, you will need to make a few more additional subtle fixes to prevent compiler and analyzer warnings regarding signed/unsigned number comparison.
The analyzer has detected 3 more similar dangerous fragments:
By the way, when fixing the last two warnings, I stumbled upon 2 more errors. That is, the analyzer can also help you with catching bugs in an indirect way sometimes.
This is how the macro is used:
SET_PP_16(TFE_PP_ADDR_SE_BUSST, busst & ~0x180);It is expanded into a long string, so I will only show you a part of it:
..... = (busst & ~0x180 >> 8) & 0xFF; .....The >> shift operator's precedence is higher than that of the & operation. See the table: operation precedence.
The programmer expected the code to execute in the following order:
..... = ((busst & ~0x180) >> 8) & 0xFF; .....While actually it will be like this:
..... = (busst & (~0x180 >> 8)) & 0xFF; .....That is why the PVS-Studio analyzer warns us: "the left operand '~0x180' is negative".
See how dangerous macros can be?
The functions sprintf(), wsprintf(), etc. are used in a very insecure way in this project. To put it brief, they are used in the following way:
sprintf(buf, STR);If the STR string contains control characters such as "%s", there will be consequences no one can predict.
Code like this is usually treated as a vulnerability (see the details).
However, I don't think it's that much critical for an emulator; no one is going to attack it. But this code is dangerous by itself - it can easily crash the program or cause its incorrect execution.
The correct way of implementing this function is as follows: sprintf(buf, "%s", STR);
The analyzer has found quite a lot of other dangerous function calls - 21 messages in total.
// TO DO: Need way of determining if DirectX init failed
if (soundtype != SOUND_WAVE)
{
  if (soundtype == SOUND_WAVE)
    soundtype = SOUND_SMART;
The analyzer's diagnostic message: V637 Two opposite conditions were encountered. The second condition is always false. Check lines: 270, 272. speaker.cpp 270
As the comment suggests, the code is incomplete. I'm not sure what we should do in cases like that. I decided to comment out the second meaningless 'if':
if (soundtype != SOUND_WAVE)
{
  //if (soundtype == SOUND_WAVE)
// soundtype = SOUND_SMART;The code looks as if both statements were related to the 'if' operator:
{
  if ((Slot4 == CT_MockingboardC) || (Slot4 == CT_Phasor))
    m_PropertySheetHelper.GetConfigNew().m_Slot[4] = CT_Empty;
    m_PropertySheetHelper.GetConfigNew().m_Slot[5] = CT_SAM;
}
The analyzer's diagnostic message: V640 The code's operational logic does not correspond with its formatting. The statement is indented to the right, but it is always executed. It is possible that curly brackets are missing. pagesound.cpp 229
So far as I get it, there's no bug in the code. But it is not a false positive either. The analyzer is definitely right to warn the user about it. We must fix the alignment:
{
  if ((Slot4 == CT_MockingboardC) || (Slot4 == CT_Phasor))
    m_PropertySheetHelper.GetConfigNew().m_Slot[4] = CT_Empty;
  m_PropertySheetHelper.GetConfigNew().m_Slot[5] = CT_SAM;
}strncat( sText, CHC_DEFAULT, CONSOLE_WIDTH );
strncat( sText, pHelp , CONSOLE_WIDTH );The analyzer's diagnostic message: V645 The 'strncat' function call could lead to the 'sText' buffer overflow. The bounds should not contain the size of the buffer, but a number of characters it can hold. debugger_help.cpp 753
The function's second argument represents the number of characters that can be added to the string. And a better and safer way to write this code is as follows:
strncat( sText, CHC_DEFAULT, sizeof(sText) - strlen(sText) - 1);
strncat( sText, pHelp      , sizeof(sText) - strlen(sText) - 1);
To learn more, see the description of the V645 diagnostic.
For quite a long time now, the 'new' operator has been set to throw the std::bad_alloc exception when it fails to allocate memory. Nevertheless, you can still encounter unnecessary checks like the following one in various programs:
BYTE* pNewImageBuffer = new BYTE [uNewImageSize];
_ASSERT(pNewImageBuffer);
if (!pNewImageBuffer)
  return false;
The analyzer's diagnostic message: V668 There is no sense in testing the 'pNewImageBuffer' pointer against null, as the memory was allocated using the 'new' operator. The exception will be generated in the case of memory allocation error. diskimagehelper.cpp 197
_ASSERT and the check can and should be removed - they just make no sense here.
A few other similar issues:
A few data types in this project are user-defined:
typedef unsigned long ULONG;
typedef void *LPVOID;
typedef unsigned int UINT;
There is no apparent error here. So let's treat this code as "smelling" and suppress the warnings with the help of the //-V677 comment.
There is the CConfigNeedingRestart class where the = operator is declared but a copy constructor is missing, which violates the "Law of the Big Two".
The class is pretty lengthy, so I won't cite it here. Just take my word for it.
All the fields of this class are primary types, so it doesn't need a = operator of its own at all. The class will be successfully copied automatically.
It's the same with the Disk_t class - in both cases we can remove the = operator.
The analyzer's diagnostic messages:
int nHeight=nHeight=g_aFontConfig[ FONT_CONSOLE ]._nFontHeight;The analyzer's diagnostic message: V700 Consider inspecting the 'T foo = foo = ...' expression. It is odd that variable is initialized through itself. debugger_display.cpp 1226
It's just a typo. I've changed it to:
int nHeight = g_aFontConfig[ FONT_CONSOLE ]._nFontHeight;The 'AppMode_e' enumeration includes the following named constants: MODE_LOGO, MODE_PAUSED, MODE_RUNNING, MODE_DEBUG, MODE_STEPPING.
The analyzer is worried about not all them being used in this switch():
switch (g_nAppMode)
{
  case MODE_PAUSED  : _tcscat(.....); break;
  case MODE_STEPPING: _tcscat(.....); break;
}
The analyzer's diagnostic message: V719 The switch statement does not cover all values of the 'AppMode_e' enum: MODE_DEBUG, MODE_LOGO, MODE_RUNNING. frame.cpp 217
As for this code, I'm feeling somewhat ashamed of the analyzer, frankly. It's just that its empirical algorithms failed us. This message is a false positive, and there are a number of ways to eliminate it. For example, we can add the "default" branch in the code.
switch (g_nAppMode)
{
  case MODE_PAUSED  : _tcscat(.....); break;
  case MODE_STEPPING: _tcscat(.....); break;
  default: break;
}
Another similar false positive: V719 The switch statement does not cover all values of the 'AppMode_e' enum: MODE_DEBUG, MODE_LOGO. frame.cpp 1210
We do not recommend (at least at start) checking the 3-rd level at all. There are too many false or uninteresting or specific messages there. And that's just the case with this project.
For instance, there are pretty many V601 warnings in this code.
inline int IsDebugBreakpointHit()
{
  if ( !g_bDebugNormalSpeedBreakpoints )
    return false;
  return _IsDebugBreakpointHit();
}
The analyzer's diagnostic message: V601 The 'false' value is implicitly cast to the integer type. debug.h 210
The function returns the 'int' type, while there is a line "return false".
The analyzer is right to pick on this code but in practice there are hardly any bugs to find in fragments like that. That's why we put this warning in the Level 3 group.
And here's an example of a specific diagnostic:
double g_fClksPerSpkrSample;
....
if ((double)g_nRemainderBufferSize != g_fClksPerSpkrSample)
The analyzer's diagnostic message: V550 An odd precise comparison. It's probably better to use a comparison with defined precision: fabs(A - B) > Epsilon. speaker.cpp 197
Whether or not this code is correct depends on the application and the values stored in the variables of the 'double' type.
Some users enjoy this diagnostic very much; others argue that they use double to store integer values and are very much aware of what they are doing when comparing them. Well, you just can't please everybody.
Now that we have fixed all the messages (of Levels 1 and 2), we can relaunch the analyzer. The result is an expected one - all the warnings are gone (see Figure 6).
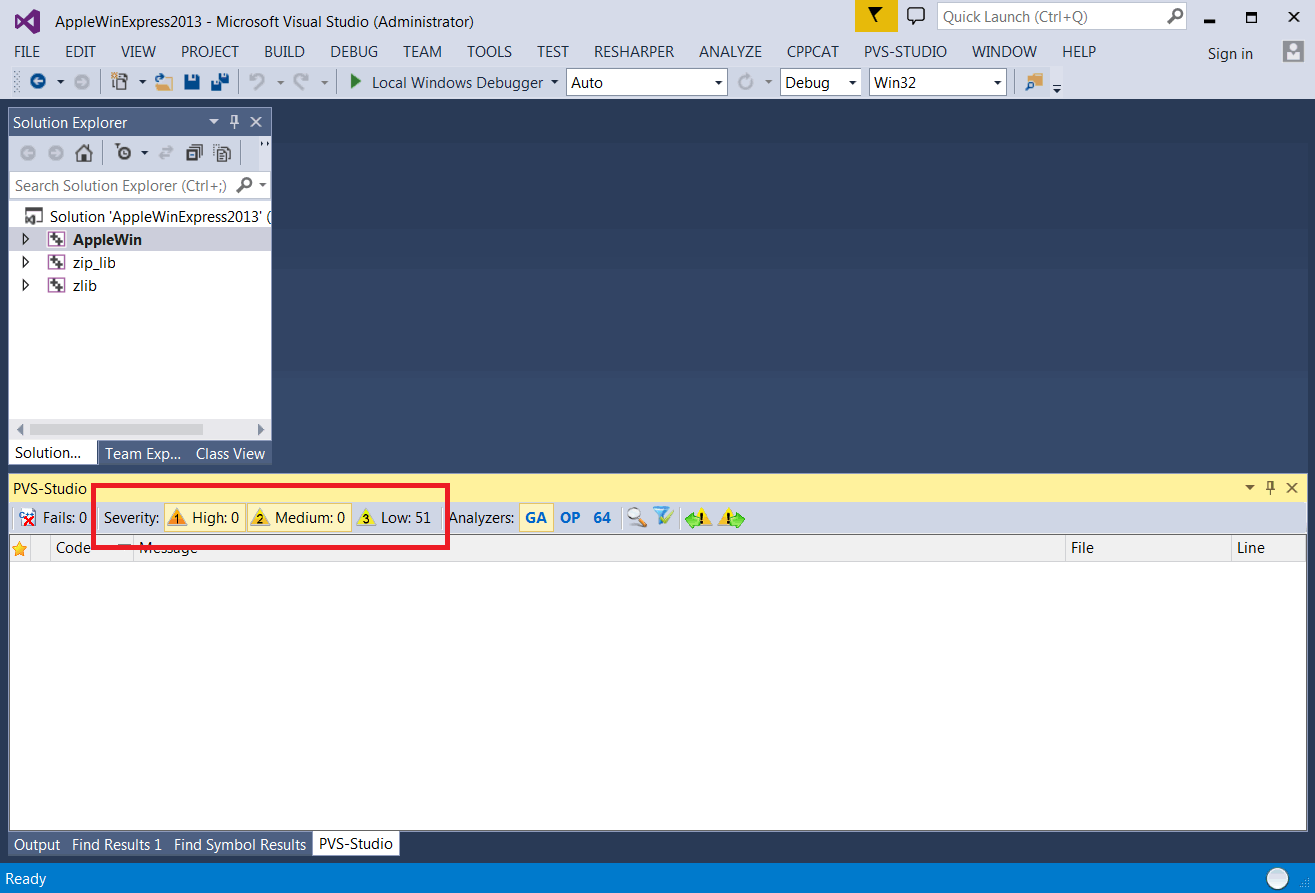
Figure 6. There are no more warnings of the 1-st and 2-nd levels.
This is an ideal approach that can only be applied to small projects. Nevertheless, I hope that I have managed to convince you that there's nothing extremely difficult about managing analyzer diagnostic messages. Although some of them proved to be false positives, we still haven't faced any troubles with them and have fixed them all.
People often ask us how many false positives our analyzer usually generates. We don't have an exact answer because gathering such statistics is very difficult and they won't make much sense anyway. The number of false positives varies greatly across different projects.
There is also a problem with data interpretation. For example, a badly written macro which is intensively used throughout an entire project may affect the statistics so that they show 20 times more false positives than genuine errors. It's not a problem, though. You just need to suppress the warnings in this macro, and the number of false positives will drop by 90% or so at once.
Another trouble about it has to do with the fact that programmers don't usually take into account that some warnings are difficult to put in a certain category. What such diagnostics reveal is not bugs but "smelling code". Such code should be fixed because even if it works well for now, it may fail in the future. In this article, I've shown you a few examples of these diagnostics.
Programmers, however, are inclined to binary logic and insist on getting a precise answer to the question: "Is this a false positive? Yes or No?" If you have read this article carefully, then I hope you won't pose the question in such a categorical way.
As you can see, it's hard to speak about the number of false positives in general. But if we take a particular small project, then we can answer this question in relation to this project.
The statistics on diagnostic messages output by the PVS-Studio analyzer for the Apple II emulator for Windows project are the following:
The same in the percent form:
Welcome to try the PVS-Studio analyzer on your project. You can download the demo version here: http://www.viva64.com/en/pvs-studio/download/
And please tell your colleagues and friends about our static analyzer. I'll appreciate if you post your messages in twitter or any other news feed. Thank you!
P.S. To keep up with our new articles and news from the C/C++ world, follow me on twitter: https://twitter.com/Code_Analysis
Thank you all for reading!
0
0
0
0