
Our website uses cookies to enhance your browsing experience.


Earlier this year, we started doing something that we had felt uncertain about for a long time, namely porting PVS-Studio to Linux. In this article, I will tell you how we made the decision to create a product for Linux distributions after 10 years of the Windows version's existence. It's a big job, which, unfortunately, involves much more work than simply compiling the source files for the new platform, as some may think.

In fact, the Linux version of the PVS-Studio console kernel has been ready for a long time, about three years now. Why did we never show it to the public then? You see, developing a software product, even based on an already existing one, is a huge job that takes lots of human-hours and involves tons of unexpected problems and details to deal with. We already knew it then and this task was yet to be done, so there was no official support of the Linux version.
As an author of a number of articles about project checks, I, unlike my colleagues, would often find inspiration in software designed for Linux. This environment is abundant in large and interesting open-source projects that are extremely hard, if possible at all, to build under Windows. It is actually the need to be able to check such projects that has driven the development of PVS-Studio for Linux.
It took our small team a couple of months to port the PVS-Studio kernel's code to Linux. Replacing a few system calls and debugging on Chromium project enabled us to make a decent console application. We put this version on regular night builds and ran it through the Clang Static Analyzer. Thanks to regular checks of open-source projects and build management, the analyzer did fairly well for several years and would even feel quite ready for release at times. However, you don't know yet what tricks I had to use to be able to analyze projects with that version...

Before we continue with our tool's development history, I'd like to talk about the static analysis technology as such. It will also be an answer to possible questions like, "Why use third-party tools when you can write bugless code right away and do peer code review?" This question is asked sadly often.
Static code analysis helps find errors and defects in software's source code. Whatever particular tools you are using, this is a great technique for managing the quality of your code under development. If possible, combine different static analysis tools: it can help a lot.
Some of our readers, users, and conference guests believe that peer code review is an ample means for detecting bugs at the early coding stage. Sure, such "inspections" do help find some bugs, but we all have been talking about the same thing all this time. Static analysis can be treated as automated code review. Think of a static analyzer as one of your colleagues, a virtual robot expert who doesn't get tired and takes part in every code review, pointing out fragments to be examined. Isn't it helpful?!
Many industry areas use automation to exclude so called human factor, and code quality management is no exception. We are not forcing you to give up manual code review if this is what you normally do. It's just that a static analyzer can help find even more bugs at the earliest stage possible.
Another important thing is that static analyzers don't get tired or lazy. Programmers make different kinds of mistakes in the code. What about typos? They don't catch your eye easily. Syntax mistakes? The ability to recognize them greatly depends on the reviewer's skill. Modern code sizes make the situation even worse. Many functions don't fit even widescreen displays. When context is lacking, the reviewer's attention weakens. A person grows tired after 15 minutes of closely reading program code, and it gets worse as you go on. It's no surprise that automatic analysis tools have become so popular and grow even more popular every year.

Our product has always attracted the interest of people who deal with software development one way or another. These are Windows users, who could try the tool right away, programmers working with other platforms and languages, and non-programmers at all. Such interest is natural, as many programming mistakes are common in a large variety of languages.
Linux users showed much persistence in asking us for a Linux version all these years. Their questions and arguments can all be summarized as follows:
The remaining part of the story will show the contradiction between their statements and expectations multiple times.

I talked with some people from large commercial projects and discovered that many developers don't know how projects are built and actually don't always need deep knowledge of that process. Every developer knows how to build/debug their project/module, but this knowledge is usually reduced to just a few magical commands. Figuratively speaking, there is a large button that they just need to press to have their modules built, but they have only a general understanding of the actual mechanics behind this process. As for the build scripts, there is usually a special person assigned to manage them.
In such cases, you need a tool to check your project without integrating with build systems, if only to get started with the analyzer.
The Linux version actually appeared after we introduced a compiler monitoring system in PVS-Studio's Windows version, which gave us a tool to check any project designed for that platform. As we found later, there were quite a lot of serious projects there built with the Microsoft compiler but lacking a Visual Studio solution. Thanks to this feature, we could tell you about the analysis results for such projects as Qt, Firefox, and CryEngine5, and even work for Epic Games on fixing bugs in their code. Our research showed that you only needed to know such information about the compiler as the working directory, command line parameters, and environment variables to be able to call to the preprocessor and run the analysis.
As I was planning on checking Linux projects, I knew from the very beginning that I would not be able to figure out the specifics of integrating the analyzer with every particular project, so I made a similar monitoring system for ProcFS (/proc/id's). I took the PVS-Studio code from the Windows plugin and ran it in mono to analyze the files. We were using this method for several years with various projects, the largest of which were the Linux kernel and FreeBSD. Although it was a long established procedure, it by no means was appropriate for commercial use. The product was not ready yet.

Once we decided to implement this feature, we started making prototypes and choosing among them.
There are different software testing procedures. The most effective technique for testing the analyzer and its diagnostic rules is to run tests on a large code base of open-source projects. We started with about 30 large projects. I mentioned earlier that the Linux version had existed for a few years by then and we had regularly used it to check projects. Everything seemed to work well, but it was not until we launched full-fledged testing that we saw how incomplete and imperfect the analyzer was. Before the analysis can be run, the source code needs to be parsed for the analyzer to find the necessary constructs. Even though unparsed code doesn't affect the analysis quality too much, it's still an unpleasant drawback. Every compiler has non-standard extensions, but we supported all such extensions in MS Visual C/C++ years ago, while in GCC we had to start almost from scratch. Why 'almost'? Because we have had support for GCC (MinGW) under Windows for a long time, but it's not common there, so neither we nor our users had any trouble using it.

In this section, we'll talk about code constructs that, hopefully, you won't see anywhere else: constructs that use GCC extensions. Why would we need these? They are hardly used in most cross-platform projects, aren't they? Well, it turns out that programmers do use them. We came upon the code that made use of extensions when developing a testing system for Linux projects. Where things get most complicated, though, is the parsing of the standard library's code: this is where the extensions are used in full. You can never be sure about the preprocessed files of your project: for the sake of optimization, the compiler might turn a regular memset function into a macro with a statement expression. But first things first. What new constructs did we learn about when checking projects under Linux?
One of the first extensions we saw was designated initializers. These allow you to initialize an array in an arbitrary order. It is especially convenient if the array is indexed as enum: you explicitly specify the index, thus making the code easier to read and making mistakes less likely to appear when modifying it later. It looks very nice and neat:
enum Enum {
  A,
  B,
  C
};

int array[] = {
  [A] = 10,
  [B] = 20,
  [C] = 30,
}
Now let's make it more intricate:
enum Enum {
  A,
  B,
  C
};

struct Struct {
    int d[3];
};

struct Struct array2[50][50] = {
    [A][42].d[2] = 4
};
That is, this construct can be initialized by any sequence of indexes and calls to the structure members. A range can also be used as an index:
int array[] = {
  [0 ... 99] = 0,
  [100 ... 199] = 10,
}
One small, but very useful from the security viewpoint, GCC extension deals with null pointers. We discussed the problem of using NULL quite a lot, so I won't repeat myself. It's somewhat better in GCC, as NULL is declared as __null in C++, and GCC prevents us from shooting ourselves in the foot like this:
int foo(int *a);
int foo(int a);

void test() {
    int a = foo(NULL);
}
An attempt to compile this code results in the following error:
test.c: In function 'void test()':
test.c:20:21: error: call of overloaded 'foo(NULL)' is ambiguous
     int a = foo(NULL);
                     ^
test.c:10:5: note: candidate: int foo(int*)
 int foo(int *a) {
     ^
test.c:14:5: note: candidate: int foo(int)
 int foo(int a) {
GCC allows you to specify attributes __attribute__(()). There is a large list of attributes for functions, variables, and types to manage linking, alignment, optimizations, and many other features. There is one interesting attribute, transparent_union. If you pass such a union as a function parameter, you will be able to pass not only the union itself, but also the pointers from this enumeration, as arguments. The following code will be correct:
typedef union {
    long *d;
    char *ch;
    int  *i;
} Union __attribute((transparent_union));

void foo(Union arg);

void test() {
    long d;
    char ch;
    int i;

    foo(&d);  //ok
    foo(&ch); //ok
    foo(&i);  //ok
}
The wait function is an example that makes use of transparent_union: it can take both int* and union wait* as arguments. This is done for the sake of compatibility with POSIX and 4.1BSD.
You must have heard about the GCC built-in functions. In these functions, you can use variables declared earlier than the functions themselves. A built-in function can also be passed by pointer (although it's obviously not a good idea to call it using the same pointer after the called function has returned).
int foo(int k, int b, int x1, int x2) {
    int bar(int x) {
        return k * x + b;
    }
    return bar(x2) - bar(x1);
}

void test() {
    printf("%d\n", foo(3, 4, 1, 10)); //205
}
Now, have you ever heard that you can use goto in such functions to jump to the "parent function"? It looks especially impressive when passing such a function to another at the same time.
int sum(int (*f)(int), int from, int to) {
    int s = 0;
    for (int i = from; i <= to; ++i) {
        s += f(i);
    }
    return s;
}

int foo(int k, int b, int x1, int x2) {
    __label__ fail;
    int bar(int x) {
        if (x >= 10)
            goto fail;
        return k * x + b;
    }
    return sum(bar, x1, x2);
fail:
    printf("Exceptions in my C?!\n");
    return 42;
}

void test() {
    printf("%d\n", foo(3, 4, 1, 10)); //42
}
In practice, though, code like that may have very unpleasant implications: exception safety is a too complex thing even for C++ with RAII, not to mention C. So, you'd better not do like that.
By the way, since we started talking about goto, in GCC you can save labels into pointers and use them to jump to the necessary code lines. Uniting them in an array provides a jump table:
int foo();
int test() {
    __label__ fail1, fail2, fail3;
    static void *errors[] = {&&fail1, &&fail2, &&fail3};
    int rc = foo();
    assert(rc >= 0 && rc < 3);
    if (rc != 0)
        goto *errors[rc];
    return 0;

fail1:
    printf("Fail 1");
    return 1;
fail2:
    printf("Fail 2");
    return 2;
fail3:
    printf("Fail 3");
    return 3;
}
And here's a small Clang extension. Even though PVS-Studio has long been friends with this compiler, it's wonderful that we still encounter new language and compiler constructs emerging there. For example:
void foo(int arr[static 10]);

void test()
{
    int a[9];
    foo(a); //warning

    int b[10];
    foo(b); //ok
}
This code tells the compiler to check if the passed array consists of 10 or more elements and output a warning if it's not so:
test.c:16:5: warning: array argument is too small; contains 9
      elements, callee requires at least 10 [-Warray-bounds]
    foo(a);
    ^   ~
test.c:8:14: note: callee declares array parameter as static here
void foo(int arr[static 10])
^ ~~~~~~~~~~~Once we have prepared a stable analyzer version, documentation, and a few methods of checking projects without integration, we launched a closed beta test.
When we started handing out the analyzer to the first testers, we discovered that the executable alone was not enough. Their responses ranged from "It's a wonderful tool; we've found lots of bugs!" to "I don't trust your app and I'm not installing it to /usr/bin!" Sadly, the latter were more common. The arguments of the forum members who claimed they would be OK with just the executable file proved to be exaggerated. Not everyone can or wishes to work with the analyzer in such a format. We needed some common means of Linux software distribution.
After the first responses, we stopped the test and dove into hard work for about 2 weeks. Testing on third-party code revealed even more problems with compilers. Since GCC is used as a basis to build compilers and cross compilers for various platforms, people started testing our analyzer on every possible kind of software, even firmware of various devices. It generally managed to deal with those tasks, and we did receive positive feedback, but it had to skip some code fragments because of the extensions that we had to support.
False positives are inherent in any static analyzer, but their number has somewhat grown in the Linux version, so we got down to adjusting the diagnostics to the new platform and compilers.
The development of Deb/Rpm packages was a big improvement. Once we made them, all complaints about PVS-Studio installation ceased. There was probably only one person who didn't like using sudo to install the package, although almost all software is installed that way.
We also paused for a while to make the following improvements:
During the last stage of the test, the users no longer had any trouble installing, running, and setting up the analyzer. We were receiving positive feedback, examples of real bugs found by the tool, and examples of false positives.
The testers also showed more interest in the analyzer's advanced settings, which forced us to expand the documentation with an explanation of how to integrate the analyzer with Makefile/CMake/QMake/QtCreator/CLion. These methods are discussed below.
Although projects can be conveniently checked without integration, integrating the analyzer with build systems does have a few advantages:
When called at the same point as the compiler, the analyzer has a correctly set-up environment, working directory, and all the parameters. That way, you have all the necessary conditions fulfilled to ensure correct and high-quality analysis.
This is how PVS-Studio is integrated with Makefile:
.cpp.o:
  $(CXX) $(CFLAGS) $(DFLAGS) $(INCLUDES) $< -o $@
  pvs-studio --cfg $(CFG_PATH) --source-file $< --language C++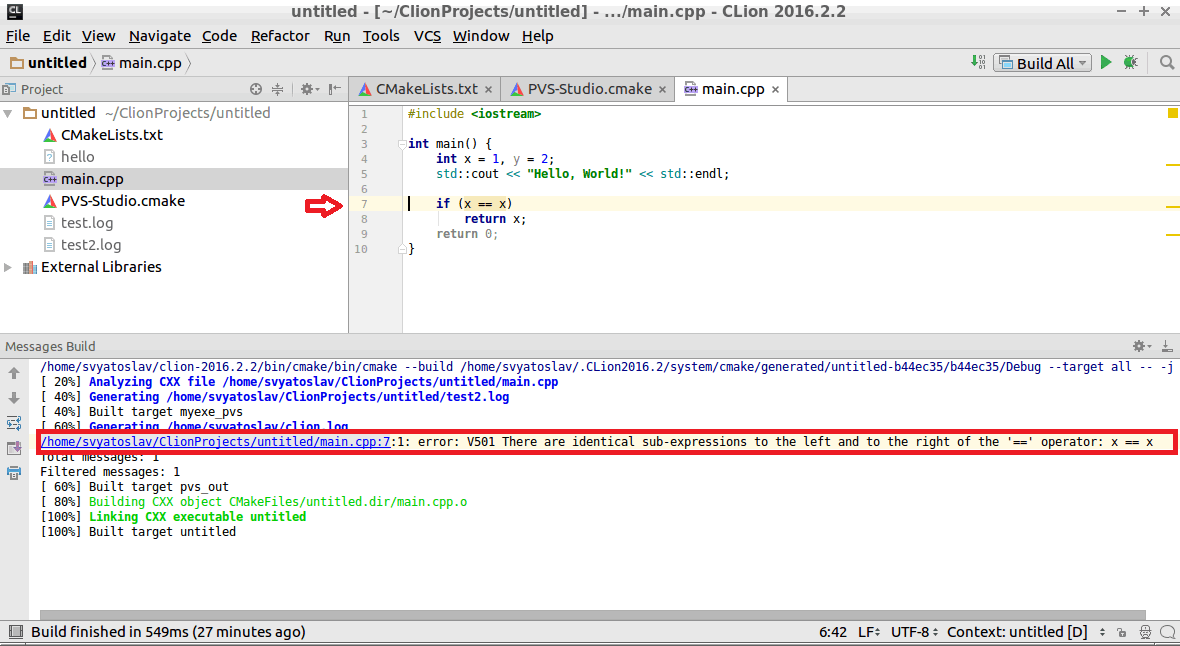
--cl-params $(CFLAGS) $(DFLAGS) $(INCLUDES) $<Knowing the specifics of integration with CMake allowed us to find a way to use PVS-Studio with CLion as well. You can set the analyzer to both generate a log file and display the warnings in the IDE.
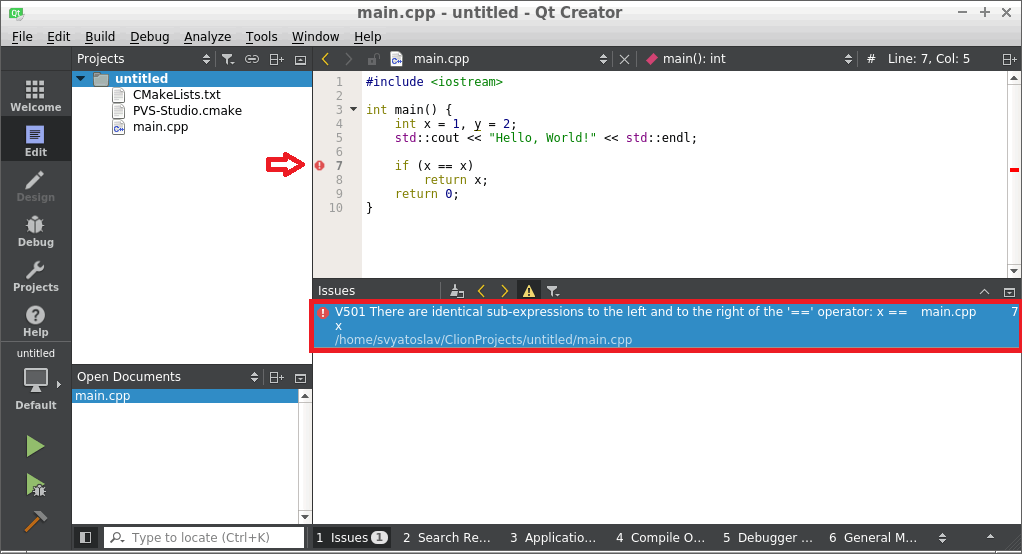
You can also work with CMake projects in QtCreator, saving the log or viewing the warnings directly in the IDE. Unlike CLion, QtCreator supports the TaskList format.
We also found an easy way to integrate with QMake projects:
pvs_studio.target = pvs
pvs_studio.output = true
pvs_studio.license = /path/to/PVS-Studio.lic
pvs_studio.cxxflags = -std=c++14
pvs_studio.sources = $${SOURCES}
include(PVS-Studio.pri)This is what we have achieved during the development:
A tool like that is good enough to start selling it, which we did.
Welcome to download the analyzer and try it on your projects. Follow us and give your suggestions of open-source projects for us to check, now including those running under Linux!
0
0
0
0