
Our website uses cookies to enhance your browsing experience.

We have added an option allowing you to experiment with the PVS-Studio static analyzer on the godbolt.org (Compiler Explorer) website. It supports analysis of C and C++ code. We believe this to be an enjoyable and super-easy way to explore results produced by the analyzer when run on different example snippets of code. At the same time, we are concerned that programmers may feel tempted to evaluate the analyzer's abilities based on how it handles synthetic examples without running it on real code. Let's try to figure out why relying on synthetic examples to evaluate tools is a bad approach.
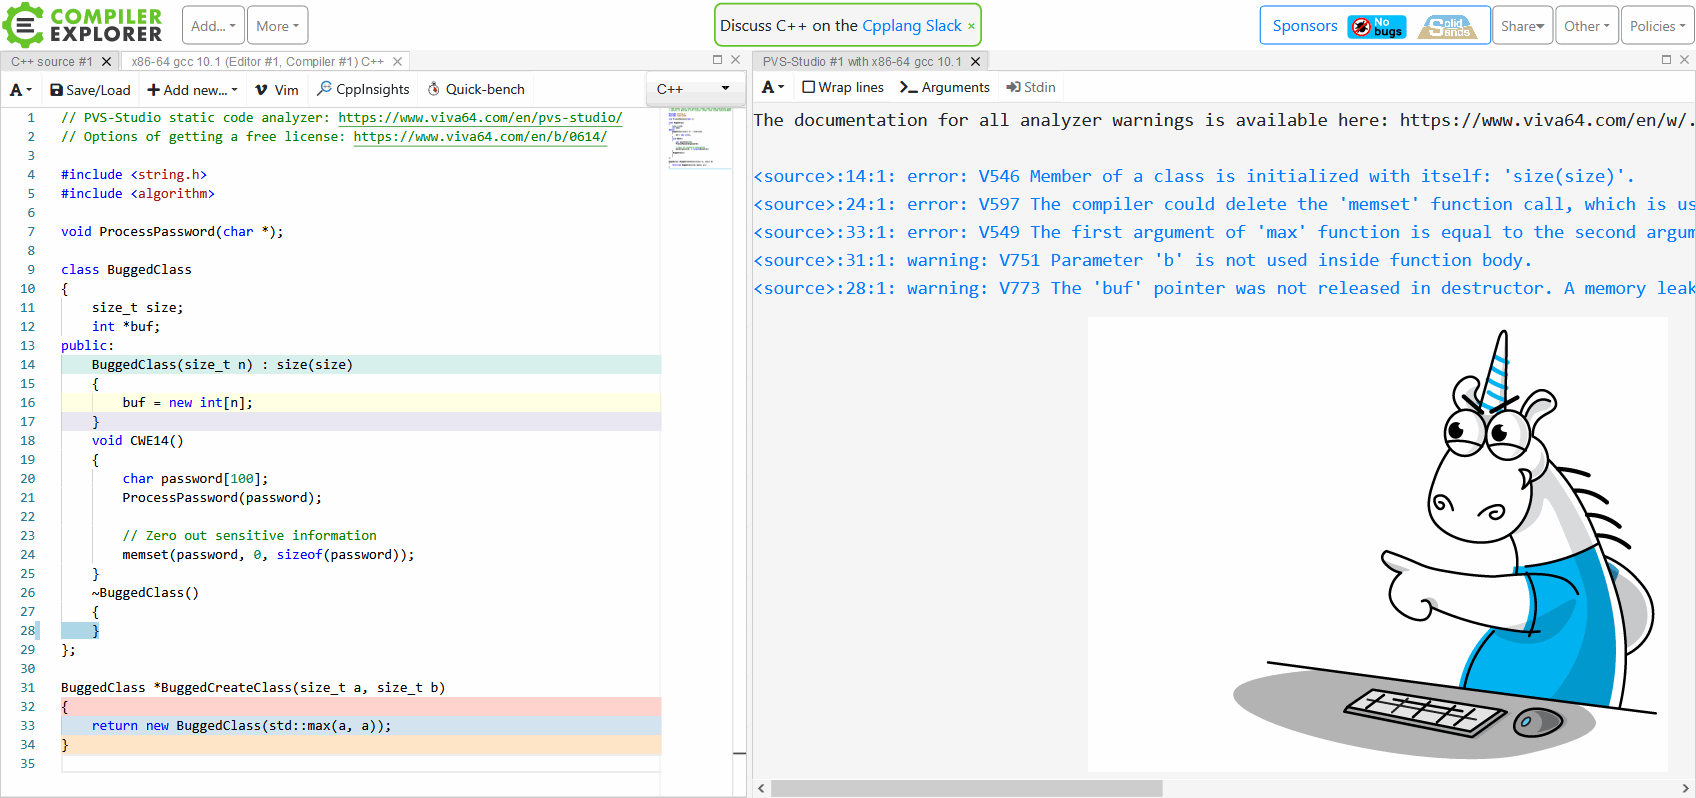
Compiler Explorer is an interactive tool that lets you type code in one window and see the results of its compilation in another window.
PVS-Studio is a tool for detecting bugs and potential vulnerabilities in the source code of programs written in C, C++, C#, and Java.
We have made these two tools friends so that you could run a quick check and see whether PVS-Studio can detect a certain bug in source code. All you need to do is:
Now you can check your code by simply entering it in a window on the site. All versions of GCC and Clang compilers for x86 and x64 platforms are currently supported.
This may be promising from the perspective of satisfying one's curiosity, writing articles, and so on. But there's a downside to it too: rather than using synthetic examples to explore or try out the tool, people may start relying on them to evaluate and compare it against other analyzers. And this is a very bad approach because the results will be unreliable and dependent on how the test examples are written.
Our team has been facing this problem for quite a while. Back in 2017, I wrote an article "Why I dislike synthetic tests". Do read it – it won't take long. In this post, I'd like to share some more examples.
The first thing you may want to find out is whether PVS-Studio can detect a memory leak. I just know from experience that for some reason this test is programmers' favorite :). The test example is very likely to be written as follows:
int main()
{
  int *p = new int;
  *p = 1;
  return 1;
}
Yes, PVS-Studio can detect memory leaks. But it will keep silent on this particular example.
The reason might be unclear to you and there's a risk that you will draw the wrong conclusions. The problem here is that it's particularly common with developers not to free memory in the main function. The tendency is so strong that we decided to make this case an exception. There's actually nothing bad about not freeing memory in main. When it terminates, the memory will be freed anyway.
Sure, technically it's still a bug. But this practice is so common that distracting people with warnings about it wouldn't be a reasonable idea. Actually, I recall some users asking us to turn off warnings triggered by leaks in main.
But change the name of the function – and the warning will appear.
int foo()
{
  int *p = new int;
  *p = 1;
  return 1;
}
On this code, the analyzer will issue the warning as expected: <source>:5:1: error: V773 The function was exited without releasing the 'p' pointer. A memory leak is possible.
Here's another example with the main function. Let's make an infinite loop in it:
int main()
{
  unsigned i = 0;
  while (1)
  {
      i++;
  }
  return 1;
}
The analyzer keeps silent. Doesn't it see this suspicious infinite loop? Yes, it does. It's just that this pattern is very common too. It's typically found in the code of microcontroller firmware. Almost all such programs use infinite loops doing something. There's no reason for the main function to exit in such cases and it never does. There's actually nowhere to exit to :).
Again, just change the name of the function, and the analyzer will issue the expected warning.
int foo()
{
  unsigned i = 0;
  while (1)
  {
      i++;
  }
  return 1;
}
Here, it says: <source>:4:1: note: V776 Potentially infinite loop.
Any static analyzer is about maintaining a fragile balance between an infinite number of nearly useless warnings and the risk of failing to inform the developer about a real bug. Now it should be clear why code analyzers are so sensitive to the way test examples are written. You must be particularly careful when making synthetic examples. And twice that when comparing static analysis tools based on such small tests. This is just not the right thing to do.
If you want to have a better understanding of our philosophy behind the choice of diagnostics to implement and false positives to eliminate, see these two articles:
The best way to try the analyzer and see what it's worth is to run it on your own real-life project. Simply download and run PVS-Studio. By the way, open-source developers can get a free license.
Now that we have warned you, feel free to go ahead and play with the analyzer. Just be careful about the conclusions you draw.
Here are two links to make it easier for you and save you time looking for a button that starts a check. Just modify the code as you like and watch the results:
Thanks for reading!
0
0
0
0