
Our website uses cookies to enhance your browsing experience.

For some people, the introduction of a static analyzer into a project seems like an insurmountable obstacle. It is widely believed that the amount of analysis results issued after the first run is so large that only two options seem reasonable: do not mess with it at all or refocus all people on fixing warnings. In this article, we will try to dispel this myth by implementing and configuring the analyzer on a GTK project.
GTK is a cross-platform library of interface elements. Recently, GTK 4 was released, which was a great news hook to check the quality of the project's code using the PVS-Studio static code analyzer. We do this regularly, and we often have to set up the analyzer from scratch on many projects before investigating the code quality. In this post, I will share my experience of a quick PVS-Studio setting up on a C++ project.
We get our first analyzer report and see the following results for general-purpose diagnostics:
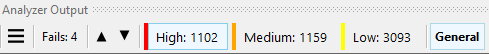
4 (Fails) + 1102 (High) + 1159 (Medium) + 3093 (Low) = 5358 warnings.
Then we quickly scroll through the report, identify spikes of uninteresting warnings, and make a decision for further configuration of the analyzer.
Let's look at this warning:
V530 [CWE-252] The return value of function 'g_strrstr_len' is required to be utilized. strfuncs.c 1803
/* Testing functions bounds */
static void
test_bounds (void)
{
  ....
  g_strrstr_len (string, 10000, "BUGS");
  g_strrstr_len (string, 10000, "B");
  g_strrstr_len (string, 10000, ".");
  g_strrstr_len (string, 10000, "");
  ....
}
This is the code of tests that do not directly relate to GTK, so we make a list of directories to exclude from the analysis and rerun PVS-Studio.
In the run, the following directories will be excluded from the analysis:
gtk/_build/
gtk/subprojects/
gtk/tests/
gtk/testsuite/
After that, I open the report and get the following result:
2 (Fails) + 819 (High) + 461 (Medium) + 1725 (Low) = 3007 warnings.
After such a setup we got another positive effect which is the speed up of the analysis.
Macros are probably one of the main reasons for a huge number of messages in some diagnostics. When looking through the report, we notice a lot of similar warnings:
V501 There are identical sub-expressions '* (& pipe->ref_count)' to the left and to the right of the '^' operator. gdkpipeiostream.c 65
static GdkIOPipe *
gdk_io_pipe_ref (GdkIOPipe *pipe)
{
  g_atomic_int_inc (&pipe->ref_count);

  return pipe;
}
Making changes to macros is usually the most difficult thing: someone is unlikely to hit the ground running and try to fix them immediately. At least not right away. Therefore, let's use the mechanism to disable diagnostics on macros. After quickly reviewing the report, we create the following settings file:
#V501
//-V:g_atomic_int_:501
#V547
//-V:GTK_IS_:547
//-V:GDK_IS_:547
//-V:G_IS_:547
//-V:G_VALUE_HOLDS:547
#V568
//-V:g_set_object:568
Just a few lines that cover most of the problematic macros for V501, V547, and V568.
Look at the result:
2 (Fails) + 773 (High) + 417 (Medium) + 1725 (Low) = 2917 warnings.
Some diagnostics initially issue unsuitable warnings for a specific project. Let's look at the V1042 warning:
V1042 [CWE-1177] This file is marked with copyleft license, which requires you to open the derived source code. main.c 12
This is a very useful diagnostic for a closed project, so as not to accidentally include code that follows specific license restrictions which may not be applicable for the project. But for GTK, this diagnostic is not of interest, so we will disable it and get an adjusted result:
2 (Fails) + 164 (High) + 417 (Medium) + 1725 (Low) = 2308 warnings.
There are 2 warnings of the Fails type in the project:
This diagnostic warns that warnings on these files may point to the wrong lines of the code. Usually the difference is 1-2 lines. This is due to an incorrect macro expansion by the compiler. In our experience, most often the MSVC compiler was spotted doing this.
We can simply ignore these warnings.
The result is as follows:
164 (High) + 417 (Medium) + 1725 (Low) = 2306 warnings.
For sure, there is still something to configure. However, I've already solved the task that I had set for myself. That is quickly get the analyzer report, in which I can easily find errors. For example, now there is only one V501 warning in the entire report and it is informative:
V501 There are identical sub-expressions 'G_PARAM_EXPLICIT_NOTIFY' to the left and to the right of the '|' operator. gtklistbase.c 1151
static void
gtk_list_base_class_init (GtkListBaseClass *klass)
{
  ....
  properties[PROP_ORIENTATION] =
    g_param_spec_enum ("orientation",
                       P_("Orientation"),
                       P_("The orientation of the orientable"),
                       GTK_TYPE_ORIENTATION,
                       GTK_ORIENTATION_VERTICAL,
                       G_PARAM_READWRITE |
                       G_PARAM_EXPLICIT_NOTIFY |  // <=
                       G_PARAM_EXPLICIT_NOTIFY);  // <=
  ....
}
This is a great result! Other diagnostics figures have also increased significantly. The analyzer report was reduced by as much as 57% using scanty settings. Accordingly, the correct /false warnings ratio has also increased significantly.
By the way, this is one of the reasons why there are no results comparisons of different code analyzers on the Internet. Because there is no consensus on whether to show the analyzer operation process as it is, or one still needs to carry out the initial configuration. All analyzers have their own mechanisms for this, which greatly complicates the complexity of the comparison task.
And now it's time to pass the baton to Andrey Karpov, my colleague.
Even this simple and fast results filtering described in this article makes it much easier to work with the report. For example, using this report, I was able to skim through it for one evening and write out code fragments with errors, in an amount enough for writing an article. This is what I'll be doing during New Year's holidays.
For sure, my task is simpler and differs from the process of configuring and implementing the analyzer in a real project. It is enough for me to rush through the list of warnings and track down obvious errors, ignoring false positives or incomprehensible warnings in complex sections of the code. In reality, it will take more time to set up the analyzer, pinpoint false positives, improve macros, and so on. But in fact, it's not that scary. For example, in the article on the EFL Core Libraries project check, I showed that you can easily configure the analyzer to give only 10-15% of false warnings. Agree, it's not bad when from 10 warnings you get 8-9 decent error messages and 1-2 false positives.
Well, don't forget that the mass suppression mechanism is always there for you. This allows you to start using the analyzer quickly, even in a large project. All warnings are considered as technical debt and are hidden so far. So, the team only deals with warnings related to new or modified code. Check out the article "How to introduce a static code analyzer in a legacy project and not to discourage the team" to find out more on this.
Thank you for your attention and come back in a couple of weeks to read the article about the errors found.
0
0
0
0