Using PVS-Studio with IntelliJ IDEA and Android Studio
- Installing the plugin from the official JetBrains repository
- Installing the plugin from the PVS-Studio repository
- Plugin settings
- Checking code with PVS-Studio from IntelliJ IDEA and Android Studio
- Managing analysis results
- PVS-Studio Java update
The PVS-Studio analyzer can be used with IntelliJ IDEA and Android Studio. The PVS-Studio plugin provides a convenient GUI for running analysis of projects and individual files. It also helps manage diagnostic warnings.
PVS-Studio plugins for IntelliJ IDEA and Android Studio can be installed from the official JetBrains plugin repository or from the repository on our website. You can also use the PVS-Studio installer for Windows, which is available on our download page.
Installing the plugin from the official JetBrains repository
To install the PVS-Studio plugin from the official JetBrains repository, open the settings window by 'File -> Settings -> Plugins', select the 'Marketplace' tab, and enter "PVS-Studio" in the search bar. The PVS-Studio plugin appears in the search results:
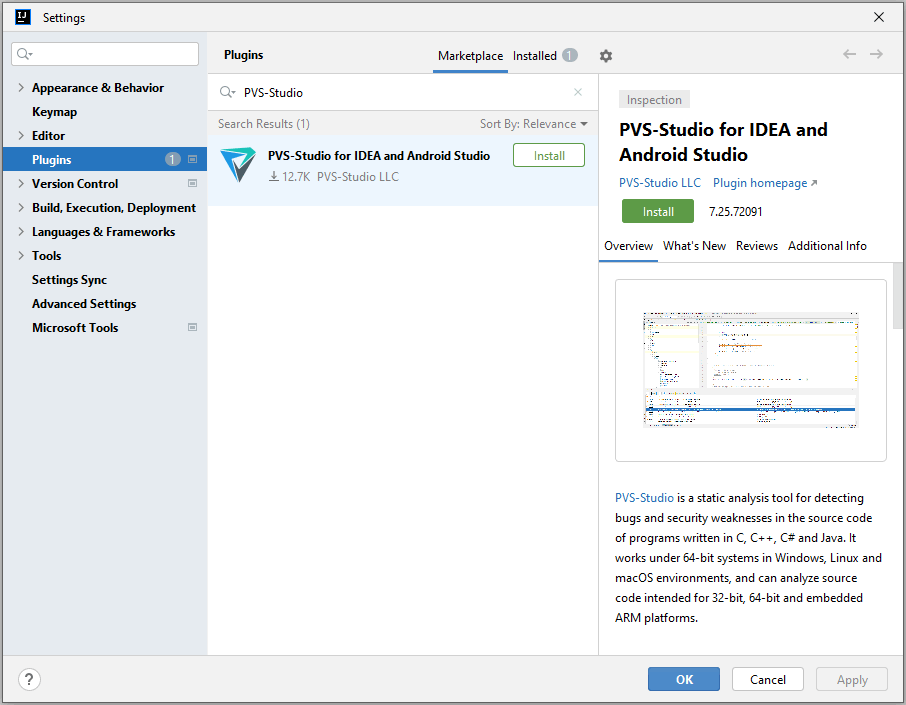
Click 'Install' next to the plugin name. After the installation, click 'Restart IDE'.
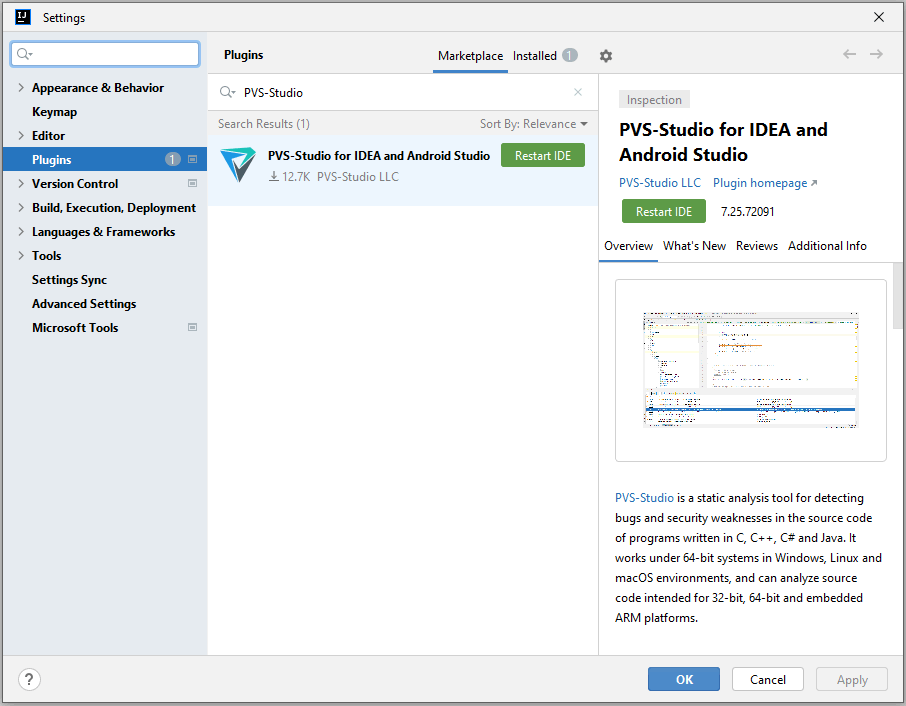
After restarting the IDE, you can use the PVS-Studio plugin to analyze your code.
Note: you don't need to download and install the Java analyzer core separately. The plugin will download and install the necessary version of core when you run the analysis in IntelliJ IDEA or Android Studio.
Installing the plugin from the PVS-Studio repository
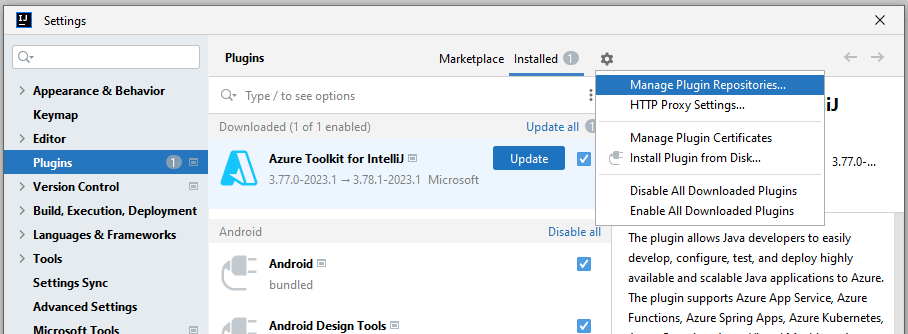
In addition to the official JetBrains repository, the PVS-Studio plugin is also available from the PVS-Studio repository. To install the plugin from there, you first need to add this repository to the IDE. To do this, click 'File -> Settings -> Plugins' to open the plugin installation window, click the gear icon in the top-right corner and select ˈManage Plugin Repositoriesˈ from the drop-down menu:
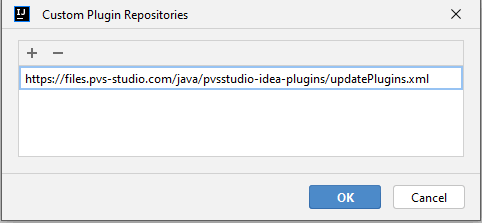
In the opened window, enter the path: http://files.pvs-studio.com/java/pvsstudio-rider-plugins/updatePlugins.xml; and click 'OK'.
The last step of installation remains unchanged from the previous scenario of installing the plugin from the official repository. Open the 'Marketplace' tab and enter "PVS-Studio" in the search bar. Select the plugin 'PVS-Studio for IDEA and Android Studio' in the search results, click 'Install', and restart the IDE.
Plugin settings
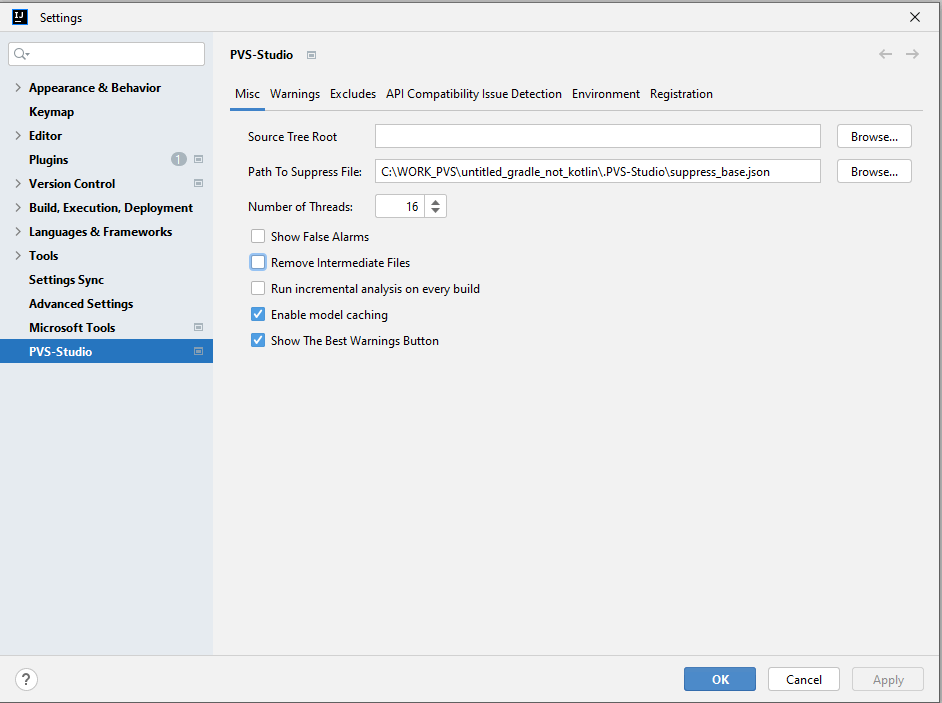
The 'Settings' window of the PVS-Studio plugin has multiple tabs. Let's discuss each tab in detail.
Misc contains settings of the PVS-Studio analyzer core. Hover your mouse the option name to see a pop-up tooltip for that option.
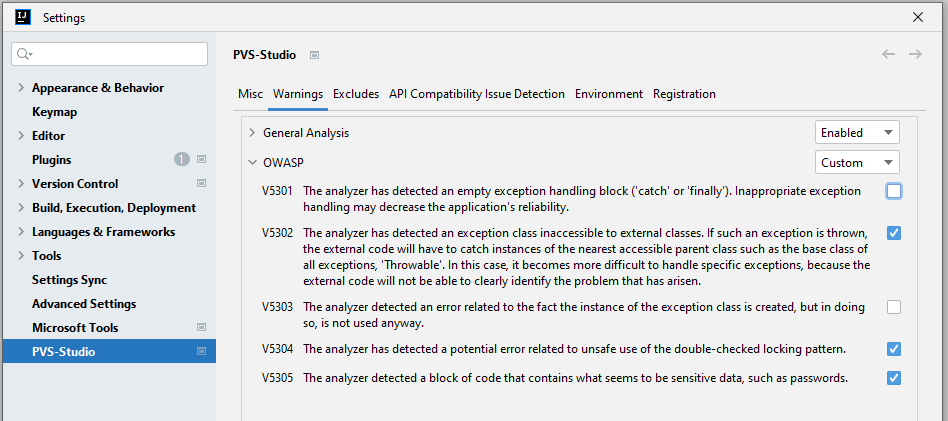
Warnings contains a list of all diagnostic rules supported by the analyzer. If you uncheck diagnostic rules, all warnings of the chosen type will be filtered out of the analyzer output window. During the next analysis run, the corresponding diagnostic rule will not be run (it will not generate any warnings):
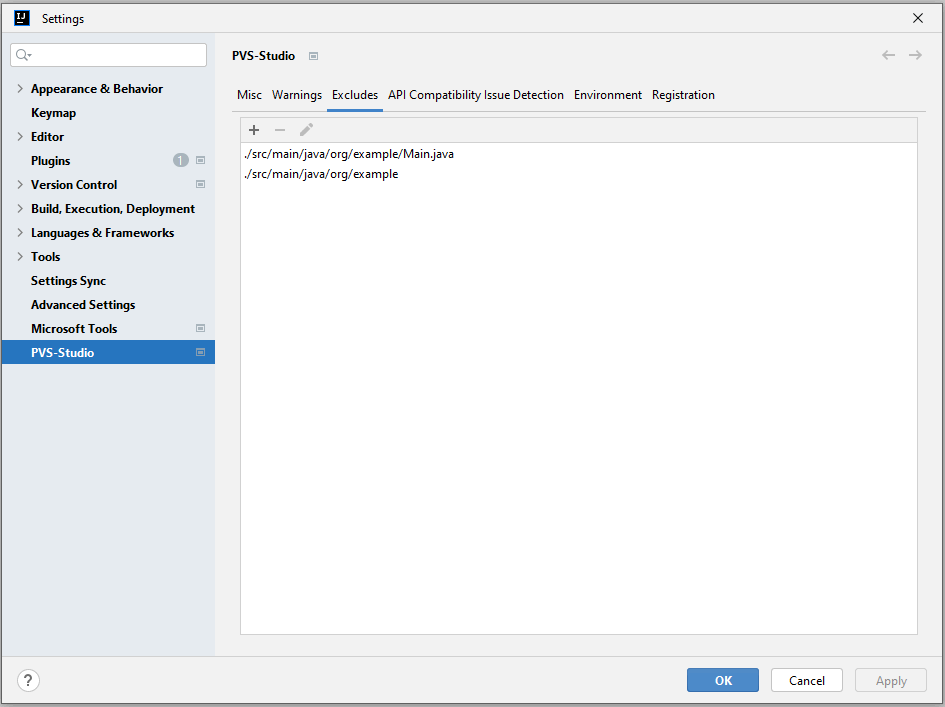
Excludes contains paths for files and directories that should be excluded from the analysis. You can set either an absolute path or a path relative to the root directory of the project:
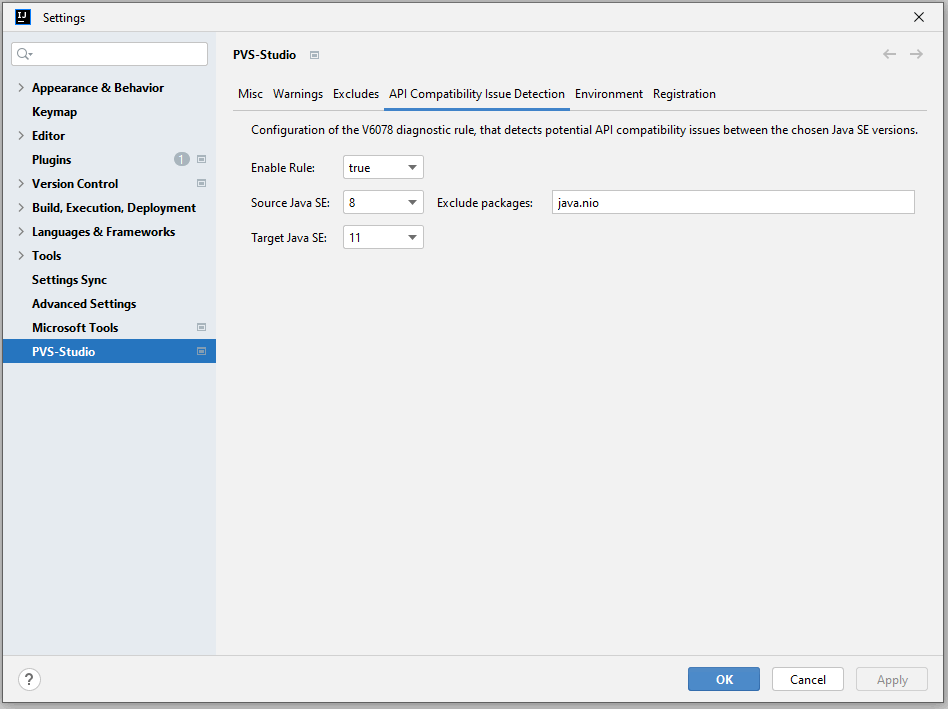
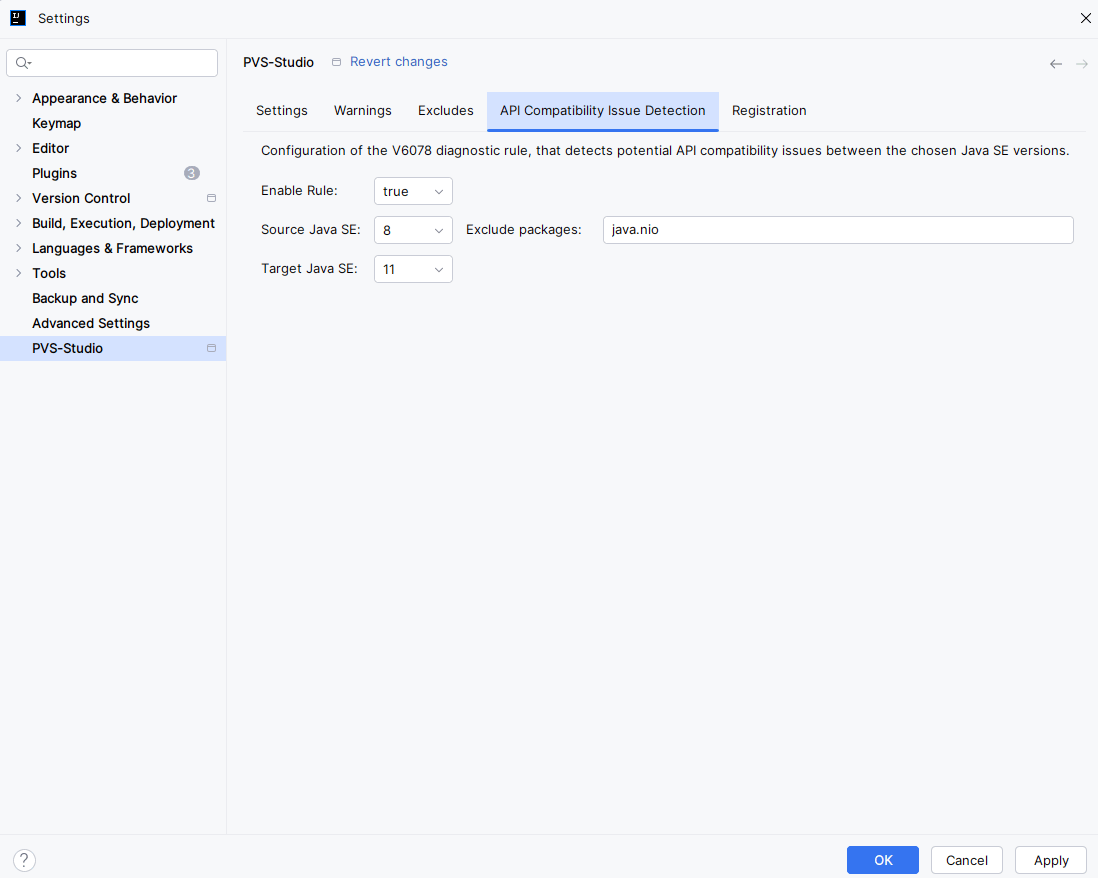
API Compatibility Issue Detection contains settings for the V6078 diagnostic (disabled by default). This diagnostic helps find out if the API JDK, used in your project, will change or disappear in upcoming JDK versions:
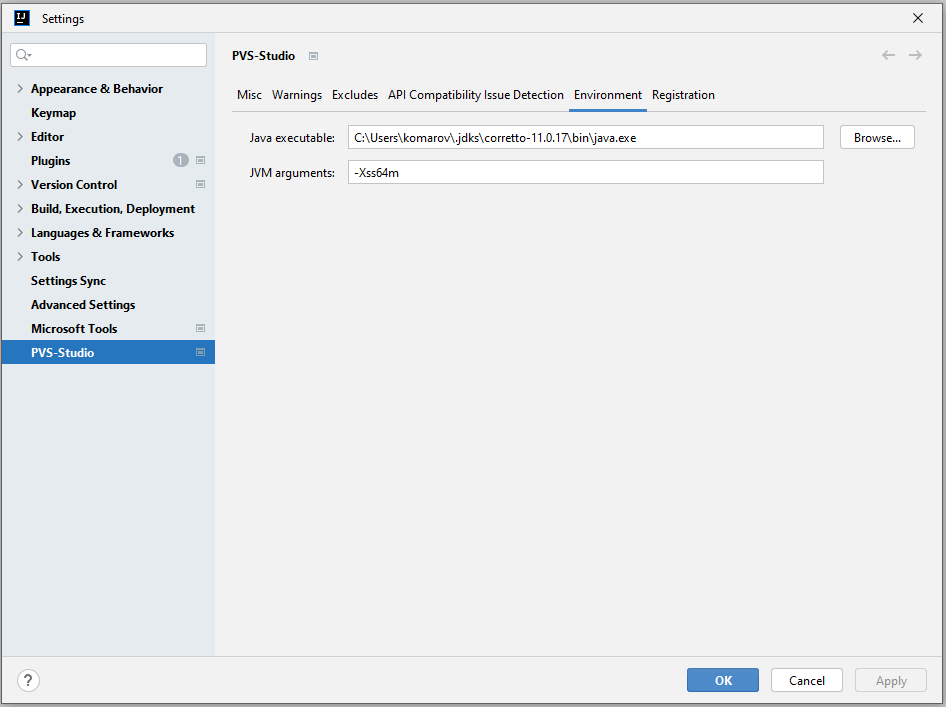
Environment contains settings that the plugin will use to run the Java analyzer core (separate JVM process pvs-studio.jar). The default values of these settings are taken from the global.json file. If you change the settings in this tab, they will be saved in a separate file. This file overrides the settings from global.json when running the analysis. The changed settings have no impact on the global.json file contents:
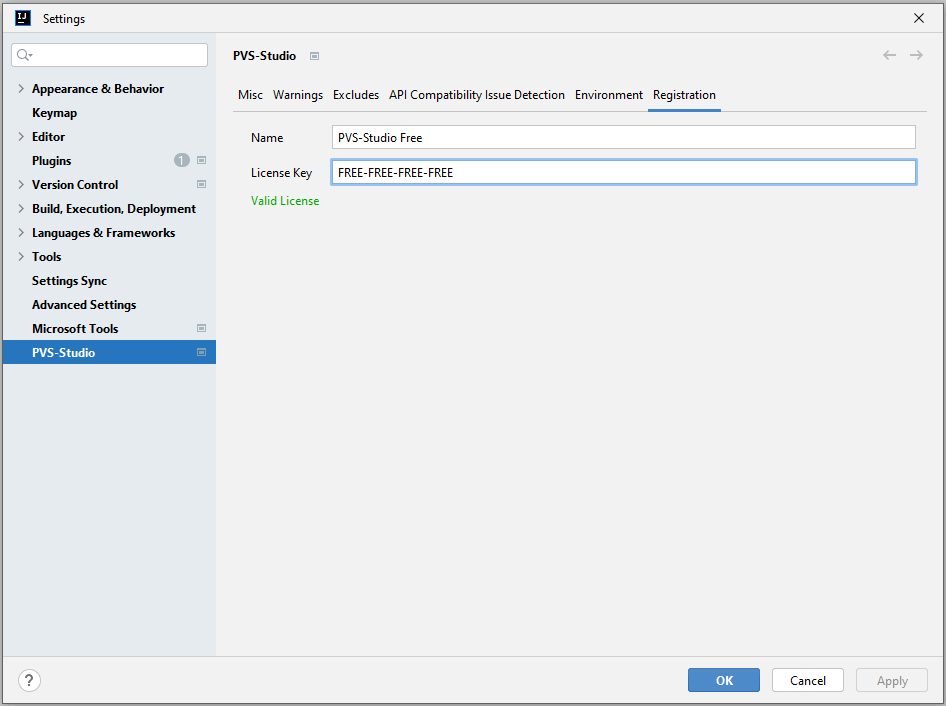
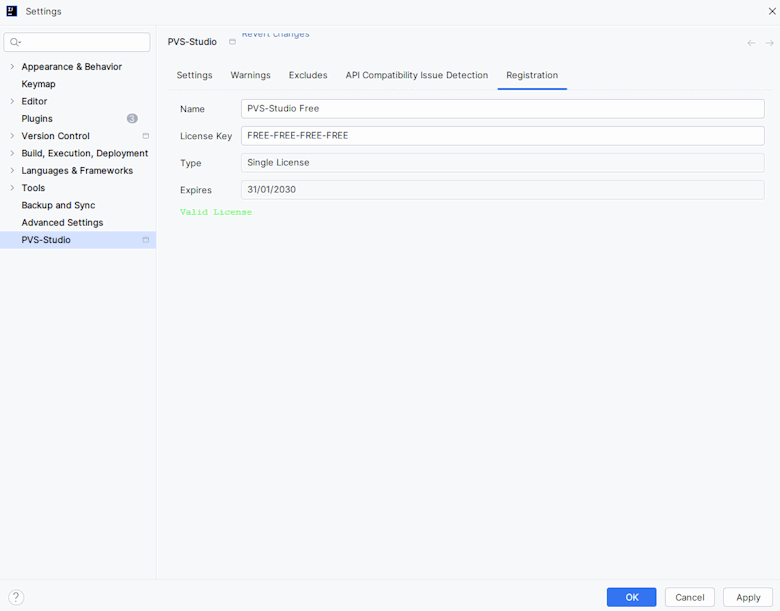
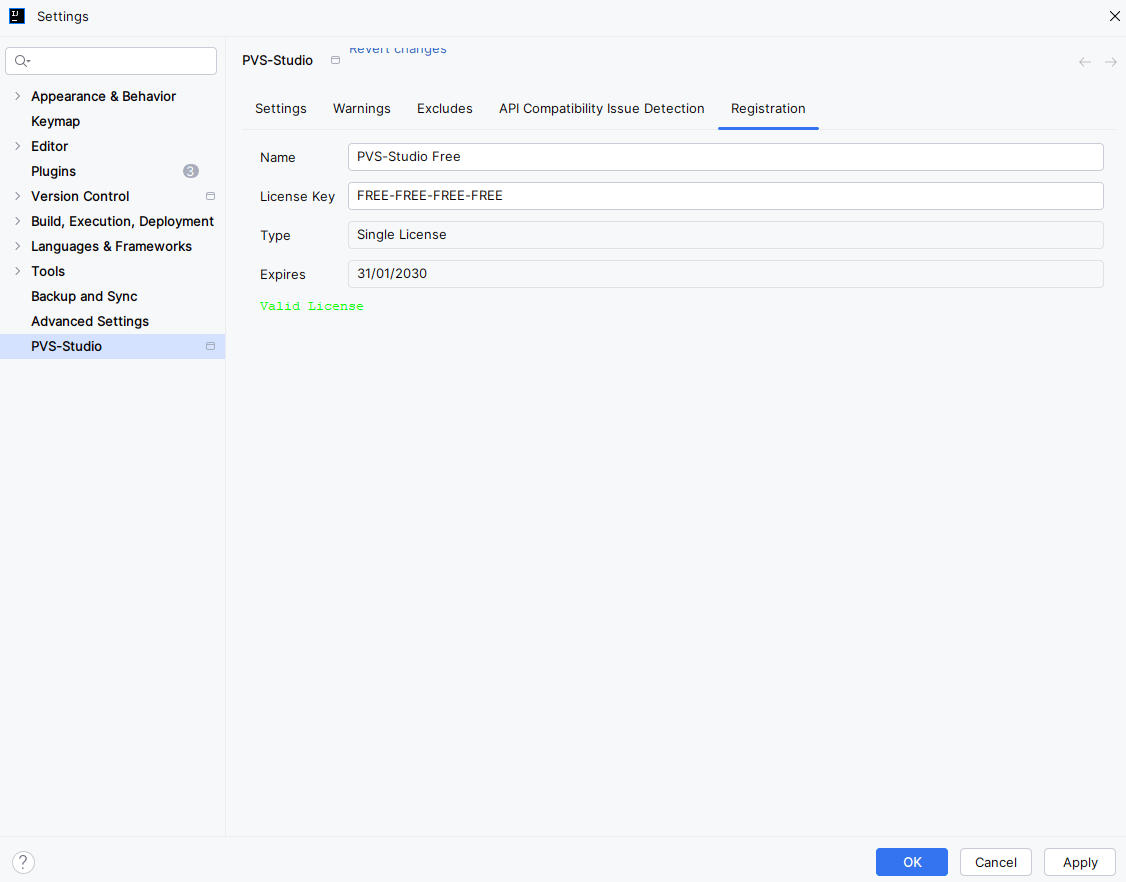
Registration displays information about the current PVS-Studio license in the system. You can also edit the information in this tab and ensure that the entered license is valid.
How to change the Java version to run the analyzer
By default, the analyzer runs the core with java from the PATH environment variable. To run the analysis with some other version, you can manually enter it. To do this, open the 'Environment' tab in the plugin settings and enter the path to the java file from the JDK in the 'Java executable' field. The analyzer uses this JDK version (the version of the Java language) during the analysis of project source code:
Checking code with PVS-Studio from IntelliJ IDEA and Android Studio
Before running the analysis, enter a license. To learn how to do this, please consult the documentation.
You can choose to check:
- current project;
- items selected in the 'Project' window;
- file currently opened in IDE.
Please note: when analyzing a project, the plugin starts the Java analyzer core. When the analyzer core is started, it uses the same Java language version as the JDK. The java file from the JDK is used to start the Java analyzer core (the Java executable field on the Environment tab of the plugin settings). If you want to change the Java language version to be used in the analysis, use the java file from the JDK for that version to run the Java analyzer core.
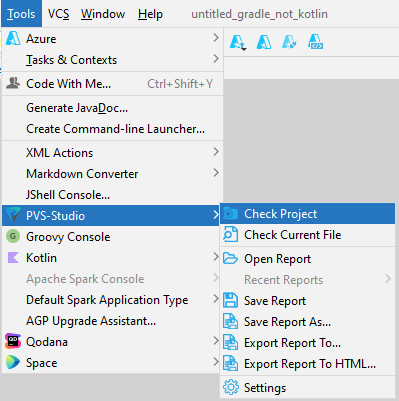
To analyze the current project, you can use 'Tools -> PVS-Studio -> Check Project'.
To analyze a file opened for editing, you can use:
- the 'Tools -> PVS-Studio -> Check Current File' menu item;
- the context menu item of the file;
- the context menu item of the file header in the file editor.
You can also select several items in the 'Explorer' window by holding down CTRL/SHIFT + Left Mouse Click. Then choose the 'Analyze with PVS-Studio' menu item:
In the examples above, we will analyze:
- *.java files (from the com.pvsstudio.formats package);
- the JsonEvaluator file (from the com.pvsstudio.projects package);
- the Main file (from the com.pvsstudio package);
- the Box file from the common module (from the com.pvsstudio package).
Managing analysis results
The analysis results generated by PVS-Studio analyzer will be displayed in the table inside the 'PVS-Studio' window:
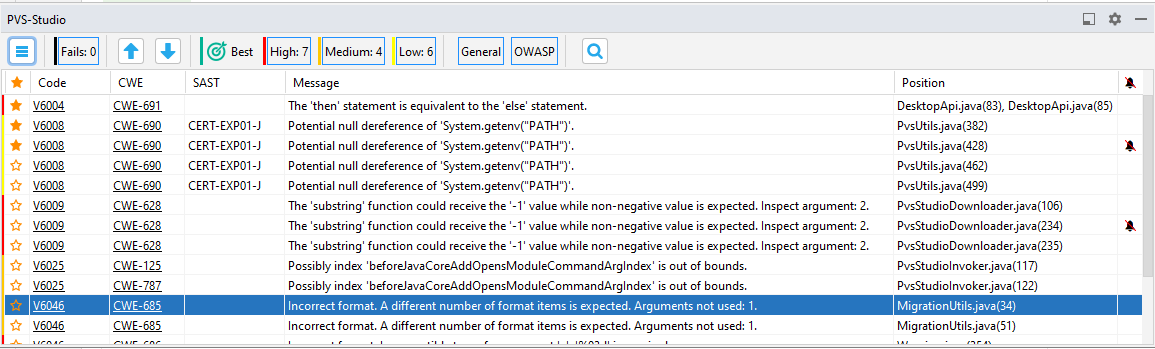
The table consists of 7 columns, arranged from left to right as follows: 'Favorite', 'Code', 'CWE', 'SAST', 'Message', 'Position', and 'False Alarms'. The analyzer messages can be sorted by any column. To change the sorting order, click the column heading. The leftmost 'Favorite' column can be used to bookmark warnings for quick search among marked messages by sorting the messages by the 'Favorite' column.
When you click a warning in the 'Code'/'CWE' columns, a webpage will open in your browser, providing a detailed description of the warning or potential vulnerability. The 'SAST' column indicates the OWASP ASVS code vulnerability identifier for the warning. The 'Message' column gives short descriptions of the warnings. The 'Position' column contains a list of files the warning refers to. The rightmost 'False Alarms' column displays warnings marked as false positives. You can find more details on managing false positives in the relevant section.
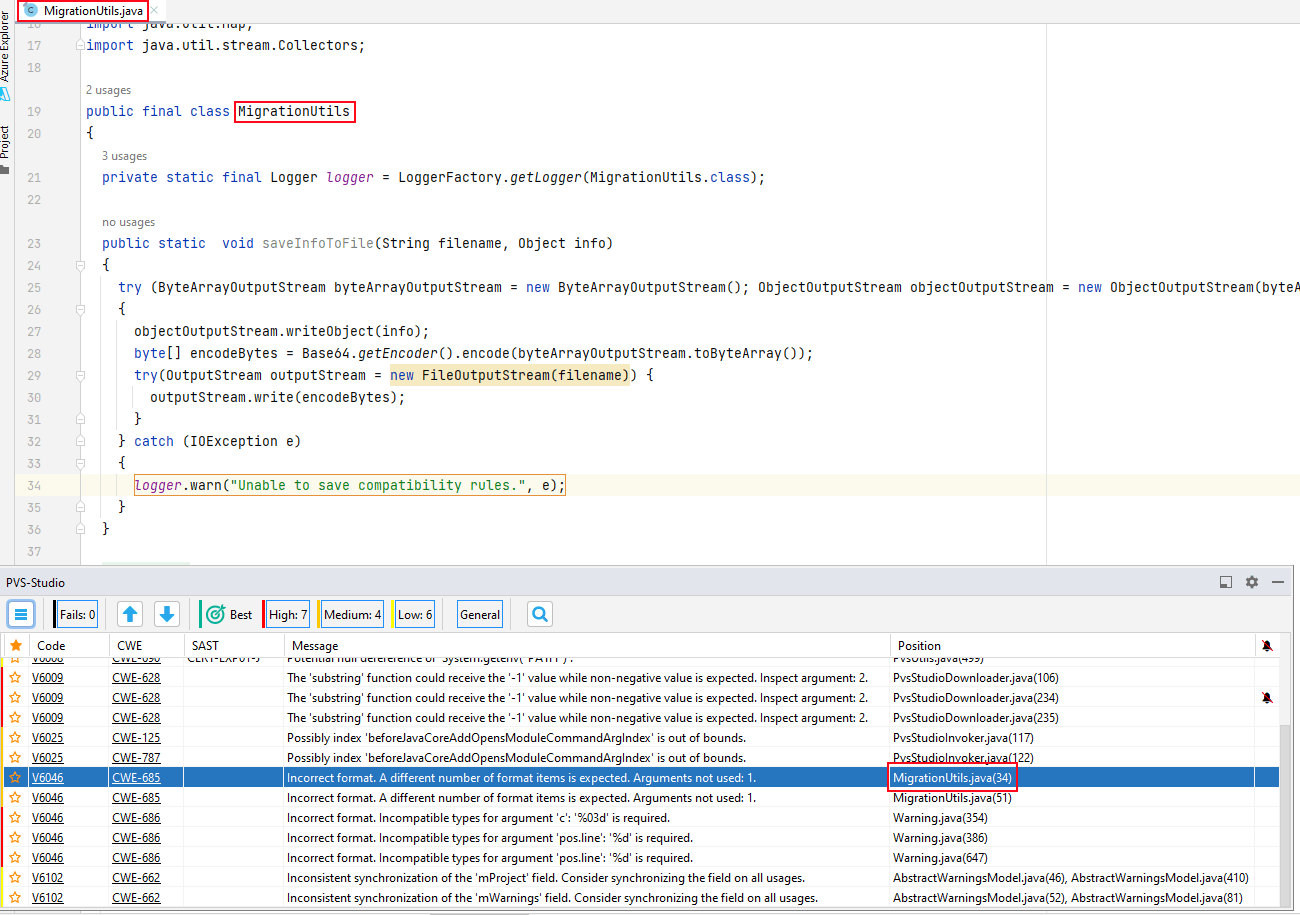
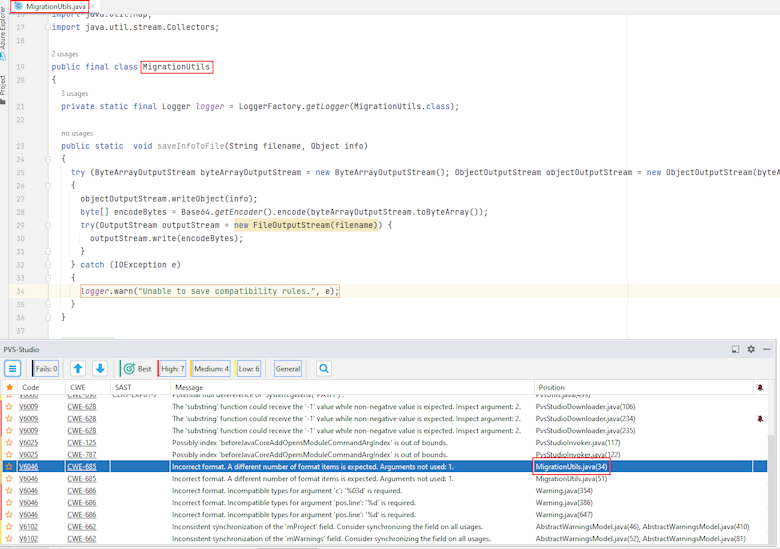
Double-click a warning in the table to open the file at the line that triggered the analyzer:
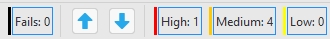
There are also two arrow buttons above the table. You can use them to move between the warnings and open the needed files in the source code editor. To the right of the arrow buttons, you can set filters by level of warnings: High, Medium, Low, and Fails. The 'Fails' filter contains errors of the analyzer itself.
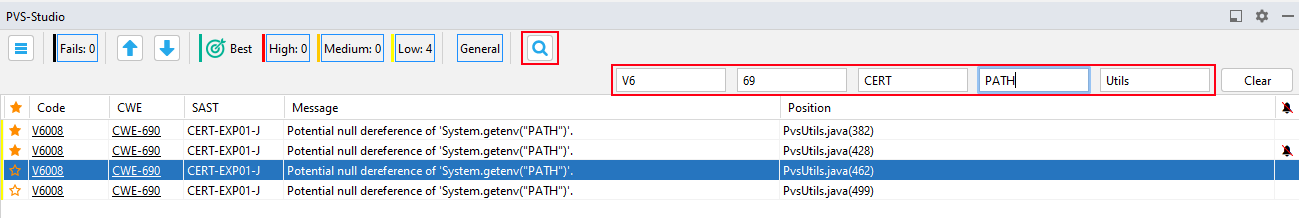
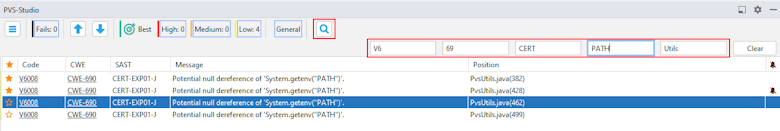
When you click the search icon, an additional panel opens with text fields to search across the 'Code', 'CWE', 'SAST, 'Message', and 'Position' columns. Each field is a string filter which allows you to filter messages by the text you have entered:
Click a hamburger button in the top-left corner above the table to open an additional settings panel:
Click the gear icon to open the plugin settings main window, or click 'Tools -> PVS-Studio -> Settings'.
Viewing the most interesting analyzer warnings
If you are new to the static analysis tool and would like to learn about its capabilities, you can use the Best Warnings mechanism. This mechanism displays the most important and reliable warnings.
To view the most interesting analyzer warnings, click the 'Best' button, as shown in the screenshot below:
When the analysis is complete, you will see ten most critical warnings.
Managing false positives
Sometimes the analyzer may issue a warning for some spot in your code, but you are sure that there is no error in that fragment. Such a warning is called a false positive.
The PVS-Studio plugin allows you to mark the analyzer messages as false positives to prevent them from appearing in future checks.
To mark false positives, select one or more warnings in the 'PVS-Studio' table, right-click any row to open the dropdown menu, and select the 'Mark Selected Messages As False Alarms' menu item:
The analyzer will add a special comment with the '\\-Vxxxx' (xxxx is the PVS-Studio diagnostic number) pattern to the line where the analyzer issues a warning. You can also add such comments manually.
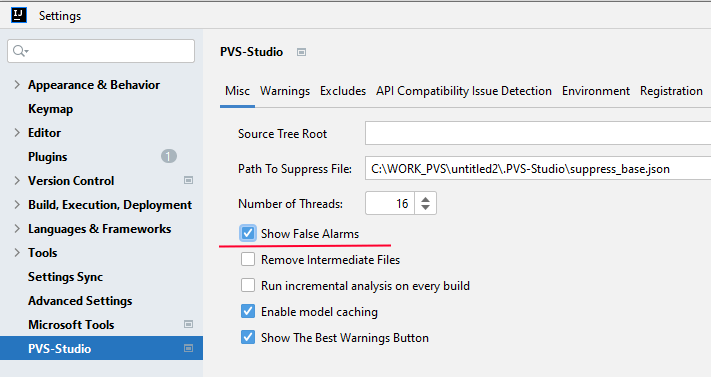
To display warnings previously marked as false positive in the table, click 'Tools -> PVS-Studio -> Settings' and enable the 'Show False Alarms':
Use the 'Remove False Alarm marks from selected messages' menu item in the dropdown menu to unmark selected warnings as false positives.
To learn more how to suppress warnings generated by the analyzer and other ways of suppressing warnings, consult the "Suppression of False Alarms" documentation section.
Suppressing analyzer warnings in legacy code
Lots of warnings in legacy code may pose difficulty to get started with static analysis and use it regularly. Such code is usually well-tested and stable, so you don't need to fix every warning in it. Moreover, if the code base is large, fixing it may take a long time. What's more, warnings issued on legacy code distract you from warnings issued on new code which is still in development.
To solve this problem and quickly start using static analysis regularly, PVS-Studio allows you to "disable" warnings in legacy code. To do that, click 'Tools -> PVS-Studio -> Suppress All Messages' or click the 'Suppress All Messages' button on the PVS-Studio window toolbar. The suppression mechanism bases on the special suppress file. Suppressed messages are added to this file after clicking the 'Suppress All Messages' button. During the next analysis, the warnings added to this suppress file will be excluded from the analyzer report. The suppression mechanism with the suppress file is quite flexible and can "track" suppressed messages even if you modify or move the code fragments for which a suppressed message is generated.
In the IDEA, suppressed messages are added to the suppress file — suppress_base.json. This file is written to the .PVS-Studio directory in the root directory of a project in the IDEA. To restore these warnings in the analyzer report, delete the suppress files linked to the affected projects and restart the analysis.
To learn more about warning suppression and how to handle the suppress files, consult the "Baselining analysis results" documentation section.
You can also read the article: "How to introduce a static code analyzer in a legacy project and not to discourage the team".
Dropdown menu of the warnings table
Right-click a warning in the PVS-Studio window table to open a dropdown menu with additional items to manage selected warnings.
The 'Copy Selected Messages To Clipboard' menu item copies all selected warnings in the window with PVS-Studio plugin report to the clipboard.
The 'Mark Selected Messages As Important' menu item allows you to mark a warning with an asterisk. The asterisk helps easily find it during the sorting by the Favorite column (leftmost column).
Click the 'Mark selected messages as False Alarms / Remove false alarm masks' menu item to mark selected warnings as false positives by adding a special comment to the lines of code they refer to (see the section above on managing false positives).
The 'Add Selected Messages To Suppression File' menu item allows you to suppress the warnings selected in the tab that shows PVS-Studio plugin report. During the next analysis run, these warnings will not be displayed in the window.
The 'Show Columns' menu item opens a list with column names that you can display or hide.
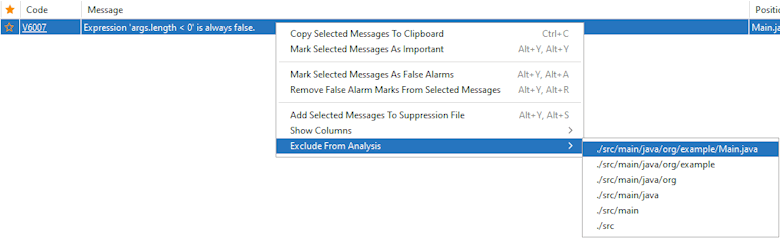
The 'Exclude from analysis' menu item allows to add the full or partial path name of the file. This file contains a warning to the list of folders excluded from analysis. Every file whose path name matches the filter will be excluded from the analysis.

Saving and loading analysis results
Click 'Tools -> PVS-Studio' to save or load results:
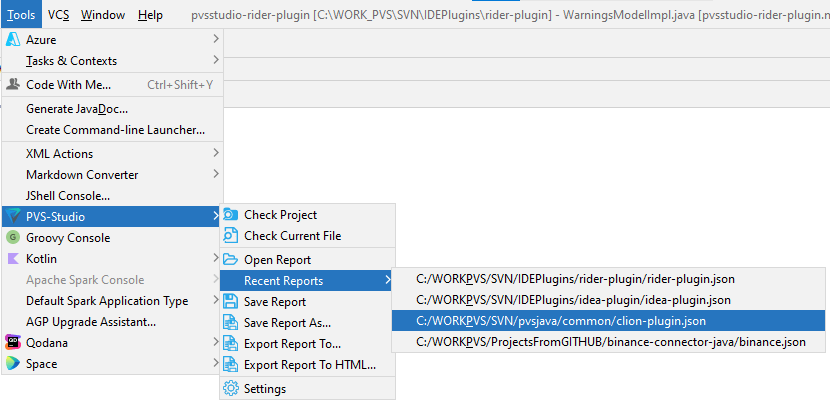
The 'Open Report' menu item opens the .json report file and loads its contents into the table in the 'PVS-Studio' output window.
The 'Recent Reports' submenu contains a list of recently opened reports. Click an item on this list to open the report file (if the file still exists at that path) to load its contents into the table in the 'PVS-Studio' window.
Select the 'Save Report' menu item to save all the messages from the table (even the filtered ones) to a .json report file. If the current list of messages has never been saved before, you will be prompted to enter a name and location where to store the report.
Similarly, use the 'Save Report As' menu item to save all the warnings from the table (even the filtered ones) to a .json file and always prompts you to specify the location where to store the report.
The 'Export Report To...' menu item allows to save the analyzer report in different formats (xml, txt, tasks, pvslog, log, html, err). Each format is useful in different situations and utilities.
The 'Export Report To HTML...' menu item allows you to save the analyzer report to a selected folder in HTML format. You can view the warnings directly in the browser and navigate through the source code files in the browser. This command creates a folder named 'fullhtml' containing the analyzer report file (index.html) in the selected folder.
Please note. Instead of the 'Export Report To HTML...' command, it's better to use the PlogConverter (Windows) and plog-converter (Linux and macOS) console utilities. They enable you to convert the analyzer report to more formats (for example, SARIF). The utilities provide additional features: filtering warnings from the report, converting paths in the report from absolute to relative (and vice versa), getting data on the differences between reports, etc.;
Keyboard shortcuts in PVS-Studio for IntelliJ IDEA and Android Studio
The PVS-Studio plugin for IntelliJ IDEA and Android Studio adds the analysis result window. This window has a dropdown menu that appears when you right-click the analysis result window:
Some of these actions have keyboard shortcuts. Thus, you can perform them without using a mouse.
The arrow keys for navigating the analyzer warnings also have shortcuts:
- Move to the next message: Alt + [;
- Move to the previous message: Alt + ].
Using shortcuts is helpful, since they speed up the analysis result processing. You can set and customize the shortcuts in settings: 'File -> Settings -> Keymap'. To find shortcuts faster, enter "PVS-Studio" in the search bar of the 'Keymap' window.
PVS-Studio Java update
If the PVS-Studio update is available, you will get a message in the analysis report.
To update the plugin, open 'File -> Settings -> Plugins', find the 'PVS-Studio for IDEA and Android Studio' plugin in the 'Installed' list, click 'Update', and restart IDE.
Using proxy
If you use proxy, you need to use proxy for downloading the ZIP archive for Java on the Download page. The archive contains the Java analyzer core (a folder named 7.30.80678 in the pvs-studio-java directory). Unpack the Java analyzer core to the standard installation path for the Java analyzer core:
- Windows: %APPDATA%/PVS-Studio-Java;
- Linux and macOS: ~/.config/PVS-Studio-Java.
As a result, a folder with the name of the Java core version, copied from the archive, should appear in the folder at the standard path for installing the analyzer Java core. You should copy the folder from the archive and name it after the version of the Java analyzer core.
Was this page helpful?