Running PVS-Studio in TeamCity
To automate analysis in TeamCity, use the analyzer as a console application.
In TeamCity, create a Build Step with the following parameters:
- Runner type: Command Line;
- Step Name: <name>;
- Run: Custom script;
- Custom script: <script>.
Add two commands to the script: an analysis command and an optional command that converts the report to the format you need.
The documentation below provides sample commands to process analysis results and to integrate analysis into build systems:
- How to run PVS-Studio on Linux and macOS;
- How to run PVS-Studio on Windows;
- How to run PVS-Studio Java.
Viewing analysis results
HTML reports
In TeamCity, you can add HTML analyzer reports to a build's artifacts.
First, generate an HTML report that has the code navigation feature:
Windows: C, C++, C#
PlogConverter.exe ... --renderTypes FullHtml ...Linux/macOS: C, C++
plog-converter ... --renderTypes fullhtml ...Windows/Linux/macOS: Java
Access Maven or Gradle plugin settings. Indicate 'fullhtml' in the 'outputType' field.
Proceed to 'Edit Configuration Settings -> General Settings -> Artifact paths' and specify the HTML report's directory.
After the build succeeds, the analyzer's fullhtml report will be available in artifacts. To access it, open the 'Artifacts' tab and click the 'index.html' file. You can also display the report on a special build session report tab. To do this, proceed to the project settings, open 'Report Tabs' and click 'Create new build report tab'.
In the 'Start page' field, specify the 'index.html' path relative to the artifact folder. For example, if the 'Artifacts' tab looks as follows:
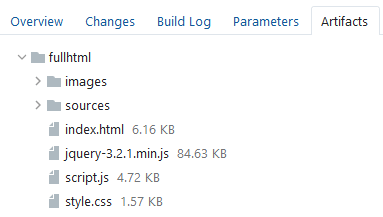
enter 'fullhtml/index.html' into 'Start Page'. After you add the tab, it will display analysis results:
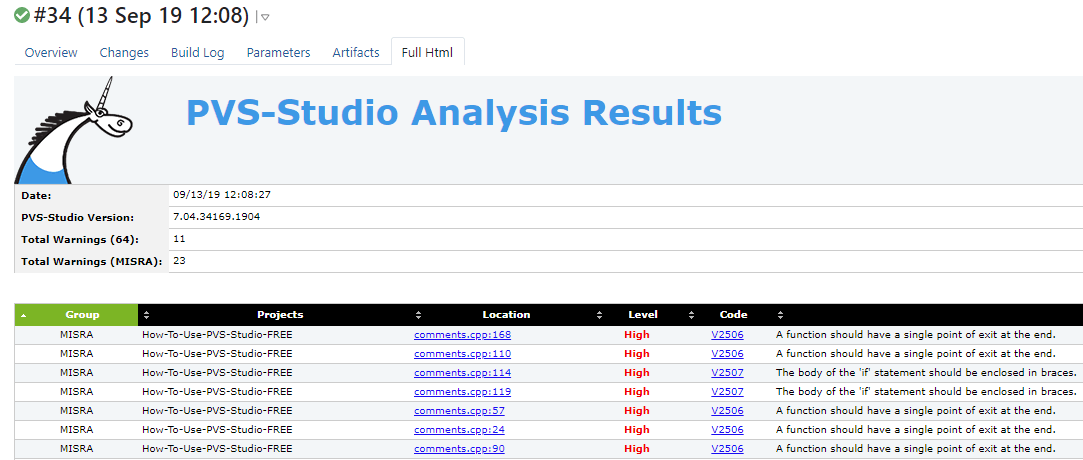
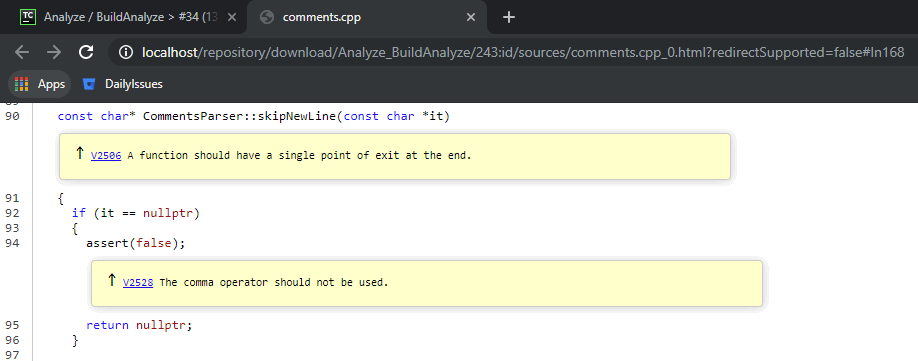
When clicked, analyzer warnings open in a new browser tab:
Standard TeamCity reports
The 'plog-converter' utility supports standard TeamCity reports - TeamCity Inspections Type. After generating a report, print it with stdout at any step of the build.
Below are ways to do it:
Windows: C, C++, C#
PlogConverter.exe ... –-renderTypes=TeamCity -o TCLogsDir ...
Type TCLogsDir\MyProject.plog_TeamCity.txt
Linux/macOS: C, C++
plog-converter ... -t teamcity -o report_tc.txt ...
cat report_tc.txt
Windows/Linux/macOS: Java
Support is coming soon.
After the build succeeds, TeamCity will display the analyzer report on a new build information tab:
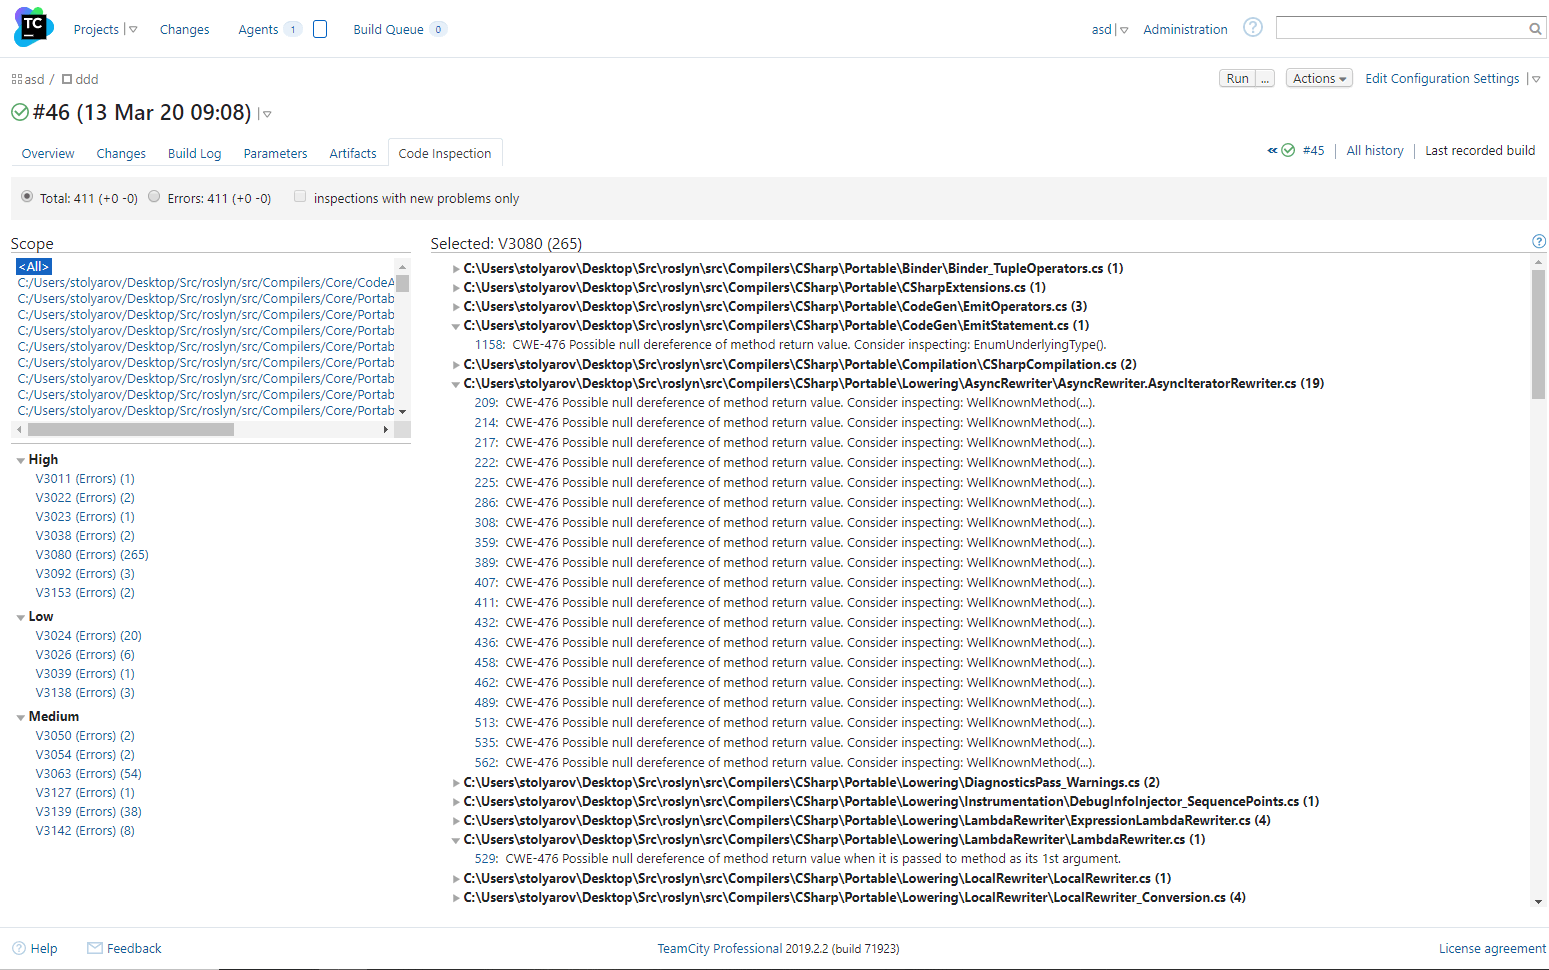
To navigate to the code that triggered a diagnostic, click the line number to the left of this diagnostic. TeamCity will take you to the code if the following conditions are met: you have specified the absolute source file path, your project is open in an IDE (Eclipse, Visual Studio, IntelliJ IDEA), and you have installed the TeamCity plugin.
Was this page helpful?