PVS-Studio Documentation (single page)
- Introduction
- Analyzing projects
- Continuous use of the analyzer in software development
- Deploying the analyzer in cloud Continuous Integration services
- Managing analysis results
- Additional configuration and resolving issues
- Analyzer diagnostics
- Additional information
You can open full PVS-Studio documentation as single page.
Introduction
- How to enter the PVS-Studio license and what's the next move
- PVS-Studio's trial mode
- System requirements
- Technologies used in PVS-Studio
- Release history
- Release history for previous versions (before 7.00)
Analyzing projects
On Windows
- Getting acquainted with the PVS-Studio static code analyzer on Windows
- Build-system independent analysis (C and C++)
- Direct integration of the analyzer into build automation systems (C and C++)
On Linux and macOS
- PVS-Studio C# installation on Linux and macOS
- How to run PVS-Studio C# on Linux and macOS
- Installing and updating PVS-Studio C++ on Linux
- Installing and updating PVS-Studio C++ on macOS
- How to run PVS-Studio C++ on Linux and macOS
Cross-platform
- Direct use of Java analyzer from command line
- Cross-platform analysis of C and C++ projects in PVS-Studio
- PVS-Studio for embedded development
- Analysis of C and C++ projects based on JSON Compilation Database
IDE
- Get started with PVS-Studio in Visual Studio
- Using PVS-Studio with JetBrains Rider and CLion
- How to use the PVS-Studio extension for Qt Creator
- How to integrate PVS-Studio in Qt Creator without the PVS-Studio plugin
- Using the PVS-Studio extension for Visual Studio Code
- Using PVS-Studio with IntelliJ IDEA and Android Studio
Build systems
- Analyzing Visual Studio / MSBuild / .NET projects from the command line using PVS-Studio
- Using PVS-Studio with the CMake module
- Integrating PVS-Studio Java into the Gradle build system
- Integrating PVS-Studio Java into the Maven build system
Game Engines
Continuous use of the analyzer in software development
- Running PVS-Studio in Docker
- Running PVS-Studio in Jenkins
- Running PVS-Studio in TeamCity
- How to upload analysis results to Jira
- PVS-Studio and continuous integration
- PVS-Studio's incremental analysis mode
- Analyzing commits and pull requests
- Integration of PVS-Studio analysis results into DefectDojo
- Integration of PVS-Studio analysis results into SonarQube
- Unattended deployment of PVS-Studio
- Speeding up the analysis of C and C++ code through distributed build systems (Incredibuild)
Deploying the analyzer in cloud Continuous Integration services
- Using with Travis CI
- Using with CircleCI
- Using with GitLab CI/CD
- Using with GitHub Actions
- Using with Azure DevOps
- Using with AppVeyor
- Using with Buddy
Managing analysis results
- How to display the analyzer's most interesting warnings
- How to use the OWASP diagnostic group in PVS-Studio
- Baselining analysis results (suppressing warnings for existing code)
- Handling the diagnostic messages list in Visual Studio
- Suppression of false-positive warnings
- How to view and convert analyzer's results
- Relative paths in PVS-Studio log files
- Viewing analysis results with C and C++ Compiler Monitoring UI
- Notifying the developer teams (blame-notifier utility)
- Viewing reports in a SARIF format in Visual Studio Code
- Filtering and handling the analyzer output through diagnostic configuration files (.pvsconfig)
- Excluding files and directories from analysis
Additional configuration and resolving issues
- Tips on speeding up PVS-Studio
- PVS-Studio: troubleshooting
- Additional diagnostics configuration
- Annotating functions and types in JSON format
- Predefined PVS_STUDIO macro
- Analysis configuration file (Settings.xml)
- PVS-Studio settings in Visual Studio / C and C++ compiler monitoring UI
Analyzer diagnostics
- PVS-Studio Messages
- General Analysis (C++)
- General Analysis (C#)
- General Analysis (Java)
- Micro-Optimizations (C++)
- Micro-Optimizations (C#)
- Diagnosis of 64-bit errors (Viva64, C++)
- Customer specific requests (C++)
- MISRA errors
- AUTOSAR errors
- OWASP errors (C++)
- OWASP errors (C#)
- OWASP errors (Java)
- Problems related to code analyzer
Additional information
- What bugs can PVS-Studio detect?
- List of all analyzer rules in XML
- General Analysis (C++)
- General Analysis (C#)
- General Analysis (Java)
- Micro-Optimizations (C++)
- Micro-Optimizations (C#)
- Diagnosis of 64-bit errors (Viva64, C++)
- Customer specific requests (C++)
- MISRA errors
- AUTOSAR errors
- OWASP errors (C++)
- OWASP errors (C#)
- OWASP errors (Java)
- Problems related to code analyzer
PVS-Studio Messages
What bugs can PVS-Studio detect?
We grouped the diagnostic, so that you can get the general idea of what PVS-Studio is capable of.
As it is hard to do strict grouping, some diagnostics belong to several groups. For example, the incorrect condition "if (abc == abc)" can be interpreted both as a simple typo, but also as a security issue, because it leads to the program vulnerability if the input data are incorrect.
Some of the errors, on the contrary, couldn't fit any of the groups, because they were too specific. Nevertheless this table gives the insight about the functionality of the static code analyzer.
List of all analyzer rules in XML
You can find a permanent link to machine-readable map of all analyzer's rules in XML format here.
|
Main PVS-Studio diagnostic abilities |
Diagnostics |
|---|---|
|
64-bit issues |
C, C++: V101-V128, V201-V207, V220, V221, V301-V303 |
|
Check that addresses to stack memory does not leave the function |
C, C++: V506, V507, V558, V758 |
|
Arithmetic over/underflow |
C, C++: V636, V658, V784, V786, V1012, V1028, V1029, V1033
C#: V3040, V3041
Java: V6011, V6088 |
|
Array index out of bounds |
C, C++: V557, V582, V643, V781, V1038
C#: V3106
Java: V6025, V6079 |
|
Double-free |
C, C++: V586, V749, V1002, V1006 |
|
Dead code |
C, C++: V606, V607 |
|
Microoptimization |
C, C++: V801-V829 |
|
Unreachable code |
C, C++: V551, V695, V734, V776, V779, V785
C#: V3136, V3142
Java: V6018, V6019 |
|
Uninitialized variables |
C, C++: V573, V614, V679, V730, V737, V788, V1007, V1050
C#: V3070, V3128
Java: V6036, V6050, V6052, V6090 |
|
Unused variables |
C, C++: V603, V751, V763, V1001
C#: V3061, V3065, V3077, V3117, V3137, V3143
Java: V6021, V6022, V6023 |
|
Illegal bitwise/shift operations |
C, C++: V610, V629, V673, V684, V770
C#: V3134
Java: V6034, V6069 |
|
Undefined/unspecified behavior |
C, C++: V567, V610, V611, V681, V704, V708, V726, V736, V1016, V1026, V1032, V1061 |
|
Incorrect handling of the types (HRESULT, BSTR, BOOL, VARIANT_BOOL, float, double) |
C, C++: V543, V544, V545, V716, V721, V724, V745, V750, V676, V767, V768, V772, V775, V1027, V1034, V1046, V1060
C#: V3111, V3121, V3148 |
|
Improper understanding of function/class operation logic |
C, C++: V518, V530, V540, V541, V554, V575, V597, V598, V618, V630, V632, V663, V668, V698, V701, V702, V717, V718, V720, V723, V725, V727, V738, V742, V743, V748, V762, V764, V780, V789, V797, V1014, V1024, V1031, V1035, V1045, V1052, V1053, V1054, V1057
C#: V3010, V3057, V3068, V3072, V3073, V3074, V3082, V3084, V3094, V3096, V3097, V3102, V3103, V3104, V3108, V3114, V3115, V3118, V3123, V3126, V3145
Java: V6009, V6010, V6016, V6026, V6029, V6049, V6055, V6058, V6064, V6068, V6081 |
|
Misprints |
C, C++: V501, V503, V504, V508, V511, V516, V519, V520, V521, V525, V527, V528, V529, V532, V533, V534, V535, V536, V537, V539, V546, V549, V552, V556, V559, V560, V561, V564, V568, V570, V571, V575, V577, V578, V584, V587, V588, V589, V590, V592, V600, V602, V604, V606, V607, V616, V617, V620, V621, V622, V625, V626, V627, V633, V637, V638, V639, V644, V646, V650, V651, V653, V654, V655, V660, V661, V662, V666, V669, V671, V672, V678, V682, V683, V693, V715, V722, V735, V747, V754, V756, V765, V767, V787, V791, V792, V796, V1013, V1015, V1021, V1040, V1051
C#: V3001, V3003, V3005, V3007, V3008, V3009, V3011, V3012, V3014, V3015, V3016, V3020, V3028, V3029, V3034, V3035, V3036, V3037, V3038, V3050, V3055, V3056, V3057, V3062, V3063, V3066, V3081, V3086, V3091, V3092, V3107, V3109, V3110, V3112, V3113, V3116, V3122, V3124, V3132, V3140
Java: V6001, V6005, V6009, V6012, V6014, V6015, V6017, V6021, V6026, V6028, V6029, V6030, V6031, V6037, V6041, V6042, V6043, V6045, V6057, V6059, V6061, V6062, V6063, V6077, V6080, V6085, V6091 |
|
Missing Virtual destructor |
C, C++: V599, V689 |
|
Coding style not matching the operation logic of the source code |
C, C++: V563, V612, V628, V640, V646, V705, V1044
C#: V3018, V3033, V3043, V3067, V3069, V3138, V3150
Java: V6040, V6047, V6086, V6089 |
|
Copy-Paste |
C, C++: V501, V517, V519, V523, V524, V571, V581, V649, V656, V691, V760, V766, V778, V1037
C#: V3001, V3003, V3004, V3008, V3012, V3013, V3021, V3030, V3058, V3127, V3139, V3140
Java: V6003, V6004, V6012, V6021, V6027, V6032, V6033, V6039, V6067, V6072 |
|
Incorrect usage of exceptions |
C, C++: V509, V565, V596, V667, V740, V741, V746, V759, V1022
C#: V3006, V3052, V3100, V3141
Java: V6006, V6051 |
|
Buffer overrun |
C, C++: V512, V514, V594, V635, V641, V645, V752, V755 |
|
Security issues |
C, C++: V505, V510, V511, V512, V518, V531, V541, V547, V559, V560, V569, V570, V575, V576, V579, V583, V597, V598, V618, V623, V642, V645, V675, V676, V724, V727, V729, V733, V743, V745, V750, V771, V774, V782, V1003, V1005, V1010, V1017
C#: V3022, V3023, V3025, V3027, V3053, V3063
Java: V6007, V6046, V6054 |
|
Operation priority |
C, C++: V502, V562, V593, V634, V648
C#: V3130, V3133
Java: V6044 |
|
Null pointer / null reference dereference
|
C, C++: V522, V595, V664, V757, V769
C#: V3019, V3042, V3080, V3095, V3105, V3125, V3141, V3145, V3146, V3148, V3149, V3153
Java: V6008, V6060 |
|
Unchecked parameter dereference |
C, C++: V595, V664, V783, V1004
C#: V3095
Java: V6060 |
|
Synchronization errors |
C, C++: V712, V1011, V1018, V1025, V1036
C#: V3032, V3054, V3079, V3083, V3089, V3090, V3147
Java: V6070, V6074, V6082 |
|
WPF usage errors |
C#: V3044-V3049 |
|
Resource leaks |
C, C++: V701, V773, V1020, V1023 |
|
Check for integer division by zero |
C, C++: V609
C#: V3064, V3151, V3152
Java: V6020 |
|
Serialization / deserialization issues |
C, C++: V739, V1024
C#: V3094, V3096, V3097, V3099, V3103, V3104
Java: V6065, V6075, V6076, V6083, V6087 |
|
Customized user rules |
C, C++: V2001-V2014 |
Table – PVS-Studio functionality.
As you see, the analyzer is especially useful is such spheres as looking for bugs caused by Copy-Paste and detecting security flaws.
To these diagnostics in action, have a look at the error base. We collect all the errors that we have found, checking various open source projects with PVS-Studio.
General Analysis (C++)
- V501. Identical sub-expressions to the left and to the right of 'foo' operator.
- V502. The '?:' operator may not work as expected. The '?:' operator has a lower priority than the 'foo' operator.
- V503. Nonsensical comparison: pointer < 0.
- V504. Semicolon ';' is probably missing after the 'return' keyword.
- V505. The 'alloca' function is used inside the loop. This can quickly overflow stack.
- V506. Pointer to local variable 'X' is stored outside the scope of this variable. Such a pointer will become invalid.
- V507. Pointer to local array 'X' is stored outside the scope of this array. Such a pointer will become invalid.
- V508. The 'new type(n)' pattern was detected. Probably meant: 'new type[n]'.
- V509. Exceptions raised inside noexcept functions must be wrapped in a try..catch block.
- V510. The 'Foo' function receives class-type variable as Nth actual argument. This is unexpected behavior.
- V511. The sizeof() operator returns pointer size instead of array size.
- V512. Call of the 'Foo' function will lead to buffer overflow.
- V513. Use _beginthreadex/_endthreadex functions instead of CreateThread/ExitThread functions.
- V514. Potential logical error. Size of a pointer is divided by another value.
- V515. The 'delete' operator is applied to non-pointer.
- V516. Non-null function pointer is compared to null. Consider inspecting the expression.
- V517. Potential logical error. The 'if (A) {...} else if (A) {...}' pattern was detected.
- V518. The 'malloc' function allocates suspicious amount of memory calculated by 'strlen(expr)'. Perhaps the correct expression is strlen(expr) + 1.
- V519. The 'x' variable is assigned values twice successively. Perhaps this is a mistake.
- V520. Comma operator ',' in array index expression.
- V521. Expressions that use comma operator ',' are dangerous. Make sure the expression is correct.
- V522. Possible null pointer dereference.
- V523. The 'then' statement is equivalent to the 'else' statement.
- V524. It is suspicious that the body of 'Foo_1' function is fully equivalent to the body of 'Foo_2' function.
- V525. Code contains collection of similar blocks. Check items X, Y, Z, ... in lines N1, N2, N3, ...
- V526. The 'strcmp' function returns 0 if corresponding strings are equal. Consider inspecting the condition for mistakes.
- V527. The 'zero' value is assigned to pointer. Probably meant: *ptr = zero.
- V528. Pointer is compared with 'zero' value. Probably meant: *ptr != zero.
- V529. Suspicious semicolon ';' after 'if/for/while' operator.
- V530. Return value of 'Foo' function is required to be used.
- V531. The sizeof() operator is multiplied by sizeof(). Consider inspecting the expression.
- V532. Consider inspecting the statement of '*pointer++' pattern. Probably meant: '(*pointer)++'.
- V533. It is possible that a wrong variable is incremented inside the 'for' operator. Consider inspecting 'X'.
- V534. It is possible that a wrong variable is compared inside the 'for' operator. Consider inspecting 'X'.
- V535. The 'X' variable is used for this loop and outer loops.
- V536. Constant value is represented by an octal form.
- V537. Potential incorrect use of item 'X'. Consider inspecting the expression.
- V538. The line contains control character 0x0B (vertical tabulation).
- V539. Iterators are passed as arguments to 'Foo' function. Consider inspecting the expression.
- V540. Member 'x' should point to string terminated by two 0 characters.
- V541. String is printed into itself. Consider inspecting the expression.
- V542. Suspicious type cast: 'Type1' to ' Type2'. Consider inspecting the expression.
- V543. It is suspicious that value 'X' is assigned to the variable 'Y' of HRESULT type.
- V544. It is suspicious that the value 'X' of HRESULT type is compared with 'Y'.
- V545. Conditional expression of 'if' statement is incorrect for the HRESULT type value 'Foo'. The SUCCEEDED or FAILED macro should be used instead.
- V546. The 'Foo(Foo)' class member is initialized with itself.
- V547. Expression is always true/false.
- V548. TYPE X[][] is not equivalent to TYPE **X. Consider inspecting type casting.
- V549. The 'first' argument of 'Foo' function is equal to the 'second' argument.
- V550. Suspicious precise comparison. Consider using a comparison with defined precision: fabs(A - B) < Epsilon or fabs(A - B) > Epsilon.
- V551. Unreachable code under a 'case' label.
- V552. A bool type variable is incremented. Perhaps another variable should be incremented instead.
- V553. Length of function body or class declaration is more than 2000 lines. Consider refactoring the code.
- V554. Incorrect use of smart pointer.
- V555. Expression of the 'A - B > 0' kind will work as 'A != B'.
- V556. Values of different enum types are compared.
- V557. Possible array overrun.
- V558. Function returns pointer/reference to temporary local object.
- V559. Suspicious assignment inside the conditional expression of 'if/while/for' statement.
- V560. Part of conditional expression is always true/false.
- V561. Consider assigning value to 'foo' variable instead of declaring it anew.
- V562. Bool type value is compared with value of N. Consider inspecting the expression.
- V563. An 'else' branch may apply to the previous 'if' statement.
- V564. The '&' or '|' operator is applied to bool type value. Check for missing parentheses or use the '&&' or '||' operator.
- V565. Empty exception handler. Silent suppression of exceptions can hide errors in source code during testing.
- V566. Integer constant is converted to pointer. Check for an error or bad coding style.
- V567. Modification of variable is unsequenced relative to another operation on the same variable. This may lead to undefined behavior.
- V568. It is suspicious that the argument of sizeof() operator is the expression.
- V569. Truncation of constant value.
- V570. Variable is assigned to itself.
- V571. Recurring check. This condition was already verified in previous line.
- V572. Object created using 'new' operator is immediately cast to another type. Consider inspecting the expression.
- V573. Use of uninitialized variable 'Foo'. The variable was used to initialize itself.
- V574. Pointer is used both as an array and as a pointer to single object.
- V575. Function receives suspicious argument.
- V576. Incorrect format. Consider checking the Nth actual argument of the 'Foo' function.
- V577. Label is present inside switch(). Check for typos and consider using the 'default:' operator instead.
- V578. Suspicious bitwise operation was detected. Consider inspecting it.
- V579. The 'Foo' function receives the pointer and its size as arguments. This may be a potential error. Inspect the Nth argument.
- V580. Suspicious explicit type casting. Consider inspecting the expression.
- V581. Conditional expressions of 'if' statements located next to each other are identical.
- V582. Consider reviewing the source code that uses the container.
- V583. The '?:' operator, regardless of its conditional expression, always returns the same value.
- V584. Same value is present on both sides of the operator. The expression is incorrect or can be simplified.
- V585. Attempt to release memory that stores the 'Foo' local variable.
- V586. The 'Foo' function is called twice to deallocate the same resource.
- V587. Suspicious sequence of assignments: A = B; B = A;.
- V588. Expression of the 'A =+ B' kind is used. Possibly meant: 'A += B'. Consider inspecting the expression.
- V589. Expression of the 'A =- B' kind is used. Possibly meant: 'A -= B'. Consider inspecting the expression.
- V590. Possible excessive expression or typo. Consider inspecting the expression.
- V591. Non-void function must return value.
- V592. Expression is enclosed by parentheses twice: ((expression)). One pair of parentheses is unnecessary or typo is present.
- V593. Expression 'A = B == C' is calculated as 'A = (B == C)'. Consider inspecting the expression.
- V594. Pointer to array is out of array bounds.
- V595. Pointer was used before its check for nullptr. Check lines: N1, N2.
- V596. Object was created but is not used. Check for missing 'throw' keyword.
- V597. Compiler may delete 'memset' function call that is used to clear 'Foo' buffer. Use the RtlSecureZeroMemory() function to erase private data.
- V598. Memory manipulation function is used to work with a class object containing a virtual table pointer. The result of such an operation may be unexpected.
- V599. The virtual destructor is not present, although the 'Foo' class contains virtual functions.
- V600. The 'Foo' pointer is always not equal to NULL. Consider inspecting the condition.
- V601. Suspicious implicit type casting.
- V602. The '<' operator should probably be replaced with '<<'. Consider inspecting this expression.
- V603. Object was created but not used. If you wish to call constructor, use 'this->Foo::Foo(....)'.
- V604. Number of iterations in loop equals size of a pointer. Consider inspecting the expression.
- V605. Unsigned value is compared to the NN number. Consider inspecting the expression.
- V606. Ownerless token 'Foo'.
- V607. Ownerless expression 'Foo'.
- V608. Recurring sequence of explicit type casts.
- V609. Possible division or mod by zero.
- V610. Undefined behavior. Check the shift operator.
- V611. Memory allocation and deallocation methods are incompatible.
- V612. Unconditional 'break/continue/return/goto' within a loop.
- V613. Suspicious pointer arithmetic with 'malloc/new'.
- V614. Use of 'Foo' uninitialized variable.
- V615. Suspicious explicit conversion from 'float *' type to 'double *' type.
- V616. Use of 'Foo' named constant with 0 value in bitwise operation.
- V617. Argument of the '|' bitwise operation always contains non-zero value. Consider inspecting the condition.
- V618. Dangerous call of 'Foo' function. The passed line may contain format specification. Example of safe code: printf("%s", str);
- V619. Array is used as pointer to single object.
- V620. Expression of sizeof(T)*N kind is summed up with pointer to T type. Consider inspecting the expression.
- V621. Loop may execute incorrectly or may not execute at all. Consider inspecting the 'for' operator.
- V622. First 'case' operator may be missing. Consider inspecting the 'switch' statement.
- V623. Temporary object is created and then destroyed. Consider inspecting the '?:' operator.
- V624. Use of constant NN. The resulting value may be inaccurate. Consider using the M_NN constant from <math.h>.
- V625. Initial and final values of the iterator are the same. Consider inspecting the 'for' operator.
- V626. It's possible that ',' should be replaced by ';'. Consider checking for typos.
- V627. Argument of sizeof() is a macro, which expands to a number. Consider inspecting the expression.
- V628. It is possible that a line was commented out improperly, thus altering the program's operation logic.
- V629. Bit shifting of the 32-bit value with a subsequent expansion to the 64-bit type. Consider inspecting the expression.
- V630. The 'malloc' function is used to allocate memory for an array of objects that are classes containing constructors/destructors.
- V631. Defining absolute path to file or directory is considered a poor coding style. Consider inspecting the 'Foo' function call.
- V632. Argument is of the 'T' type. Consider inspecting the NN argument of the 'Foo' function.
- V633. The '!=' operator should probably be used here. Consider inspecting the expression.
- V634. Priority of '+' operation is higher than priority of '<<' operation. Consider using parentheses in the expression.
- V635. Length should be probably multiplied by sizeof(wchar_t). Consider inspecting the expression.
- V636. Expression was implicitly cast from integer type to real type. Consider using an explicit type cast to avoid overflow or loss of a fractional part.
- V637. Use of two opposite conditions. The second condition is always false.
- V638. Terminal null is present inside a string. Use of '\0xNN' characters. Probably meant: '\xNN'.
- V639. One of closing ')' parentheses is probably positioned incorrectly. Consider inspecting the expression for function call.
- V640. Code's operational logic does not correspond with its formatting.
- V641. Buffer size is not a multiple of element size.
- V642. Function result is saved inside the 'byte' type variable. Significant bits may be lost. This may break the program's logic.
- V643. Suspicious pointer arithmetic. Value of 'char' type is added to a string pointer.
- V644. Suspicious function declaration. Consider creating a 'T' type object.
- V645. Function call may lead to buffer overflow. Bounds should not contain size of a buffer, but a number of characters it can hold.
- V646. The 'else' keyword may be missing. Consider inspecting the program's logic.
- V647. Value of 'A' type is assigned to a pointer of 'B' type.
- V648. Priority of '&&' operation is higher than priority of '||' operation.
- V649. Two 'if' statements with identical conditional expressions. The first 'if' statement contains function return. This means that the second 'if' statement is senseless.
- V650. Type casting is used 2 times in a row. The '+' operation is executed. Probably meant: (T1)((T2)a + b).
- V651. Suspicious operation of 'sizeof(X)/sizeof(T)' kind, where 'X' is of the 'class' type.
- V652. Operation is executed 3 or more times in a row.
- V653. Suspicious string consisting of two parts is used for initialization. Comma may be missing.
- V654. Condition of a loop is always true/false.
- V655. Strings were concatenated but not used. Consider inspecting the expression.
- V656. Variables are initialized through the call to the same function. It's probably an error or un-optimized code.
- V657. Function always returns the same value of NN. Consider inspecting the function.
- V658. Value is subtracted from unsigned variable. It can result in an overflow. In such a case, the comparison operation may behave unexpectedly.
- V659. Functions' declarations with 'Foo' name differ in 'const' keyword only, while these functions' bodies have different composition. It is suspicious and can possibly be an error.
- V660. Program contains an unused label and function call: 'CC:AA()'. Probably meant: 'CC::AA()'.
- V661. Suspicious expression 'A[B < C]'. Probably meant 'A[B] < C'.
- V662. Different containers are used to set up initial and final values of iterator. Consider inspecting the loop expression.
- V663. Infinite loop is possible. The 'cin.eof()' condition is insufficient to break from the loop. Consider adding the 'cin.fail()' function call to the conditional expression.
- V664. Pointer is dereferenced on the initialization list before its check for null inside the body of a constructor function.
- V665. Possible incorrect use of '#pragma warning(default: X)'. The '#pragma warning(push/pop)' should be used instead.
- V666. Value may not correspond with the length of a string passed with YY argument. Consider inspecting the NNth argument of the 'Foo' function.
- V667. The 'throw' operator does not have any arguments and is not located within the 'catch' block.
- V668. Possible meaningless check for null, as memory was allocated using 'new' operator. Memory allocation will lead to an exception.
- V669. Argument is a non-constant reference. The analyzer is unable to determine the position where this argument is modified. Consider checking the function for an error.
- V670. Uninitialized class member is used to initialize another member. Remember that members are initialized in the order of their declarations inside a class.
- V671. The 'swap' function may interchange a variable with itself.
- V672. It is possible that creating a new variable is unnecessary. One of the function's arguments has the same name and this argument is a reference.
- V673. More than N bits are required to store the value, but the expression evaluates to the T type which can only hold K bits.
- V674. Expression contains a suspicious mix of integer and real types.
- V675. Writing into read-only memory.
- V676. Incorrect comparison of BOOL type variable with TRUE.
- V677. Custom declaration of standard type. Consider using the declaration from system header files instead.
- V678. Object is used as an argument to its own method. Consider checking the first actual argument of the 'Foo' function.
- V679. The 'X' variable was not initialized. This variable is passed by reference to the 'Foo' function in which its value will be used.
- V680. The 'delete A, B' expression only destroys the 'A' object. Then the ',' operator returns a resulting value from the right side of the expression.
- V681. The language standard does not define order in which 'Foo' functions are called during evaluation of arguments.
- V682. Suspicious literal: '/r'. It is possible that a backslash should be used instead: '\r'.
- V683. The 'i' variable should probably be incremented instead of the 'n' variable. Consider inspecting the loop expression.
- V684. Value of variable is not modified. It is possible that '1' should be present instead of '0'. Consider inspecting the expression.
- V685. The expression contains a comma. Consider inspecting the return statement.
- V686. Pattern A || (A && ...) was detected. The expression is excessive or contains a logical error.
- V687. Size of array calculated by sizeof() operator was added to a pointer. It is possible that the number of elements should be calculated by sizeof(A)/sizeof(A[0]).
- V688. The 'foo' local variable has the same name as one of class members. This can result in confusion.
- V689. Destructor of 'Foo' class is not declared as virtual. A smart pointer may not destroy an object correctly.
- V690. The class implements a copy constructor/operator=, but lacks the operator=/copy constructor.
- V691. Empirical analysis. Possible typo inside the string literal. The 'foo' word is suspicious.
- V692. Inappropriate attempt to append a null character to a string. To determine the length of a string by 'strlen' function correctly, use a string ending with a null terminator in the first place.
- V693. It is possible that 'i < X.size()' should be used instead of 'X.size()'. Consider inspecting conditional expression of the loop.
- V694. The condition (ptr - const_value) is only false if the value of a pointer equals a magic constant.
- V695. Range intersections are possible within conditional expressions.
- V696. The 'continue' operator will terminate 'do { ... } while (FALSE)' loop because the condition is always false.
- V697. Number of elements in the allocated array equals the size of a pointer in bytes.
- V698. Functions of strcmp() kind can return any values, not only -1, 0, or 1.
- V699. It is possible that 'foo = bar == baz ? .... : ....' should be used here instead of 'foo = bar = baz ? .... : ....'. Consider inspecting the expression.
- V700. It is suspicious that variable is initialized through itself. Consider inspecting the 'T foo = foo = x;' expression.
- V701. Possible realloc() leak: when realloc() fails to allocate memory, original pointer is lost. Consider assigning realloc() to a temporary pointer.
- V702. Classes should always be derived from std::exception (and alike) as 'public'.
- V703. It is suspicious that the 'foo' field in derived class overwrites field in base class.
- V704. The expression is always false on newer compilers. Avoid using 'this == 0' comparison.
- V705. It is possible that 'else' block was forgotten or commented out, thus altering the program's operation logics.
- V706. Suspicious division: sizeof(X) / Value. Size of every element in X array is not equal to divisor.
- V707. Giving short names to global variables is considered to be bad practice.
- V708. Dangerous construction is used: 'm[x] = m.size()', where 'm' is of 'T' class. This may lead to undefined behavior.
- V709. Suspicious comparison found: 'a == b == c'. Remember that 'a == b == c' is not equal to 'a == b && b == c'.
- V710. Suspicious declaration. There is no point to declare constant reference to a number.
- V711. It is dangerous to create a local variable within a loop with a same name as a variable controlling this loop.
- V712. Compiler may optimize out this loop or make it infinite. Use volatile variable(s) or synchronization primitives to avoid this.
- V713. Pointer was used in the logical expression before its check for nullptr in the same logical expression.
- V714. Variable is not passed into foreach loop by reference, but its value is changed inside of the loop.
- V715. The 'while' operator has empty body. This pattern is suspicious.
- V716. Suspicious type conversion: HRESULT -> BOOL (BOOL -> HRESULT).
- V717. It is suspicious to cast object of base class V to derived class U.
- V718. The 'Foo' function should not be called from 'DllMain' function.
- V719. The switch statement does not cover all values of the enum.
- V720. The 'SuspendThread' function is usually used when developing a debugger. See documentation for details.
- V721. The VARIANT_BOOL type is used incorrectly. The true value (VARIANT_TRUE) is defined as -1.
- V722. Abnormality within similar comparisons. It is possible that a typo is present inside the expression.
- V723. Function returns a pointer to the internal string buffer of a local object, which will be destroyed.
- V724. Converting integers or pointers to BOOL can lead to a loss of high-order bits. Non-zero value can become 'FALSE'.
- V725. Dangerous cast of 'this' to 'void*' type in the 'Base' class, as it is followed by a subsequent cast to 'Class' type.
- V726. Attempt to free memory containing the 'int A[10]' array by using the 'free(A)' function.
- V727. Return value of 'wcslen' function is not multiplied by 'sizeof(wchar_t)'.
- V728. Excessive check can be simplified. The '||' operator is surrounded by opposite expressions 'x' and '!x'.
- V729. Function body contains the 'X' label that is not used by any 'goto' statements.
- V730. Not all members of a class are initialized inside the constructor.
- V731. The variable of char type is compared with pointer to string.
- V732. Unary minus operator does not modify a bool type value.
- V733. It is possible that macro expansion resulted in incorrect evaluation order.
- V734. Excessive expression. Examine the substrings "abc" and "abcd".
- V735. Possibly an incorrect HTML. The "</XX>" closing tag was encountered, while the "</YY>" tag was expected.
- V736. The behavior is undefined for arithmetic or comparisons with pointers that do not point to members of the same array.
- V737. It is possible that ',' comma is missing at the end of the string.
- V738. Temporary anonymous object is used.
- V739. EOF should not be compared with a value of the 'char' type. Consider using the 'int' type.
- V740. Exception is of the 'int' type because NULL is defined as 0. Keyword 'nullptr' can be used for 'pointer' type exception.
- V741. Use of the throw (a, b); pattern. It is possible that type name was omitted: throw MyException(a, b);.
- V742. Function receives an address of a 'char' type variable instead of pointer to a buffer.
- V743. The memory areas must not overlap. Use 'memmove' function.
- V744. Temporary object is immediately destroyed after being created. Consider naming the object.
- V745. A 'wchar_t *' type string is incorrectly converted to 'BSTR' type string.
- V746. Object slicing. An exception should be caught by reference rather than by value.
- V747. Suspicious expression inside parentheses. A function name may be missing.
- V748. Memory for 'getline' function should be allocated only by 'malloc' or 'realloc' functions. Consider inspecting the first parameter of 'getline' function.
- V749. Destructor of the object will be invoked a second time after leaving the object's scope.
- V750. BSTR string becomes invalid. Notice that BSTR strings store their length before start of the text.
- V751. Parameter is not used inside function's body.
- V752. Creating an object with placement new requires a buffer of large size.
- V753. The '&=' operation always sets a value of 'Foo' variable to zero.
- V754. The expression of 'foo(foo(x))' pattern is excessive or contains an error.
- V755. Copying from potentially tainted data source. Buffer overflow is possible.
- V756. The 'X' counter is not used inside a nested loop. Consider inspecting usage of 'Y' counter.
- V757. It is possible that an incorrect variable is compared with null after type conversion using 'dynamic_cast'.
- V758. Reference was invalidated because of destruction of the temporary object returned by the function.
- V759. Violated order of exception handlers. Exception caught by handler for base class.
- V760. Two identical text blocks were detected. The second block starts with NN string.
- V761. NN identical blocks were found.
- V762. Consider inspecting virtual function arguments. See NN argument of function 'Foo' in derived class and base class.
- V763. Parameter is always rewritten in function body before being used.
- V764. Possible incorrect order of arguments passed to function.
- V765. Compound assignment expression 'X += X + N' is suspicious. Consider inspecting it for a possible error.
- V766. An item with the same key has already been added.
- V767. Suspicious access to element by a constant index inside a loop.
- V768. Variable is of enum type. It is suspicious that it is used as a variable of a Boolean-type.
- V769. The pointer in the expression equals nullptr. The resulting value is meaningless and should not be used.
- V770. Possible use of left shift operator instead of comparison operator.
- V771. The '?:' operator uses constants from different enums.
- V772. Calling the 'delete' operator for a void pointer will cause undefined behavior.
- V773. Function exited without releasing the pointer/handle. A memory/resource leak is possible.
- V774. Pointer was used after the memory was released.
- V775. It is suspicious that the BSTR data type is compared using a relational operator.
- V776. Potentially infinite loop. The variable in the loop exit condition does not change its value between iterations.
- V777. Dangerous widening type conversion from an array of derived-class objects to a base-class pointer.
- V778. Two similar code fragments. Perhaps, it is a typo and 'X' variable should be used instead of 'Y'.
- V779. Unreachable code was detected. It is possible that an error is present.
- V780. The object of non-passive (non-PDS) type cannot be used with the function.
- V781. Value of a variable is checked after it is used. Possible error in program's logic. Check lines: N1, N2.
- V782. It is pointless to compute the distance between the elements of different arrays.
- V783. Possible dereference of invalid iterator 'X'.
- V784. The size of the bit mask is less than the size of the first operand. This will cause the loss of the higher bits.
- V785. Constant expression in switch statement.
- V786. Assigning the value C to the X variable looks suspicious. The value range of the variable: [A, B].
- V787. Wrong variable is probably used in the for operator as an index.
- V788. Review captured variable in lambda expression.
- V789. Iterators for the container, used in the range-based for loop, become invalid upon a function call.
- V790. It is suspicious that the assignment operator takes an object by a non-constant reference and returns this object.
- V791. The initial value of the index in the nested loop equals 'i'. Consider using 'i + 1' instead.
- V792. The function located to the right of the '|' and '&' operators will be called regardless of the value of the left operand. Consider using '||' and '&&' instead.
- V793. It is suspicious that the result of the statement is a part of the condition. Perhaps, this statement should have been compared with something else.
- V794. The assignment operator should be protected from the case of 'this == &src'.
- V795. Size of the 'time_t' type is not 64 bits. After the year 2038, the program will work incorrectly.
- V796. A 'break' statement is probably missing in a 'switch' statement.
- V797. The function is used as if it returned a bool type. The return value of the function should probably be compared with std::string::npos.
- V798. The size of the dynamic array can be less than the number of elements in the initializer.
- V799. Variable is not used after memory is allocated for it. Consider checking the use of this variable.
- V1001. Variable is assigned but not used by the end of the function.
- V1002. Class that contains pointers, constructor and destructor is copied by the automatically generated operator= or copy constructor.
- V1003. Macro expression is dangerous or suspicious.
- V1004. Pointer was used unsafely after its check for nullptr.
- V1005. The resource was acquired using 'X' function but was released using incompatible 'Y' function.
- V1006. Several shared_ptr objects are initialized by the same pointer. A double memory deallocation will occur.
- V1007. Value from the uninitialized optional is used. It may be an error.
- V1008. No more than one iteration of the loop will be performed. Consider inspecting the 'for' operator.
- V1009. Check the array initialization. Only the first element is initialized explicitly.
- V1010. Unchecked tainted data is used in expression.
- V1011. Function execution could be deferred. Consider specifying execution policy explicitly.
- V1012. The expression is always false. Overflow check is incorrect.
- V1013. Suspicious subexpression in a sequence of similar comparisons.
- V1014. Structures with members of real type are compared byte-wise.
- V1015. Suspicious simultaneous use of bitwise and logical operators.
- V1016. The value is out of range of enum values. This causes unspecified or undefined behavior.
- V1017. Variable of the 'string_view' type references a temporary object, which will be removed after evaluation of an expression.
- V1018. Usage of a suspicious mutex wrapper. It is probably unused, uninitialized, or already locked.
- V1019. Compound assignment expression is used inside condition.
- V1020. Function exited without performing epilogue actions. It is possible that there is an error.
- V1021. The variable is assigned the same value on several loop iterations.
- V1022. Exception was thrown by pointer. Consider throwing it by value instead.
- V1023. A pointer without owner is added to the container by the 'emplace_back' method. A memory leak will occur in case of an exception.
- V1024. Potential use of invalid data. The stream is checked for EOF before reading from it but is not checked after reading.
- V1025. New variable with default value is created instead of 'std::unique_lock' that locks on the mutex.
- V1026. The variable is incremented in the loop. Undefined behavior will occur in case of signed integer overflow.
- V1027. Pointer to an object of the class is cast to unrelated class.
- V1028. Possible overflow. Consider casting operands, not the result.
- V1029. Numeric Truncation Error. Return value of function is written to N-bit variable.
- V1030. Variable is used after it is moved.
- V1031. Function is not declared. The passing of data to or from this function may be affected.
- V1032. Pointer is cast to a more strictly aligned pointer type.
- V1033. Variable is declared as auto in C. Its default type is int.
- V1034. Do not use real-type variables as loop counters.
- V1035. Only values returned from fgetpos() can be used as arguments to fsetpos().
- V1036. Potentially unsafe double-checked locking.
- V1037. Two or more case-branches perform the same actions.
- V1038. It is suspicious that a char or string literal is added to a pointer.
- V1039. Character escape is used in multicharacter literal. This causes implementation-defined behavior.
- V1040. Possible typo in the spelling of a pre-defined macro name.
- V1041. Class member is initialized with dangling reference.
- V1042. This file is marked with copyleft license, which requires you to open the derived source code.
- V1043. A global object variable is declared in the header. Multiple copies of it will be created in all translation units that include this header file.
- V1044. Loop break conditions do not depend on the number of iterations.
- V1045. The DllMain function throws an exception. Consider wrapping the throw operator in a try..catch block.
- V1046. Unsafe usage of the 'bool' and integer types together in the operation '&='.
- V1047. Lifetime of the lambda is greater than lifetime of the local variable captured by reference.
- V1048. Variable 'foo' was assigned the same value.
- V1049. The 'foo' include guard is already defined in the 'bar1.h' header. The 'bar2.h' header will be excluded from compilation.
- V1050. Uninitialized class member is used when initializing the base class.
- V1051. It is possible that an assigned variable should be checked in the next condition. Consider checking for typos.
- V1052. Declaring virtual methods in a class marked as 'final' is pointless.
- V1053. Calling the 'foo' virtual function in the constructor/destructor may lead to unexpected result at runtime.
- V1054. Object slicing. Derived class object was copied to the base class object.
- V1055. The 'sizeof' expression returns the size of the container type, not the number of elements. Consider using the 'size()' function.
- V1056. The predefined identifier '__func__' always contains the string 'operator()' inside function body of the overloaded 'operator()'.
- V1057. Pseudo random sequence is the same at every program run. Consider assigning the seed to a value not known at compile-time.
- V1058. Nonsensical comparison of two different functions' addresses.
- V1059. Macro name overrides a keyword/reserved name. This may lead to undefined behavior.
- V1060. Passing 'BSTR ' to the 'SysAllocString' function may lead to incorrect object creation.
- V1061. Extending 'std' or 'posix' namespace may result in undefined behavior.
- V1062. Class defines a custom new or delete operator. The opposite operator must also be defined.
- V1063. The modulo by 1 operation is meaningless. The result will always be zero.
- V1064. The left operand of integer division is less than the right one. The result will always be zero.
- V1065. Expression can be simplified: check similar operands.
- V1066. The 'SysFreeString' function should be called only for objects of the 'BSTR' type.
- V1067. Throwing from exception constructor may lead to unexpected behavior.
- V1068. Do not define an unnamed namespace in a header file.
- V1069. Do not concatenate string literals with different prefixes.
- V1070. Signed value is converted to an unsigned one with subsequent expansion to a larger type in ternary operator.
- V1071. Return value is not always used. Consider inspecting the 'foo' function.
- V1072. Buffer needs to be securely cleared on all execution paths.
- V1073. Check the following code block after the 'if' statement. Consider checking for typos.
- V1074. Boundary between numeric escape sequence and string is unclear. The escape sequence ends with a letter and the next character is also a letter. Check for typos.
- V1075. The function expects the file to be opened in one mode, but it was opened in different mode.
- V1076. Code contains invisible characters that may alter its logic. Consider enabling the display of invisible characters in the code editor.
- V1077. Constructor contains potentially uninitialized members.
- V1078. An empty container is iterated. The loop will not be executed.
- V1079. Parameter of 'std::stop_token' type is not used inside function's body.
- V1080. Call of 'std::is_constant_evaluated' function always returns the same value.
- V1081. Argument of abs() function is minimal negative value. Such absolute value can't be represented in two's complement. This leads to undefined behavior.
- V1082. Function marked as 'noreturn' may return control. This will result in undefined behavior.
- V1083. Signed integer overflow in arithmetic expression. This leads to undefined behavior.
- V1084. The expression is always true/false. The value is out of range of enum values.
- V1085. Negative value is implicitly converted to unsigned integer type in arithmetic expression.
- V1086. Call of the 'Foo' function will lead to buffer underflow.
- V1087. Upper bound of case range is less than its lower bound. This case may be unreachable.
- V1088. No objects are passed to the 'std::scoped_lock' constructor. No locking will be performed. This can cause concurrency issues.
- V1089. Waiting on condition variable without predicate. A thread can wait indefinitely or experience a spurious wake-up.
- V1090. The 'std::uncaught_exception' function is deprecated since C++17 and is removed in C++20. Consider replacing this function with 'std::uncaught_exceptions'.
- V1091. The pointer is cast to an integer type of a larger size. Casting pointer to a type of a larger size is an implementation-defined behavior.
- V1092. Recursive function call during the static/thread_local variable initialization might occur. This may lead to undefined behavior.
- V1093. The result of the right shift operation will always be 0. The right operand is greater than or equal to the number of bits in the left operand.
- V1094. Conditional escape sequence in literal. Its representation is implementation-defined.
- V1095. Usage of potentially invalid handle. The value should be non-negative.
- V1096. Variable with static storage duration is declared inside the inline function with external linkage. This may lead to ODR violation.
- V1097. Line splice results in a character sequence that matches the syntax of a universal-character-name. Using this sequence lead to undefined behavior.
- V1098. The 'emplace' / 'insert' function call contains potentially dangerous move operation. Moved object can be destroyed even if there is no insertion.
- V1099. Using the function of uninitialized derived class while initializing the base class will lead to undefined behavior.
- V1100. Unreal Engine. Declaring a pointer to a type derived from 'UObject' in a class that is not derived from 'UObject' is dangerous. The pointer may start pointing to an invalid object after garbage collection.
- V1101. Changing the default argument of a virtual function parameter in a derived class may result in unexpected behavior.
- V1102. Unreal Engine. Violation of naming conventions may cause Unreal Header Tool to work incorrectly.
- V1103. The values of padding bytes are unspecified. Comparing objects with padding using 'memcmp' may lead to unexpected result.
- V1104. Priority of the 'M' operator is higher than that of the 'N' operator. Possible missing parentheses.
- V1105. Suspicious string modification using the 'operator+='. The right operand is implicitly converted to a character type.
- V1106. Qt. Class inherited from 'QObject' should contain at least one constructor that takes a pointer to 'QObject'.
- V1107. Function was declared as accepting unspecified number of parameters. Consider explicitly specifying the function parameters list.
General Analysis (C#)
- V3001. There are identical sub-expressions to the left and to the right of the 'foo' operator.
- V3002. The switch statement does not cover all values of the enum.
- V3003. The use of 'if (A) {...} else if (A) {...}' pattern was detected. There is a probability of logical error presence.
- V3004. The 'then' statement is equivalent to the 'else' statement.
- V3005. The 'x' variable is assigned to itself.
- V3006. The object was created but it is not being used. The 'throw' keyword could be missing.
- V3007. Odd semicolon ';' after 'if/for/while' operator.
- V3008. The 'x' variable is assigned values twice successively. Perhaps this is a mistake.
- V3009. It's odd that this method always returns one and the same value of NN.
- V3010. The return value of function 'Foo' is required to be utilized.
- V3011. Two opposite conditions were encountered. The second condition is always false.
- V3012. The '?:' operator, regardless of its conditional expression, always returns one and the same value.
- V3013. It is odd that the body of 'Foo_1' function is fully equivalent to the body of 'Foo_2' function.
- V3014. It is likely that a wrong variable is being incremented inside the 'for' operator. Consider reviewing 'X'.
- V3015. It is likely that a wrong variable is being compared inside the 'for' operator. Consider reviewing 'X'.
- V3016. The variable 'X' is being used for this loop and for the outer loop.
- V3017. A pattern was detected: A || (A && ...). The expression is excessive or contains a logical error.
- V3018. Consider inspecting the application's logic. It's possible that 'else' keyword is missing.
- V3019. It is possible that an incorrect variable is compared with null after type conversion using 'as' keyword.
- V3020. An unconditional 'break/continue/return/goto' within a loop.
- V3021. There are two 'if' statements with identical conditional expressions. The first 'if' statement contains method return. This means that the second 'if' statement is senseless.
- V3022. Expression is always true/false.
- V3023. Consider inspecting this expression. The expression is excessive or contains a misprint.
- V3024. An odd precise comparison. Consider using a comparison with defined precision: Math.Abs(A - B) < Epsilon or Math.Abs(A - B) > Epsilon.
- V3025. Incorrect format. Consider checking the N format items of the 'Foo' function.
- V3026. The constant NN is being utilized. The resulting value could be inaccurate. Consider using the KK constant.
- V3027. The variable was utilized in the logical expression before it was verified against null in the same logical expression.
- V3028. Consider inspecting the 'for' operator. Initial and final values of the iterator are the same.
- V3029. The conditional expressions of the 'if' statements situated alongside each other are identical.
- V3030. Recurring check. This condition was already verified in previous line.
- V3031. An excessive check can be simplified. The operator '||' operator is surrounded by opposite expressions 'x' and '!x'.
- V3032. Waiting on this expression is unreliable, as compiler may optimize some of the variables. Use volatile variable(s) or synchronization primitives to avoid this.
- V3033. It is possible that this 'else' branch must apply to the previous 'if' statement.
- V3034. Consider inspecting the expression. Probably the '!=' should be used here.
- V3035. Consider inspecting the expression. Probably the '+=' should be used here.
- V3036. Consider inspecting the expression. Probably the '-=' should be used here.
- V3037. An odd sequence of assignments of this kind: A = B; B = A;
- V3038. The argument was passed to method several times. It is possible that another argument should be passed instead.
- V3039. Consider inspecting the 'Foo' function call. Defining an absolute path to the file or directory is considered a poor style.
- V3040. The expression contains a suspicious mix of integer and real types.
- V3041. The expression was implicitly cast from integer type to real type. Consider utilizing an explicit type cast to avoid the loss of a fractional part.
- V3042. Possible NullReferenceException. The '?.' and '.' operators are used for accessing members of the same object.
- V3043. The code's operational logic does not correspond with its formatting.
- V3044. WPF: writing and reading are performed on a different Dependency Properties.
- V3045. WPF: the names of the property registered for DependencyProperty, and of the property used to access it, do not correspond with each other.
- V3046. WPF: the type registered for DependencyProperty does not correspond with the type of the property used to access it.
- V3047. WPF: A class containing registered property does not correspond with a type that is passed as the ownerType.type.
- V3048. WPF: several Dependency Properties are registered with a same name within the owner type.
- V3049. WPF: readonly field of 'DependencyProperty' type is not initialized.
- V3050. Possibly an incorrect HTML. The </XX> closing tag was encountered, while the </YY> tag was expected.
- V3051. An excessive type cast or check. The object is already of the same type.
- V3052. The original exception object was swallowed. Stack of original exception could be lost.
- V3053. An excessive expression. Examine the substrings "abc" and "abcd".
- V3054. Potentially unsafe double-checked locking. Use volatile variable(s) or synchronization primitives to avoid this.
- V3055. Suspicious assignment inside the condition expression of 'if/while/for' operator.
- V3056. Consider reviewing the correctness of 'X' item's usage.
- V3057. Function receives an odd argument.
- V3058. An item with the same key has already been added.
- V3059. Consider adding '[Flags]' attribute to the enum.
- V3060. A value of variable is not modified. Consider inspecting the expression. It is possible that other value should be present instead of '0'.
- V3061. Parameter 'A' is always rewritten in method body before being used.
- V3062. An object is used as an argument to its own method. Consider checking the first actual argument of the 'Foo' method.
- V3063. A part of conditional expression is always true/false if it is evaluated.
- V3064. Division or mod division by zero.
- V3065. Parameter is not utilized inside method's body.
- V3066. Possible incorrect order of arguments passed to method.
- V3067. It is possible that 'else' block was forgotten or commented out, thus altering the program's operation logics.
- V3068. Calling overrideable class member from constructor is dangerous.
- V3069. It's possible that the line was commented out improperly, thus altering the program's operation logics.
- V3070. Uninitialized variables are used when initializing the 'A' variable.
- V3071. The object is returned from inside 'using' block. 'Dispose' will be invoked before exiting method.
- V3072. The 'A' class containing IDisposable members does not itself implement IDisposable.
- V3073. Not all IDisposable members are properly disposed. Call 'Dispose' when disposing 'A' class.
- V3074. The 'A' class contains 'Dispose' method. Consider making it implement 'IDisposable' interface.
- V3075. The operation is executed 2 or more times in succession.
- V3076. Comparison with 'double.NaN' is meaningless. Use 'double.IsNaN()' method instead.
- V3077. Property setter / event accessor does not utilize its 'value' parameter.
- V3078. Sorting keys priority will be reversed relative to the order of 'OrderBy' method calls. Perhaps, 'ThenBy' should be used instead.
- V3079. The 'ThreadStatic' attribute is applied to a non-static 'A' field and will be ignored.
- V3080. Possible null dereference.
- V3081. The 'X' counter is not used inside a nested loop. Consider inspecting usage of 'Y' counter.
- V3082. The 'Thread' object is created but is not started. It is possible that a call to 'Start' method is missing.
- V3083. Unsafe invocation of event, NullReferenceException is possible. Consider assigning event to a local variable before invoking it.
- V3084. Anonymous function is used to unsubscribe from event. No handlers will be unsubscribed, as a separate delegate instance is created for each anonymous function declaration.
- V3085. The name of 'X' field/property in a nested type is ambiguous. The outer type contains static field/property with identical name.
- V3086. Variables are initialized through the call to the same function. It's probably an error or un-optimized code.
- V3087. Type of variable enumerated in 'foreach' is not guaranteed to be castable to the type of collection's elements.
- V3088. The expression was enclosed by parentheses twice: ((expression)). One pair of parentheses is unnecessary or misprint is present.
- V3089. Initializer of a field marked by [ThreadStatic] attribute will be called once on the first accessing thread. The field will have default value on different threads.
- V3090. Unsafe locking on an object.
- V3091. Empirical analysis. It is possible that a typo is present inside the string literal. The 'foo' word is suspicious.
- V3092. Range intersections are possible within conditional expressions.
- V3093. The operator evaluates both operands. Perhaps a short-circuit operator should be used instead.
- V3094. Possible exception when deserializing type. The Ctor(SerializationInfo, StreamingContext) constructor is missing.
- V3095. The object was used before it was verified against null. Check lines: N1, N2.
- V3096. Possible exception when serializing type. [Serializable] attribute is missing.
- V3097. Possible exception: type marked by [Serializable] contains non-serializable members not marked by [NonSerialized].
- V3098. The 'continue' operator will terminate 'do { ... } while (false)' loop because the condition is always false.
- V3099. Not all the members of type are serialized inside 'GetObjectData' method.
- V3100. NullReferenceException is possible. Unhandled exceptions in destructor lead to termination of runtime.
- V3101. Potential resurrection of 'this' object instance from destructor. Without re-registering for finalization, destructor will not be called a second time on resurrected object.
- V3102. Suspicious access to element by a constant index inside a loop.
- V3103. A private Ctor(SerializationInfo, StreamingContext) constructor in unsealed type will not be accessible when deserializing derived types.
- V3104. The 'GetObjectData' implementation in unsealed type is not virtual, incorrect serialization of derived type is possible.
- V3105. The 'a' variable was used after it was assigned through null-conditional operator. NullReferenceException is possible.
- V3106. Possibly index is out of bound.
- V3107. Identical expression to the left and to the right of compound assignment.
- V3108. It is not recommended to return null or throw exceptions from 'ToString()' method.
- V3109. The same sub-expression is present on both sides of the operator. The expression is incorrect or it can be simplified.
- V3110. Possible infinite recursion.
- V3111. Checking value for null will always return false when generic type is instantiated with a value type.
- V3112. An abnormality within similar comparisons. It is possible that a typo is present inside the expression.
- V3113. Consider inspecting the loop expression. It is possible that different variables are used inside initializer and iterator.
- V3114. IDisposable object is not disposed before method returns.
- V3115. It is not recommended to throw exceptions from 'Equals(object obj)' method.
- V3116. Consider inspecting the 'for' operator. It's possible that the loop will be executed incorrectly or won't be executed at all.
- V3117. Constructor parameter is not used.
- V3118. A component of TimeSpan is used, which does not represent full time interval. Possibly 'Total*' value was intended instead.
- V3119. Calling a virtual (overridden) event may lead to unpredictable behavior. Consider implementing event accessors explicitly or use 'sealed' keyword.
- V3120. Potentially infinite loop. The variable from the loop exit condition does not change its value between iterations.
- V3121. An enumeration was declared with 'Flags' attribute, but does not set any initializers to override default values.
- V3122. Uppercase (lowercase) string is compared with a different lowercase (uppercase) string.
- V3123. Perhaps the '??' operator works in a different way than it was expected. Its priority is lower than priority of other operators in its left part.
- V3124. Appending an element and checking for key uniqueness is performed on two different variables.
- V3125. The object was used after it was verified against null. Check lines: N1, N2.
- V3126. Type implementing IEquatable<T> interface does not override 'GetHashCode' method.
- V3127. Two similar code fragments were found. Perhaps, this is a typo and 'X' variable should be used instead of 'Y'.
- V3128. The field (property) is used before it is initialized in constructor.
- V3129. The value of the captured variable will be overwritten on the next iteration of the loop in each instance of anonymous function that captures it.
- V3130. Priority of the '&&' operator is higher than that of the '||' operator. Possible missing parentheses.
- V3131. The expression is checked for compatibility with the type 'A', but is casted to the 'B' type.
- V3132. A terminal null is present inside a string. The '\0xNN' characters were encountered. Probably meant: '\xNN'.
- V3133. Postfix increment/decrement is senseless because this variable is overwritten.
- V3134. Shift by N bits is greater than the size of type.
- V3135. The initial value of the index in the nested loop equals 'i'. Consider using 'i + 1' instead.
- V3136. Constant expression in switch statement.
- V3137. The variable is assigned but is not used by the end of the function.
- V3138. String literal contains potential interpolated expression.
- V3139. Two or more case-branches perform the same actions.
- V3140. Property accessors use different backing fields.
- V3141. Expression under 'throw' is a potential null, which can lead to NullReferenceException.
- V3142. Unreachable code detected. It is possible that an error is present.
- V3143. The 'value' parameter is rewritten inside a property setter, and is not used after that.
- V3144. This file is marked with copyleft license, which requires you to open the derived source code.
- V3145. Unsafe dereference of a WeakReference target. The object could have been garbage collected before the 'Target' property was accessed.
- V3146. Possible null dereference. A method can return default null value.
- V3147. Non-atomic modification of volatile variable.
- V3148. Casting potential 'null' value to a value type can lead to NullReferenceException.
- V3149. Dereferencing the result of 'as' operator can lead to NullReferenceException.
- V3150. Loop break conditions do not depend on the number of iterations.
- V3151. Potential division by zero. Variable was used as a divisor before it was compared to zero. Check lines: N1, N2.
- V3152. Potential division by zero. Variable was compared to zero before it was used as a divisor. Check lines: N1, N2.
- V3153. Dereferencing the result of null-conditional access operator can lead to NullReferenceException.
- V3154. The 'a % b' expression always evaluates to 0.
- V3155. The expression is incorrect or it can be simplified.
- V3156. The argument of the method is not expected to be null.
- V3157. Suspicious division. Absolute value of the left operand is less than the right operand.
- V3158. Suspicious division. Absolute values of both operands are equal.
- V3159. Modified value of the operand is not used after the increment/decrement operation.
- V3160. Argument of incorrect type is passed to the 'Enum.HasFlag' method.
- V3161. Comparing value type variables with 'ReferenceEquals' is incorrect because compared values will be boxed.
- V3162. Suspicious return of an always empty collection.
- V3163. An exception handling block does not contain any code.
- V3164. Exception classes should be publicly accessible.
- V3165. The expression of the 'char' type is passed as an argument of the 'A' type whereas similar overload with the string parameter exists.
- V3166. Calling the 'SingleOrDefault' method may lead to 'InvalidOperationException'.
- V3167. Parameter of 'CancellationToken' type is not used inside function's body.
- V3168. Awaiting on expression with potential null value can lead to throwing of 'NullReferenceException'.
- V3169. Suspicious return of a local reference variable which always equals null.
- V3170. Both operands of the '??' operator are identical.
- V3171. Potentially negative value is used as the size of an array.
- V3172. The 'if/if-else/for/while/foreach' statement and code block after it are not related. Inspect the program's logic.
- V3173. Possible incorrect initialization of variable. Consider verifying the initializer.
- V3174. Suspicious subexpression in a sequence of similar comparisons.
- V3175. Locking operations must be performed on the same thread. Using 'await' in a critical section may lead to a lock being released on a different thread.
- V3176. The '&=' or '|=' operator is redundant because the right operand is always true/false.
- V3177. Logical literal belongs to second operator with a higher priority. It is possible literal was intended to belong to '??' operator instead.
- V3178. Calling method or accessing property of potentially disposed object may result in exception.
- V3179. Calling element access method for potentially empty collection may result in exception.
- V3180. The 'HasFlag' method always returns 'true' because the value '0' is passed as its argument.
- V3181. The result of '&' operator is '0' because one of the operands is '0'.
- V3182. The result of '&' operator is always '0'.
- V3183. Code formatting implies that the statement should not be a part of the 'then' branch that belongs to the preceding 'if' statement.
- V3184. The argument's value is greater than the size of the collection. Passing the value into the 'Foo' method will result in an exception.
- V3185. An argument containing a file path could be mixed up with another argument. The other function parameter expects a file path instead.
- V3186. The arguments violate the bounds of collection. Passing these values into the method will result in an exception.
- V3187. Parts of an SQL query are not delimited by any separators or whitespaces. Executing this query may lead to an error.
- V3188. Unity Engine. The value of an expression is a potentially destroyed Unity object or null. Member invocation on this value may lead to an exception.
- V3189. The assignment to a member of the readonly field will have no effect when the field is of a value type. Consider restricting the type parameter to reference types.
- V3190. Concurrent modification of a variable may lead to errors.
- V3191. Iteration through collection makes no sense because it is always empty.
- V3192. Type member is used in the 'GetHashCode' method but is missing from the 'Equals' method.
- V3193. Data processing results are potentially used before asynchronous output reading is complete. Consider calling 'WaitForExit' overload with no arguments before using the data.
- V3194. Calling 'OfType' for collection will return an empty collection. It is not possible to cast collection elements to the type parameter.
- V3195. Collection initializer implicitly calls 'Add' method. Using it on member with default value of null will result in null dereference exception.
- V3196. Parameter is not utilized inside the method body, but an identifier with a similar name is used inside the same method.
- V3197. The compared value inside the 'Object.Equals' override is converted to a different type that does not contain the override.
- V3198. The variable is assigned the same value that it already holds.
General Analysis (Java)
- V6001. There are identical sub-expressions to the left and to the right of the 'foo' operator.
- V6002. The switch statement does not cover all values of the enum.
- V6003. The use of 'if (A) {...} else if (A) {...}' pattern was detected. There is a probability of logical error presence.
- V6004. The 'then' statement is equivalent to the 'else' statement.
- V6005. The 'x' variable is assigned to itself.
- V6006. The object was created but it is not being used. The 'throw' keyword could be missing.
- V6007. Expression is always true/false.
- V6008. Potential null dereference.
- V6009. Function receives an odd argument.
- V6010. The return value of function 'Foo' is required to be utilized.
- V6011. The expression contains a suspicious mix of integer and real types.
- V6012. The '?:' operator, regardless of its conditional expression, always returns one and the same value.
- V6013. Comparison of arrays, strings, collections by reference. Possibly an equality comparison was intended.
- V6014. It's odd that this method always returns one and the same value of NN.
- V6015. Consider inspecting the expression. Probably the '!='/'-='/'+=' should be used here.
- V6016. Suspicious access to element by a constant index inside a loop.
- V6017. The 'X' counter is not used inside a nested loop. Consider inspecting usage of 'Y' counter.
- V6018. Constant expression in switch statement.
- V6019. Unreachable code detected. It is possible that an error is present.
- V6020. Division or mod division by zero.
- V6021. The value is assigned to the 'x' variable but is not used.
- V6022. Parameter is not used inside method's body.
- V6023. Parameter 'A' is always rewritten in method body before being used.
- V6024. The 'continue' operator will terminate 'do { ... } while (false)' loop because the condition is always false.
- V6025. Possibly index is out of bound.
- V6026. This value is already assigned to the 'b' variable.
- V6027. Variables are initialized through the call to the same function. It's probably an error or un-optimized code.
- V6028. Identical expression to the left and to the right of compound assignment.
- V6029. Possible incorrect order of arguments passed to method.
- V6030. The function located to the right of the '|' and '&' operators will be called regardless of the value of the left operand. Consider using '||' and '&&' instead.
- V6031. The variable 'X' is being used for this loop and for the outer loop.
- V6032. It is odd that the body of 'Foo_1' function is fully equivalent to the body of 'Foo_2' function.
- V6033. An item with the same key has already been added.
- V6034. Shift by N bits is inconsistent with the size of type.
- V6035. Double negation is present in the expression: !!x.
- V6036. The value from the uninitialized optional is used.
- V6037. An unconditional 'break/continue/return/goto' within a loop.
- V6038. Comparison with 'double.NaN' is meaningless. Use 'double.isNaN()' method instead.
- V6039. There are two 'if' statements with identical conditional expressions. The first 'if' statement contains method return. This means that the second 'if' statement is senseless.
- V6040. The code's operational logic does not correspond with its formatting.
- V6041. Suspicious assignment inside the conditional expression of 'if/while/do...while' statement.
- V6042. The expression is checked for compatibility with type 'A', but is cast to type 'B'.
- V6043. Consider inspecting the 'for' operator. Initial and final values of the iterator are the same.
- V6044. Postfix increment/decrement is senseless because this variable is overwritten.
- V6045. Suspicious subexpression in a sequence of similar comparisons.
- V6046. Incorrect format. Consider checking the N format items of the 'Foo' function.
- V6047. It is possible that this 'else' branch must apply to the previous 'if' statement.
- V6048. This expression can be simplified. One of the operands in the operation equals NN. Probably it is a mistake.
- V6049. Classes that define 'equals' method must also define 'hashCode' method.
- V6050. Class initialization cycle is present.
- V6051. Use of jump statements in 'finally' block can lead to the loss of unhandled exceptions.
- V6052. Calling an overridden method in parent-class constructor may lead to use of uninitialized data.
- V6053. Collection is modified while iteration is in progress. ConcurrentModificationException may occur.
- V6054. Classes should not be compared by their name.
- V6055. Expression inside assert statement can change object's state.
- V6056. Implementation of 'compareTo' overloads the method from a base class. Possibly, an override was intended.
- V6057. Consider inspecting this expression. The expression is excessive or contains a misprint.
- V6058. Comparing objects of incompatible types.
- V6059. Odd use of special character in regular expression. Possibly, it was intended to be escaped.
- V6060. The reference was used before it was verified against null.
- V6061. The used constant value is represented by an octal form.
- V6062. Possible infinite recursion.
- V6063. Odd semicolon ';' after 'if/for/while' operator.
- V6064. Suspicious invocation of Thread.run().
- V6065. A non-serializable class should not be serialized.
- V6066. Passing objects of incompatible types to the method of collection.
- V6067. Two or more case-branches perform the same actions.
- V6068. Suspicious use of BigDecimal class.
- V6069. Unsigned right shift assignment of negative 'byte' / 'short' value.
- V6070. Unsafe synchronization on an object.
- V6071. This file is marked with copyleft license, which requires you to open the derived source code.
- V6072. Two similar code fragments were found. Perhaps, this is a typo and 'X' variable should be used instead of 'Y'.
- V6073. It is not recommended to return null or throw exceptions from 'toString' / 'clone' methods.
- V6074. Non-atomic modification of volatile variable.
- V6075. The signature of method 'X' does not conform to serialization requirements.
- V6076. Recurrent serialization will use cached object state from first serialization.
- V6077. A suspicious label is present inside a switch(). It is possible that these are misprints and 'default:' label should be used instead.
- V6078. Potential Java SE API compatibility issue.
- V6079. Value of variable is checked after use. Potential logical error is present. Check lines: N1, N2.
- V6080. Consider checking for misprints. It's possible that an assigned variable should be checked in the next condition.
- V6081. Annotation that does not have 'RUNTIME' retention policy will not be accessible through Reflection API.
- V6082. Unsafe double-checked locking.
- V6083. Serialization order of fields should be preserved during deserialization.
- V6084. Suspicious return of an always empty collection.
- V6085. An abnormality within similar comparisons. It is possible that a typo is present inside the expression.
- V6086. Suspicious code formatting. 'else' keyword is probably missing.
- V6087. InvalidClassException may occur during deserialization.
- V6088. Result of this expression will be implicitly cast to 'Type'. Check if program logic handles it correctly.
- V6089. It's possible that the line was commented out improperly, thus altering the program's operation logics.
- V6090. Field 'A' is being used before it was initialized.
- V6091. Suspicious getter/setter implementation. The 'A' field should probably be returned/assigned instead.
- V6092. A resource is returned from try-with-resources statement. It will be closed before the method exits.
- V6093. Automatic unboxing of a variable may cause NullPointerException.
- V6094. The expression was implicitly cast from integer type to real type. Consider utilizing an explicit type cast to avoid the loss of a fractional part.
- V6095. Thread.sleep() inside synchronized block/method may cause decreased performance.
- V6096. An odd precise comparison. Consider using a comparison with defined precision: Math.abs(A - B) < Epsilon or Math.abs(A - B) > Epsilon.
- V6097. Lowercase 'L' at the end of a long literal can be mistaken for '1'.
- V6098. The method does not override another method from the base class.
- V6099. The initial value of the index in the nested loop equals 'i'. Consider using 'i + 1' instead.
- V6100. An object is used as an argument to its own method. Consider checking the first actual argument of the 'Foo' method.
- V6101. compareTo()-like methods can return not only the values -1, 0 and 1, but any values.
- V6102. Inconsistent synchronization of a field. Consider synchronizing the field on all usages.
- V6103. Ignored InterruptedException could lead to delayed thread shutdown.
- V6104. A pattern was detected: A || (A && ...). The expression is excessive or contains a logical error.
- V6105. Consider inspecting the loop expression. It is possible that different variables are used inside initializer and iterator.
- V6106. Casting expression to 'X' type before implicitly casting it to other type may be excessive or incorrect.
- V6107. The constant NN is being utilized. The resulting value could be inaccurate. Consider using the KK constant.
- V6108. Do not use real-type variables in 'for' loop counters.
- V6109. Potentially predictable seed is used in pseudo-random number generator.
- V6110. Using an environment variable could be unsafe or unreliable. Consider using trusted system property instead
- V6111. Potentially negative value is used as the size of an array.
- V6112. Calling the 'getClass' method repeatedly or on the value of the '.class' literal will always return the instance of the 'Class<Class>' type.
Micro-Optimizations (C++)
- V801. Decreased performance. It is better to redefine the N function argument as a reference. Consider replacing 'const T' with 'const .. &T' / 'const .. *T'.
- V802. On 32-bit/64-bit platform, structure size can be reduced from N to K bytes by rearranging the fields according to their sizes in decreasing order.
- V803. Decreased performance. It is more effective to use the prefix form of ++it. Replace iterator++ with ++iterator.
- V804. Decreased performance. The 'Foo' function is called twice in the specified expression to calculate length of the same string.
- V805. Decreased performance. It is inefficient to identify an empty string by using 'strlen(str) > 0' construct. A more efficient way is to check: str[0] != '\0'.
- V806. Decreased performance. The expression of strlen(MyStr.c_str()) kind can be rewritten as MyStr.length().
- V807. Decreased performance. Consider creating a pointer/reference to avoid using the same expression repeatedly.
- V808. An array/object was declared but was not utilized.
- V809. Verifying that a pointer value is not NULL is not required. The 'if (ptr != NULL)' check can be removed.
- V810. Decreased performance. The 'A' function was called several times with identical arguments. The result should possibly be saved to a temporary variable, which then could be used while calling the 'B' function.
- V811. Decreased performance. Excessive type casting: string -> char * -> string.
- V812. Decreased performance. Ineffective use of the 'count' function. It can possibly be replaced by the call to the 'find' function.
- V813. Decreased performance. The argument should probably be rendered as a constant pointer/reference.
- V814. Decreased performance. The 'strlen' function was called multiple times inside the body of a loop.
- V815. Decreased performance. Consider replacing the expression 'AA' with 'BB'.
- V816. It is more efficient to catch exception by reference rather than by value.
- V817. It is more efficient to search for 'X' character rather than a string.
- V818. It is more efficient to use an initialization list rather than an assignment operator.
- V819. Decreased performance. Memory is allocated and released multiple times inside the loop body.
- V820. The variable is not used after copying. Copying can be replaced with move/swap for optimization.
- V821. The variable can be constructed in a lower level scope.
- V822. Decreased performance. A new object is created, while a reference to an object is expected.
- V823. Decreased performance. Object may be created in-place in a container. Consider replacing methods: 'insert' -> 'emplace', 'push_*' -> 'emplace_*'.
- V824. It is recommended to use the 'make_unique/make_shared' function to create smart pointers.
- V825. Expression is equivalent to moving one unique pointer to another. Consider using 'std::move' instead.
- V826. Consider replacing standard container with a different one.
- V827. Maximum size of a vector is known at compile time. Consider pre-allocating it by calling reserve(N).
- V828. Decreased performance. Moving an object in a return statement prevents copy elision.
- V829. Lifetime of the heap-allocated variable is limited to the current function's scope. Consider allocating it on the stack instead.
- V830. Decreased performance. Consider replacing the use of 'std::optional::value()' with either the '*' or '->' operator.
- V831. Decreased performance. Consider replacing the call to the 'at()' method with the 'operator[]'.
- V832. It's better to use '= default;' syntax instead of empty body.
- V833. Using 'std::move' function's with const object disables move semantics.
- V834. Incorrect type of a loop variable. This leads to the variable binding to a temporary object instead of a range element.
- V835. Passing cheap-to-copy argument by reference may lead to decreased performance.
- V836. Expression's value is copied at the variable declaration. The variable is never modified. Consider declaring it as a reference.
- V837. The 'emplace' / 'insert' function does not guarantee that arguments will not be copied or moved if there is no insertion. Consider using the 'try_emplace' function.
- V838. Temporary object is constructed during lookup in ordered associative container. Consider using a container with heterogeneous lookup to avoid construction of temporary objects.
- V839. Function returns a constant value. This may interfere with move semantics.
Micro-Optimizations (C#)
- V4001. Unity Engine. Boxing inside a frequently called method may decrease performance.
- V4002. Unity Engine. Avoid storing consecutive concatenations inside a single string in performance-sensitive context. Consider using StringBuilder to improve performance.
- V4003. Unity Engine. Avoid capturing variable in performance-sensitive context. This can lead to decreased performance.
- V4004. Unity Engine. New array object is returned from method or property. Using such member in performance-sensitive context can lead to decreased performance.
- V4005. Unity Engine. The expensive operation is performed inside method or property. Using such member in performance-sensitive context can lead to decreased performance.
Diagnosis of 64-bit errors (Viva64, C++)
- V101. Implicit assignment type conversion to memsize type.
- V102. Usage of non memsize type for pointer arithmetic.
- V103. Implicit type conversion from memsize type to 32-bit type.
- V104. Implicit type conversion to memsize type in an arithmetic expression.
- V105. N operand of '?:' operation: implicit type conversion to memsize type.
- V106. Implicit type conversion N argument of function 'foo' to memsize type.
- V107. Implicit type conversion N argument of function 'foo' to 32-bit type.
- V108. Incorrect index type: 'foo[not a memsize-type]'. Use memsize type instead.
- V109. Implicit type conversion of return value to memsize type.
- V110. Implicit type conversion of return value from memsize type to 32-bit type.
- V111. Call of function 'foo' with variable number of arguments. N argument has memsize type.
- V112. Dangerous magic number N used.
- V113. Implicit type conversion from memsize to double type or vice versa.
- V114. Dangerous explicit type pointer conversion.
- V115. Memsize type is used for throw.
- V116. Memsize type is used for catch.
- V117. Memsize type is used in the union.
- V118. malloc() function accepts a dangerous expression in the capacity of an argument.
- V119. More than one sizeof() operator is used in one expression.
- V120. Member operator[] of object 'foo' is declared with 32-bit type argument, but is called with memsize type argument.
- V121. Implicit conversion of the type of 'new' operator's argument to size_t type.
- V122. Memsize type is used in the struct/class.
- V123. Allocation of memory by the pattern "(X*)malloc(sizeof(Y))" where the sizes of X and Y types are not equal.
- V124. Function 'Foo' writes/reads 'N' bytes. The alignment rules and type sizes have been changed. Consider reviewing this value.
- V125. It is not advised to declare type 'T' as 32-bit type.
- V126. Be advised that the size of the type 'long' varies between LLP64/LP64 data models.
- V127. An overflow of the 32-bit variable is possible inside a long cycle which utilizes a memsize-type loop counter.
- V128. A variable of the memsize type is read from a stream. Consider verifying the compatibility of 32 and 64 bit versions of the application in the context of a stored data.
- V201. Explicit conversion from 32-bit integer type to memsize type.
- V202. Explicit conversion from memsize type to 32-bit integer type.
- V203. Explicit type conversion from memsize to double type or vice versa.
- V204. Explicit conversion from 32-bit integer type to pointer type.
- V205. Explicit conversion of pointer type to 32-bit integer type.
- V206. Explicit conversion from 'void *' to 'int *'.
- V207. A 32-bit variable is utilized as a reference to a pointer. A write outside the bounds of this variable may occur.
- V220. Suspicious sequence of types castings: memsize -> 32-bit integer -> memsize.
- V221. Suspicious sequence of types castings: pointer -> memsize -> 32-bit integer.
- V301. Unexpected function overloading behavior. See N argument of function 'foo' in derived class 'derived' and base class 'base'.
- V302. Member operator[] of 'foo' class has a 32-bit type argument. Use memsize-type here.
- V303. The function is deprecated in the Win64 system. It is safer to use the 'foo' function.
Customer specific requests (C++)
- V2001. Consider using the extended version of the 'foo' function here.
- V2002. Consider using the 'Ptr' version of the 'foo' function here.
- V2003. Explicit conversion from 'float/double' type to signed integer type.
- V2004. Explicit conversion from 'float/double' type to unsigned integer type.
- V2005. C-style explicit type casting is utilized. Consider using: static_cast/const_cast/reinterpret_cast.
- V2006. Implicit type conversion from enum type to integer type.
- V2007. This expression can be simplified. One of the operands in the operation equals NN. Probably it is a mistake.
- V2008. Cyclomatic complexity: NN. Consider refactoring the 'Foo' function.
- V2009. Consider passing the 'Foo' argument as a pointer/reference to const.
- V2010. Handling of two different exception types is identical.
- V2011. Consider inspecting signed and unsigned function arguments. See NN argument of function 'Foo' in derived class and base class.
- V2012. Possibility of decreased performance. It is advised to pass arguments to std::unary_function/std::binary_function template as references.
- V2013. Consider inspecting the correctness of handling the N argument in the 'Foo' function.
- V2014. Don't use terminating functions in library code.
- V2015. An identifier declared in an inner scope should not hide an identifier in an outer scope.
- V2016. Consider inspecting the function call. The function was annotated as dangerous.
- V2017. String literal is identical to variable name. It is possible that the variable should be used instead of the string literal.
- V2018. Cast should not remove 'const' qualifier from the type that is pointed to by a pointer or a reference.
- V2019. Cast should not remove 'volatile' qualifier from the type that is pointed to by a pointer or a reference.
- V2020. The loop body contains the 'break;' / 'continue;' statement. This may complicate the control flow.
MISRA errors
- V2501. MISRA. Octal constants should not be used.
- V2502. MISRA. The 'goto' statement should not be used.
- V2503. MISRA. Implicitly specified enumeration constants should be unique – consider specifying non-unique constants explicitly.
- V2504. MISRA. Size of an array is not specified.
- V2505. MISRA. The 'goto' statement shouldn't jump to a label declared earlier.
- V2506. MISRA. A function should have a single point of exit at the end.
- V2507. MISRA. The body of a loop\conditional statement should be enclosed in braces.
- V2508. MISRA. The function with the 'atof/atoi/atol/atoll' name should not be used.
- V2509. MISRA. The function with the 'abort/exit/getenv/system' name should not be used.
- V2510. MISRA. The function with the 'qsort/bsearch' name should not be used.
- V2511. MISRA. Memory allocation and deallocation functions should not be used.
- V2512. MISRA. The macro with the 'setjmp' name and the function with the 'longjmp' name should not be used.
- V2513. MISRA. Unbounded functions performing string operations should not be used.
- V2514. MISRA. Unions should not be used.
- V2515. MISRA. Declaration should contain no more than two levels of pointer nesting.
- V2516. MISRA. The 'if' ... 'else if' construct should be terminated with an 'else' statement.
- V2517. MISRA. Literal suffixes should not contain lowercase characters.
- V2518. MISRA. The 'default' label should be either the first or the last label of a 'switch' statement.
- V2519. MISRA. Every 'switch' statement should have a 'default' label, which, in addition to the terminating 'break' statement, should contain either a statement or a comment.
- V2520. MISRA. Every switch-clause should be terminated by an unconditional 'break' or 'throw' statement.
- V2521. MISRA. Only the first member of enumerator list should be explicitly initialized, unless all members are explicitly initialized.
- V2522. MISRA. The 'switch' statement should have 'default' as the last label.
- V2523. MISRA. All integer constants of unsigned type should have 'u' or 'U' suffix.
- V2524. MISRA. A switch-label should only appear at the top level of the compound statement forming the body of a 'switch' statement.
- V2525. MISRA. Every 'switch' statement should contain non-empty switch-clauses.
- V2526. MISRA. The functions from time.h/ctime should not be used.
- V2527. MISRA. A switch-expression should not have Boolean type. Consider using of 'if-else' construct.
- V2528. MISRA. The comma operator should not be used.
- V2529. MISRA. Any label should be declared in the same block as 'goto' statement or in any block enclosing it.
- V2530. MISRA. Any loop should be terminated with no more than one 'break' or 'goto' statement.
- V2531. MISRA. Expression of essential type 'foo' should not be explicitly cast to essential type 'bar'.
- V2532. MISRA. String literal should not be assigned to object unless it has type of pointer to const-qualified char.
- V2533. MISRA. C-style and functional notation casts should not be performed.
- V2534. MISRA. The loop counter should not have floating-point type.
- V2535. MISRA. Unreachable code should not be present in the project.
- V2536. MISRA. Function should not contain labels not used by any 'goto' statements.
- V2537. MISRA. Functions should not have unused parameters.
- V2538. MISRA. The value of uninitialized variable should not be used.
- V2539. MISRA. Class destructor should not exit with an exception.
- V2540. MISRA. Arrays should not be partially initialized.
- V2541. MISRA. Function should not be declared implicitly.
- V2542. MISRA. Function with a non-void return type should return a value from all exit paths.
- V2543. MISRA. Value of the essential character type should be used appropriately in the addition/subtraction operations.
- V2544. MISRA. The values used in expressions should have appropriate essential types.
- V2545. MISRA. Conversion between pointers of different object types should not be performed.
- V2546. MISRA. Expression resulting from the macro expansion should be surrounded by parentheses.
- V2547. MISRA. The return value of non-void function should be used.
- V2548. MISRA. The address of an object with local scope should not be passed out of its scope.
- V2549. MISRA. Pointer to FILE should not be dereferenced.
- V2550. MISRA. Floating-point values should not be tested for equality or inequality.
- V2551. MISRA. Variable should be declared in a scope that minimizes its visibility.
- V2552. MISRA. Expressions with enum underlying type should have values corresponding to the enumerators of the enumeration.
- V2553. MISRA. Unary minus operator should not be applied to an expression of the unsigned type.
- V2554. MISRA. Expression containing increment (++) or decrement (--) should not have other side effects.
- V2555. MISRA. Incorrect shifting expression.
- V2556. MISRA. Use of a pointer to FILE when the associated stream has already been closed.
- V2557. MISRA. Operand of sizeof() operator should not have other side effects.
- V2558. MISRA. A pointer/reference parameter in a function should be declared as pointer/reference to const if the corresponding object was not modified.
- V2559. MISRA. Subtraction, >, >=, <, <= should be applied only to pointers that address elements of the same array.
- V2560. MISRA. There should be no user-defined variadic functions.
- V2561. MISRA. The result of an assignment expression should not be used.
- V2562. MISRA. Expressions with pointer type should not be used in the '+', '-', '+=' and '-=' operations.
- V2563. MISRA. Array indexing should be the only form of pointer arithmetic and it should be applied only to objects defined as an array type.
- V2564. MISRA. There should be no implicit integral-floating conversion.
- V2565. MISRA. A function should not call itself either directly or indirectly.
- V2566. MISRA. Constant expression evaluation should not result in an unsigned integer wrap-around.
- V2567. MISRA. Cast should not remove 'const' / 'volatile' qualification from the type that is pointed to by a pointer or a reference.
- V2568. MISRA. Both operands of an operator should be of the same type category.
- V2569. MISRA. The 'operator &&', 'operator ||', 'operator ,' and the unary 'operator &' should not be overloaded.
- V2570. MISRA. Operands of the logical '&&' or the '||' operators, the '!' operator should have 'bool' type.
- V2571. MISRA. Conversions between pointers to objects and integer types should not be performed.
- V2572. MISRA. Value of the expression should not be converted to the different essential type or the narrower essential type.
- V2573. MISRA. Identifiers that start with '__' or '_[A-Z]' are reserved.
- V2574. MISRA. Functions should not be declared at block scope.
- V2575. MISRA. The global namespace should only contain 'main', namespace declarations and 'extern "C"' declarations.
- V2576. MISRA. The identifier 'main' should not be used for a function other than the global function 'main'.
- V2577. MISRA. The function argument corresponding to a parameter declared to have an array type should have an appropriate number of elements.
- V2578. MISRA. An identifier with array type passed as a function argument should not decay to a pointer.
- V2579. MISRA. Macro should not be defined with the same name as a keyword.
- V2580. MISRA. The 'restrict' specifier should not be used.
- V2581. MISRA. Single-line comments should not end with a continuation token.
- V2582. MISRA. Block of memory should only be freed if it was allocated by a Standard Library function.
- V2583. MISRA. Line whose first token is '#' should be a valid preprocessing directive.
- V2584. MISRA. Expression used in condition should have essential Boolean type.
- V2585. MISRA. Casts between a void pointer and an arithmetic type should not be performed.
- V2586. MISRA. Flexible array members should not be declared.
- V2587. MISRA. The '//' and '/*' character sequences should not appear within comments.
- V2588. MISRA. All memory or resources allocated dynamically should be explicitly released.
- V2589. MISRA. Casts between a pointer and a non-integer arithmetic type should not be performed.
- V2590. MISRA. Conversions should not be performed between pointer to function and any other type.
- V2591. MISRA. Bit fields should only be declared with explicitly signed or unsigned integer type
- V2592. MISRA. An identifier declared in an inner scope should not hide an identifier in an outer scope.
- V2593. MISRA. Single-bit bit fields should not be declared as signed type.
- V2594. MISRA. Controlling expressions should not be invariant.
- V2595. MISRA. Array size should be specified explicitly when array declaration uses designated initialization.
- V2596. MISRA. The value of a composite expression should not be assigned to an object with wider essential type.
- V2597. MISRA. Cast should not convert pointer to function to any other pointer type.
- V2598. MISRA. Variable length array types are not allowed.
- V2599. MISRA. The standard signal handling functions should not be used.
- V2600. MISRA. The standard input/output functions should not be used.
- V2601. MISRA. Functions should be declared in prototype form with named parameters.
- V2602. MISRA. Octal and hexadecimal escape sequences should be terminated.
- V2603. MISRA. The 'static' keyword shall not be used between [] in the declaration of an array parameter.
- V2604. MISRA. Features from <stdarg.h> should not be used.
- V2605. MISRA. Features from <tgmath.h> should not be used.
- V2606. MISRA. There should be no attempt to write to a stream that has been opened for reading.
- V2607. MISRA. Inline functions should be declared with the static storage class.
- V2608. MISRA. The 'static' storage class specifier should be used in all declarations of object and functions that have internal linkage.
- V2609. MISRA. There should be no occurrence of undefined or critical unspecified behaviour.
- V2610. MISRA. The ', " or \ characters and the /* or // character sequences should not occur in a header file name.
- V2611. MISRA. Casts between a pointer to an incomplete type and any other type shouldn't be performed.
- V2612. MISRA. Array element should not be initialized more than once.
- V2613. MISRA. Operand that is a composite expression has more narrow essential type than the other operand.
- V2614. MISRA. External identifiers should be distinct.
- V2615. MISRA. A compatible declaration should be visible when an object or function with external linkage is defined.
- V2616. MISRA. All conditional inclusion preprocessor directives should reside in the same file as the conditional inclusion directive to which they are related.
- V2617. MISRA. Object should not be assigned or copied to an overlapping object.
- V2618. MISRA. Identifiers declared in the same scope and name space should be distinct.
- V2619. MISRA. Typedef names should be unique across all name spaces.
- V2620. MISRA. Value of a composite expression should not be cast to a different essential type category or a wider essential type.
- V2621. MISRA. Tag names should be unique across all name spaces.
- V2622. MISRA. External object or function should be declared once in one and only one file.
- V2623. MISRA. Macro identifiers should be distinct.
- V2624. MISRA. The initializer for an aggregate or union should be enclosed in braces.
- V2625. MISRA. Identifiers that define objects or functions with external linkage shall be unique.
AUTOSAR errors
- V3501. AUTOSAR. Octal constants should not be used.
- V3502. AUTOSAR. Size of an array is not specified.
- V3503. AUTOSAR. The 'goto' statement shouldn't jump to a label declared earlier.
- V3504. AUTOSAR. The body of a loop\conditional statement should be enclosed in braces.
- V3505. AUTOSAR. The function with the 'atof/atoi/atol/atoll' name should not be used.
- V3506. AUTOSAR. The function with the 'abort/exit/getenv/system' name should not be used.
- V3507. AUTOSAR. The macro with the 'setjmp' name and the function with the 'longjmp' name should not be used.
- V3508. AUTOSAR. Unbounded functions performing string operations should not be used.
- V3509. AUTOSAR. Unions should not be used.
- V3510. AUTOSAR. Declaration should contain no more than two levels of pointer nesting.
- V3511. AUTOSAR. The 'if' ... 'else if' construct should be terminated with an 'else' statement.
- V3512. AUTOSAR. Literal suffixes should not contain lowercase characters.
- V3513. AUTOSAR. Every switch-clause should be terminated by an unconditional 'break' or 'throw' statement.
- V3514. AUTOSAR. The 'switch' statement should have 'default' as the last label.
- V3515. AUTOSAR. All integer constants of unsigned type should have 'U' suffix.
- V3516. AUTOSAR. A switch-label should only appear at the top level of the compound statement forming the body of a 'switch' statement.
- V3517. AUTOSAR. The functions from time.h/ctime should not be used.
- V3518. AUTOSAR. A switch-expression should not have Boolean type. Consider using of 'if-else' construct.
- V3519. AUTOSAR. The comma operator should not be used.
- V3520. AUTOSAR. Any label should be declared in the same block as 'goto' statement or in any block enclosing it.
- V3521. AUTOSAR. The loop counter should not have floating-point type.
- V3522. AUTOSAR. Unreachable code should not be present in the project.
- V3523. AUTOSAR. Functions should not have unused parameters.
- V3524. AUTOSAR. The value of uninitialized variable should not be used.
- V3525. AUTOSAR. Function with a non-void return type should return a value from all exit paths.
- V3526. AUTOSAR. Expression resulting from the macro expansion should be surrounded by parentheses.
- V3527. AUTOSAR. The return value of non-void function should be used.
- V3528. AUTOSAR. The address of an object with local scope should not be passed out of its scope.
- V3529. AUTOSAR. Floating-point values should not be tested for equality or inequality.
- V3530. AUTOSAR. Variable should be declared in a scope that minimizes its visibility.
- V3531. AUTOSAR. Expressions with enum underlying type should have values corresponding to the enumerators of the enumeration.
- V3532. AUTOSAR. Unary minus operator should not be applied to an expression of the unsigned type.
- V3533. AUTOSAR. Expression containing increment (++) or decrement (--) should not have other side effects.
- V3534. AUTOSAR. Incorrect shifting expression.
- V3535. AUTOSAR. Operand of sizeof() operator should not have other side effects.
- V3536. AUTOSAR. A pointer/reference parameter in a function should be declared as pointer/reference to const if the corresponding object was not modified.
- V3537. AUTOSAR. Subtraction, >, >=, <, <= should be applied only to pointers that address elements of the same array.
- V3538. AUTOSAR. The result of an assignment expression should not be used.
- V3539. AUTOSAR. Array indexing should be the only form of pointer arithmetic and it should be applied only to objects defined as an array type.
- V3540. AUTOSAR. There should be no implicit integral-floating conversion.
- V3541. AUTOSAR. A function should not call itself either directly or indirectly.
- V3542. AUTOSAR. Constant expression evaluation should not result in an unsigned integer wrap-around.
- V3543. AUTOSAR. Cast should not remove 'const' / 'volatile' qualification from the type that is pointed to by a pointer or a reference.
- V3544. AUTOSAR. The 'operator &&', 'operator ||', 'operator ,' and the unary 'operator &' should not be overloaded.
- V3545. AUTOSAR. Operands of the logical '&&' or the '||' operators, the '!' operator should have 'bool' type.
- V3546. AUTOSAR. Conversions between pointers to objects and integer types should not be performed.
- V3547. AUTOSAR. Identifiers that start with '__' or '_[A-Z]' are reserved.
- V3548. AUTOSAR. Functions should not be declared at block scope.
- V3549. AUTOSAR. The global namespace should only contain 'main', namespace declarations and 'extern "C"' declarations.
- V3550. AUTOSAR. The identifier 'main' should not be used for a function other than the global function 'main'.
- V3551. AUTOSAR. An identifier with array type passed as a function argument should not decay to a pointer.
- V3552. AUTOSAR. Cast should not convert a pointer to a function to any other pointer type, including a pointer to function type.
- V3553. AUTOSAR. The standard signal handling functions should not be used.
- V3554. AUTOSAR. The standard input/output functions should not be used.
- V3555. AUTOSAR. The 'static' storage class specifier should be used in all declarations of functions that have internal linkage.
OWASP errors (C++)
- V5001. OWASP. It is highly probable that the semicolon ';' is missing after 'return' keyword.
- V5002. OWASP. An empty exception handler. Silent suppression of exceptions can hide the presence of bugs in source code during testing.
- V5003. OWASP. The object was created but it is not being used. The 'throw' keyword could be missing.
- V5004. OWASP. Consider inspecting the expression. Bit shifting of the 32-bit value with a subsequent expansion to the 64-bit type.
- V5005. OWASP. A value is being subtracted from the unsigned variable. This can result in an overflow. In such a case, the comparison operation can potentially behave unexpectedly.
- V5006. OWASP. More than N bits are required to store the value, but the expression evaluates to the T type which can only hold K bits.
- V5007. OWASP. Consider inspecting the loop expression. It is possible that the 'i' variable should be incremented instead of the 'n' variable.
- V5008. OWASP. Classes should always be derived from std::exception (and alike) as 'public'.
- V5009. OWASP. Unchecked tainted data is used in expression.
- V5010. OWASP. The variable is incremented in the loop. Undefined behavior will occur in case of signed integer overflow.
- V5011. OWASP. Possible overflow. Consider casting operands, not the result.
- V5012. OWASP. Potentially unsafe double-checked locking.
- V5013. OWASP. Storing credentials inside source code can lead to security issues.
OWASP errors (C#)
- V5601. OWASP. Storing credentials inside source code can lead to security issues.
- V5602. OWASP. The object was created but it is not being used. The 'throw' keyword could be missing.
- V5603. OWASP. The original exception object was swallowed. Stack of original exception could be lost.
- V5604. OWASP. Potentially unsafe double-checked locking. Use volatile variable(s) or synchronization primitives to avoid this.
- V5605. OWASP. Unsafe invocation of event, NullReferenceException is possible. Consider assigning event to a local variable before invoking it.
- V5606. OWASP. An exception handling block does not contain any code.
- V5607. OWASP. Exception classes should be publicly accessible.
- V5608. OWASP. Possible SQL injection. Potentially tainted data is used to create SQL command.
- V5609. OWASP. Possible path traversal vulnerability. Potentially tainted data is used as a path.
- V5610. OWASP. Possible XSS vulnerability. Potentially tainted data might be used to execute a malicious script.
- V5611. OWASP. Potential insecure deserialization vulnerability. Potentially tainted data is used to create an object using deserialization.
- V5612. OWASP. Do not use old versions of SSL/TLS protocols as it may cause security issues.
- V5613. OWASP. Use of outdated cryptographic algorithm is not recommended.
- V5614. OWASP. Potential XXE vulnerability. Insecure XML parser is used to process potentially tainted data.
- V5615. OWASP. Potential XEE vulnerability. Insecure XML parser is used to process potentially tainted data.
- V5616. OWASP. Possible command injection. Potentially tainted data is used to create OS command.
- V5617. OWASP. Assigning potentially negative or large value as timeout of HTTP session can lead to excessive session expiration time.
- V5618. OWASP. Possible server-side request forgery. Potentially tainted data is used in the URL.
- V5619. OWASP. Possible log injection. Potentially tainted data is written into logs.
- V5620. OWASP. Possible LDAP injection. Potentially tainted data is used in a search filter.
- V5621. OWASP. Error message contains potentially sensitive data that may be exposed.
- V5622. OWASP. Possible XPath injection. Potentially tainted data is used in the XPath expression.
- V5623. OWASP. Possible open redirect vulnerability. Potentially tainted data is used in the URL.
- V5624. OWASP. Use of potentially tainted data in configuration may lead to security issues.
- V5625. OWASP. Referenced package contains vulnerability.
- V5626. OWASP. Possible ReDoS vulnerability. Potentially tainted data is processed by regular expression that contains an unsafe pattern.
- V5627. OWASP. Possible NoSQL injection. Potentially tainted data is used to create query.
- V5628. OWASP. Possible Zip Slip vulnerability. Potentially tainted data is used in the path to extract the file.
OWASP errors (Java)
- V5301. OWASP. An exception handling block does not contain any code.
- V5302. OWASP. Exception classes should be publicly accessible.
- V5303. OWASP. The object was created but it is not being used. The 'throw' keyword could be missing.
- V5304. OWASP. Unsafe double-checked locking.
- V5305. OWASP. Storing credentials inside source code can lead to security issues.
Problems related to code analyzer
- V001. A code fragment from 'file' cannot be analyzed.
- V002. Some diagnostic messages may contain incorrect line number.
- V003. Unrecognized error found...
- V004. Diagnostics from the 64-bit rule set are not entirely accurate without the appropriate 64-bit compiler. Consider utilizing 64-bit compiler if possible.
- V005. Cannot determine active configuration for project. Please check projects and solution configurations.
- V006. File cannot be processed. Analysis aborted by timeout.
- V007. Deprecated CLR switch was detected. Incorrect diagnostics are possible.
- V008. Unable to start the analysis on this file.
- V010. Analysis of 'Makefile/Utility' type projects is not supported in this tool. Use direct analyzer integration or compiler monitoring instead.
- V011. Presence of #line directives may cause some diagnostic messages to have incorrect file name and line number.
- V012. Some warnings could have been disabled.
- V013. Intermodular analysis may be incomplete, as it is not run on all source files.
- V014. The version of your suppress file is outdated. Appending new suppressed messages to it is not possible. Consider re-generating your suppress file to continue updating it.
- V015. All analyzer messages were filtered out or marked as false positive. Use filter buttons or 'Don't Check Files' settings to enable message display.
- V016. User annotation was not applied to a virtual function. To force the annotation, use the 'enable_on_virtual' flag.
- V017. The analyzer terminated abnormally due to lack of memory.
- V018. False Alarm marks without hash codes were ignored because the 'V_HASH_ONLY' option is enabled.
- V019. Error occurred while working with the user annotation mechanism.
- V020. Error occurred while working with rules configuration files.
- V051. Some of the references in project are missing or incorrect. The analysis results could be incomplete. Consider making the project fully compilable and building it before analysis.
- V052. A critical error had occurred.
- V061. An error has occurred.
- V062. Failed to run analyzer core. Make sure the correct 64-bit Java 11 or higher executable is used, or specify it manually.
- V063. Analysis aborted by timeout.
How to enter the PVS-Studio license and what is the next move
- What is included in the license
- Ways to activate the license using the GUI
- Ways to activate the license from a command line
- Quick start or what's next?
PVS-Studio is a static analyzer for C, C++, C#, and Java code. You can run the analyzer on Windows, Linux and macOS. It is necessary to activate the license before using the analyzer. Please find the section that applies to you and then follow the instructions there.
Note. All actions are performed after the analyzer installation. The analyzer is available for download on the "Download PVS-Studio" page.
What is included in the license
The license consists of a user name and a 16-character license key of the "XXXX-XXXX-XXXX-XXXX" format. If you don't have a license, you can fill out the trial request form.
Here is an example of how the license information may look like:
JohnSmith <--- Username
ASD1-DAS3-5KK3-LODR <--- License keyWays to activate the license using the GUI
?Installer PVS-Studio Installer
You can enter the license during the installation of PVS-Studio. The installation wizard prompts you to request a license or enter an existing one.

Choose I have a license and want to activate it and click Next:

Enter your user name in the 'License Name' field. Enter your license key in the 'License Key' field. If the credentials are valid, you get a message with the license information.
Microsoft Visual Studio
In the Visual Studio menu, open Extensions > PVS-Studio > Options (PVS-Studio > Options before Visual Studio 2015):

Then navigate to the right side of the menu, to the PVS-Studio > Registration tab:

Enter the user name in the 'Name' field and the license key in the 'LicenseKey' field. If you entered the valid license, you will get the following message with the license information:

If you entered the invalid license, you will get the following message:

JetBrains IntelliJ IDEA / Rider / CLion
To enter the analyzer license, open any project, then open the IDE settings window:

Go to the 'PVS-Studio > Registration' tab in the opened window:

Enter the user name in the 'Name' field and the license key in the 'License Key' field.
If you enter the valid license, the 'Invalid License' label is replaced with 'Valid License' and the license expiration date appears in the 'Expires' field. Click Apply or OK to confirm and save the license.
C and C++ Compiler Monitoring UI
To enter the license, go to the utility menu by selecting Tools > Options > Registration:

Enter the user name in the 'Name' field and enter the license key in the 'LicenseKey' field.
Visual Studio Code
To enter the license in Visual Studio Code, open View > Command Palette.

Start typing PVS, choose 'PVS-Studio: Show settings' and open it.

Choose the 'License' tab in the opened window.

Enter the user name in the 'User name' field and the license key in the 'Key' field. If you enter the valid license, you will get a message with the license information:

Qt Creator
To enter the license in Qt Creator, open Analyze > PVS-Studio > Options...

Next, click the 'PVS-Studio' tab and open the 'Registration' tab. Enter your user name in the 'Name' field and your license key in the 'License Key' field. If you enter the valid license, you will get a message with the license information.

If you enter the invalid license, you get the following message:

Click Apply or OK to confirm and save the entered license.
Ways to activate the license from a command line
Windows
If you cannot enter the license in the GUI, you can use the analyzer in a special mode on Windows.
The command line may look like this:
PVS-Studio_Cmd.exe credentials --userName %USER_NAME% ^
--licenseKey %LICENSE_KEY%Replace the 'USER_NAME' variable by the user name, and the 'LICENSE_KEY' variable by the license key.
When you run PVS-Studio this way, the analyzer writes the license to the settings file in the default location: "%APPDATA%/PVS-Studio/Settings.xml ". If the settings file does not exist, it will be created. Use the ‑‑settings flag to specify the path to the settings file in a non-default location.
Use the ‑‑licInfo flag to get current license information.
Linux/macOS
If the license cannot be entered in the GUI when running the analyzer on Linux/macOS platforms, you can use the special 'pvs-studio-analyzer' utility.
The command line on Linux/macOS may look like this:
pvs-studio-analyzer credentials ${USER_NAME} ${LICENSE_KEY}Replace the 'USER_NAME' variable by the user name, and the 'LICENSE_KEY' variable by the license key.
When you run PVS-Studio this way, the analyzer writes the license to the settings file in the default location: "~/.config/PVS-Studio/PVS-Studio.lic". If the settings file does not exist, it will be created.
Java analyzer
PVS-Studio Java can be installed independently from the other components of PVS-Studio, so you can also activate the license using plugins for build systems.
If you use Maven, the command line for entering the license may look like this:
mvn pvsstudio:pvsCredentials "-Dpvsstudio.userName=${USER_NAME}" \
"-Dpvsstudio.licenseKey=${LICENSE_KEY}"If you use Gradle, the license can be activated with the following command:
./gradlew pvsCredentials "-Ppvsstudio.userName=${USER_NAME}" \
"-Ppvsstudio.licenseKey=${LICENSE_KEY}"Replace the 'USER_NAME' variable by the user name, and the 'LICENSE_KEY' variable by the license key.
Quick start or what's next?
You can read more about running the analyzer on the following pages:
- Getting acquainted with the PVS-Studio static code analyzer on Windows
- How to run PVS-Studio on Linux and macOS (C, C++)
- PVS-Studio C# installation on Linux and macOS
- How to run PVS-Studio Java
- Get started with PVS-Studio in Visual Studio
- Using PVS-Studio with JetBrains Rider and CLion
- How to use PVS-Studio in Qt Creator
- PVS-Studio for embedded development
- Analysis of Unreal Engine projects
- Analyzing Visual Studio / MSBuild / .NET Core projects from the command line using PVS-Studio
- Analysis of C++ projects based on JSON Compilation Database
- Build-system independent analysis (C and C++)
- How to integrate PVS-Studio into CMake with a CMake module
PVS-Studio trial mode
After downloading the PVS-Studio distribution and requesting a key to experience the tool, you'll get a fully functioning version, which will be working for one week. In this version, there are absolutely no limits - it is a completely full license. When filling out the form, you can choose which type of license you would like to try: Team License or Enterprise License.
Differences between Enterprise and Team Licenses are given on this page.
If a week wasn't enough for you to get acquainted with the tool, just let us know in your reply - we'll send you another key.
System requirements for PVS-Studio analyzer
PVS-Studio analyzer works under x86-64 systems on Windows, Linux, macOS environments, and Windows on ARM. The tool can analyze source code for cross-platform compilers designed for 32-bit, 64-bit, and embedded ARM platforms.
PVS-Studio requires at least 2 GB of RAM (4 GBs or more is recommended) for each processor core, when running analysis on a multi-core system (the more cores you have, the faster code analysis is).
Supported programming languages and compilers
The list of programming languages and compilers supported by the analyzer is available here.
Cross-platform IDEs
The PVS-Studio plugin can be integrated with:
- VS Code (C/C++, C#, and Java)
- QtCreator (from version 8 to 13, inclusive)
- Rider (version 2021.1 and later)
- CLion (version 2021.1 and later)
- IDEA and Android Studio (version 2021.1 and later)
For all IDEs (except IDEA and Android Studio), it is required to have the analyzer core for the language you work with (C/C++, C#, or Java) installed on your system.
Windows
Supported versions are Windows 11, Windows 10, Windows 8, Windows Server 2019, Windows Server 2016 and Windows Server 2012. PVS-Studio works only under 64-bit versions of Windows.
PVS-Studio requires .NET Framework version 4.7.2 or above (it will be installed during PVS-Studio installation, if it not present).
The PVS-Studio plugin can be integrated with Microsoft Visual Studio 2022, 2019, 2017, 2015, 2013, 2012, 2010 development environments. For analysis of C and C++ code for embedded systems, the appropriate compiler toolchain should be present in the system.
Linux
PVS-Studio works under 64-bit Linux distributions with the Linux kernel versions 3.2.0 and above. For analysis of C and C++ code for Linux, cross-platform applications and embedded systems, the appropriate compiler toolchains should be installed in the system. To use the blame-notifier utility to notify the development team, .NET Runtime 8.0 should be installed.
List of supported distributions:
- Arch Linux
- CentOS
- Debian GNU/Linux
- Fedora
- Linux Mint
- openSUSE
- Ubuntu
- And more...
macOS
PVS-Studio works on Intel chips under macOS 10.13.2 High Sierra and above. For analysis of C and C++ code, the appropriate compiler toolchains should be present in the system. To use the blame-notifier utility to notify the development team, .NET Runtime 8.0 should be installed.
Java
PVS-Studio for Java works under 64-bit Windows, Linux and macOS systems. Minimum required Java version to run the analyzer with is Java 11 (64-bit). A project being analyzed could use any Java version.
Technologies used in PVS-Studio
- Watch, don't read (YouTube)
- Abstract Syntax Tree and pattern-based analysis
- Semantic code model and type inference
- Preprocessing in C and C++ source code
- Monitoring of C and C++ source code compilation
- Data-flow analysis and symbolic execution
- Interprocedural analysis
- Intermodular analysis and function annotations
- Taint analysis (taint checking)
- Software Composition Analysis (SCA)
- Additional resources
PVS-Studio provides static analyzers for C, C++, C# and Java languages on Windows, Linux and macOS platforms. PVS-Studio analyzers can vary slightly due to certain features that the languages have. However, all our analyzers share common technologies and approaches to the implementation of static analysis.
As part of PVS-Studio, there are 3 separate software tools for static analysis: the C and C++ analyzer, the C# analyzer and the Java analyzer.
The PVS-Studio analyzer for C and C++ is written in C++. It builds upon the VivaCore closed source code parsing library. This library is a development of the PVS-Studio team as well.
The PVS-Studio analyzer for C# is written in C#. To parse code (to build an abstract syntax tree and a semantic model) and to integrate with the MSBuild \ .NET project system the analyzer uses the open source Roslyn platform.
The PVS-Studio analyzer for Java is written in Java. Data-flow analysis is implemented through the internal C++ library named VivaCore. To analyze source code (to build an AST and a semantic model), the analyzer uses the open source Spoon library.
All the PVS-Studio analyzers implement algorithms and mechanisms to run data-flow analysis (including symbolic execution and interprocedural analysis). These algorithms and mechanisms are built upon PVS-Studio's own developments.
The PVS-Studio static code analysis technology is based on the following approaches and processes.
Watch, don't read (YouTube)
Abstract Syntax Tree and pattern-based analysis
First, let's look at two terms that we use from the theory of developing compilers and static code analyzers.
Abstract Syntax Tree (AST). AST is a finite oriented tree the nodes of which are correlated with the programming language's operators, and the leaves - with the corresponding operands. Compilers and interpreters use abstract syntax tree as an intermediate representation between parse trees and the internal code representation. The advantage of AST - sufficient structure compactness (abstractness). It is achieved due to the absence of nodes for constructs that do not affect semantics of the program.
AST-based analyzers do not depend on specific syntax. For example, names, coding style, code formatting, etc. This is the key advantage of the abstract syntax tree in comparison with direct analysis of program text (source code).
Parse tree (PT). The result of grammatical analysis. The derivation tree differs from the abstract syntactical tree in that it contains nodes for those syntactic rules which do not influence the program semantics. Classical examples of such nodes are grouping parentheses, while grouping of operands in AST is explicitly defined by the tree structure.
At a high level, we can say that the cores of all PVS-Studio analyzers for different languages work with an abstract syntax tree (AST). However, in practice, everything is a bit more complicated. In some cases, diagnostic rules require information about optional nodes or even about the number of spaces at the beginning of the line. In this case, the analysis proceeds down the parse tree and extracts additional information. All of the parse libraries that we use (Roslyn, Spoon, VivaCore) enable getting information at the parse tree level. The analyzer takes this opportunity in some cases.
PVS-Studio analyzers use the AST program representation to search for potential defects by pattern-based analysis. It's a category of relatively simple diagnostic rules. To decide whether the code is dangerous, these rules compare the constructions in the code with predefined templates of potential errors.
Note that the template search is a more efficient technology than regular expressions. Regular expressions are actually not suitable to build an effective static analyzer, for many reasons. We can explain this with a simple example. Let's say you need to find typos when the expression is compared with itself. For the simplest cases, you can use regular expressions:
if (A + B == A + B)
if (V[i] == V[i])However, if the expressions that contain errors are written differently, regular expressions are powerless. Rather, it is simply impossible to write them for all of the alternatives:
if (A + B == B + A)
if (A + (B) == (B) + A)
if (V[i] == ((V[i])))
if (V[(i)] == (V[i]))In turn, in pattern matching, it's not a problem to detect such errors if you use an AST.
The abstract syntax tree representation of code is also a preparation step for the next level of analysis — the construction of a semantic model and type inference.
Semantic code model and type inference
In addition to the syntax analysis of the code, all PVS-Studio analyzers also perform semantic analysis based on the use of AST code representation described in the previous step. They build a complete semantic model of the code they check.
The generalized semantic model is a dictionary of correspondences of semantic symbols and elements of the syntactic representation of the same code (for which PVS-Studio uses nodes of the abstract syntax tree mentioned above).
Each such symbol defines the semantics of the corresponding syntactic language construction. This semantics may be subtle and cannot be deduced from the local syntax itself. To derive such semantics, you must refer to other parts of the syntactic code representation. Here is an example of a code fragment in C language:
A = B(C);We don't know what 'B' stands for, so it's impossible to say what kind of language construction this is. This can be either a function call or a functional cast expression.
The semantic model thus allows to analyze the code semantics without the need to constantly traverse the syntactic representation of this code to resolve semantic facts that are not deduced from the local context. During analysis, the semantic model "remembers" the semantics of code for further use.
Based on the semantic model, PVS-Studio analyzers can perform type inference for any syntactic construction they encounter, which may be required when analyzing the code for potential defects. For instance, such as variable identifiers, expressions, etc. The semantic model complements the pattern-based analysis in cases where a single syntactic representation is not enough to decide whether the tested construction is dangerous.
Building a complete and correct semantic model requires consistency and, accordingly, compilability of the code we check. The compilability of the source code is a necessary condition for PVS-Studio analyzers to operate fully and correctly. PVS-Studio analyzers have fault tolerance mechanisms in cases when they deal with uncompilable code. However, the uncompilable code may impair the accuracy of diagnostic rules.
Preprocessing in C and C++ source code
Preprocessing of C and C++ code is the mechanism that expands compilation directives in the source code and substitute the macro values. In particular, the result of the preprocessor operation is the following. In place of #include directives the contents of header files are substituted, the paths to which are specified by the directive. In the case of such substitution, the preprocessor expands directives and macros sequentially in all the header files that were already expanded by the #include directive. Preprocessing is the first step of the compiler's work. It's a preparation of a compilation unit and its dependencies for source code translation into the internal compiler representation.
Expansion of #include directives leads to the merger of the source file and all the header files used in it into a single file, often called intermediate. By analogy with the compiler, C and C ++ PVS-Studio analyzer uses preprocessing before it starts the analysis. PVS-Studio uses the target compiler (in preprocessor mode) for preprocessing the checked code. The analyzed code was originally intended to be built by the compiler used by PVS-Studio. PVS-Studio supports large number of preprocessors, which are listed on the product page. The output format of the preprocessors of various compilers differs. For the analyzer to work correctly, it is necessary to use the right preprocessor that corresponds to the compiler which is used to build the code.
Before starting the C and C++ analysis, the PVS-Studio analyzer launches a preprocessor for each translation unit of the code it checks. Both contents of the source files and the compilation parameters affect the preprocessor operation. For preprocessing PVS-Studio uses the same build parameters that are used during code compilation. PVS-Studio receives information about the list of translation units and compilation parameters from the build system of the checked project, or by tracing (intercepting) compiler's calls during the project build.
The work of the PVS-Studio C and C ++ analyzer is based on the result of the work of the corresponding preprocessor. The analyzer does not analyze the source code directly. Preprocessing C and C ++ code by expanding compiler directives allows the analyzer to build a complete semantic model of the code being checked.
Monitoring of C and C++ source code compilation
PVS-Studio provides the monitoring feature that allows you to intercept process invocations at the level of your operating system's API. Intercepting a process being invoked allows to get complete information about this process: its invocation parameters and its working environment. PVS-Studio supports process invocation monitoring on Windows and Linux. The analyzer's Windows version uses WinAPI directly, while the Linux version employs the strace standard system utility.
The C and C++ PVS-Studio analyzers can use compilation process tracing as a way to analyze C++ code. PVS-Studio integrates directly with the most popular build systems for C and C++ projects. However, there are many build systems the analyzer does not support. This is because the ecosystem of C and C++ languages is extremely diverse and contains a very large number of build systems - for example, in the embedded sector. Although the C++ PVS-Studio analyzer supports low-level direct integration with such systems, implementing this integration requires a lot of effort. For each translation unit (a C or C++ source file), compilation parameters must be passed to the analyzer.
PVS-Studio's compilation process monitoring system can simplify and automate the process of supplying the analyzer with all the information that it needs for analysis. The monitoring system collects process compilation parameters, analyzes them, and modifies them (for example, by activating the compiler's preprocessing mode, as the analyzer requires this stage only). Then the monitoring system passes these parameters to the C++ PVS-Studio analyzer directly.
This way, thanks to the process invocation monitoring feature, PVS-Studio offers a universal solution to check C and C++ projects. Moreover, the system does not depend on the build system used, is easily configured, and takes the original parameters of the source code compilation fully into account.
Data-flow analysis and symbolic execution
Data-flow analysis is a way for the static analyzer to estimate values that variables or expressions have - across various locations in the source code. The estimated values here mean specific values, value ranges or sets of possible values. Additionally, the analyzer tracks whether memory linked to a pointer has been freed, what the array sizes are etc. Then the analyzer saves this information and processes it.
To estimate values, the analyzer tracks how variable values move along the control-flow graph, and analyzes the results. In many cases, the analyzer cannot know the variable's or expression's exact value. To evaluate the expressions, the analyzer uses direct and indirect restrictions, imposed on the expressions as the control-flow graph is traversed. The analyzer makes assumptions as to what ranges or sets of values given expressions can take at the control-flow graph's various points.
Sometimes source code's syntactic (AST) or semantic structure is insufficient for the analyzer to make a decision on whether certain code is dangerous. This is why all PVS-Studio analyzers use data-flow analysis to support the diagnostics and to make a more precise decision on whether that code is dangerous. To conduct data-flow analysis, PVS-Studio analyzers use their own internally-implemented algorithms. Data-flow analysis in PVS-Studio provides flow and path sensitivity. The branching in the analyzed source code is fully covered in the data-flow model constructed by the analyzer.
The PVS-Studio analyzer for C and C ++ and the PVS-Studio analyzer for Java use a shared internal C ++ library for data-flow analysis. The C# PVS-Studio analyzer has its own implementation of data-flow algorithms - they are in a library written in C#.
Sometimes, when processing code, the analyzer cannot calculate an expression's range of values. In this case, the analyzer employs the symbolic execution approach. Symbolic execution means that possible variable and expression values are represented as formulas. In this case, instead of specific variable values, the analyzer operates with symbols that are abstractions of these variables.
Study this C++ code example:
int F(std::vector<int> &v, int x)
{
int denominator = v[x] - v[x];
return x / denominator;
}To detect division by zero here, the analyzer does not need to know which values the function takes when this function is called.
When traversing the control-flow graph, the analyzer can build formulas for expressions it encounters - and calculate the limitations of these expressions' values. To do this, the analyzer substitutes variables in these formulas for known limitations on symbols that a given expression depends on. The analyzer employs symbolic execution algorithms to solve the formulas it builds when traversing the control-flow graph. The algorithms allow the analyzer to calculate expression or variable value limitations based on the values of other expressions or variables. The calculation of the final value is postponed till the moment it is required (for example, when a specific diagnostic rule is running, the final value will be calculated based on the formula created earlier).
The PVS-Studio analyzers for C, C++ and Java use the symbolic execution approach as part of their data-flow algorithms.
Interprocedural analysis
Interprocedural analysis is a static analyzer's ability to discover function calls and figure out how these calls affect the sate of the program and its variables in the local context. The PVS-Studio analyzers use interprocedural analysis to confirm limitations and ranges of variable and expression values that are calculated with data-flow mechanisms.
During analysis, the PVS-Studio analyzers use the AST code representation and build a complete semantic model. This way, when the analyzers encounter a function call, they can represent this function's body as an AST - and get all semantic information from this AST.
In data-flow analysis, PVS-Studio's interprocedural analysis allows to account for values returned by function calls. PVS-Studio also tracks the states of variables and expressions passed to functions. This enables the analyzer to detect potentially dangerous constructions and operations inside function bodies - for values passed to these functions. The analyzer can see potential defects in the bodies of the functions called. It can also identify how values a function accepts limit values the function can return.
Interprocedural analysis is limited by the access to the source code of the functions the analyzer needs to expand. To expand functions defined in different source files PVS-Studio employs the intermodular analysis mechanism. Although it is impossible to analyze functions defined in third-party libraries (due to the unavailability of these functions' source code) - PVS-Studio analyzers can estimate values these functions return. The annotation mechanism makes this possible.
Intermodular analysis and function annotations
Aside from interprocedural analysis, PVS-Studio analyzers support intermodular analysis. PVS-Studio's intermodular analysis extends the capabilities of interprocedural analysis.
In different programming languages, modules may mean different things. However, the concept of a module is generally understood as a compilation unit. For C and C++ languages, a compilation unit is a separate source code file (a file with the .c or .cpp extension). For C# language, a compilation unit is a project. For Java - it's a source file (a file with the .java extension) with a class herein declared.
When analyzing a project's source code file, Java and C# PVS-Studio analyzers can get access to the code of functions that are defined in this file - and in other files of the analyzed project. The PVS-Studio analyzer for C# can also get and analyze the source code of functions defined in other projects - if these projects were also submitted to the analysis.
The C++ PVS-Studio analyzer can get bodies of methods, defined in the compilation unit that is being processed at the time. This compilation unit is a preprocessed source file with expanded inclusions of header files. The C++ analyzer's intermodular mode allows to also get data-flow information from other compilation units. To do this, the analyzer works through source code twice. During the first run, the analyzer gathers interprocedural data-flow information for all source files being checked. During the second run, the analyzer uses this information to analyze source files.
If, when processing code, the analyzer encounters a function it cannot expand for analysis - it can use the function annotation mechanism. Function annotations are a declarative specification of information about limitations on values passed to functions and values that functions can return.
PVS-Studio analyzers provide two kinds of annotations: for library functions and for user functions. All PVS-Studio analyzers provide annotations on many functions from standard and popular libraries. The C++ PVS-Studio analyzer has an extra feature. You can use special syntax to set annotations for custom functions that are specific to a particular project being checked.
Taint analysis (taint checking)
Taint analysis is a way to track how externally supplied unchecked - therefore tainted - data spreads across an application. When such data hits taint sinks, it can cause a number of security vulnerabilities: SQL injections, XSS (cross-site scripting), and many others. Standards for secure software development, such as OWASP ASVS (Application Security Verification Standard), describe potential software vulnerabilities that result from the spread of tainted data.
Generally, it's impossible to fully protect a program from potentially tainted data. This is why the most efficient way to counteract external tainted data is to check it before it enters taint sink. This process is called data sanitization.
The PVS-Studio analyzers for C and C++, as well as for C#, can use interprocedural data-flow analysis technologies to track how tainted data spreads across applications. An entire group of PVS-Studio rules is based on the tainted data tracking mechanism.
PVS-Studio analyzers control the entire route that tainted data takes - this includes locations where data travels between program modules and where data gets checked (sanitized). If the PVS-Studio analyzer detects that tainted data travels from the taint source to the taint sink unchecked, it issues a warning about a potential code security threat. This way, PVS-Studio guards taint sources and taint sinks both, and issues a warning not only if tainted data is used - but at the moment such data is supplied to an application.
Software Composition Analysis (SCA)
Many modern applications use third-party components like libraries, packages, etc. Some of these components contain vulnerabilities. If an application uses a component with a vulnerability, the application itself can become vulnerable as well.
Special utilities find these "malicious" dependencies by performing software composition analysis (SCA).
The PVS-Studio analyzer for C# supports SCA. This mechanism works as follows:
- The analyzer creates a bill of materials (BOM) — a list of direct and transitive project dependencies and information about their versions. BOM is based on the MSBuild project files.
- Of all dependencies, the analyzer selects those which are directly or indirectly used in the code. The analyzer checks whether data types declared in dependent packages are used in code.
- For each BOM record, PVS-Studio searches for the corresponding record in the GitHub Advisory Database. At the same time, the analyzer takes into account the name of the dependency checked and its version.
- If a match is found in the database, the analyzer issues a warning with information on the dependency and vulnerabilities it contains.
You can read more about the mechanism of SCA in the documentation for the V5625 diagnostic rule.
Additional resources
- A talk at Italian Cpp Community 2021 (itCppCon21). Yuri Minaev. Inside a static analyzer: type system.
- Oleg Lisiy, Sergey Larin. Intermodular analysis of C++ projects in PVS-Studio.
- Andrey Karpov. Why PVS-Studio uses data flow analysis.
- Sergey Vasiliev. OWASP, vulnerabilities, and taint analysis in PVS-Studio for C#.
PVS-Studio release history
- Watch, don't read (YouTube)
- PVS-Studio 7.30 (April 12, 2024)
- PVS-Studio 7.29 (February 7, 2024)
- PVS-Studio 7.28 (December 5, 2023)
- PVS-Studio 7.27 (October 11, 2023)
- PVS-Studio 7.26 (August 9, 2023)
- PVS-Studio 7.25 (June 7, 2023)
- PVS-Studio 7.24 (April 5, 2023)
- PVS-Studio 7.23 (February 8, 2023)
- PVS-Studio 7.22 (December 7, 2022)
- PVS-Studio 7.21 (October 11, 2022)
- PVS-Studio 7.20 (August 10, 2022)
- PVS-Studio 7.19 (June 8, 2022)
- PVS-Studio 7.18 (April 6, 2022)
- PVS-Studio 7.17 (February 9, 2022)
- PVS-Studio 7.16 (December 8, 2021)
- PVS-Studio 7.15 (October 7, 2021)
- PVS-Studio 7.14 (August 9, 2021)
- PVS-Studio 7.13 (May 31, 2021)
- PVS-Studio 7.12 (March 11, 2021)
- PVS-Studio 7.11 (December 17, 2020)
- PVS-Studio 7.10 (November 5, 2020)
- PVS-Studio 7.09 (August 27, 2020)
- PVS-Studio 7.08 (June 18, 2020)
- PVS-Studio 7.07 (April 16, 2020)
- PVS-Studio 7.06 (February 27, 2020)
- PVS-Studio 7.05 (December 10, 2019)
- PVS-Studio 7.04 (September 4, 2019)
- PVS-Studio 7.03 (June 25, 2019)
- PVS-Studio 7.02 (April 25, 2019)
- PVS-Studio 7.01 (March 13, 2019)
- PVS-Studio 7.00 (January 16, 2019)
- Release history for old versions
PVS-Studio is an actively developing analyzer. For example, our team is constantly improving its integration with such systems as PlatformIO, Azure DevOps, Travis CI, CircleCI, GitLab CI/CD, Jenkins, SonarQube, etc. However, the best way to demonstrate the development of analyzer capabilities is to show the graph of the number of diagnostics.

Figure 1. Graph of increasing the number of diagnostics in PVS-Studio
As you can see, we are actively improving the capabilities of the analyzer to detect new error patterns and at the same time are pushing the development of other tools :). More detailed information on innovations in various versions of the analyzer is presented below.
Watch, don't read (YouTube)
PVS-Studio 7.30 (April 12, 2024)
- The PVS-Studio C and C++ analyzer now provides a mechanism for user annotations. It is a way of marking up types and functions in JSON format in order to provide the analyzer with additional information. Due to this information, the analyzer can find more errors in code. The annotations are specified in a special JSON format file. Among other things, user annotations enable you to mark a function as unsafe to use, define its own type as nullable, etc. You can learn more about the mode in the documentation.
- The PVS-Studio integration with Unreal Engine was significantly enhanced. The enhancements are available starting with UE version 5.4.
- An implementation of multi-file navigation through warnings included in the analyzer report.
- A fix for an error that causes the analysis to fail in Unreal Engine 5.3 when analyzing via the -StaticAnalyzer=PVSStudio compilation flag.
- A support for disabling the standard warning output of the Unreal Build Tool to the console when running the analysis. It can significantly reduce the analyzer report post-processing time in projects with a large number of warnings.
- An analysis of auto-generated files (.gen.cpp) is now disabled by default. You can use a special setting to enable it again.
- A setting to run the analyzer only on project source files (skipping the Unreal Engine core module) is available. This enables you to significantly speed up the analysis process.
- The system of analyzing individual files by using the ‑‑sourceFiles flag and re-generating the project dependency cache was extended. Now this mode is more robust to scenarios where the dependency cache is in a state that does not match the project structure. It can happen, for example, if multiple branches are used in a version control system. Moreover, we added the option to run the analysis with a full cache update: this enables you to analyze a project with a fully correct cache of dependencies in case there is no way to keep it up to date.
- Now the C and C++ analyzer supports the GNU RISC-V GCC Toolchain for the RISC-V platform.
- The C and C++ analyzer also supports the standard bool type that appeared in the C23 standard of the C language. As a result, the support for the MISRA Essential Type Model as well as diagnostic rules based on it was improved.
- For the C and C++ analyzer, we improved the handling of the standard C++ library and supported more compiler intrinsics, such as __add_lvalue_reference, __add_pointer, __add_rvalue_reference, and others. This improves the performance of multiple diagnostic rules.
- The PVS-Studio plugin is now available for Qt Creator version 13.
- V1105. Suspicious string modification using the 'operator+='. The right operand is implicitly converted to a character type.
- V1106. Qt. Class inherited from 'QObject' does not contain a constructor that accepts a pointer to 'QObject'.
- V1107. Function was declared as accepting unspecified number of parameters. Consider explicitly specifying the function parameters list.
- V3196. Parameter is not utilized inside the method body, but an identifier with a similar name is used inside the same method.
- V3197. The compared value inside the 'Object.Equals' override is converted to a different type that does not contain the override.
- V3198. The variable is assigned the same value that it already holds.
- V6110. Using an environment variable could be unsafe or unreliable. Consider using trusted system property instead.
- V6111. Potentially negative value is used as the size of an array.
- V6112. Calling the 'getClass' method repeatedly or on the value of the '.class' literal will always return the instance of the 'Class' type.
PVS-Studio 7.29 (February 7, 2024)
- We added the support for the analysis of Java projects in the PVS-Studio plugin for Visual Studio Code.
- The C++ analyzer now supports smart pointers from the Boost library: boost::unique_ptr and boost::shared_ptr. PVS-Studio analyzer will be able to detect errors such as null pointer dereferences when these classes are used.
- We added a mode that considers the hash of the source code line, which triggers a warning, when users mark warnings as false positives. This makes it clear whether the line of code had been changed since the warning was marked as a false positive. When the new markup mode is used, marking a warning as a false positive will no longer suppress the analyzer warning if there were any changes in the code. The feature is supported in the PVS-Studio plugins for Microsoft Visual Studio.
- The PVS-Studio plugin for Qt Creator 12 is now supported on macOS operating systems.
- V839. Decreased performance. Function returns a constant value. This may interfere with the move semantics.
- V1104. Priority of the 'M' operator is higher than that of the 'N' operator. Possible missing parentheses.
- V2625. MISRA. Identifier with external linkage should be unique.
- V3194. Calling 'OfType' for collection will return an empty collection. It is not possible to cast collection elements to the type parameter.
- V3195. Collection initializer implicitly calls 'Add' method. Using it on member with default value of null will result in null dereference exception.
- V6108. Do not use real-type variables in 'for' loop counters.
- V6109. Potentially predictable seed is used in pseudo-random number generator.
PVS-Studio 7.28 (December 5, 2023)
- Now the PVS-Studio analyzers can be used on the ARM architecture on Windows. PVS-Studio works in x64 compatibility mode. Next year, we plan to implement the native ARM analyzer version for macOS.
- PVS-Studio for C# now supports the analysis of .NET 8 projects. The C# analyzer on Linux and macOS will be working under .NET 8.
- We added the support for relative paths in the SARIF reports.
- When analyzing Unreal Engine projects with PVS-Studio, we often encounter issues with high memory usage and analysis slowdown. They are usually encountered when individual translation units are combined into a single file (the Unity Build system). Although the merging of translation units may have a positive impact on the compilation time, the large file size may increase the resource requirements for analysis. We have added a new section to the documentation on analyzing Unreal Engine projects, which describes how to configure the analysis without Unity Build, while keeping the opportunity to use this mode for building the project.
- Added support for PVS-Studio plugin for Qt Creator v. 12.0.x.
- Now the analyzer supports wildcard-patterns in the compile commands for the compiler monitoring utility on Windows (CLMonitor).
- In the C# analyzer, we enhanced and standardized the enabling and disabling of separate diagnostic rules via the analyzer configuration files (.pvsconfig). You can read more about .pvsconfig in the documentation.
- In the C# analyzer, we enhanced the handling of parameters that have null as the default value. It enables the V3080 diagnostic rule to detect more errors related to null dereferencing.
- We fixed the compatibility issues between PVS-Studio and Visual Assist plugins for Visual Studio IDE.
- V1103. The values of padding bytes are unspecified. Comparing objects with padding using 'memcmp' may lead to unexpected result.
- V2624. MISRA. The initializer for an aggregate or union should be enclosed in braces.
- V3193. Data processing results are potentially used before asynchronous output reading is complete. Consider calling 'WaitForExit' overload with no arguments before using the data.
- V4005. Unity Engine. The expensive operation is performed inside method or property. Using such member in performance-sensitive context can lead to decreased performance.
- V6107. The constant NN is being utilized. The resulting value could be inaccurate. Consider using the KK constant.
PVS-Studio 7.27 (October 11, 2023)
- Now the PVS-Studio plugin for Visual Studio Code supports the analysis of .NET projects. In the plugin, you can run the analysis, view the analysis report, suppress warnings, etc. You can find more details in the documentation.
- We enhanced the mechanism of parsing C++ standard library for macOS.
- The automatic algorithm for selecting the number of simultaneously analyzed files was improved for C++ analyzer under Linux and macOS. Now not only the available logical cores are considered but also the amount of RAM available in the system. This enables the analyzer to set more optimal values for the default settings.
- In the PVS-Studio plugin for Rider, you can analyze Unreal Engine projects that are opened directly in Rider. Also, the plugin is now available for Rider 2023.2. You can find the documentation at this link.
- In the pvsconfig configuration file, you can now specify the paths in the analyzer report to be set relative to the solution directory. The new option is supported both when launching the analysis and when viewing the analyzer results in IDE plugins. The feature will make it easier to handle the analysis report when spreading it between the machines with different directory structures. You can find the documentation for pvsconfig here.
- Support for v80 and v90 platform toolsets was returned to CLMonitor utility.
- We completely revised the Java analyzer documentation. Now each usage scenario has a separate section: Maven integration, Gradle integration, using PVS-Studio in IntelliJ IDEA and Android Studio, and using the Java analyzer directly from the command line.
- V1102. Unreal Engine. Violation of naming conventions may cause Unreal Header Tools to work incorrectly.
- V2623. MISRA. Macro identifiers should be distinct.
- V3192. Type member is used in the 'GetHashCode' method but is missing from the 'Equals' method.
- V4004. Unity Engine. New array object is returned from method and property. Using such member in performance-sensitive context can lead to decreased performance
PVS-Studio 7.26 (August 9, 2023)
- Now the PVS-Studio plugin for Visual Studio Code supports analysis of C and C++ projects that use the CMake build system. You can also set the baseline level for warnings. It enables you to "clean" the old project code from PVS-Studio warnings and start analyzing only the code written after the analyzer has been introduced.
- The PVS-Studio plugin for Qt Creator now supports checking projects that use QMake, CMake, or Qbs. Moreover, warning suppression via suppress files is now available directly in the plugin. You can find the documentation for the plugin here.
- The Spoon library used by the Java analyzer for code analysis has been updated to version 10.3.0. This enables you to check projects that use JDK 20 and Java 20 language constructs while maintaining backward compatibility with all previous versions.
- The PVS-Studio analysis results can now be integrated with DefectDojo, the system for managing the application security workflow. The documentation is available here.
- Now the C# analyzer recognizes the 'NotNullWhen' and 'NotNullIfNotNull' attributes in projects that use nullable context.
- In the C++ analyzer, we have enhanced the user annotation mechanism. Now it is possible to write annotations for functions at any nesting level. You can also use the function name without specifying the class and namespace when annotating. Guidelines for user annotations can be found here.
- The PVS-Studio warning classification page according to the CWE Top 25 Most Dangerous Software Weaknesses has been updated to the 2023 edition. PVS-Studio detects 64% of the listed types of vulnerabilities.
- V838. Temporary object is constructed during lookup in ordered associative container. Consider using a container with heterogeneous lookup to avoid construction of temporary objects.
- V1100. Unreal Engine. Declaring a pointer to a type derived from 'UObject' in a class that is not derived from 'UObject' is dangerous. The pointer may start pointing to an invalid object after garbage collection.
- V1101. Changing the default value of a virtual function parameter in a derived class may result in unexpected behavior.
- V3191. Iteration through collection makes no sense because it is always empty.
- V4002. Unity Engine. Avoid storing consecutive concatenations inside a single string in performance-sensitive context. Consider using StringBuilder to improve performance.
- V4003. Unity Engine. Avoid capturing variable in performance-sensitive context. This can lead to decreased performance.
PVS-Studio 7.25 (June 7, 2023)
- We updated the documentation on analysis in commit and branch merge mode (pull/merge requests). The documentation now also has separate pages on using the analyzer in AppVeyor and Buddy.
- We also added instructions for integrating the C# analysis results into SonarQube under Linux. You can find it here.
- The PVS-Studio plugin for Qt Creator is now available for versions 10.0.x. The plugin for Rider now supports versions 2022.2.3 and higher.
- We updated versions of the MSBuild and Roslyn libraries used by the analyzer. This helped solve issues related to the analysis of C# projects where code is generated via attributes.
- The decreased analysis performance on Intel 12th gen processors is now fixed. This enhancement is relevant for analysis of C++ projects for MSBuild.
- New features for the analysis and diagnostic configuration files (pvsconfig): specifying the loading priority of these files, enabling individual diagnostics (C++ only), as well as the ability to ignore global settings from Settings.xml (only when working via Visual Studio or PVS-Studio_Cmd.exe). You can find the details in the documentation.
- V837. The 'emplace' / 'insert' function does not guarantee that arguments will not be copied or moved if there is no insertion. Consider using the 'try_emplace' function.
- V1098. The 'emplace' / 'insert' function call contains potentially dangerous move operation. Moved object can be destroyed even if there is no insertion.
- V1099. Using the function of uninitialized derived class while initializing the base class will lead to undefined behavior.
- V2020. The loop body contains the 'break;' / 'continue;' statement. This may complicate the control flow.
- V3190. Concurrent modification of a variable may lead to errors.
- V4001. Unity Engine. Boxing inside a frequently called method may decrease performance.
PVS-Studio 7.24 (April 5, 2023)
- Now the analyzer has a better understanding of 'null' comparisons in Unity-based projects. PVS-Studio now issues fewer false positives for Unity projects, allowing you to focus only on the relevant warnings.
- Improved support for C# 9: PVS-Studio now takes into account that expressions with the postfix '!' (null-forgiving operator) do not return 'null'. Yet, whether or not the postfix is present, the analyzer nonetheless issues warnings on dereferences of expressions whose values are definitely equal to 'null'.
- The interface for handling suppress files (*.suppress) in the plugin for Visual Studio has been considerably expanded. Now you can have multiple suppress files for each project, view warnings from selected suppress files, transfer warnings between suppress files, etc. You can find the details in the documentation.
- A new Suppression mode is available in the PVS-Studio_Cmd.exe and pvs-studio-dotnet utilities. Now you can suppress warnings by diagnostics codes, groups, or file paths, as well as to add new suppress files into the project and so on. You can find more information on the new mode in the documentation.
- The PVS-Studio C++ analyzer now better chooses specializations for class templates.
- V1095. Usage of potentially invalid handle. The value should be non-negative.
- V1096. Variable with static storage duration is declared inside the inline function with external linkage. This may lead to ODR violation.
- V1097. Line splice results in a character sequence that matches the syntax of a universal-character-name. Using this sequence lead to undefined behavior.
- V3187. Parts of an SQL query are not delimited by any separators or whitespaces. Executing this query may lead to an error.
- V3188. The value of an expression is a potentially destroyed Unity object or null. Member invocation on this value may lead to an exception.
- V3189. The assignment to a member of the readonly field will have no effect when the field is of a value type. Consider restricting the type parameter to reference types.
PVS-Studio 7.23 (February 8, 2023)
- The PVS-Studio plugin is now available for Qt Creator 9.0.x versions. It can also now be used not only on Windows and Linux but also on macOS on the x86-64 architecture.
- We added a description of the analysis configuration file (Settings.xml) into the documentation. You can use this file to set up the analysis in PVS-Studio plugins for IDEs.
- We fixed an issue with the Java analyzer starting, appeared due to undetected dependency libraries on some Linux distributions.
- Now the CMake module works correctly on projects that use the NMake generator and contain a large number of files.
- V1093. The result of the right shift operation will always be 0. The right operand is greater than or equal to the number of bits in the left operand.
- V1094. Conditional escape sequence in literal. Its representation is implementation-defined.
- V3184. The argument's value is greater than the size of the collection. Passing the value into the 'Foo' method will result in an exception.
- V3185. An argument containing a file path could be mixed up with another argument. The other function parameter expects a file path instead.
- V3186. The arguments violate the bounds of collection. Passing these values into the method will result in an exception.
PVS-Studio 7.22 (December 7, 2022)
- We released the PVS-Studio plugin for Visual Studio Code. The plugin allows you to handle analyzer reports: view warnings, filter them, etc. You can't run code analysis yet — we plan to add this feature in future releases. The documentation is available here.
- We released the PVS-Studio plugin for Qt Creator. The functionality is the same as that of the plugin for Visual Studio Code: you can handle reports, but you can't run analysis yet. The documentation is available here.
- The Best Warnings mechanism is improved: we enhanced algorithms and adjusted the "weights" of diagnostics — the selection of the most interesting warnings became better. Also, we changed the interface: the filter button is now located on the main panel of the PVS-Studio window. If needed, you can hide the button in the settings (the "Show Best Warnings Button" option). The updated documentation on Best Warnings is available here.
- Best Warnings is now available not only in the plugin for Visual Studio but also in the C and C++ Compiler Monitoring UI utility, as well as in plugins for IntelliJ IDEA, Rider, CLion.
- PVS-Studio C# now supports the analysis of .NET 7 projects and projects using C#11. The C# analyzer on Linux and macOS now works on .NET 7.
- The C# analyzer now checks @code blocks in .razor files. This will help to run deeper analysis of web projects.
- PlogConverter and plog-converter utilities now provide new filtering capabilities of the analyzer reports. You can filter warnings and leave only those that are issued for certain files (the ‑‑includePaths flag). Also, you can do the opposite: exclude warnings issued for the specified files from the report (‑‑excludePaths). You can find the details in the documentation.
- V836. Decreased performance. Unnecessary copying is detected when declaring a variable. Consider declaring the variable as a reference.
- V2018. Cast should not remove 'const' qualifier from the type that is pointed to by a pointer or a reference.
- V2019. Cast should not remove 'volatile' qualifier from the type that is pointed to by a pointer or a reference.
- V3183. Code formatting implies that the statement should not be a part of the 'then' branch that belongs to the preceding 'if' statement.
- V5626. OWASP. Possible ReDoS vulnerability. Potentially tainted data is processed by regular expression that contains an unsafe pattern.
- V5627. OWASP. Possible NoSQL injection. Potentially tainted data is used to create query.
- V5628. OWASP. Possible Zip Slip vulnerability. Potentially tainted data is used in the path to extract the file.
PVS-Studio 7.21 (October 11, 2022)
- The PVS-Studio analyzer's results now can be converted into reports compatible with GitLab Code Quality. The documentation describes how to do it.
- We continue to enhance PVS-Studio's integration with Unreal Engine. We made a pull request that allows to use more of the analyzer's settings in UE projects analysis. For example, you can specify a timeout for file analysis. The changes have already been committed to the engine's code. The new features will be available in the next version of Unreal Engine.
- Unreal Engine projects can be checked not only on Windows, but also on Linux. You can learn more about it in the documentation.
- The PVS-Studio analyzer now works better with a larger number of types specific to Unreal Engine.
- All the necessary information about diagnostic configuration files (.pvsconfig files) is gathered on a separate documentation page.
- Now you can automatically filter analyzer warnings whose messages contain the specified text. The feature allows you to suppress specific diagnostics' warnings that match a template — without disabling the diagnostics completely. You can create a filter of this kind in .pvsconfig files (C++, C#) or directly in code (C++ only).
- The PVS-Studio plugin for Visual Studio now supports JSON suppress files. This format was previously supported only in utilities on Linux and macOS. This simplifies the use of suppress files in cross-platform scenarios. It is also now easier to integrate PVS-Studio in the development process of cross-platform projects that contain legacy code.
- V1090. The 'std::uncaught_exception' function is deprecated since C++17 and is removed in C++20. Consider replacing this function with 'std::uncaught_exceptions'.
- V1091. The pointer is cast to an integer type of a larger size. Casting pointer to a type of a larger size is an implementation-defined behavior.
- V1092. Recursive function call during the static/thread_local variable initialization might occur. This may lead to undefined behavior.
- V3178. Calling method or accessing property of potentially disposed object may result in exception.
- V3179. Calling element access method for potentially empty collection may result in exception.
- V3180. The 'HasFlag' method always returns 'true' because the value '0' is passed as its argument.
- V3181. The result of '&' operator is '0' because one of the operands is '0'.
- V3182. The result of '&' operator is always '0'.
PVS-Studio 7.20 (August 10, 2022)
- The Unreal Engine developers fixed the engine's inability to find PVS-Studio by the default path. Starting from Unreal Engine 5.0.3 you can analyze your projects without any workarounds.
- We've enhanced the analysis of projects on Unreal Engine. PVS-Studio now issues fewer false positives and understands more about types native for this engine. For example, about analogues for containers from the C++ standard library.
- PVS-Studio learned to search for dependencies with known vulnerabilities in C# projects. To find them, the tool performs software composition analysis (SCA). You can read more about this in the documentation for the V5625 diagnostic rule.
- PVS-Studio covers all categories from the OWASP Top 10 2021. We covered the last, A06, by implementing SCA. You can see which diagnostic rules search for security weaknesses from OWASP Top 10 2021 on a special page.
- pvs-studio-analyzer and CompilerCommandsAnalyzer perform cross-platform analysis of C and C++ projects. Now these utilities better determine compilers used in projects. If they failed to determine the compiler type, you can specify it explicitly. This feature is especially useful in embedded development, where compilers have many different names. Read more here: the '‑‑compiler' flag.
- We also enhanced these utilities (pvs-studio-analyzer and CompilerCommandsAnalyzer) to make cross-platform analysis of C and C++ projects even more user-friendly. The new documentation section contains description of their use case scenarios, command-line flags, exit codes.
- We supported analysis of projects based on the compilation database (compile_commands.json) created in Qt Creator. You can read about the compilation database generation here.
- We supported the latest versions (2022.2) of the JetBrains IDEs: Rider, CLion, IntelliJ IDEA.
- V1086. Call of the 'Foo' function will lead to buffer underflow.
- V1087. Upper bound of case range is less than its lower bound. This case may be unreachable.
- V1088. No objects are passed to the 'std::scoped_lock' constructor. No locking will be performed. This can cause concurrency issues.
- V1089. Waiting on condition variable without predicate. A thread can wait indefinitely or experience a spurious wake up.
- V3177. Logical literal belongs to second operator with a higher priority. It is possible literal was intended to belong to '??' operator instead.
- V5624. OWASP. Use of potentially tainted data in configuration may lead to security issues.
- V5625. OWASP. Referenced package contains vulnerability.
PVS-Studio 7.19 (June 8, 2022)
- We've updated the documentation on using PVS-Studio with Unreal Engine based projects. The updates touch upon the differences in configuring analysis for distinct engine versions, and also describe excluding files from analysis and baselining analyzer results on your legacy codebase. Important notice: despite PVS-Studio being fully compatible with the latest Unreal Engine 5.0 and later versions, there is currently an unresolved bug in the integration between the analyzer and the engine build system, at the build engine side. We are working together with engine developers to resolve this issue. There are available workarounds, described in our documents, until the issue is resolved at the engine side.
- PVS-Studio C++ analyzer improved its recognition of target platform for QNX Momentics QCC compiler family. Incorrect recognition of platform had caused potential false positives in previous analyzer versions.
- PVS-Studio extension for SonarQube continuous code quality assurance system can now read JSON cross platform analyzer reports. This allows you to utilize a single analyzer report format independent of the platform used to run the analysis.
- Continuing the subject of improving the handling of analyzer reports - a new section of our documentation summarizes all the facilities available in PVS-Studio for generating, handling and converting analysis results on all of supported platforms.
- Automatic developer notification tool blame-notifier now supports sending configurable email notifications: you can attach various files (including a full analyzer report) to the message, as well as set the subject of the message.
- It is now possible to analyze Unreal Engine based projects under PVS-Studio free license. As a reminder, PVS-Studio free license is available for students and is activated by appending special comments to the analyzed source code. Previous PVS-Studio versions limited Unreal Engine analysis to Enterprise-level licenses only.
- V834. Incorrect type of a loop variable. This leads to the variable binding to a temporary object instead of a range element.
- V835. Passing cheap-to-copy argument by reference may lead to decreased performance.
- V1083. Signed integer overflow in arithmetic expression. This leads to undefined behavior.
- V1084. The expression is always true/false. The value is out of range of enum values.
- V1085. Negative value is implicitly converted to unsigned integer type in arithmetic expression.
- V3175. Locking operations must be performed on the same thread. Using 'await' in a critical section may lead to a lock being released on a different thread.
- V3176. The '&'= or '|=' operator is redundant because the right operand is always true/false.
- V5622. OWASP. Possible XPath injection. Potentially tainted data is used in the XPath expression.
- V5623. OWASP. Possible open redirect vulnerability. Potentially tainted data is used in the URL.
PVS-Studio 7.18 (April 6, 2022)
- PVS-Studio expands its support of OWASP Top 10 list of the most common Web-application security risks. At the moment, 9 out of 10 categories are covered. We plan to expand the analyzer to the last remaining category, A6 Vulnerable and Outdated Components, in one of the upcoming future releases, by implementing SCA (Software Composition Analysis) capabilities in PVS-Studio C# analyzer.
- This release brings an improved and updated semantic analysis system to PVS-Studio C and C++ analyzer, which is based on a new representation of type system of the analyzed source code. Adopting new type system representation allows the analyzer to significantly improve its understanding of modern C++ language, with its complex expressions, templates, standard library, etc. Many analyzer rules will benefit from this by expanding the variety and number of potentially dangerous code fragments they can discover, and also by reducing the number of mistakes that the rules can potentially make. However, considering the fundamental nature of the change in the analyzer, it is possible that new false-positive messages can also appear. If you experience such new false-positives, please write us - we always strive to fix any remaining analyzer mistakes as soon as possible.
- The PVS-Studio compiler monitoring system for Windows introduces a new 'wrapping' trace mode based on IFEO (Image File Execution Options) settings. Compiler monitoring is an all-round way of 'seamless' integration into any build system, as long as such build system utilizes one of the compilers supported by PVS-Studio. The new mode requires additional configuration before it can be used, making it a bit harder to set up. However, it solves a significant flaw of the monitoring system - skipping of short-lived processes. This flaw is especially devastating while using monitoring on tracing the compilation of C code for embedded platforms. The new wrapping mode allows to use compiler monitoring for such scenarios without skipping a single source file.
- A new section of documentation contains instructions on working with PVS-Studio analysis results from Visual Studio Code editor. The ability to convert analyzer report to the universal SARIF format also allows this report to be loaded into Visual Studio Code with the help of SARIF Viewer extension.
- A new dedicated section in analyzer documentation explores direct integration with CMake build automation system through native Cmake module for PVS-Studio. CMake module can now also be used under Microsoft Windows, and supports baselining analyzer results though suppress files.
- Yet another new documentation section talks about setting-up PVS-Studio analysis inside GitHub Action cloud CI system.
- PVS-Studio C++ analyzer for Visual Studio now supports analyzing Microsoft GDK (Game Development Kit) projects.
- New multiline navigation variants of errorfile, tasklist and SARIF log output formats were added to plog-converter log conversion tools.
- V1079. Parameter of 'std::stop_token' type is not used inside function's body.
- V1080. Call of 'std::is_constant_evaluated' function always returns the same value.
- V1081. Argument of abs() function is minimal negative value. Such absolute value can't be represented in two's complement. This leads to undefined behavior.
- V1082. Function marked as 'noreturn' may return control. This will result in undefined behavior.
- V5619. OWASP. Possible log injection. Potentially tainted data is written into logs.
- V5620. OWASP. Possible LDAP injection. Potentially tainted data is used in a search filter.
- V5621. OWASP. Error message contains potentially sensitive data that may be exposed.
PVS-Studio 7.17 (February 9, 2022)
- PVS-Studio analyzer for C and C++ languages now supports analyzing projects for C6000-CGT - a compiler for embedded systems developed by Texas Instruments. You can check the full list of platforms and compilers supported by PVS-Studio on our site.
- You can now suppress and unsuppress analyzer messages in Unreal Engine projects directly from PVS-Studio IDE extensions for Microsoft Visual Studio and JetBrains Rider. You can read more about baselining analyzer results in Unreal Engine projects from command line and IDE extensions in our documentation (see sections ' Suppression of analyzer warnings in Unreal Engine projects' and ' Suppression of analyzer warnings in the PVS-Studio plugins for CLion and Rider').
- We added a range of new annotations to PVS-Studio C# analyzer for the most common classes in ASP.NET Core libraries. This will allow the analyzer to better understand the code from projects that utilize ASP.NET.
- There is a partial change in the hash algorithm used by both the cross-platform LLVM Compilation Database analysis and tracing tool (pvs-studio-analyzer), and analysis log conversion tool (plog-converter). The hash algorithm is used by these tools to generate json message suppression files intended for baselining analysis results. The support for old-format suppress files still remains as a backward compatibility. However, if you wish to append your suppress files, we do advise to re-generate the suppress files in the new format. This change is necessary to make json suppress files fully cross-platform for all use-case scenarios of PVS-Studio in the upcoming future releases.
- V1077. Constructor contains potentially uninitialized members.
- V1078. An empty container is iterated. The loop will not be executed.
- V2017. String literal is identical to variable name. It is possible that the variable should be used instead of the string literal.
- V3174. Suspicious subexpression in a sequence of similar comparisons.
- V5617. OWASP. Assigning potentially negative or large value as timeout of HTTP session can lead to excessive session expiration time.
- V5618. OWASP. Possible server-side request forgery. Potentially tainted data is used in the URL.
PVS-Studio 7.16 (December 8, 2021)
- PVS-Studio now supports Microsoft Visual Studio 2022. Analyzer can be used with Visual C++ and C# projects targeting new compiler versions and standard C++ and C# libraries available in this new IDE version.
- PVS-Studio C# analyzer now supports Microsoft .NET 6 platform and a new version of C# language: C# 10.0.
- Support for MISRA C safety and reliability coding standard has reached 80% in this release, with full coverage of Mandatory and most of the Required categories. In future releases we plan to give more focus to other security standards, as well as to the general-purpose diagnostic rules.
- The baselining of analyzer messages through message suppression is extended to support Unreal Engine projects. Though in the current version of PVS-Studio the baselining for UE projects will only be available for the command line analyzer, the next release will feature baselining integration with Microsoft Visual Studio and JetBrains Rider PVS-Studio extensions.
- Also, we have a new documentation section explaining how to use PVS-Studio to check projects whose build model is represented in the JSON Compilation Database format. This method is available for projects based on CMake, QBS, Ninja, etc.
- PVS-Studio plug-ins for JetBrains IDEA and Android Studio, Rider and CLion now support re-assigning shortcuts for the most common commands: handling analyzer report, running the analysis, etc.
- V833. Using 'std::move' function with const object disables move semantics.
- V1076. Code contains invisible characters that may alter its logic. Consider enabling the display of invisible characters in the code editor.
- V2615. MISRA. A compatible declaration should be visible when an object or function with external linkage is defined.
- V2616. MISRA. All conditional inclusion preprocessor directives should reside in the same file as the conditional inclusion directive to which they are related.
- V2617. MISRA. Object should not be assigned or copied to an overlapping object.
- V2618. MISRA. Identifiers declared in the same scope and name space should be distinct.
- V2619. MISRA. Typedef names should be unique across all name spaces.
- V2620. MISRA. Value of a composite expression should not be cast to a different essential type category or a wider essential type.
- V2621. MISRA. Tag names should be unique across all name spaces.
- V2622. MISRA. External object or function should be declared once in one and only one file.
- V5616. OWASP. Possible command injection. Potentially tainted data is used to create OS command.
PVS-Studio 7.15 (October 7, 2021)
- This release introduces, for the users of PVS-Studio plug-in for Visual Studio, a new way of checking analysis log for the most interesting warnings among all others found in an analyzed project. The name of this new mode is Analyzer Best Warnings. PVS-Studio have always grouped its warnings into 3 certainty levels, and these levels were usually used for prioritizing the most interesting ones when reviewing the analysis results - the best ones were expected to be on the 1st level. In this new version of the analyzer, we developed a more sophisticated and precise algorithm of evaluating the reliability of warning messages. Besides warning message levels, it takes into account a number of other criteria, which can be subdivided into the static (an average 'value' of an analyzer rule) and dynamic ones, based on the warnings generated on a particular source code base (such as, for example, the total number of warnings for a particular rule). In future releases we plan on expanding this new mode, as well as adding it to our other supported IDEs and analyzer integrations. You can find more details on the Analyzer Best Warnings mode in our blog and documentation.
- We now provide a mapping for PVS-Studio rules with CWE Top 25 Most Dangerous Software Weaknesses list. PVS-Studio analyzers for C, C++, C# and Java already provide coverage for more than a half of CWE Top 25 categories, and we plan on expanding this coverage in future releases.
- In order to increase the quality of analysis for Unreal Engine projects, annotations for several hundred functions from the game engine were added to PVS-Studio C++ analyzer.
- The coverage for the list of the most common and dangerous threats to application security, OWASP Top 10 2017, was increased up to 9 categories our of 10. This makes only a single category remaining that is not covered by PVS-Studio - using components with known vulnerabilities. This category is usually covered by a distinct class of specialized tools - SCA (Software Composition Analysis). In future releases of PVS-Studio, to cover the last remaining OWASP Top 10 category, we plan on implementing SCA for PVS-Studio C# analyzer.
- Support for MISRA C safety and reliability coding standard is increased up to 70% in this release. We plan on further increasing the coverage for this standard up to 80% percent or more until the end of this year.
- Visual Studio plug-in now allows you to set-up and reassign shortcuts for false positive and message suppression, as well as for marking analyzer messages.
- Analysis log conversion tools now support generating a compliance report based on the MISRA Compliance standard. You can find more information about MISRA compliance report and how to generate in in our blog.
- We further increased the performance of PVS-Studio C# analyzer by optimizing the time it takes to evaluate (parse) the projects before the analysis. You can read about it in our blog.
- PVS-Studio C++ analyzer now supports a standardized way of printing the ranges of variables for very high values. This may lead to some analyzer messages changing their text representation, which, it turn, could cause some of the analyzer warnings that were suppressed by baselining to reappear. If you encounter this, please re-suppress these analyzer messages.
- V1075. The function expects the file to be opened in one mode, but it was opened in different mode.
- V2604. MISRA. Features from <stdarg.h> should not be used.
- V2605. MISRA. Features from <tgmath.h> should not be used.
- V2606. MISRA. There should be no attempt to write to a stream that has been opened for reading.
- V2607. MISRA. Inline functions should be declared with the static storage class.
- V2608. MISRA. The 'static' storage class specifier should be used in all declarations of object and functions that have internal linkage.
- V2609. MISRA. There should be no occurrence of undefined or critical unspecified behaviour.
- V2610. MISRA. The ', " or \ characters and the /* or // character sequences should not occur in a header file name.
- V2611. MISRA. Casts between a pointer to an incomplete type and any other type shouldn't be performed.
- V2612. MISRA. Array element should not be initialized more than once.
- V2613. MISRA. Operand that is a composite expression has more narrow essential type than the other operand.
- V2614. MISRA. External identifiers should be distinct.
- V3173. Possible incorrect initialization of variable. Consider verifying the initializer.
- V3555. AUTOSAR. The 'static' storage class specifier should be used in all declarations of functions that have internal linkage.
- V5612. OWASP. Do not use old versions of SSL/TLS protocols as it may cause security issues.
- V5613. OWASP. Use of outdated cryptographic algorithm is not recommended.
- V5614. OWASP. Potential XXE vulnerability. Insecure XML parser is used to process potentially tainted data.
- V5615. OWASP. Potential XEE vulnerability. Insecure XML parser is used to process potentially tainted data.
PVS-Studio 7.14 (August 9, 2021)
- PVS-Studio now provides a plugin for JetBrains CLion which allows to comfortably use the analyzer with this IDE. You can read about our experience with developing the plugin in our blog. And here you can find all other JetBrains IDEs which already support native PVS-Studio integration.
- PVS-Studio C++ analyzer now supports intermodular analysis. This new mode allows the analyzer to recognize invocations of methods declared in different translation units. Intermodular analysis is also already supported in C# (at project level) and Java (at package level) PVS-Studio analyzers. This mode is disabled by default in PVS-Studio C++ analyzer because currently it can decrease the overall analysis speed. You can read about specific details of this new mode's operation and implementation in our blog.
- PVS-Studio now covers 6 out of 10 categories in the OWASP Top 10 - a list of most common and dangerous threats to security of Web-applications. Current release adds diagnostic rules to the A5 Broken Access Control, A7 Cross-Site Scripting (XSS) and A8 Insecure Deserialization categories. PVS-Studio plans to increase the OWASP Top 10 cover to 9 categories in the upcoming releases this year.
- Support for MISRA C code safety standard is increased up to 60%. In the upcoming releases we plan to continue increasing the MISRA C support up to 80% in this year. Also, PVS-Studio is currently implementing support for MISRA C Compliance standard to be available in future releases this year.
- PVS-Studio SonarQube plugin now supports SonarQube 8.9 LTS.
- PVS-Studio C# analyzer analysis speed was increased up to 2 times when analyzing large-scale (in the range of 10 000 source files) projects. C# analyzer can now utilize multi-core processors much more efficiently. We shared some of the insights we've discovered while optimizing our C# analyzer in our blog - some of these can be used to boost the performance for other classes of .NET applications as well.
- Individual C++ analyzer rules can now be switched off for a range of source code lines.
- V2015. An identifier declared in an inner scope should not hide an identifier in an outer scope.
- V2016. Consider inspecting the function call. The function was annotated as dangerous.
- V2584. MISRA. Expression used in condition should have essential Boolean type.
- V2585. MISRA. Casts between a void pointer and an arithmetic type should not be performed.
- V2586. MISRA. Flexible array members should not be declared.
- V2587. MISRA. The '//' and '/*' character sequences should not appear within comments.
- V2588. MISRA. All memory or resources allocated dynamically should be explicitly released.
- V2589. MISRA. Casts between a pointer and a non-integer arithmetic type should not be performed.
- V2590. MISRA. Conversions should not be performed between pointer to function and any other type.
- V2591. MISRA. Bit fields should only be declared with explicitly signed or unsigned integer type.
- V2592. MISRA. An identifier declared in an inner scope should not hide an identifier in an outer scope.
- V2593. MISRA. Single-bit bit fields should not be declared as signed type.
- V2594. MISRA. Controlling expressions should not be invariant.
- V2595. MISRA. Array size should be specified explicitly when array declaration uses designated initialization.
- V2596. MISRA. The value of a composite expression should not be assigned to an object with wider essential type.
- V2597. MISRA. Cast should not convert pointer to function to any other pointer type.
- V2598. MISRA. Variable length array types are not allowed.
- V2599. MISRA. The standard signal handling functions should not be used.
- V2600. MISRA. The standard input/output functions should not be used.
- V2601. MISRA. Functions should be declared in prototype form with named parameters.
- V2602. MISRA. Octal and hexadecimal escape sequences should be terminated.
- V2603. MISRA. The 'static' keyword shall not be used between [] in the declaration of an array parameter.
- V3172. The 'if/if-else/for/while/foreach' statement and code block after it are not related. Inspect the program's logic.
- V3552. AUTOSAR. Cast should not convert a pointer to a function to any other pointer type, including a pointer to function type.
- V3553. AUTOSAR. The standard signal handling functions should not be used.
- V3554. AUTOSAR. The standard input/output functions should not be used.
- V5609. OWASP. Possible path traversal vulnerability. Potentially tainted data is used as a path.
- V5610. OWASP. Possible XSS vulnerability. Potentially tainted data might be used to execute a malicious script.
- V5611. OWASP. Potential insecure deserialization vulnerability. Potentially tainted data is used to create an object using deserialization.
PVS-Studio 7.13 (May 31, 2021)
- PVS-Studio C# analyzer can now analyze projects for .NET 5 platform. You can read about this in more detail in our blog.
- A new diagnostic rule for OWASP ASVS standard, that was added in this release to PVS-Studio C# analyzer, can find SQL Injection tainted data patterns (the rule V5608). The tainted data category of potential security vulnerabilities holds an important position in OWASP Top 10 rating. In future releases we plan to expand PVS-Studio capabilities to include the detection of more tainted data patterns.
- The Blame Notifier automatic analysis report generation and notification tool now supports sorting analyzer messages by commit numbers and dates based on blame information retrieved from version control system. This allows you to identify analyzer warnings that appeared on a particular day. You can read about this new mode in more detail in our blog.
- Continuing on the topic of automatic publication of analyzer reports - it is now possible to accomplish this without using our Blame Notifier tool. One of our users created a lightweight alternative (which does not depend upon .NET) which you can find on GitHub.
- Support for analyzing Ninja projects under Windows though JSON Compilation Database (compile_commands.json) was improved for PVS-Studio C++ analyzer.
- By using clang to build PVS-Studio C++ analyzer we've achieved an overall improvement in analyzer's performance up to 10% when analyzing source files on Windows operating system.
- PVS-Studio JetBrains Rider plugin now supports Rider 2021.1.
- File with suppressed analyzer messages can now be specified directly through command line for PVS-Studio_Cmd.exe, a tool for analyzing C++ and C# Visual Studio projects. Previous analyzer versions could only read suppression files through project or solution.
- V832. It's better to use '= default;' syntax instead of empty body.
- V1070. Signed value is converted to an unsigned one with subsequent expansion to a larger type in ternary operator.
- V1071. Consider inspecting the 'foo' function. The return value is not always used.
- V1072. The buffer is securely cleared not on all execution paths.
- V1073. Consider checking for misprints. Check the following code block after the 'if' statement.
- V1074. Boundary between numeric escape sequence and string is unclear. The escape sequence ends with a letter and the next character is also a letter. Check for typos.
- V2577. MISRA. The function argument corresponding to a parameter declared to have an array type should have an appropriate number of elements.
- V2578. MISRA. An identifier with array type passed as a function argument should not decay to a pointer.
- V2579. MISRA. Macro should not be defined with the same name as a keyword.
- V2580. MISRA. The 'restrict' specifier should not be used.
- V2581. MISRA. Single-line comments should not end with a continuation token.
- V2582. MISRA. Block of memory should only be freed if it was allocated by a Standard Library function.
- V2583. MISRA. Line whose first token is '#' should be a valid preprocessing directive.
- V3170. Both operands of the '??' operator are identical.
- V3171. Potentially negative value is used as the size of an array.
- V3551. AUTOSAR. An identifier with array type passed as a function argument should not decay to a pointer.
- V5013. OWASP. Storing credentials inside source code can lead to security issues.
- V5608. OWASP. Possible SQL injection. Potentially tainted data is used to create SQL command.
PVS-Studio 7.12 (March 11, 2021)
- PVS-Studio now provides mapping for its diagnostic rules to the list of most common security threats OWASP Top 10 Web Application Security Risks. This list is based on the consensus of security experts from around the world and is intended to give developers and security specialists the necessary information for prompt identification and removal of security risks from their applications.
- We extended the analyzer's capabilities for handling security (SEI CERT, OWASP ASVS) and safety (MISRA C, MISRA C++, AUTOSAR C++ 14 Coding Guidelines) standards. Now PVS-Studio not only provides the mapping of its diagnostic rules on web resources, but also renders the relevant information into all of its report formats (XML, Json, HTML, etc.), IDE integrations (Visual Studio, IntelliJ IDEA, Jetbrains Rider) and SonarQube integration (Security Category section and tags). You can read about all of the new PVS-Studio security-related capabilities in our blog.
- PVS-Studio C++ analyzer on Linux now supports IAR ARM and QNX compilers.
- CLMonitor.exe, a tool for monitoring and tracing C++ compiler invocations, now supports specification of individual source files for analysis, including the ability to specify individual header files (with support from compilation dependency system). This mode can be used to automate the analysis of merge and pull requests.
- Additional mode for disabling individual analyzer rules or groups of rules according to warning certainty levels was implemented for .pvsconfig rules configuration files and rule control comments in the source code (C++ analyzer only). You can find examples and details of this new mode in our documentation (Complete warning disabling subsection).
- Analyzing projects for MPLAB XC8 is now supported.
- V1068. Do not define an unnamed namespace in a header file.
- V1069. Do not concatenate string literals with different prefixes.
- V2575. MISRA. The global namespace should only contain 'main', namespace declarations and 'extern "C"' declarations.
- V2576. MISRA. The identifier 'main' should not be used for a function other than the global function 'main'.
- V3167. Parameter of 'CancellationToken' type is not used inside function's body.
- V3168. Awaiting on expression with potential null value can lead to throwing of 'NullReferenceException'.
- V3169. Suspicious return of a local reference variable which always equals null.
- V3501. AUTOSAR. Octal constants should not be used.
- V3502. AUTOSAR. Size of an array is not specified.
- V3503. AUTOSAR. The 'goto' statement shouldn't jump to a label declared earlier.
- V3504. AUTOSAR. The body of a loop\conditional statement should be enclosed in braces.
- V3505. AUTOSAR. The function with the 'atof/atoi/atoll/atoll' name should not be used.
- V3506. AUTOSAR. The function with the 'abort/exit/getenv/system' name should not be used.
- V3507. AUTOSAR. The macro with the 'setjmp' name and the function with the 'longjmp' name should not be used.
- V3508. AUTOSAR. Unbounded functions performing string operations should not be used.
- V3509. AUTOSAR. Unions should not be used.
- V3510. AUTOSAR. Declaration should contain no more than two levels of pointer nesting.
- V3511. AUTOSAR. The 'if' ... 'else if' construct should be terminated with an 'else' statement.
- V3512. AUTOSAR. Literal suffixes should not contain lowercase characters.
- V3513. AUTOSAR. Every switch-clause should be terminated by an unconditional 'break' or 'throw' statement.
- V3514. AUTOSAR. The 'switch' statement should have 'default' as the last label.
- V3515. AUTOSAR. All integer constants of unsigned type should have 'u' or 'U' suffix.
- V3516. AUTOSAR. A switch-label should only appear at the top level of the compound statement forming the body of a 'switch' statement.
- V3517. AUTOSAR. The functions from time.h/ctime should not be used.
- V3518. AUTOSAR. A switch-expression should not have Boolean type. Consider using of 'if-else' construct.
- V3519. AUTOSAR. The comma operator should not be used.
- V3520. AUTOSAR. Any label should be declared in the same block as 'goto' statement or in any block enclosing it.
- V3521. AUTOSAR. The loop counter should not have floating-point type.
- V3522. AUTOSAR. Unreachable code should not be present in the project.
- V3523. AUTOSAR. Functions should not have unused parameters.
- V3524. AUTOSAR. The value of uninitialized variable should not be used.
- V3525. AUTOSAR. Function with a non-void return type should return a value from all exit paths.
- V3526. AUTOSAR. Expression resulting from the macro expansion should be surrounded by parentheses.
- V3527. AUTOSAR. The return value of non-void function should be used.
- V3528. AUTOSAR. The address of an object with local scope should not be passed out of its scope.
- V3529. AUTOSAR. Floating-point values should not be tested for equality or inequality.
- V3530. AUTOSAR. Variable should be declared in a scope that minimizes its visibility.
- V3531. AUTOSAR. Expressions with enum underlying type should have values corresponding to the enumerators of the enumeration.
- V3532. AUTOSAR. Unary minus operator should not be applied to an expression of the unsigned type.
- V3533. AUTOSAR. Expression containing increment (++) or decrement (--) should not have other side effects.
- V3534. AUTOSAR. Incorrect shifting expression.
- V3535. AUTOSAR. Operand of sizeof() operator should not have other side effects.
- V3536. AUTOSAR. A pointer/reference parameter in a function should be declared as pointer/reference to const if the corresponding object was not modified.
- V3537. AUTOSAR. Subtraction, >, >=, <, <= should be applied only to pointers that address elements of the same array.
- V3538. AUTOSAR. The result of an assignment expression should not be used.
- V3539. AUTOSAR. Array indexing should be the only form of pointer arithmetic and it should be applied only to objects defined as an array type.
- V3540. AUTOSAR. There should be no implicit integral-floating conversion.
- V3541. AUTOSAR. A function should not call itself either directly or indirectly.
- V3542. AUTOSAR. Constant expression evaluation should not result in an unsigned integer wrap-around.
- V3543. AUTOSAR. Cast should not remove 'const' / 'volatile' qualification from the type that is pointed to by a pointer or a reference.
- V3544. AUTOSAR. The 'operator &&', 'operator ||', 'operator ,' and the unary 'operator &' should not be overloaded.
- V3545. AUTOSAR. Operands of the logical '&&' or the '||' operators, the '!' operator should have 'bool' type.
- V3546. AUTOSAR. Conversions between pointers to objects and integer types should not be performed.
- V3547. AUTOSAR. Identifiers that start with '__' or '_[A-Z]' are reserved.
- V3548. AUTOSAR. Functions should not be declared at block scope.
- V3549. AUTOSAR. The global namespace should only contain 'main', namespace declarations and 'extern "C"' declarations.
- V3550. AUTOSAR. The identifier 'main' should not be used for a function other than the global function 'main'.
- V5001. OWASP. It is highly probable that the semicolon ';' is missing after 'return' keyword.
- V5002. OWASP. An empty exception handler. Silent suppression of exceptions can hide the presence of bugs in source code during testing.
- V5003. OWASP. The object was created but it is not being used. The 'throw' keyword could be missing.
- V5004. OWASP. Consider inspecting the expression. Bit shifting of the 32-bit value with a subsequent expansion to the 64-bit type.
- V5005. OWASP. A value is being subtracted from the unsigned variable. This can result in an overflow. In such a case, the comparison operation can potentially behave unexpectedly.
- V5006. OWASP. More than N bits are required to store the value, but the expression evaluates to the T type which can only hold K bits.
- V5007. OWASP. Consider inspecting the loop expression. It is possible that the 'i' variable should be incremented instead of the 'n' variable.
- V5008. OWASP. Classes should always be derived from std::exception (and alike) as 'public'.
- V5009. OWASP. Unchecked tainted data is used in expression.
- V5010. OWASP. The variable is incremented in the loop. Undefined behavior will occur in case of signed integer overflow.
- V5011. OWASP. Possible overflow. Consider casting operands, not the result.
- V5012. OWASP. Potentially unsafe double-checked locking.
- V5301. OWASP. An exception handling block does not contain any code.
- V5302. OWASP. Exception classes should be publicly accessible.
- V5303. OWASP. The object was created but it is not being used. The 'throw' keyword could be missing.
- V5304. OWASP. Unsafe double-checked locking.
- V5305. OWASP. Storing credentials inside source code can lead to security issues.
- V5601. OWASP. Storing credentials inside source code can lead to security issues.
- V5602. OWASP. The object was created but it is not being used. The 'throw' keyword could be missing.
- V5603. OWASP. The original exception object was swallowed. Stack of original exception could be lost.
- V5604. OWASP. Potentially unsafe double-checked locking. Use volatile variable(s) or synchronization primitives to avoid this.
- V5605. OWASP. Unsafe invocation of event, NullReferenceException is possible. Consider assigning event to a local variable before invoking it.
- V5606. OWASP. An exception handling block does not contain any code.
- V5607. OWASP. Exception classes should be publicly accessible.
- V6102. Inconsistent synchronization of a field. Consider synchronizing the field on all usages.
- V6103. Ignored InterruptedException could lead to delayed thread shutdown.
- V6104. A pattern was detected: A || (A && ...). The expression is excessive or contains a logical error.
- V6105. Consider inspecting the loop expression. It is possible that different variables are used inside initializer and iterator.
- V6106. Casting expression to 'X' type before implicitly casting it to other type may be excessive or incorrect.
PVS-Studio 7.11 (December 17, 2020)
- A change was made to the activation procedure of pvs-studio-analyzer tool for free PVS-Studio version, that requires appending special comments to the header of each analyzed source file. Before first run of the analyzer, a special license key should be entered with the following command: pvs-studio-analyzer credentials PVS-Studio Free FREE-FREE-FREE-FREE.
- To increase reliability of mass analyzer message suppression, hash algorithm was modified for messages that are generated on lines of code containing non-latin symbols. For example, when the messages are generated on a line of code with comments. If such messages were already suppressed in suppress files, these messages can reappear in the analyzer's output - they can be re-suppressed after the update.
- pvs-studio-analyzer tool now supports IAR Arm compilers.
- pvs-studio-analyzer tool can now trace compilers invoked through ld-linux.
- V2574. MISRA. Functions shall not be declared at block scope.
- V3165. The expression of the 'char' type is passed as an argument of the 'A' type whereas similar overload with the string parameter exists.
- V3166. Calling the 'SingleOrDefault' method may lead to 'InvalidOperationException'.
- V6100. An object is used as an argument to its own method. Consider checking the first actual argument of the 'Foo' method.
- V6101. compareTo()-like methods can return not only the values -1, 0 and 1, but any values.
PVS-Studio 7.10 (November 5, 2020)
- PVS-Studio capabilities as a SAST (Static Application Security Testing) solution are increasing as we are launching the effort to support OWASP ASVS and AUTOSAR C++14 Coding Guidelines standards. Mapping tables between existing PVS-Studio rules and those two standards are now available. In future versions, PVS-Studio will increase its coverage for MISRA and AUTOSAR coding standards, as well as implement new rules based on OWASP Top 10 list for the most common and critical vulnerabilities.
- PVS-Studio plugin for JetBrains Rider IDE can now be used for checking Unreal Engine projects (JetBrains Rider for Unreal Engine is currently available in early access)
- PVS-Studio SonarQube plugin now supports classification of analyzer warnings that have a CWE (Common Weakness Enumeration) identifier as security defects in the Security Category tab.
- PVS-Studio analysis log conversion tools (PlogConverter.exe for Windows and plog-converter for Linux\macOS) now support converting analysis results to SARIF (Static Analysis Results Interchange Format). SARIF is a universal and open format for presenting result output from tools that are dedicated to finding software errors, security and safety flaws and vulnerabilities. This format is supported by a large number of static analyzer tools, and facilitates collaborative use of different code quality assurance tools in common infrastructures.
- V830. Decreased performance. Consider replacing the use of 'std::optional::value()' with either the '*' or '->' operator.
- V831. Decreased performance. Consider replacing the call to the 'at()' method with the 'operator[]'.
- V1064. The left operand of integer division is less than the right one. The result will always be zero.
- V1065. Expression can be simplified: check similar operands.
- V1066. The 'SysFreeString' function should be called only for objects of the 'BSTR' type.
- V1067. Throwing from exception constructor may lead to unexpected behavior.
- V3156. The argument of the method is not expected to be null.
- V3157. Suspicious division. Absolute value of the left operand is less than the right operand.
- V3158. Suspicious division. Absolute values of both operands are equal.
- V3159. Modified value of the operand is not used after the increment/decrement operation.
- V3160. Argument of incorrect type is passed to the 'Enum.HasFlag' method.
- V3161. Comparing value type variables with 'ReferenceEquals' is incorrect because compared values will be boxed.
- V3162. Suspicious return of an always empty collection.
- V3163. An exception handling block does not contain any code.
- V3164. Exception classes should be publicly accessible.
- V6093. Automatic unboxing of a variable may cause NullPointerException.
- V6094. The expression was implicitly cast from integer type to real type. Consider utilizing an explicit type cast to avoid the loss of a fractional part.
- V6095. Thread.sleep() inside synchronized block/method may cause decreased performance.
- V6096. An odd precise comparison. Consider using a comparison with defined precision: Math.abs(A - B) < Epsilon or Math.abs(A - B) > Epsilon.
- V6097. Lowercase 'L' at the end of a long literal can be mistaken for '1'.
- V6098. A method does not override another method from the base class.
- V6099. The initial value of the index in the nested loop equals 'i'. Consider using 'i + 1' instead.
PVS-Studio 7.09 (August 27, 2020)
- PVS-Studio is included in the Forrester Research report "Now Tech: Static Application Security Testing, Q3 2020" as a SAST specialist. Adopting Static Application Security Testing (SAST) methodology improves application security and helps to reduce the impact of security flaws in application lifecycle. Forrester Research is a leading emerging-technology research firm providing data and analysis that defines the impact of technology change on business. The report is available by purchase or with a subscription with Forrester Research.
- Navigation for interprocedural analyzer messages was improved in PVS-Studio C# analyzer, for Visual Studio and Rider PVS-Studio extensions. It is now possible to navigate to potentially dangerous code fragments inside a method when the analyzer produces a warning at this method's invocation.
- It is now possible to redefine default severity levels for PVS-Studio C# analyzer rules in rule configuration files (.pvsconfig).
- V012. Some warnings could have been disabled. PVS-Studio C++ analyzer's report can now include the exclusion rules that are defined in the rule configuration files (.pvsconfig).
- V826. Consider replacing standard container with a different one.
- V827. Maximum size of a vector is known at compile time. Consider pre-allocating it by calling reserve(N).
- V828. Decreased performance. Moving an object in a return statement prevents copy elision.
- V829. Lifetime of the heap-allocated variable is limited to the current function's scope. Consider allocating it on the stack instead.
- V1059. Macro name overrides a keyword/reserved name. This may lead to undefined behavior.
- V1060. Passing 'BSTR ' to the 'SysAllocString' function may lead to incorrect object creation.
- V1061. Extending 'std' or 'posix' namespace may result in undefined behavior.
- V1062. Class defines a custom new or delete operator. The opposite operator must also be defined.
- V1063. The modulo by 1 operation is meaningless. The result will always be zero.
- V3154. The 'a % b' expression always evaluates to 0.
- V3155. The expression is incorrect or it can be simplified.
- V6082. Unsafe double-checked locking.
- V6083. Serialization order of fields should be preserved during deserialization.
- V6084. Suspicious return of an always empty collection.
- V6085. An abnormality within similar comparisons. It is possible that a typo is present inside the expression.
- V6086. Suspicious code formatting. 'else' keyword is probably missing.
- V6087. InvalidClassException may occur during deserialization.
- V6088. Result of this expression will be implicitly cast to 'Type'. Check if program logic handles it correctly.
- V6089. It's possible that the line was commented out improperly, thus altering the program's operation logics.
- V6090. Field 'A' is being used before it was initialized.
- V6091. Suspicious getter/setter implementation. The 'A' field should probably be returned/assigned instead.
- V6092. A resource is returned from try-with-resources statement. It will be closed before the method exits.
PVS-Studio 7.08 (June 18, 2020)
- PVS-Studio C# analyzer for .NET Framework and .NET Core projects is now available under Linux and macOS systems.
- PVS-Studio C# analyzer can now be used from JetBrains Rider IDE.
- It is now very easy to try PVS-Studio analyzer on C and C++ code examples, without downloading and installing the analyzer's distribution, with the help of Compiler Explorer service. Please note - the Compiler Explorer service allows to try the analyzer on a small, isolated code fragment or synthetic example. For a comprehensive evaluation of analyzer's capabilities, please download and install full version of PVS-Studio.
- The new file list analysis mode in PVS-Studio_Cmd.exe command line tool under Windows now supports analysis of C, C++ and C# files and can track compile dependencies (source files dependency from header files). This mode can be used to configure merge and pull request analysis with PVS-Studio analyzer.
- PVS-Studio C# analyzer's analysis of Unity projects was improved - additional annotations for the most common types from Unity libraries were added.
- The 'plog-converter' log conversion utility (Linux, macOS) now supports TeamCity log output format.
- Blame Notifier developer automatic notification tool now supports Perforce version control system.
- V824. It is recommended to use the 'make_unique/make_shared' function to create smart pointers.
- V825. Expression is equivalent to moving one unique pointer to another. Consider using 'std::move' instead.
- V1056. The predefined identifier '__func__' always contains the string 'operator()' inside function body of the overloaded 'operator()'.
- V1057. Pseudo random sequence is the same at every program run. Consider assigning the seed to a value not known at compile-time.
- V1058. Nonsensical comparison of two different functions' addresses.
- V6078. Potential Java SE API compatibility issue.
- V6079. Value of variable is checked after use. Potential logical error is present. Check lines: N1, N2.
- V6080. Consider checking for misprints. It's possible that an assigned variable should be checked in the next condition.
- V6081. Annotation that does not have 'RUNTIME' retention policy will not be accessible through Reflection API.
PVS-Studio 7.07 (April 16, 2020)
- PVS-Studio C++ analyzer can now parse concepts. Concepts are an extension of C++ templates, which were introduced in C++20 language standard. The V003 analyzer error, that was caused by using concepts in analyzed code, was fixed.
- PVS-Studio SonarQube plugin now supports macOS.
- XML log conversion tool (PlogConverter) now supports output format for TeamCity continuous integration server.
- It is now possible to include and exclude specific projects from analysis in command line analyzer for Visual Studio \ MSBuild projects (PVS-Studio_Cmd.exe) through ‑‑selectProjects / ‑‑excludeProjects flags.
- Occasional hanging of PVS-Studio Visual Studio plugin while opening solutions, caused by double initialization, was fixed.
- V1053. Calling the 'foo' virtual function in the constructor/destructor may lead to unexpected result at runtime.
- V1054. Object slicing. Derived class object was copied to the base class object.
- V1055. The 'sizeof' expression returns the size of the container type, not the number of elements. Consider using the 'size()' function.
- V2573. MISRA. Identifiers that start with '__' or '_[A-Z]' are reserved.
PVS-Studio 7.06 (February 27, 2020)
- PVS-Studio can now be used with PlatformIO cross-platform IDE for embedded development. Additional details on configuring PVS-Studio in PlatformIO are available here.
- Memory allocation was optimized for PVS-Studio C# analyzer. This can speed-up the analysis of large-scale projects.
- New command line arguments were added to PVS-Studio C# analyzer: ‑‑excludeDefines / ‑‑appendDefines. These arguments can be used to undefine / define preprocessor symbols, which will be used during the analysis.
- PVS-Studio C# analyzer can now correctly understand Unity-specific null-checks of variables, when such variables are implicitly cast to bool type.
- V823. Decreased performance. Object may be created in-place in a container. Consider replacing methods: 'insert' -> 'emplace', 'push_*' -> 'emplace_*'.
- V1050. The uninitialized class member is used when initializing the base class.
- V1051. Consider checking for misprints. It's possible that an assigned variable should be checked in the next condition.
- V1052. Declaring virtual methods in a class marked as 'final' is pointless.
- V2562. MISRA. Expressions with pointer type should not be used in the '+', '-', '+=' and '-=' operations.
- V2563. MISRA. Array indexing should be the only form of pointer arithmetic and it should be applied only to objects defined as an array type.
- V2564. MISRA. There should be no implicit integral-floating conversion.
- V2565. MISRA. A function should not call itself either directly or indirectly.
- V2566. MISRA. Constant expression evaluation should not result in an unsigned integer wrap-around.
- V2567. MISRA. Cast should not remove 'const' / 'volatile' qualification from the type that is pointed to by a pointer or a reference.
- V2568. MISRA. Both operands of an operator should be of the same type category.
- V2569. MISRA. The 'operator &&', 'operator ||', 'operator ,' and the unary 'operator &' should not be overloaded.
- V2570. MISRA. Operands of the logical '&&' or the '||' operators, the '!' operator should have 'bool' type.
- V2571. MISRA. Conversions between pointers to objects and integer types should not be performed.
- V2572. MISRA. Value of the expression should not be converted to the different essential type or the narrower essential type.
- V3150. Loop break conditions do not depend on the number of iterations.
- V3151. Potential division by zero. Variable was used as a divisor before it was compared to zero. Check lines: N1, N2.
- V3152. Potential division by zero. Variable was compared to zero before it was used as a divisor. Check lines: N1, N2.
- V3153. Dereferencing the result of null-conditional access operator can lead to NullReferenceException. Consider removing parentheses around null-conditional access expression.
- V6077. Label is present inside a switch(). It is possible that these are misprints and 'default:' operator should be used instead.
PVS-Studio 7.05 (December 10, 2019)
- Blame Notifier tool, which provides notification of developers about analyzer results, is now available on all of the platforms supported by the analyzer (Windows, Linux, macOS). Blame Notifier uses information from version control system (SVN, Git, Mercurial) to identify a person responsible for writing the code that triggered an analyzer message.
- PVS-Studio can now be installed from Chocolatey package manager.
- Analysis of .NET Core 3 and 3.1 projects is now supported in C# analyzer.
- It is now possible, in Windows version of the analyzer, to specify the directories excluded from the analysis under specific Visual Studio projects and solutions inside .pvsconfig files.
- Memory footprint of PVS-Studio C# analyzer was optimized when it is used to analyze large-scale projects.
- V822. Decreased performance. A new object is created, while a reference to an object is expected.
- V1044. Loop break conditions do not depend on the number of iterations.
- V1045. The DllMain function throws an exception. Consider wrapping the throw operator in a try..catch block.
- V1046. Unsafe usage of the 'bool' and integer types together in the operation '&='.
- V1047. Lifetime of the lambda is greater than lifetime of the local variable captured by reference.
- V1048. Variable 'foo' was assigned the same value.
- V1049. The 'foo' include guard is already defined in the 'bar1.h' header. The 'bar2.h' header will be excluded from compilation.
- V2558. MISRA. A pointer/reference parameter in a function should be declared as pointer/reference to const if the corresponding object was not modified.
- V2559. MISRA. Subtraction, >, >=, <, <= should be applied only to pointers that address elements of the same array.
- V2560. MISRA. There should be no user-defined variadic functions.
- V2561. MISRA. The result of an assignment expression should not be used.
- V3146. Possible null dereference. A method can return default null value.
- V3147. Non-atomic modification of volatile variable.
- V3148. Casting potential 'null' value to a value type can lead to NullReferenceException.
- V3149. Dereferencing the result of 'as' operator can lead to NullReferenceException.
- V6072. Two similar code fragments were found. Perhaps, this is a typo and 'X' variable should be used instead of 'Y'.
- V6073. It is not recommended to return null or throw exceptions from 'toString' / 'clone' methods.
- V6074. Non-atomic modification of volatile variable.
- V6075. The signature of method 'X' does not conform to serialization requirements.
- V6076. Recurrent serialization will use cached object state from first serialization.
PVS-Studio 7.04 (September 4, 2019)
- PVS-Studio plugin for IntelliJ IDEA now supports IDEA version 192.
- PVS-Studio plugins for Visual Studio can now automatically load analysis report when analyzing Unreal Engine projects.
- PVS-Studio C# analyzer can now analyze projects for .NET Core 3 Preview.
- PVS-Studio C# analyzer now supports getting return values from async methods and get\set property accessors.
- Compiler monitoring tool under Windows now supports tracing only the child processes from a specified parent process.
- Added a new mode to ignore cache for compiler monitoring under for Linux.
- PVS-Studio plugin for displaying analysis results in Jenkins can now be used under Linux and macOS hosts (previously it was available only under Windows).
- PVS-Studio plugin for SonarQube now supports SonarQube 7.9 LTS.
- V1040. Possible typo in the spelling of a pre-defined macro name.
- V1041. Class member is initialized with dangling reference.
- V1042. This file is marked with copyleft license, which requires you to open the derived source code.
- V1043. A global object variable is declared in the header. Multiple copies of it will be created in all translation units that include this header file.
- V2551. MISRA. Variable should be declared in a scope that minimizes its visibility.
- V2552. MISRA. Expressions with enum underlying type should have values corresponding to the enumerators of the enumeration.
- V2553. MISRA. Unary minus operator should not be applied to an expression of the unsigned type.
- V2554. MISRA. Expression containing increment (++) or decrement (--) should not have other side effects.
- V2555. MISRA. Incorrect shifting expression.
- V2556. MISRA. Use of a pointer to FILE when the associated stream has already been closed.
- V2557. MISRA. Operand of sizeof() operator should not have other side effects.
- V3140. Property accessors use different backing fields.
- V3141. Expression under 'throw' is a potential null, which can lead to NullReferenceException.
- V3142. Unreachable code detected. It is possible that an error is present.
- V3143. The 'value' parameter is rewritten inside a property setter, and is not used after that.
- V3144. This file is marked with copyleft license, which requires you to open the derived source code.
- V3145. Unsafe dereference of a WeakReference target. The object could have been garbage collected before the 'Target' property was accessed.
- V6068. Suspicious use of BigDecimal class.
- V6069. Unsigned right shift assignment of negative 'byte' / 'short' value.
- V6070. Unsafe synchronization on an object.
- V6071. This file is marked with copyleft license, which requires you to open the derived source code.
PVS-Studio 7.03 (June 25, 2019)
- PVS-Studio analyzer documentation now contains a section describing the use of analyzer inside containers under Docker.
- Support for analyzing QNX Momentics projects, QCC compiler.
- V1038. It's odd that a char or string literal is added to a pointer.
- V1039. Character escape is used in multicharacter literal. This causes implementation-defined behavior.
- V2543. MISRA. Value of the essential character type should be used appropriately in the addition/subtraction operations.
- V2544. MISRA. Values of the essential appropriate types should be used at expressions.
- V2545. MISRA. Conversion between pointers of different object types should not be performed.
- V2546. MISRA. Expression resulting from the macro expansion should be surrounded by parentheses.
- V2547. MISRA. The return value of non-void function should be used.
- V2548. MISRA. The address of an object with local scope should not be passed out of its scope.
- V2549. MISRA. Pointer to FILE should not be dereferenced.
- V2550. MISRA. Floating-point values should not be tested for equality or inequality.
- V3138. String literal contains potential interpolated expression.
- V3139. Two or more case-branches perform the same actions.
- V6067. Two or more case-branches perform the same actions.
PVS-Studio 7.02 (April 25, 2019)
- PVS-Studio now supports Visual Studio 2019. Visual C++,.NET Framework and .NET Core projects from Visual Studio 2019 can be analyzed from IDE itself, or from command line through PVS-Studio_Cmd.exe tool.
- PVS-Studio C# analyzer now supports new syntax from C# 8.0.
- PVS-Studio C# now can detect potential null dereferences (V3080 rule) inside methods when potential null value is passed to a method as an argument.
- Plugin for PVS-Studio Java analyzer is now available in the official JetBrains plugin repository. You can now also install integration with IDEA through our Windows Installer.
- PVS-Studio plugins for IDEA, Maven and Gradle now provide mass suppression of analyzer messages, which can be used to hide analyzer warnings on a legacy code during analyzer integration into development process.
- Compiler monitoring for Windows now can correctly work when monitoring a build under Keil uVision in case a Windows user name contains non-Latin characters.
- V1037. Two or more case-branches perform the same actions.
- V2530. MISRA. The loop should be terminated with no more than one 'break' or 'goto' statement.
- V2531. MISRA. Expression of the essential 'foo' type should not be cast to the essential 'bar' type.
- V2532. MISRA. String literal should not be assigned to object unless it has type of pointer to const-qualified char.
- V2533. MISRA. C-style and functional notation casts should not be performed.
- V2534. MISRA. The loop counter should not have floating-point type.
- V2535. MISRA. Unreachable code should not be present in the project.
- V2536. MISRA. Function should not contain labels not used by any 'goto' statements.
- V2537. MISRA. Functions should not have unused parameters.
- V2538. MISRA. The value of uninitialized variable should not be used.
- V2539. MISRA. Class destructor should not exit with an exception.
- V2540. MISRA. Arrays should not be partially initialized.
- V2541. MISRA. Function should not be declared implicitly.
- V2542. MISRA. Function with a non-void return type should return a value from all exit paths.
PVS-Studio 7.01 (March 13, 2019)
- The limit that existed in the trial version of the analyzer for Visual Studio plugin, restricting a number of analyzer's messages that can be viewed in the source code, is no more! Now, PVS-Studio for Windows uses the same trial mode as PVS-Studio on other platforms - you can get a fully functional trial license by filling out a form on the analyzer's download page.
- PVS-Studio C# rule V3080 (null dereference) is now able to detect potential dereferences when a reference can receive null in one of the execution branches. Inter-procedural analysis was improved.
- PVS-Studio Visual Studio plugin can now perform automatic checkouts on suppress files that are stored in TFVC (Team Foundation Version Control). This mode can be enabled on 'Options... > Specific Analyzer Settings' page.
- V1036. Potentially unsafe double-checked locking.
- V2529. MISRA. Any label should be declared in the same block as 'goto' statement or in any block enclosing it.
PVS-Studio 7.00 (January 16, 2019)
- PVS-Studio 7.00 now provides static analyzer for Java. You can read about all new features of PVS-Studio 7.00 in our blog.
- PVS-Studio plugin for SonarQube is updated to support latest SonarQube version 7.4. The minimal SonarQube version supported by PVS-Studio plugin is now raised to LTS SonarQube version 6.7.
- V2526. MISRA. The function with the 'clock/time/difftime/ctime/ asctime/gmtime/localtime/mktime' name should not be used.
- V2527. MISRA. A switch-expression should not have Boolean type. Consider using of 'if-else' construct.
- V2528. MISRA. The comma operator should not be used.
- V6001. There are identical sub-expressions to the left and to the right of the 'foo' operator.
- V6002. The switch statement does not cover all values of the enum.
- V6003. The use of 'if (A) {...} else if (A) {...}' pattern was detected. There is a probability of logical error presence.
- V6004. The 'then' statement is equivalent to the 'else' statement.
- V6005. The 'x' variable is assigned to itself.
- V6006. The object was created but it is not being used. The 'throw' keyword could be missing.
- V6007. Expression is always true/false.
- V6008. Potential null dereference.
- V6009. Function receives an odd argument.
- V6010. The return value of function 'Foo' is required to be utilized.
- V6011. The expression contains a suspicious mix of integer and real types
- V6012. The '?:' operator, regardless of its conditional expression, always returns one and the same value.
- V6013. Comparison of arrays, strings, collections by reference. Possibly an equality comparison was intended.
- V6014. It's odd that this method always returns one and the same value of NN.
- V6015. Consider inspecting the expression. Probably the '!='/'-='/'+=' should be used here.
- V6016. Suspicious access to element by a constant index inside a loop.
- V6017. The 'X' counter is not used inside a nested loop. Consider inspecting usage of 'Y' counter.
- V6018. Constant expression in switch statement.
- V6019. Unreachable code detected. It is possible that an error is present.
- V6020. Division or mod division by zero.
- V6021. The value is assigned to the 'x' variable but is not used.
- V6022. Parameter is not used inside method's body.
- V6023. Parameter 'A' is always rewritten in method body before being used.
- V6024. The 'continue' operator will terminate 'do { ... } while (false)' loop because the condition is always false.
- V6025. Possibly index is out of bound.
- V6026. This value is already assigned to the 'b' variable.
- V6027. Variables are initialized through the call to the same function. It's probably an error or un-optimized code.
- V6028. Identical expressions to the left and to the right of compound assignment.
- V6029. Possible incorrect order of arguments passed to method.
- V6030. The function located to the right of the '|' and '&' operators will be called regardless of the value of the left operand. Consider using '||' and '&&' instead.
- V6031. The variable 'X' is being used for this loop and for the outer loop.
- V6032. It is odd that the body of 'Foo_1' function is fully equivalent to the body of 'Foo_2' function.
- V6033. An item with the same key has already been added.
- V6034. Shift by N bits is inconsistent with the size of type.
- V6035. Double negation is present in the expression: !!x.
- V6036. The value from the uninitialized optional is used.
- V6037. An unconditional 'break/continue/return/goto' within a loop.
- V6038. Comparison with 'double.NaN' is meaningless. Use 'double.isNaN()' method instead.
- V6039. There are two 'if' statements with identical conditional expressions. The first 'if' statement contains method return. This means that the second 'if' statement is senseless.
- V6040. The code's operational logic does not correspond with its formatting.
- V6041. Suspicious assignment inside the conditional expression of 'if/while/do...while' statement.
- V6042. The expression is checked for compatibility with type 'A', but is cast to type 'B'.
- V6043. Consider inspecting the 'for' operator. Initial and final values of the iterator are the same.
- V6044. Postfix increment/decrement is senseless because this variable is overwritten.
- V6045. Suspicious subexpression in a sequence of similar comparisons.
- V6046. Incorrect format. Consider checking the N format items of the 'Foo' function.
- V6047. It is possible that this 'else' branch must apply to the previous 'if' statement.
- V6048. This expression can be simplified. One of the operands in the operation equals NN. Probably it is a mistake.
- V6049. Classes that define 'equals' method must also define 'hashCode' method.
- V6050. Class initialization cycle is present.
- V6051. Use of jump statements in 'finally' block can lead to the loss of unhandled exceptions.
- V6052. Calling an overridden method in parent-class constructor may lead to use of uninitialized data.
- V6053. Collection is modified while iteration is in progress. ConcurrentModificationException may occur.
- V6054. Classes should not be compared by their name.
- V6055. Expression inside assert statement can change object's state.
- V6056. Implementation of 'compareTo' overloads the method from a base class. Possibly, an override was intended.
- V6057. Consider inspecting this expression. The expression is excessive or contains a misprint.
- V6058. The 'X' function receives objects of incompatible types.
- V6059. Odd use of special character in regular expression. Possibly, it was intended to be escaped.
- V6060. The reference was used before it was verified against null.
- V6061. The used constant value is represented by an octal form.
- V6062. Possible infinite recursion.
- V6063. Odd semicolon ';' after 'if/foreach' operator.
- V6064. Suspicious invocation of Thread.run().
- V6065. A non-serializable class should not be serialized.
- V6066. Passing objects of incompatible types to the method of collection.
Release history for old versions
Please read release history for old versions here.
Old PVS-Studio release history (before 7.00)
- PVS-Studio 6.27 (December 3, 2018)
- PVS-Studio 6.26 (October 18, 2018)
- PVS-Studio 6.25 (August 20, 2018)
- PVS-Studio 6.24 (June 14, 2018)
- PVS-Studio 6.23 (March 28, 2018)
- PVS-Studio 6.22 (February 28, 2018)
- PVS-Studio 6.21 (January 15, 2018)
- PVS-Studio 6.20 (December 1, 2017)
- PVS-Studio 6.19 (November 14, 2017)
- PVS-Studio 6.18 (September 26, 2017)
- PVS-Studio 6.17 (August 30, 2017)
- PVS-Studio 6.16 (June 28, 2017)
- PVS-Studio 6.15 (April 27, 2017)
- PVS-Studio 6.14 (March 17, 2017)
- PVS-Studio 6.13 (January 27, 2017)
- PVS-Studio 6.12 (December 22, 2016)
- PVS-Studio 6.11 (November 29, 2016)
- PVS-Studio 6.10 (October 25, 2016)
- PVS-Studio 6.09 (October 6, 2016)
- PVS-Studio 6.08 (August 22, 2016)
- PVS-Studio 6.07 (August 8, 2016)
- PVS-Studio 6.06 (July 7, 2016)
- PVS-Studio 6.05 (June 9, 2016)
- PVS-Studio 6.04 (May 16, 2016)
- PVS-Studio 6.03 (April 5, 2016)
- PVS-Studio 6.02 (March 9, 2016)
- PVS-Studio 6.01 (February 3, 2016)
- PVS-Studio 6.00 (December 22, 2015)
- PVS-Studio 5.31 (November 3, 2015)
- PVS-Studio 5.30 (October 29, 2015)
- PVS-Studio 5.29 (September 22, 2015)
- PVS-Studio 5.28 (August 10, 2015)
- PVS-Studio 5.27 (July 28, 2015)
- PVS-Studio 5.26 (June 30, 2015)
- PVS-Studio 5.25 (May 12, 2015)
- PVS-Studio 5.24 (April 10, 2015)
- PVS-Studio 5.23 (March 17, 2015)
- PVS-Studio 5.22 (February 17, 2015)
- PVS-Studio 5.21 (December 11, 2014)
- PVS-Studio 5.20 (November 12, 2014)
- PVS-Studio 5.19 (September 18, 2014)
- PVS-Studio 5.18 (July 30, 2014)
- PVS-Studio 5.17 (May 20, 2014)
- PVS-Studio 5.16 (April 29, 2014)
- PVS-Studio 5.15 (April 14, 2014)
- PVS-Studio 5.14 (March 12, 2014)
- PVS-Studio 5.13 (February 5, 2014)
- PVS-Studio 5.12 (December 23, 2013)
- PVS-Studio 5.11 (November 6, 2013)
- PVS-Studio 5.10 (October 7, 2013)
- PVS-Studio 5.06 (August 13, 2013)
- PVS-Studio 5.05 (May 28, 2013)
- PVS-Studio 5.04 (May 14, 2013)
- PVS-Studio 5.03 (April 16, 2013)
- PVS-Studio 5.02 (March 6, 2013)
- PVS-Studio 5.01 (February 13, 2013)
- PVS-Studio 5.00 (January 31, 2013)
- PVS-Studio 4.77 (December 11, 2012)
- PVS-Studio 4.76 (November 23, 2012)
- PVS-Studio 4.75 (November 12, 2012)
- PVS-Studio 4.74 (October 16, 2012)
- PVS-Studio 4.73 (September 17, 2012)
- PVS-Studio 4.72 (August 30, 2012)
- PVS-Studio 4.71 (July 20, 2012)
- PVS-Studio 4.70 (July 3, 2012)
- PVS-Studio 4.62 (May 30, 2012)
- PVS-Studio 4.61 (May 22, 2012)
- PVS-Studio 4.60 (April 18, 2012)
- PVS-Studio 4.56 (March 14, 2012)
- PVS-Studio 4.55 (February 28, 2012)
- PVS-Studio 4.54 (February 1, 2012)
- PVS-Studio 4.53 (January 19, 2012)
- PVS-Studio 4.52 (December 28, 2011)
- PVS-Studio 4.51 (December 22, 2011)
- PVS-Studio 4.50 (December 15, 2011)
- PVS-Studio 4.39 (November 25, 2011)
- PVS-Studio 4.38 (October 12, 2011)
- PVS-Studio 4.37 (September 20, 2011)
- PVS-Studio 4.36 (August 31, 2011)
- PVS-Studio 4.35 (August 12, 2011)
- PVS-Studio 4.34 (July 29, 2011)
- PVS-Studio 4.33 (July 21, 2011)
- PVS-Studio 4.32 (July 15, 2011)
- PVS-Studio 4.31 (July 6, 2011)
- PVS-Studio 4.30 (June 23, 2011)
- PVS-Studio 4.21 (May 20, 2011)
- PVS-Studio 4.20 (April 29, 2011)
- PVS-Studio 4.17 (April 15, 2011)
- PVS-Studio 4.16 (April 1, 2011)
- PVS-Studio 4.15 (March 17, 2011)
- PVS-Studio 4.14 (March 2, 2011)
- PVS-Studio 4.13 (February 11, 2011)
- PVS-Studio 4.12 (February 7, 2011)
- PVS-Studio 4.11 (January 28, 2011)
- PVS-Studio 4.10 (January 17, 2011)
- PVS-Studio 4.00 (December 24, 2010)
- PVS-Studio 4.00 BETA (November 24, 2010)
- PVS-Studio 3.64 (27 September 2010)
- PVS-Studio 3.63 (10 September 2010)
- PVS-Studio 3.62 (16 August 2010)
- PVS-Studio 3.61 (22 July 2010)
- PVS-Studio 3.60 (10 June 2010)
- PVS-Studio 3.53 (7 May 2010)
- PVS-Studio 3.52 (27 April 2010)
- PVS-Studio 3.51 (16 April 2010)
- PVS-Studio 3.50 (26 March 2010)
- PVS-Studio 3.44 (21 January 2010)
- PVS-Studio 3.43 (28 December 2009)
- PVS-Studio 3.42 (9 December 2009)
- PVS-Studio 3.41 (30 November 2009)
- PVS-Studio 3.40 (23 November 2009)
- PVS-Studio 3.30 (25 September 2009)
- PVS-Studio 3.20 (7 September 2009)
- PVS-Studio 3.10 (10 August 2009)
- PVS-Studio 3.00 (27 July 2009)
- VivaMP 1.10 (20 April 2009)
- VivaMP 1.00 (10 March 2009)
- VivaMP 1.00 beta (27 November 2008)
- Viva64 2.30 (20 April 2009)
- Viva64 2.22 (10 Mach 2009)
- Viva64 2.21 (27 November 2008)
- Viva64 2.20 (15 October 2008)
- Viva64 2.10 (05 September 2008)
- Viva64 2.0 (09 July 2008)
- Viva64 1.80 (03 February 2008)
- Viva64 1.70 (20 December 2007)
- Viva64 1.60 (28 August 2007)
- Viva64 1.50 (15 May 2007)
- Viva64 1.40 (1 May 2007)
- Viva64 1.30 (17 March 2007)
- Viva64 1.20 (26 January 2007)
- Viva64 1.10 (16 January 2007)
- Viva64 1.00 (31 December 2006)
Please read actual release history here.
PVS-Studio 6.27 (December 3, 2018)
- Analyzer log conversion tools (plog converter) source code is now available at our GitHub portal: https://github.com/viva64
- PVS-Studio now supports MISRA C and MISRA C++ software development guidelines. The number of supported MISRA rules will gradually increase in the future analyzer releases.
- V2501. MISRA. Octal constants should not be used.
- V2502. MISRA. The 'goto' statement should not be used.
- V2503. MISRA. Implicitly specified enumeration constants should be unique – consider specifying non-unique constants explicitly.
- V2504. MISRA. Size of an array is not specified.
- V2505. MISRA. The 'goto' statement shouldn't jump to a label declared earlier.
- V2506. MISRA. A function should have a single point of exit at the end.
- V2507. MISRA. The body of a loop\conditional statement should be enclosed in braces.
- V2508. MISRA. The function with the 'atof/atoi/atoll/atoll' name should not be used.
- V2509. MISRA. The function with the 'abort/exit/getenv/system' name should not be used.
- V2510. MISRA. The function with the 'qsort/bsearch' name should not be used.
- V2511. MISRA. Memory allocation and deallocation functions should not be used.
- V2512. MISRA. The macro with the 'setjmp' name and the function with the 'longjmp' name should not be used.
- V2513. MISRA. Unbounded functions performing string operations should not be used.
- V2514. MISRA. Unions should not be used.
- V2515. MISRA. Declaration should contain no more than two levels of pointer nesting.
- V2516. MISRA. The 'if' ... 'else if' construct shall be terminated with an 'else' statement.
- V2517. MISRA. Literal suffixes should not contain lowercase characters.
- V2518. MISRA. The 'default' label should be either the first or the last label of a 'switch' statement.
- V2519. MISRA. The 'default' label is missing in 'switch' statement.
- V2520. MISRA. Every switch-clause should be terminated by an unconditional 'break' or 'throw' statement.
- V2521. MISRA. Only the first member of enumerator list should be explicitly initialized, unless all members are explicitly initialized.
- V2522. MISRA. The 'switch' statement should have 'default' as the last label.
- V2523. MISRA. All integer constants of unsigned type should have 'u' or 'U' suffix.
- V2524. MISRA. A switch-label should only appear at the top level of the compound statement forming the body of a 'switch' statement.
- V2525. MISRA. Every 'switch' statement should contain non-empty switch-clauses.
PVS-Studio 6.26 (October 18, 2018)
- Support for analyzing projects for GNU Arm Embedded Toolchain, Arm Embedded GCC compiler was added.
- It is now possible to use pvsconfig files with CLMonitor/Standalone under Windows.
- Letter case is now preserved for analyzed source files in the analyzer's log when analyzing Visual C++ projects (cl.exe, Visual Studio/MSBuild vcxproj projects).
- New incremental analysis mode was added to pvs-studio-analyzer/Cmake module. PVS-Studio CMake module can now be used for Visual C++ (cl.exe) projects under Windows.
- Incremental analysis support was implemented for .NET Core/.NET Standard Visual Studio projects.
- Now it is possible to analyze projects of WAF build automation tool.
- V1021. The variable is assigned the same value on several loop iterations.
- V1022. An exception was thrown by pointer. Consider throwing it by value instead.
- V1023. A pointer without owner is added to the container by the 'emplace_back' method. A memory leak will occur in case of an exception.
- V1024. The stream is checked for EOF before reading from it, but is not checked after reading. Potential use of invalid data.
- V1025. Rather than creating 'std::unique_lock' to lock on the mutex, a new variable with default value is created.
- V1026. The variable is incremented in the loop. Undefined behavior will occur in case of signed integer overflow.
- V1027. Pointer to an object of the class is cast to unrelated class.
- V1028. Possible overflow. Consider casting operands, not the result.
- V1029. Numeric Truncation Error. Return value of function is written to N-bit variable.
- V1030. The variable is used after it was moved.
- V1031. Function is not declared. The passing of data to or from this function may be affected.
- V1032. Pointer is cast to a more strictly aligned pointer type.
- V1033. Variable is declared as auto in C. Its default type is int.
- V1034. Do not use real-type variables as loop counters.
- V1035. Only values that are returned from fgetpos() can be used as arguments to fsetpos().
- V2014. Don't use terminating functions in library code.
PVS-Studio 6.25 (August 20, 2018)
- A common suppress file for all projects can now be added to a Visual Studio solution.
- Roslyn and MSBuild libraries used for analyzing Visual Studio projects were updated to support latest C++/C# project types and C# language features.
- Support for multi-target C# projects was improved.
- PVS-Studio CMake module now supports generator expressions and can track implicit dependencies of analyzed files.
- Our website now provides information on using PVS-Studio as a part of security development lifecycle (SDL), as a SAST (Static Application Security Testing) tool. This page contains mappings of analyzer diagnostics rules to the CWE (Common Weakness Enumeration) format and SEI CERT secure coding standard, and the status of our ongoing effort to support MISRA standards.
PVS-Studio 6.24 (June 14, 2018)
- Support for Texas Instruments Code Composer Studio, ARM compiler was added under Windows\Linux.
- Compiler monitoring under Windows now supports saving monitoring data to a dump file and starting the analysis from this dump file. This allows to re-run the analysis without the necessity to re-build the analyzed project each time.
- A new mode for checking individual files was added to the command line analyzer for Visual Studio projects under Windows.
- V1013. Suspicious subexpression in a sequence of similar comparisons.
- V1014. Structures with members of real type are compared byte-wise.
- V1015. Suspicious simultaneous use of bitwise and logical operators.
- V1016. The value is out of range of enum values. This causes unspecified or undefined behavior.
- V1017. Variable of the 'string_view' type references a temporary object which will be removed after evaluation of an expression.
- V1018. Usage of a suspicious mutex wrapper. It is probably unused, uninitialized, or already locked.
- V1019. Compound assignment expression is used inside condition.
- V1020. Function exited without performing epilogue actions. It is possible that there is an error.
PVS-Studio 6.23 (March 28, 2018)
- PVS-Studio is now available on macOS! Now you can analyze C and C++ source code with PVS-Studio not only under Windows/Linux, but also under macOS. The analyzer is available as a pkg installer, tgz archive and through Homebrew package manager. The documentation on using PVS-Studio under macOS is available here.
- V011. Presence of #line directives may cause some diagnostic messages to have incorrect file name and line number.
- V1011. Function execution could be deferred. Consider specifying execution policy explicitly.
- V1012. The expression is always false. Overflow check is incorrect.
PVS-Studio 6.22 (February 28, 2018)
- Analyzing projects for Keil MDK ARM Compiler 5 and ARM Compiler 6 is now supported.
- Analyzing projects for IAR C/C++ Compiler for ARM is now supported.
- V1008. Consider inspecting the 'for' operator. No more than one iteration of the loop will be performed.
- V1009. Check the array initialization. Only the first element is initialized explicitly.
- V1010. Unchecked tainted data is used in expression.
PVS-Studio 6.21 (January 15, 2018)
- Support for CWE (Common Weakness Enumeration) was added to C/C++/C# analyzers.
- HTML log with source code navigation can now be saved from Visual Studio plugins and the Standalone tool.
- WDK (Windows Driver Kit) projects for Visual Studio 2017 are now supported.
- PVS-Studio plugin for SonarQube was updated for the latest LTS version 6.7.
- V1007. The value from the uninitialized optional is used. Probably it is a mistake.
PVS-Studio 6.20 (December 1, 2017)
- You can save analysis results as HTML with full source code navigation.
- You can make the analysis less "noisy" by disabling generation of Low Certainty (Level 3) messages. Just set the NoNoise option.
PVS-Studio 6.19 (November 14, 2017)
- It is now possible to suppress messages from XML log file (.plog) with Windows command line analyzer.
- The performance and stability of message suppression and incremental analysis were improved in Visual Studio plugins for very large (thousands of projects) solutions.
- V1004. The pointer was used unsafely after it was verified against nullptr.
- V1005. The resource was acquired using 'X' function but was released using incompatible 'Y' function.
- V1006. Several shared_ptr objects are initialized by the same pointer. A double memory deallocation will occur.
PVS-Studio 6.18 (September 26, 2017)
- Linux version now has a default location for a license file.
- Linux version now provides a new way to enter credentials.
- Linux version now can generate an HTML analysis report.
- The support of ASP.Net Core projects analysis is added in Windows version.
- Scaling of UI elements on different DPIs was improved in Windows version
- Performance of PVS-Studio output window in Windows version was improved when working with large analyzer reports, sorting the reports by columns, working with a large number of simultaneously selected messages.
- "Send to External Tool" feature was removed from Visual Studio extension.
- Trial mode extension dialogs were substantially redesigned in Visual Studio extension.
- V1002. A class, containing pointers, constructor and destructor, is copied by the automatically generated operator= or copy constructor.
- V1003. The macro is a dangerous, or the expression is suspicious.
PVS-Studio 6.17 (August 30, 2017)
- 15.3 Update supported for Visual Studio 2017.
- Analyzer report can now be saved from Visual Studio plugin and Standalone in txt\csv\html formats without the need to invoke PlogConverter manually.
- The license and setting files are now saved in UTF-8 encoding.
- A list of recently opened logs is added to the menu of Visual Studio plugins.
- Incremental analysis in PVS-Studio_Cmd.exe - the "AppendScan" option was added. Details can be found in the description of PVS-Studio_Cmd utility here.
- A new plugin to display the analysis results in the Jenkins continuous integration system (on Windows)
- A new version of plugin for SonarQube quality control platform for Linux.
- Support for unparsed output from C++ analyzer was added to PlogConverter tool.
- V821. The variable can be constructed in a lower level scope.
- V1001. The variable is assigned but is not used until the end of the function.
- V3135. The initial value of the index in the nested loop equals 'i'. Consider using 'i + 1' instead.
- V3136. Constant expression in switch statement.
- V3137. The variable is assigned but is not used until the end of the function.
PVS-Studio 6.16 (June 28, 2017)
- Clang-based toolsets support for Visual Studio 2015/2017.
- Solution directory can now be used as Source Tree Root in Visual Studio.
- V788. Review captured variable in lambda expression.
- V789. Iterators for the container, used in the range-based for loop, become invalid upon a function call.
- V790. It is odd that the assignment operator takes an object by a non-constant reference and returns this object.
- V791. The initial value of the index in the nested loop equals 'i'. Consider using 'i + 1' instead.
- V792. The function located to the right of the '|' and '&' operators will be called regardless of the value of the left operand. Consider using '||' and '&&' instead.
- V793. It is odd that the result of the statement is a part of the condition. Perhaps, this statement should have been compared with something else.
- V794. The copy operator should be protected from the case of this == &src.
- V795. Note that the size of the 'time_t' type is not 64 bits. After the year 2038, the program will work incorrectly.
- V796. A 'break' statement is probably missing in a 'switch' statement.
- V797. The function is used as if it returned a bool type. The return value of the function should probably be compared with std::string::npos.
- V798. The size of the dynamic array can be less than the number of elements in the initializer.
- V799. The variable is not used after memory has been allocated for it. Consider checking the use of this variable.
- V818. It is more efficient to use an initialization list rather than an assignment operator.
- V819. Decreased performance. Memory is allocated and released multiple times inside the loop body.
- V820. The variable is not used after copying. Copying can be replaced with move/swap for optimization.
PVS-Studio 6.15 (April 27, 2017)
- Visual Studio 2017 support improved.
- Fixed issue related to specific .pch files.
- V782. It is pointless to compute the distance between the elements of different arrays.
- V783. Dereferencing of invalid iterator 'X' might take place.
- V784. The size of the bit mask is less than the size of the first operand. This will cause the loss of the higher bits.
- V785. Constant expression in switch statement.
- V786. Assigning the value C to the X variable looks suspicious. The value range of the variable: [A, B].
- V787. A wrong variable is probably used as an index in the for statement.
PVS-Studio 6.14 (March 17, 2017)
- Visual Studio 2017 support added.
- Support of Roslyn 2.0 / C# 7.0 in C# PVS-Studio Analyzer.
- Line highlighting added when viewing the analyzer messages in Visual Studio plugins and Standalone version.
- The issue of checking C++ projects fixed. It could appear during the start of the analysis on the system without an installed Visual Studio 2015 /MSBuild 14.
- V780. The object of non-passive (non-PDS) type cannot be used with the function.
- V781. The value of the variable is checked after it was used. Perhaps there is a mistake in program logic. Check lines: N1, N2.
- V3131. The expression is checked for compatibility with type 'A' but is cast to type 'B'.
- V3132. A terminal null is present inside a string. '\0xNN' character sequence was encountered. Probably meant: '\xNN'.
- V3133. Postfix increment/decrement is meaningless because this variable is overwritten.
- V3134. Shift by N bits is greater than the size of type.
PVS-Studio 6.13 (January 27, 2017)
- Incremental analysis mode is added to the cmd version of the analyzer (PVS-Studio_Cmd.exe). More details can be found in the documentation.
- V779. Unreachable code detected. It is possible that an error is present.
- V3128. The field (property) is used before it is initialized in constructor.
- V3129. The value of the captured variable will be overwritten on the next iteration of the loop in each instance of anonymous function that captures it.
- V3130. Priority of the '&&' operator is higher than that of the '||' operator. Possible missing parentheses.
PVS-Studio 6.12 (December 22, 2016)
- V773. The function was exited without releasing the pointer. A memory leak is possible.
- V774. The pointer was used after the memory was released.
- V775. It is odd that the BSTR data type is compared using a relational operator.
- V776. Potentially infinite loop. The variable in the loop exit condition does not change its value between iterations.
- V777. Dangerous widening type conversion from an array of derived-class objects to a base-class pointer.
- V778. Two similar code fragments were found. Perhaps, this is a typo and 'X' variable should be used instead of 'Y'.
- V3123. Perhaps the '??' operator works differently from what was expected. Its priority is lower than that of other operators in its left part.
- V3124. Appending an element and checking for key uniqueness is performed on two different variables.
- V3125. The object was used after it was verified against null. Check lines: N1, N2.
- V3126. Type implementing IEquatable<T> interface does not override 'GetHashCode' method.
PVS-Studio 6.11 (November 29, 2016)
- V771. The '?:' operator uses constants from different enums.
- V772. Calling the 'delete' operator for a void pointer will cause undefined behavior.
- V817. It is more efficient to search for 'X' character rather than a string.
- V3119. Calling a virtual (overridden) event may lead to unpredictable behavior. Consider implementing event accessors explicitly or use 'sealed' keyword.
- V3120. Potentially infinite loop. The variable in the loop exit condition does not change its value between iterations.
- V3121. An enumeration was declared with 'Flags' attribute, but no initializers were set to override default values.
- V3122. Uppercase (lowercase) string is compared with a different lowercase (uppercase) string.
- Support for analyzing Visual C++ projects (.vcxproj) with Intel C++ toolsets was implemented in Visual Studio plugin.
PVS-Studio 6.10 (October 25, 2016)
- We are releasing PVS-Studio for Linux! Now it is possible to check C and C+ source code with PVS-Studio not only under Windows, but under Linux as well. The analyzer is available as packages for the mainstream package management systems, and is easily integratable with most common build systems. The detailed documentation on using PVS-Studio Linux version is available here.
- PVS-Studio for Windows is updated with a new user interface! The update affects Vidual Studio plugin and Standalone PVS-Studio tool.
- PVS-Studio now includes the new BlameNotifier tool. It allows to easily organize e-mail notifications with PVS-Studio analyzer messages of developers responsible for the source code that triggers these messages. Supported VCSs are Git, Svn and Mercurial. A detailed guide on managing the analysis results is available here.
- The support for analyzing MSBuild projects, which are using the Intel C++ compiler, was implemented in the PVS-Studio command line version. The support for Visual Studio is coming in the near future.
- V769. The pointer in the expression equals nullptr. The resulting value is meaningless and should not be used.
- V770. Possible usage of a left shift operator instead of a comparison operator.
PVS-Studio 6.09 (October 6, 2016)
- If all the diagnostic groups of the analyzer (C++ or C#) are disabled, the analysis of projects of the corresponding language won't start.
- We have added proxy support with the authorization during the update check and the trial extension.
- The ability to completely disable C/C++ or C# analyzer in .pvsconfig files (//-V::C++ and //-V::C#) is now supported.
- In the SonarQube plugin implemented functionality for calculating the LOC metric and determining the reliability remediation effort.
- V768. The '!' operator is applied to an enumerator.
- V3113. Consider inspecting the loop expression. It is possible that different variables are used inside initializer and iterator.
- V3114. IDisposable object is not disposed before method returns.
- V3115. It is not recommended to throw exceptions from 'Equals(object obj)' method.
- V3116. Consider inspecting the 'for' operator. It's possible that the loop will be executed incorrectly or won't be executed at all.
- V3117. Constructor parameter is not used.
- V3118. A component of TimeSpan is used, which does not represent full time interval. Possibly 'Total*' value was intended instead.
PVS-Studio 6.08 (August 22, 2016)
- Visual Studio plugin no longer supports analysis from command line with '/command' switch. Please use PVS-Studio_Cmd.exe command line tool instead. The detailed description of the tool is available here.
- V3108. It is not recommended to return null or throw exceptions from 'ToSting()' method.
- V3109. The same sub-expression is present on both sides of the operator. The expression is incorrect or it can be simplified.
- V3110. Possible infinite recursion.
- V3111. Checking value for null will always return false when generic type is instantiated with a value type.
- V3112. An abnormality within similar comparisons. It is possible that a typo is present inside the expression.
PVS-Studio 6.07 (August 8, 2016)
- We are heading towards Linux support! Please read How to run PVS-Studio on Linux.
- PVS-Studio no longer supports 32-bit operating systems. PVS-Studio analyzer (both C++ and C# modules) requires quite a large amount of RAM for its operation, especially when using multiple processor cores during the analysis. The maximum amount of RAM available on a 32-bit system allows correctly running the analyzer on a single core only (i.e. one process at a time). Moreover, in case of a very large project being analyzed, even this amount of RAM could be insufficient. Because of this, and also because a very small fraction of our users still utilizes 32-bit OS, we've decided to cease support for the 32-bit version of the analyzer. This will allows us to concentrate all of our resources on further development of 64-bit version of the analyzer.
- Support for SonarQube continuous quality control system was implemented in the analyzer's command line version. In addition, our installer now contains a dedicated SonarQube plugin, which can be used for integration of analysis results with SonarQube server. The detailed description of this plugin and new analyzer modes is available here.
- V763. Parameter is always rewritten in function body before being used.
- V764. Possible incorrect order of arguments passed to function.
- V765. A compound assignment expression 'X += X + N' is suspicious. Consider inspecting it for a possible error.
- V766. An item with the same key has already been added.
- V767. Suspicious access to element by a constant index inside a loop.
- V3106. Possibly index is out of bound.
- V3107. Identical expressions to the left and to the right of compound assignment.
PVS-Studio 6.06 (July 7, 2016)
- V758. Reference invalidated, because of the destruction of the temporary object 'unique_ptr', returned by function.
- V759. Violated order of exception handlers. Exception caught by handler for base class.
- V760. Two identical text blocks detected. The second block starts with NN string.
- V761. NN identical blocks were found.
- V762. Consider inspecting virtual function arguments. See NN argument of function 'Foo' in derived class and base class.
- V3105. The 'a' variable was used after it was assigned through null-conditional operator. NullReferenceException is possible.
PVS-Studio 6.05 (June 9, 2016)
- New PVS-Studio command line tool was added; it supports the check of vcxproj and csproj projects (C++ and C#). Now there is no need to use devenv.exe for nightly checks. More details about this tool can be found here.
- The support of MSBuild plugin was stopped. Instead of it we suggest using a new PVS-Studio command line tool.
- V755. Copying from unsafe data source. Buffer overflow is possible.
- V756. The 'X' counter is not used inside a nested loop. Consider inspecting usage of 'Y' counter.
- V757. It is possible that an incorrect variable is compared with null after type conversion using 'dynamic_cast'.
- V3094. Possible exception when deserializing type. The Ctor(SerializationInfo, StreamingContext) constructor is missing.
- V3095. The object was used before it was verified against null. Check lines: N1, N2.
- V3096. Possible exception when serializing type. [Serializable] attribute is missing.
- V3097. Possible exception: type marked by [Serializable] contains non-serializable members not marked by [NonSerialized].
- V3098. The 'continue' operator will terminate 'do { ... } while (false)' loop because the condition is always false.
- V3099. Not all the members of type are serialized inside 'GetObjectData' method.
- V3100. Unhandled NullReferenceException is possible. Unhandled exceptions in destructor lead to termination of runtime.
- V3101. Potential resurrection of 'this' object instance from destructor. Without re-registering for finalization, destructor will not be called a second time on resurrected object.
- V3102. Suspicious access to element by a constant index inside a loop.
- V3103. A private Ctor(SerializationInfo, StreamingContext) constructor in unsealed type will not be accessible when deserializing derived types.
- V3104. 'GetObjectData' implementation in unsealed type is not virtual, incorrect serialization of derived type is possible.
PVS-Studio 6.04 (May 16, 2016)
- V753. The '&=' operation always sets a value of 'Foo' variable to zero.
- V754. The expression of 'foo(foo(x))' pattern is excessive or contains an error.
- V3082. The 'Thread' object is created but is not started. It is possible that a call to 'Start' method is missing.
- V3083. Unsafe invocation of event, NullReferenceException is possible. Consider assigning event to a local variable before invoking it.
- V3084. Anonymous function is used to unsubscribe from event. No handlers will be unsubscribed, as a separate delegate instance is created for each anonymous function declaration.
- V3085. The name of 'X' field/property in a nested type is ambiguous. The outer type contains static field/property with identical name.
- V3086. Variables are initialized through the call to the same function. It's probably an error or un-optimized code.
- V3087. Type of variable enumerated in 'foreach' is not guaranteed to be castable to the type of collection's elements.
- V3088. The expression was enclosed by parentheses twice: ((expression)). One pair of parentheses is unnecessary or misprint is present.
- V3089. Initializer of a field marked by [ThreadStatic] attribute will be called once on the first accessing thread. The field will have default value on different threads.
- V3090. Unsafe locking on an object.
- V3091. Empirical analysis. It is possible that a typo is present inside the string literal. The 'foo' word is suspicious.
- V3092. Range intersections are possible within conditional expressions.
- V3093. The operator evaluates both operands. Perhaps a short-circuit operator should be used instead.
PVS-Studio 6.03 (April 5, 2016)
- V751. Parameter is not used inside method's body.
- V752. Creating an object with placement new requires a buffer of large size.
- V3072. The 'A' class containing IDisposable members does not itself implement IDisposable.
- V3073. Not all IDisposable members are properly disposed. Call 'Dispose' when disposing 'A' class.
- V3074. The 'A' class contains 'Dispose' method. Consider making it implement 'IDisposable' interface.
- V3075. The operation is executed 2 or more times in succession.
- V3076. Comparison with 'double.NaN' is meaningless. Use 'double.IsNaN()' method instead.
- V3077. Property setter / event accessor does not utilize its 'value' parameter.
- V3078. Original sorting order will be lost after repetitive call to 'OrderBy' method. Use 'ThenBy' method to preserve the original sorting.
- V3079. 'ThreadStatic' attribute is applied to a non-static 'A' field and will be ignored.
- V3080. Possible null dereference.
- V3081. The 'X' counter is not used inside a nested loop. Consider inspecting usage of 'Y' counter.
- V051. Some of the references in project are missing or incorrect. The analysis results could be incomplete. Consider making the project fully compilable and building it before analysis.
PVS-Studio 6.02 (March 9, 2016)
- V3057. Function receives an odd argument.
- V3058. An item with the same key has already been added.
- V3059. Consider adding '[Flags]' attribute to the enum.
- V3060. A value of variable is not modified. Consider inspecting the expression. It is possible that other value should be present instead of '0'.
- V3061. Parameter 'A' is always rewritten in method body before being used.
- V3062. An object is used as an argument to its own method. Consider checking the first actual argument of the 'Foo' method.
- V3063. A part of conditional expression is always true/false.
- V3064. Division or mod division by zero.
- V3065. Parameter is not utilized inside method's body.
- V3066. Possible incorrect order of arguments passed to 'Foo' method.
- V3067. It is possible that 'else' block was forgotten or commented out, thus altering the program's operation logics.
- V3068. Calling overrideable class member from constructor is dangerous.
- V3069. It's possible that the line was commented out improperly, thus altering the program's operation logics.
- V3070. Uninitialized variables are used when initializing the 'A' variable.
- V3071. The object is returned from inside 'using' block. 'Dispose' will be invoked before exiting method.
PVS-Studio 6.01 (February 3, 2016)
- V736. The behavior is undefined for arithmetic or comparisons with pointers that do not point to members of the same array.
- V737. It is possible that ',' comma is missing at the end of the string.
- V738. Temporary anonymous object is used.
- V739. EOF should not be compared with a value of the 'char' type. Consider using the 'int' type.
- V740. Because NULL is defined as 0, the exception is of the 'int' type. Keyword 'nullptr' could be used for 'pointer' type exception.
- V741. The following pattern is used: throw (a, b);. It is possible that type name was omitted: throw MyException(a, b);..
- V742. Function receives an address of a 'char' type variable instead of pointer to a buffer.
- V743. The memory areas must not overlap. Use 'memmove' function.
- V744. Temporary object is immediately destroyed after being created. Consider naming the object.
- V745. A 'wchar_t *' type string is incorrectly converted to 'BSTR' type string.
- V746. Object slicing. An exception should be caught by reference rather than by value.
- V747. An odd expression inside parenthesis. It is possible that a function name is missing.
- V748. Memory for 'getline' function should be allocated only by 'malloc' or 'realloc' functions. Consider inspecting the first parameter of 'getline' function.
- V749. Destructor of the object will be invoked a second time after leaving the object's scope.
- V750. BSTR string becomes invalid. Notice that BSTR strings store their length before start of the text.
- V816. It is more efficient to catch exception by reference rather than by value.
- V3042. Possible NullReferenceException. The '?.' and '.' operators are used for accessing members of the same object.
- V3043. The code's operational logic does not correspond with its formatting.
- V3044. WPF: writing and reading are performed on a different Dependency Properties.
- V3045. WPF: the names of the property registered for DependencyProperty, and of the property used to access it, do not correspond with each other.
- V3046. WPF: the type registered for DependencyProperty does not correspond with the type of the property used to access it.
- V3047. WPF: A class containing registered property does not correspond with a type that is passed as the ownerType.type.
- V3048. WPF: several Dependency Properties are registered with a same name within the owner type.
- V3049. WPF: readonly field of 'DependencyProperty' type is not initialized.
- V3050. Possibly an incorrect HTML. The </XX> closing tag was encountered, while the </YY> tag was expected.
- V3051. An excessive type cast or check. The object is already of the same type.
- V3052. The original exception object was swallowed. Stack of original exception could be lost.
- V3053. An excessive expression. Examine the substrings "abc" and "abcd".
- V3054. Potentially unsafe double-checked locking. Use volatile variable(s) or synchronization primitives to avoid this.
- V3055. Suspicious assignment inside the condition expression of 'if/while/for' operator.
- V3056. Consider reviewing the correctness of 'X' item's usage.
PVS-Studio 6.00 (December 22, 2015)
- Static code analysis for C# added! More than 40 diagnostics in first release.
- We are cancelling support for Visual Studio 2005 and Visual Studio 2008.
- V734. Searching for the longer substring is meaningless after searching for the shorter substring.
- V735. Possibly an incorrect HTML. The "</XX" closing tag was encountered, while the "</YY" tag was expected.
- V3001. There are identical sub-expressions to the left and to the right of the 'foo' operator.
- V3002. The switch statement does not cover all values of the enum.
- V3003. The use of 'if (A) {...} else if (A) {...}' pattern was detected. There is a probability of logical error presence.
- V3004. The 'then' statement is equivalent to the 'else' statement.
- V3005. The 'x' variable is assigned to itself.
- V3006. The object was created but it is not being used. The 'throw' keyword could be missing.
- V3007. Odd semicolon ';' after 'if/for/while' operator.
- V3008. The 'x' variable is assigned values twice successively. Perhaps this is a mistake.
- V3009. It's odd that this method always returns one and the same value of NN.
- V3010. The return value of function 'Foo' is required to be utilized.
- V3011. Two opposite conditions were encountered. The second condition is always false.
- V3012. The '?:' operator, regardless of its conditional expression, always returns one and the same value.
- V3013. It is odd that the body of 'Foo_1' function is fully equivalent to the body of 'Foo_2' function.
- V3014. It is likely that a wrong variable is being incremented inside the 'for' operator. Consider reviewing 'X'.
- V3015. It is likely that a wrong variable is being compared inside the 'for' operator. Consider reviewing 'X'.
- V3016. The variable 'X' is being used for this loop and for the outer loop.
- V3017. A pattern was detected: A || (A && ...). The expression is excessive or contains a logical error.
- V3018. Consider inspecting the application's logic. It's possible that 'else' keyword is missing.
- V3019. It is possible that an incorrect variable is compared with null after type conversion using 'as' keyword.
- V3020. An unconditional 'break/continue/return/goto' within a loop.
- V3021. There are two 'if' statements with identical conditional expressions. The first 'if' statement contains method return. This means that the second 'if' statement is senseless.
- V3022. Expression is always true/false.
- V3023. Consider inspecting this expression. The expression is excessive or contains a misprint.
- V3024. An odd precise comparison. Consider using a comparison with defined precision: Math.Abs(A - B) < Epsilon or Math.Abs(A - B) > Epsilon.
- V3025. Incorrect format. Consider checking the N format items of the 'Foo' function.
- V3026. The constant NN is being utilized. The resulting value could be inaccurate. Consider using the KK constant.
- V3027. The variable was utilized in the logical expression before it was verified against null in the same logical expression.
- V3028. Consider inspecting the 'for' operator. Initial and final values of the iterator are the same.
- V3029. The conditional expressions of the 'if' operators situated alongside each other are identical.
- V3030. Recurring check. This condition was already verified in previous line.
- V3031. An excessive check can be simplified. The operator '||' operator is surrounded by opposite expressions 'x' and '!x'.
- V3032. Waiting on this expression is unreliable, as compiler may optimize some of the variables. Use volatile variable(s) or synchronization primitives to avoid this.
- V3033. It is possible that this 'else' branch must apply to the previous 'if' statement.
- V3034. Consider inspecting the expression. Probably the '!=' should be used here.
- V3035. Consider inspecting the expression. Probably the '+=' should be used here.
- V3036. Consider inspecting the expression. Probably the '-=' should be used here.
- V3037. An odd sequence of assignments of this kind: A = B; B = A;.
- V3038. The 'first' argument of 'Foo' function is equal to the 'second' argument
- V3039. Consider inspecting the 'Foo' function call. Defining an absolute path to the file or directory is considered a poor style.
- V3040. The expression contains a suspicious mix of integer and real types.
- V3041. The expression was implicitly cast from integer type to real type. Consider utilizing an explicit type cast to avoid the loss of a fractional part.
PVS-Studio 5.31 (November 3, 2015)
- False positive quantity is reduced in some diagnostics.
PVS-Studio 5.30 (October 29, 2015)
- Double click navigation support on multiple-line messages was added.
- An access error during the Visual C++ preprocessor start for a check of files, using #import directive was removed.
- An error of compiler monitoring preprocessing more than 10 minutes, corrected.
- Incorrect installer's work, operating on systems that have 2015 Visual Studio only, was corrected.
- New diagnostic - V728. An excessive check can be simplified. The '||' operator is surrounded by opposite expressions 'x' and '!x'.
- New diagnostic - V729. Function body contains the 'X' label that is not used by any 'goto' statements.
- New diagnostic - V730. Not all members of a class are initialized inside the constructor.
- New diagnostic - V731. The variable of char type is compared with pointer to string.
- New diagnostic - V732. Unary minus operator does not modify a bool type value.
- New diagnostic - V733. It is possible that macro expansion resulted in incorrect evaluation order.
PVS-Studio 5.29 (September 22, 2015)
- Visual Studio 2015 supported.
- Windows 10 supported.
- New diagnostic - V727. Return value of 'wcslen' function is not multiplied by 'sizeof(wchar_t)'.
PVS-Studio 5.28 (August 10, 2015)
- New interface of the settings pages Detectable Errors, Don't Check Files, and Keyword Message Filering.
- A new utility PlogConverter was added to convert XML plog files into formats txt, html, and CSV. Check the documentation for details.
PVS-Studio 5.27 (July 28, 2015)
- New diagnostic - V207. A 32-bit variable is utilized as a reference to a pointer. A write outside the bounds of this variable may occur.
- New diagnostic - V726. An attempt to free memory containing the 'int A[10]' array by using the 'free(A)' function.
- New feature - Analyzer Work Statistics (Diagrams). PVS-Studio analyzer can gather its' operational statistics - the number of detected messages (including suppressed ones) across different severity levels and rule sets. Gathered statistics can be filtered and represented as a diagram in a Microsoft Excel file, showing the change dynamics for messages in the project under analysis.
- Analysis of preprocessed files removed from Standalone.
PVS-Studio 5.26 (June 30, 2015)
- New diagnostic - V723. Function returns a pointer to the internal string buffer of a local object, which will be destroyed.
- New diagnostic - V724. Converting integers or pointers to BOOL can lead to a loss of high-order bits. Non-zero value can become 'FALSE'.
- New diagnostic - V725. A dangerous cast of 'this' to 'void*' type in the 'Base' class, as it is followed by a subsequent cast to 'Class' type.
- Message suppression support was implemented for CLMonitoring/Standalone.
- 2nd and 3rd levels of analyzer warnings are accessible in Trial Mode.
PVS-Studio 5.25 (May 12, 2015)
- New diagnostic - V722. An abnormality within similar comparisons. It is possible that a typo is present inside the expression.
- Improved the responsiveness of Quick Filters and Analyzer\Levels buttons in Output Window.
- 'False Alarms' output window filter was moved into settings.
- Fix for 'An item with the same key has already been added' error when using message suppression
PVS-Studio 5.24 (April 10, 2015)
- New diagnostic - V721. The VARIANT_BOOL type is utilized incorrectly. The true value (VARIANT_TRUE) is defined as -1.
- New trial mode. Please refer here.
- A new message suppression mechanism now can be utilized together with command line mode for project files (vcproj/vcxproj) to organize a distribution of analysis logs with newly discovered warnings (in plain text and html formats) by email. More details on command line mode and utilizing analyzer within continuous integration systems.
PVS-Studio 5.23 (March 17, 2015)
- 64-bit analysis is greatly improved. Now if you want to fix major 64-bit issues just fix all 64 Level 1 messages.
- You can use PVS-Studio-Updater.exe for automatic update of PVS-Studio on build-server. See details here.
- New diagnostic - V719. The switch statement does not cover all values of the enum.
- New diagnostic - V720. It is advised to utilize the 'SuspendThread' function only when developing a debugger (see documentation for details).
- New diagnostic - V221. Suspicious sequence of types castings: pointer -> memsize -> 32-bit integer.
- New diagnostic - V2013. Consider inspecting the correctness of handling the N argument in the 'Foo' function.
PVS-Studio 5.22 (February 17, 2015)
- New diagnostic - V718. The 'Foo' function should not be called from 'DllMain' function.
- Fix for CLMonitoring operation on C++/CLI projects.
- Memory leak fix for CLMonitoring of long-running processes.
- Include\symbol reference search for Standalone.
- Message suppression memory usage optimization.
- Message suppression correctly handles multi-project analyzer messages (as, for example, messages generated on common h files on different IDE projects).
- Several crucial improvements in (Message suppression).
PVS-Studio 5.21 (December 11, 2014)
- We are cancelling support for the Embarcadero RAD Studio IDE.
- We are cancelling support for OpenMP diagnostics (VivaMP rule set)
- New diagnostic - V711. It is dangerous to create a local variable within a loop with a same name as a variable controlling this loop.
- New diagnostic - V712. Be advised that compiler may delete this cycle or make it infinity. Use volatile variable(s) or synchronization primitives to avoid this.
- New diagnostic - V713. The pointer was utilized in the logical expression before it was verified against nullptr in the same logical expression.
- New diagnostic - V714. Variable is not passed into foreach loop by a reference, but its value is changed inside of the loop.
- New diagnostic - V715. The 'while' operator has empty body. Suspicious pattern detected.
- New diagnostic - V716. Suspicious type conversion: HRESULT -> BOOL (BOOL -> HRESULT).
- New diagnostic - V717. It is strange to cast object of base class V to derived class U.
PVS-Studio 5.20 (November 12, 2014)
- New diagnostic - V706. Suspicious division: sizeof(X) / Value. Size of every element in X array does not equal to divisor.
- New diagnostic - V707. Giving short names to global variables is considered to be bad practice.
- New diagnostic - V708. Dangerous construction is used: 'm[x] = m.size()', where 'm' is of 'T' class. This may lead to undefined behavior.
- New diagnostic - V709. Suspicious comparison found: 'a == b == c'. Remember that 'a == b == c' is not equal to 'a == b && b == c.
- New diagnostic - V710. Suspicious declaration found. There is no point to declare constant reference to a number.
- New diagnostic - V2012. Possibility of decreased performance. It is advised to pass arguments to std::unary_function/std::binary_function template as references.
- New feature - Mass suppression of analyzer messages. Sometimes, during deployment of static analysis, especially at large-scale projects, the developer has no desire (or even has no means of) to correct hundreds or even thousands of analyzer's messages which were generated on the existing source code base. In this situation, the need arises to "suppress" all of the analyzer's messages generated on the current state of the code, and, from that point, to be able to see only the messages related to the newly written or modified code. As such code was not yet thoroughly debugged and tested, it can potentially contain a large number of errors.
PVS-Studio 5.19 (September 18, 2014)
- New diagnostic - V698. strcmp()-like functions can return not only the values -1, 0 and 1, but any values.
- New diagnostic - V699. Consider inspecting the 'foo = bar = baz ? .... : ....' expression. It is possible that 'foo = bar == baz ? .... : ....' should be used here instead.
- New diagnostic - V700. Consider inspecting the 'T foo = foo = x;' expression. It is odd that variable is initialized through itself.
- New diagnostic - V701. realloc() possible leak: when realloc() fails in allocating memory, original pointer is lost. Consider assigning realloc() to a temporary pointer.
- New diagnostic - V702. Classes should always be derived from std::exception (and alike) as 'public'.
- New diagnostic - V703. It is odd that the 'foo' field in derived class overwrites field in base class.
- New diagnostic - V704. 'this == 0' comparison should be avoided - this comparison is always false on newer compilers.
- New diagnostic - V705. It is possible that 'else' block was forgotten or commented out, thus altering the program's operation logics.
PVS-Studio 5.18 (July 30, 2014)
- ClMonitoring - automatic detection of compiler's platform.
- ClMonitoring - performance increase resulting from the reduction of an impact of antiviral software during preprocessing of analyzed files.
- ClMonitoring - incorrect handling of 64-bit processes resulting from a system update for .NET Framework 4 was fixed.
- New diagnostic - V695. Range intersections are possible within conditional expressions.
- New diagnostic - V696. The 'continue' operator will terminate 'do { ... } while (FALSE)' loop because the condition is always false.
- New diagnostic - V697. A number of elements in the allocated array is equal to size of a pointer in bytes.
- New diagnostic - V206. Explicit conversion from 'void *' to 'int *'.
- New diagnostic - V2011. Consider inspecting signed and unsigned function arguments. See NN argument of function 'Foo' in derived class and base class.
PVS-Studio 5.17 (May 20, 2014)
- New diagnostic - V690. The class implements a copy constructor/operator=, but lacks the the operator=/copy constructor.
- New diagnostic - V691. Empirical analysis. It is possible that a typo is present inside the string literal. The 'foo' word is suspicious.
- New diagnostic - V692. An inappropriate attempt to append a null character to a string. To determine the length of a string by 'strlen' function correctly, a string ending with a null terminator should be used in the first place.
- New diagnostic - V693. Consider inspecting conditional expression of the loop. It is possible that 'i < X.size()' should be used instead of 'X.size()'.
- New diagnostic - V694. The condition (ptr - const_value) is only false if the value of a pointer equals a magic constant.
- New diagnostic - V815. Decreased performance. Consider replacing the expression 'AA' with 'BB'.
- New diagnostic - V2010. Handling of two different exception types is identical.
PVS-Studio 5.16 (April 29, 2014)
- Support of C++/CLI projects was greatly improved.
- TFSRipper plugin was removed.
- Fix for crash in Standalone when installing in non-default location on a 64-bit system.
- Fixed issue with hiding of diagnostic messages in some case.
PVS-Studio 5.15 (April 14, 2014)
- New diagnostic - V689. The destructor of the 'Foo' class is not declared as a virtual. It is possible that a smart pointer will not destroy an object correctly.
- Several crucial improvements in compiler monitoring in PVS-Studio.
PVS-Studio 5.14 (March 12, 2014)
- New option "DIsable 64-bit Analysis" in Specific Analyzer Settings option page can improve analysis speed and decrease .plog file size.
- New feature: compiler monitoring in PVS-Studio.
- Fixed problem with incremental analysis notification with auto hide PVS-Studio Output Window.
- New diagnostic - V687. Size of an array calculated by the sizeof() operator was added to a pointer. It is possible that the number of elements should be calculated by sizeof(A)/sizeof(A[0]).
- New diagnostic - V688. The 'foo' local variable possesses the same name as one of the class members, which can result in a confusion.
PVS-Studio 5.13 (February 5, 2014)
- Support for Embarcadero RAD Studio XE5 was implemented.
- New diagnostic - V684. A value of variable is not modified. Consider inspecting the expression. It is possible that '1' should be present instead of '0'.
- New diagnostic - V685. Consider inspecting the return statement. The expression contains a comma.
- New diagnostic - V686. A pattern was detected: A || (A && ...). The expression is excessive or contains a logical error.
PVS-Studio 5.12 (December 23, 2013)
- Fix for the issue with SolutionDir property when direct integration of the analyzer into MSBuild system is utilized.
- The analysis can now be launched from within the context menu of Solution Explorer tool window.
- The 'ID' column will now be hidden by default in the PVS-Studio Output toolwindow. It is possible to enable it again by using the Show Columns -> ID context menu command.
- New diagnostic - V682. Suspicious literal is present: '/r'. It is possible that a backslash should be used here instead: '\r'.
- New diagnostic - V683. Consider inspecting the loop expression. It is possible that the 'i' variable should be incremented instead of the 'n' variable.
PVS-Studio 5.11 (November 6, 2013)
- Support for the release version of Microsoft Visual Studio 2013 was implemented.
- New diagnostic - V680. The 'delete A, B' expression only destroys the 'A' object. Then the ',' operator returns a resulting value from the right side of the expression.
- New diagnostic - V681. The language standard does not define an order in which the 'Foo' functions will be called during evaluation of arguments.
PVS-Studio 5.10 (October 7, 2013)
- Fixed the issue with the analyzer when Visual Studio is called with the parameter /useenv: devenv.exe /useenv.
- VS2012 has finally got support for Clang so that it can be used as the preprocessor. It means that PVS-Studio users will see a significant performance boost in VS2012.
- Several crucial improvements were made to the analyzer's performance when parsing code in VS2012.
- The PVS-Studio distribution package now ships with a new application Standalone.
- You can now export analysis results into a .CSV-file to handle them in Excel.
- Support of precompiled headers in Visual Studio and MSBuild was greatly improved.
- New diagnostic - V676. It is incorrect to compare the variable of BOOL type with TRUE.
- New diagnostic - V677. Custom declaration of a standard type. The declaration from system header files should be used instead.
- New diagnostic - V678. An object is used as an argument to its own method. Consider checking the first actual argument of the 'Foo' function.
- New diagnostic - V679. The 'X' variable was not initialized. This variable is passed by a reference to the 'Foo' function in which its value will be utilized.
PVS-Studio 5.06 (August 13, 2013)
- Fix for incorrect number of verified files when using 'Check Open File(s)' command in Visual Studio 2010.
- New diagnostic - V673. More than N bits are required to store the value, but the expression evaluates to the T type which can only hold K bits.
- New diagnostic - V674. The expression contains a suspicious mix of integer and real types.
- New diagnostic - V675. Writing into the read-only memory.
- New diagnostic - V814. Decreased performance. The 'strlen' function was called multiple times inside the body of a loop.
PVS-Studio 5.05 (May 28, 2013)
- Support for proxy server with authorization was implemented for trial extension window.
- An issue with using certain special characters in diagnostic message filters was resolved.
- A portion of 'Common Analyzer Settings' page options and all of the options from 'Customer Specific Settings' page were merged together into the new page: Specific Analyzer Settings.
- A new SaveModifiedLog option was implemented. It allows you to define the behavior of 'Save As' dialog for a new\modified analysis report log (always ask, save automatically, do not save).
- Customer diagnostics (V20xx) were assigned to a separate diagnostics group (CS - Customer Specific).
- A new menu command was added: "Check Open File(s)". It allows starting the analysis on all of the C/C++ source files that are currently open in IDE text editor.
PVS-Studio 5.04 (May 14, 2013)
- Support has been implemented for C++Builder XE4. Now PVS-Studio supports the following versions of C++Builder: XE4, XE3 Update 1, XE2, XE, 2010, 2009.
- New diagnostic - V669. The argument is a non-constant reference. The analyzer is unable to determine the position at which this argument is being modified. It is possible that the function contains an error.
- New diagnostic - V670. An uninitialized class member is used to initialize another member. Remember that members are initialized in the order of their declarations inside a class.
- New diagnostic - V671. It is possible that the 'swap' function interchanges a variable with itself.
- New diagnostic - V672. There is probably no need in creating a new variable here. One of the function's arguments possesses the same name and this argument is a reference.
- New diagnostic - V128. A variable of the memsize type is read from a stream. Consider verifying the compatibility of 32 and 64 bit versions of the application in the context of a stored data.
- New diagnostic - V813. Decreased performance. The argument should probably be rendered as a constant pointer/reference.
- New diagnostic - V2009. Consider passing the 'Foo' argument as a constant pointer/reference.
PVS-Studio 5.03 (April 16, 2013)
- Enhanced analysis/interface performance when checking large projects and generating a large number of diagnostic messages (the total number of unfiltered messages).
- Fixed the issue with incorrect integration of the PVS-Studio plugin into the C++Builder 2009/2010/XE environments after installation.
- Fixed the bug with the trial-mode.
- The analyzer can now be set to generate relative paths to source files in its log files.
- The analyzer now supports direct integration into the MSBuild build system.
- Integrated Help Language option added to Customer's Settings page. The setting allows you to select a language to be used for integrated help on the diagnostic messages (a click to the message error code in PVS-Studio output window) and online documentation (the PVS-Studio -> Help -> Open PVS-Studio Documentation (html, online) menu command), which are also available at our site. This setting will not change the language of IDE plugin's interface and messages produced by the analyzer.
- Fix for Command line analysis mode in Visual Studio 2012 in the case of project background loading.
- New diagnostic - V665. Possibly, the usage of '#pragma warning(default: X)' is incorrect in this context. The '#pragma warning(push/pop)' should be used instead.
- New diagnostic - V666. Consider inspecting NN argument of the function 'Foo'. It is possible that the value does not correspond with the length of a string which was passed with the YY argument.
- New diagnostic - V667. The 'throw' operator does not possess any arguments and is not situated within the 'catch' block.
- New diagnostic - V668. There is no sense in testing the pointer against null, as the memory was allocated using the 'new' operator. The exception will be generated in the case of memory allocation error.
- New diagnostic -V812. Decreased performance. Ineffective use of the 'count' function. It can possibly be replaced by the call to the 'find' function.
PVS-Studio 5.02 (March 6, 2013)
- Incorrect navigation in C++Builder modules that contain several header/source files was fixed.
- The option for inserting user-specified comments while performing false alarm mark-ups (for example, to provide the automatic documentation generation systems with appropriate descriptions) was implemented.
- An issue of incorrectly starting up a C++ preprocessor for some of the files utilizing precompiled headers was fixed.
- New diagnostic - V663. Infinite loop is possible. The 'cin.eof()' condition is insufficient to break from the loop. Consider adding the 'cin.fail()' function call to the conditional expression.
- New diagnostic - V664. The pointer is being dereferenced on the initialization list before it is verified against null inside the body of the constructor function.
- New diagnostic - V811. Decreased performance. Excessive type casting: string -> char * -> string.
PVS-Studio 5.01 (February 13, 2013)
- Support has been implemented for several previous versions of C++Builder. Now PVS-Studio supports the following versions of C++Builder: XE3 Update 1, XE2, XE, 2010, 2009.
- A bug in C++Builder version with incremental analysis starting-up incorrectly in several situations was fixed.
- Occasional incorrect placement of false alarm markings for C++Builder version was fixed.
- Incorrect display of localized filenames containing regional-specific characters in C++Builder version was fixed.
- An issue with opening source files during diagnostic message navigation in C++Builder version was resolved.
- The issue was fixed of system includes paths being resolved incompletely when starting the preprocessor for the analyzer in C++ Builder versions.
- New diagnostic - V661. A suspicious expression 'A[B < C]'. Probably meant 'A[B] < C'.
- New diagnostic - V662. Consider inspecting the loop expression. Different containers are utilized for setting up initial and final values of the iterator.
PVS-Studio 5.00 (January 31, 2013)
- Support for the integration to Embarcadero RAD Studio, or Embarcadero C++ Builder to be more precise, was added! As of this moment, PVS-Studio diagnostics capabilities are available to the users of C++ Builder. While in the past PVS-Studio could be conveniently utilized only from within Visual Studio environment, but now C++ developers who choses Embarcadero products will be able to fully utilize PVS-Studio static analyzer as well. Presently, the supported versions are XE2 and XE3, including the XE3 Update 1 with 64-bit C++ compiler.
- Microsoft Design Language (formerly known as Metro Language) C++/CX Windows 8 Store (WinRT) projects on x86/ARM platforms and Windows Phone 8 projects support was implemented.
- A fix for the users of Clang-preprocessor in Visual Studio version was implemented. Previously it was impossible to use Clang as a preprocessor while analyzing projects utilizing the Boost library because of the preprocessing errors. Now these issues were resolved. This significantly decreased the time it takes to analyze Boost projects with the help of Clang preprocessor.
- The obsolete Viva64 options page was removed.
- V004 message text was modified to provide a more correct description.
- New diagnostic - V810. Decreased performance. The 'A' function was called several times with identical arguments. The result should possibly be saved to a temporary variable, which then could be used while calling the 'B' function.
- New diagnostic - V2008. Cyclomatic complexity: NN. Consider refactoring the 'Foo' function.
- New diagnostic - V657. It's odd that this function always returns one and the same value of NN.
- New diagnostic - V658. A value is being subtracted from the unsigned variable. This can result in an overflow. In such a case, the comparison operation can potentially behave unexpectedly.
- New diagnostic - V659. Declarations of functions with 'Foo' name differ in the 'const' keyword only, but the bodies of these functions have different composition. This is suspicious and can possibly be an error.
- New diagnostic - V660. The program contains an unused label and a function call: 'CC:AA()'. It's possible that the following was intended: 'CC::AA()'.
PVS-Studio 4.77 (December 11, 2012)
- Acquisition of compilation parameters for VS2012 and VS2010 was improved through expansion of support for MSBuild-based projects.
- New diagnostic - V654. The condition of loop is always true/false.
- New diagnostic - V655. The strings was concatenated but are not utilized. Consider inspecting the expression.
- New diagnostic - V656. Variables are initialized through the call to the same function. It's probably an error or un-optimized code.
- New diagnostic - V809. Verifying that a pointer value is not NULL is not required. The 'if (ptr != NULL)' check can be removed.
PVS-Studio 4.76 (November 23, 2012)
- Some bugs were fixed.
PVS-Studio 4.75 (November 12, 2012)
- An issue with checking Qt-based projects which manifested itself under certain conditions was solved (details in blog).
- New diagnostic - V646. Consider inspecting the application's logic. It's possible that 'else' keyword is missing.
- New diagnostic - V647. The value of 'A' type is assigned to the pointer of 'B' type.
- New diagnostic - V648. Priority of the '&&' operation is higher than that of the '||' operation.
- New diagnostic - V649. There are two 'if' statements with identical conditional expressions. The first 'if' statement contains function return. This means that the second 'if' statement is senseless.
- New diagnostic - V650. Type casting operation is utilized 2 times in succession. Next, the '+' operation is executed. Probably meant: (T1)((T2)a + b).
- New diagnostic - V651. An odd operation of the 'sizeof(X)/sizeof(T)' kind is performed, where 'X' is of the 'class' type.
- New diagnostic - V652. The operation is executed 3 or more times in succession.
- New diagnostic - V653. A suspicious string consisting of two parts is used for array initialization. It is possible that a comma is missing.
- New diagnostic - V808. An array/object was declared but was not utilized.
- New diagnostic - V2007. This expression can be simplified. One of the operands in the operation equals NN. Probably it is a mistake.
PVS-Studio 4.74 (October 16, 2012)
- New option "Incremental Results Display Depth was added. This setting defines the mode of message display level in PVS-Studio Output window for the results of incremental analysis. Setting the display level depth here (correspondingly, Level 1 only; Levels 1 and 2; Levels 1, 2 and 3) will enable automatic activation of these display levels on each incremental analysis procedure. The "Preserve_Current_Levels" on the other hand will preserve the existing display setting.
- New option "External Tool Path" was added. This field allows defining an absolute path to any external tool, which could then be executed with the "Send this message to external tool" context menu command of the PVS-Studio Output window. The mentioned menu command is available only for a single simultaneously selected message from the results table, allowing the passing of the command line parameters specified in the ExternalToolCommandLine field to the utility from here. The detailed description of this mode together with usage examples is available here.
PVS-Studio 4.73 (September 17, 2012)
- Issues with incorrect processing of some Visual Studio 2012 C++11 constructs were fixed.
- A complete support for Visual Studio 2012 themes was implemented.
- The search field for the 'Project' column was added to the PVS-Studio Output Window quick filters.
- The included Clang external preprocessor was updated.
- Support for the TenAsys INtime platform was implemented.
PVS-Studio 4.72 (August 30, 2012)
- Support for the release version of Microsoft Visual Studio 2012 was implemented.
- A new version of SourceGrid component will be utilized, solving several issues with PVS-Studio Output Window operation.
- Support for diagnostics of issues inside STL library using STLport was implemented.
- New diagnostic - V637. Two opposite conditions were encountered. The second condition is always false.
- New diagnostic - V638. A terminal null is present inside a string. The '\0xNN' characters were encountered. Probably meant: '\xNN'.
- New diagnostic - V639. Consider inspecting the expression for function call. It is possible that one of the closing ')' brackets was positioned incorrectly.
- New diagnostic - V640. Consider inspecting the application's logic. It is possible that several statements should be braced.
- New diagnostic - V641. The size of the allocated memory buffer is not a multiple of the element size.
- New diagnostic - V642. Saving the function result inside the 'byte' type variable is inappropriate. The significant bits could be lost breaking the program's logic.
- New diagnostic - V643. Unusual pointer arithmetic. The value of the 'char' type is being added to the string pointer.
- New diagnostic - V644. A suspicious function declaration. It is possible that the T type object was meant to be created.
- New diagnostic - V645. The function call could lead to the buffer overflow. The bounds should not contain the size of the buffer, but a number of characters it can hold.
PVS-Studio 4.71 (July 20, 2012)
- New diagnostic - V629. Consider inspecting the expression. Bit shifting of the 32-bit value with a subsequent expansion to the 64-bit type.
- New diagnostic - V630. The 'malloc' function is used to allocate memory for an array of objects which are classes containing constructors/destructors.
- New diagnostic - V631. Consider inspecting the 'Foo' function call. Defining an absolute path to the file or directory is considered a poor style.
- New diagnostic - V632. Consider inspecting the NN argument of the 'Foo' function. It is odd that the argument is of the 'T' type.
- New diagnostic - V633. Consider inspecting the expression. Probably the '!=' should be used here.
- New diagnostic - V634. The priority of the '+' operation is higher than that of the '<<' operation. It's possible that parentheses should be used in the expression.
- New diagnostic - V635. Consider inspecting the expression. The length should probably be multiplied by the sizeof(wchar_t).
PVS-Studio 4.70 (July 3, 2012)
- Visual Studio 2012 RC support was implemented. At present the analyzer does not provide a complete support for every new syntax construct introduced with Visual Studio 2012 RC. Also, there is an additional issue concerning the speed of the analysis, as we utilize Clang preprocessor to improve the analyzer's performance. Currently, Clang is unable to preprocess some of the new Visual C++ 2012 header files, and that means that the notably slower cl.exe preprocessor from Visual C++ will have to be utilized most of the time instead. In the default mode the correct preprocessor will be set by PVS-Studio automatically so it will not require any interaction from the user. Despite the aforementioned issues, PVS-Studio can now be fully utilized from Visual Studio 2012 RC IDE.
- New diagnostic - V615. An odd explicit conversion from 'float *' type to 'double *' type.
- New diagnostic - V616. The 'Foo' named constant with the value of 0 is used in the bitwise operation.
- New diagnostic - V617. Consider inspecting the condition. An argument of the '|' bitwise operation always contains a non-zero value.
- New diagnostic - V618. It's dangerous to call the 'Foo' function in such a manner, as the line being passed could contain format specification. The example of the safe code: printf("%s", str);.
- New diagnostic - V619. An array is being utilized as a pointer to single object.
- New diagnostic - V620. It's unusual that the expression of sizeof(T)*N kind is being summed with the pointer to T type.
- New diagnostic - V621. Consider inspecting the 'for' operator. It's possible that the loop will be executed incorrectly or won't be executed at all.
- New diagnostic - V622. Consider inspecting the 'switch' statement. It's possible that the first 'case' operator in missing.
- New diagnostic - V623. Consider inspecting the '?:' operator. A temporary object is being created and subsequently destroyed.
- New diagnostic - V624. The constant NN is being utilized. The resulting value could be inaccurate. Consider using the M_NN constant from <math.h>.
- New diagnostic - V625. Consider inspecting the 'for' operator. Initial and final values of the iterator are the same.
- New diagnostic - V626. Consider checking for misprints. It's possible that ',' should be replaced by ';'.
- New diagnostic - V627. Consider inspecting the expression. The argument of sizeof() is the macro which expands to a number.
- New diagnostic - V628. It's possible that the line was commented out improperly, thus altering the program's operation logics.
- New diagnostic - V2006. Implicit type conversion from enum type to integer type.
PVS-Studio 4.62 (May 30, 2012)
- The support for the MinGW gcc preprocessor was implemented, enabling the verification of such projects as the ones which allow their compilation through MinGW compilers. Also, integration of the analyzer into build systems of such projects is similar to utilization of the analyzer with other projects lacking MSVC .sln files as it is described in detail in the corresponding documentation. As a reminder, the project which does include .sln file could be verified through command line in a regular way as well, not requiring the direct integration of the analyzer into the its' build system.
PVS-Studio 4.61 (May 22, 2012)
- Navigation for messages containing references to multiple lines was improved. Some of diagnostic messages (V595 for example) are related to several lines of source code at once. Previously, the 'Line' column of PVS-Studio Output Window contained only a single line number while other lines were only mentioned in the text of such message itself. This was inconvenient for the navigation. As of this version the fields of the 'Line' column could contain several line numbers allowing navigation for each individual line.
- A new build of Clang is included which contains several minor bug fixes. PVS-Studio uses Clang as an alternative preprocessor. Please note that PVS-Studio does not utilize Clang static analysis diagnostics.
- New diagnostic - V612. An unconditional 'break/continue/return/goto' within a loop.
- New diagnostic - V613. Strange pointer arithmetic with 'malloc/new'.
- New diagnostic - V614. Uninitialized variable 'Foo' used.
PVS-Studio 4.60 (April 18, 2012)
- A new "Optimization" (OP) group allows the diagnostics of potential optimizations. It is a static analysis rule set for identification of C/C++/C++11 source code sections which could be optimized. It should be noted that the analyzer solves the task of optimization for the narrow area of micro-optimizations. A full list of diagnostic cases is available in the documentation (codes V801-V807).
- A total number of false positive messages for the 64-bit analyzer (Viva64) was decreased substantially.
- Messages will not be produced for autogenerated files (MIDL).
- Logics behind prompting save dialog for analysis report were improved.
- Issue with Visual Studio Chinese localized version was fixed (the zh locale).
- New diagnostic V610. Undefined behavior. Check the shift operator.
- New diagnostic V611. The memory allocation and deallocation methods are incompatible.
PVS-Studio 4.56 (March 14, 2012)
- TraceMode option was added to Common Analyzer Settings. This setting could be used to specify the tracing mode (logging of a program's execution path).
- An issue concerning the verification of Itanium-based projects was fixed.
- An issue concerning the calling of the 64-bit version of clang.exe instead of the 32-bit one from within the 32-bit Windows while checking the project with selected x64 architecture was fixed.
- A number of cores to be used for incremental analysis were changed. As of now the regular analysis (Check Solution/project/file) will utilize the exact number of cores specified in the settings. The incremental analysis will use a different value: if the number of cores from the settings is greater than (number of system cores - 1) and there is more than one core in the system then the (number of system cores - 1) will be utilized for it; otherwise the value from the settings will be used. Simply put the incremental analysis will utilize one core less compared to the regular one for the purpose of easing the load on the system.
- New diagnostic V608. Recurring sequence of explicit type casts.
- New diagnostic V609. Divide or mod by zero.
PVS-Studio 4.55 (February 28, 2012)
- New trial extension window.
- A crash which occurs after reloading current project while code analysis is running was fixed.
- The installer (in case it is the first-time installation) now provides the option to enable PVS-Studio incremental analysis. In case PVS-Studio was installed on system before this option will not be displayed. Incremental analysis could be enabled or disabled through the "Incremental Analysis after Build" PVS-Studio menu command.
- As of now the default number of threads for analysis is equal to the number of processors minus one. This could be modified through the 'ThreadCount' option in PVS-Studio settings.
- New article in documentation: "PVS-Studio's incremental analysis mode".
- Additional functionality for the command line version mode — it is now possible to process several files at once, similar to the compiler batch mode (cl.exe file1.cpp file2.cpp). A more detailed description on command line mode is available in the documentation.
- A support for Microsoft Visual Studio ARMV4 project types was removed.
- New diagnostic V604. It is odd that the number of iterations in the loop equals to the size of the pointer.
- New diagnostic V605. Consider verifying the expression. An unsigned value is compared to the number - NN.
- New diagnostic V606. Ownerless token 'Foo'.
- New diagnostic V607. Ownerless expression 'Foo'.
PVS-Studio 4.54 (February 1, 2012)
- New trial mode was implemented. As of now only a total number of clicks on messages will be limited. More details can be found in our blog or documentation.
- New menu command "Disable Incremental Analysis until IDE restart" was added. Sometimes disabling the incremental analysis can be convenient, for instance when editing some core h-files, as it forces a large number of files to be recompiled. But it should not be disabled permanently, only temporary, as one can easily forget to turn it on again later. This command is also available in the system tray during incremental analysis.
- New diagnostic V602. Consider inspecting this expression. '<' possibly should be replaced with '<<'.
- New diagnostic V603. The object was created but it is not being used. If you wish to call constructor, 'this->Foo::Foo(....)' should be used.
- New diagnostic V807. Decreased performance. Consider creating a pointer/reference to avoid using the same expression repeatedly.
- New article in documentation: "PVS-Studio menu commands".
PVS-Studio 4.53 (January 19, 2012)
- New command for team work: "Add TODO comment for Task List". PVS-Studio allows you to automatically generate the special TODO comment containing all the information required to analyze the code fragment marked by it, and to insert it into the source code. Such comment will immediately appear inside the Visual Studio Task List window.
- New diagnostic V599. The virtual destructor is not present, although the 'Foo' class contains virtual functions.
- New diagnostic V600. Consider inspecting the condition. The 'Foo' pointer is always not equal to NULL.
- New diagnostic V601. An odd implicit type casting.
PVS-Studio 4.52 (December 28, 2011)
- Changes were introduced to the .sln-file independent analyzer command line mode. It is now possible to start the analysis in several processes simultaneously, the output file (‑‑output-file) will not be lost. The entire command line of arguments including the filename should be passed into the cl-params argument: ‑‑cl-params $(CFLAGS) $**.
- The "Analysis aborted by timeout" error was fixed, it could have been encountered while checking .sln file through PVS-Studio.exe command line mode.
- New diagnostic V597. The compiler could delete the 'memset' function call, which is used to flush 'Foo' buffer. The RtlSecureZeroMemory() function should be used to erase the private data.
- New diagnostic V598. The 'memset/memcpy' function is used to nullify/copy the fields of 'Foo' class. Virtual method table will be damaged by this.
PVS-Studio 4.51 (December 22, 2011)
- The issue concerning the #import directive when using Clang preprocessor was fixed. #import is supported by Clang differently from Microsoft Visual C++, therefore it is impossible to use Clang with such files. This directive is now automatically detected, and Visual C++ preprocessor is used for these files.
- 'Don't Check Files' settings used for file and directory exclusions were significantly revised. As of now the folders to be excluded (either by their full and relative paths or my a mask) could be specified independently, as well as the files to be excluded (by their name, extension or a mask as well).
- Some libraries were added to the default exclusion paths. This can be modified on the 'Don't Check Files' page.
PVS-Studio 4.50 (December 15, 2011)
- An external preprocessor is being utilized to preprocess files with PVS-Studio. It is only Microsoft Visual C++ preprocessor that had been employed for this task in the past. But in 4.50 version of PVS-Studio the support for the Clang preprocessor had been added, as its performance is significantly higher and it lacks some of the Microsoft's preprocessor shortcomings (although it also possesses issues of its own). Still, the utilization of Clang preprocessor provides an increase of operational performance by 1.5-1.7 times in most cases. However there is an aspect that should be considered. The preprocessor to be used can be specified from within the PVS-Studio Options -> Common Analyzer Settings -> Preprocessor field. The available options are: VisualCPP, Clang and VisualCPPAfterClang. The first two of these are self evident. The third one indicates that Clang will be used at first, and if preprocessing errors are encountered, the same file will be preprocessed by the Visual C++ preprocessor instead. This option is a default one (VisualCPPAfterClang).
- By default the analyzer will not produce diagnostic messages for libpng and zlib libraries (it is still possible to re-enable them).
- New diagnostic V596. The object was created but it is not being used. The 'throw' keyword could be missing.
PVS-Studio 4.39 (November 25, 2011)
- New diagnostics were implemented (V594, V595).
- By default the analyzer will not produce diagnostic messages for Boost library (it is still possible to re-enable them).
- Progress dialog will not be shown anymore during incremental analysis, an animated tray icon, which itself will allow pausing or aborting the analysis, will be used instead.
- New "Don't Check Files and hide all messages from ..." command was added to the output window context menu. This command allows you to filter the messages and afterwards prevent the verification of files from the specified directories. The list of filtered directories can be reviewed in "Don't Check Files" options page.
- The detection of Intel C++ Compiler integration have been revamped - PVS-Studio will not run on projects using this compiler, it is required to replace the compiler with Visual C++ one.
- "Quick Filters" functionality was implemented. It allows filtering all the messages which do not meet the specified filtering settings.
PVS-Studio 4.38 (October 12, 2011)
- Speed increase (up to 25% for quad core computers).
- "Navigate to ID" command added to the context menu of PVS-Studio window.
- New "Find in PVS-Studio Output" tool window allows searching of keywords in analysis results.
- New diagnostic rules added (V2005).
- Options button on PVS-Studio Output Window was renamed to Suppression and now contain only three tab pages.
PVS-Studio 4.37 (September 20, 2011)
- New diagnostic rules added (V008, V2003, V2004).
- Now you can export PVS-Studio analysis report to text file.
- We use extended build number in some case.
PVS-Studio 4.36 (August 31, 2011)
- New diagnostic rules added (V588, V589, V590, V591, V592, V593).
- Changes in PVS-Studio menu.
PVS-Studio 4.35 (August 12, 2011)
- New diagnostic rules added (V583, V584, V806, V585, V586, V587).
PVS-Studio 4.34 (July 29, 2011)
- Now 64-bit analysis disabled by default.
- Now Incremental Analysis enabled by default.
- Changes of behavior in trial mode.
- PVS_STUDIO predefined macro was added.
- Fixed problem with Incremental Analysis on localized versions of Visual Studio.
- Balloon notification and tray icon (after analysis finished) was added.
- New diagnostic rules added (V582).
- Changed image to display on the left side of the wizard in the Setup program.
PVS-Studio 4.33 (July 21, 2011)
- Incremental Analysis feature now available for all versions of Microsoft Visual Studio (2005/2008/2010).
- Speed increase (up to 20% for quad core computers).
- New diagnostic rules added (V127, V579, V580, V581).
PVS-Studio 4.32 (July 15, 2011)
- Changes in PVS-Studio's licensing policy.
- Dynamic balancing of CPU usage.
- Stop Analysis button work faster.
PVS-Studio 4.31 (July 6, 2011)
- Fixed problem related to interaction with other extensions (including Visual Assist).
- New diagnostic rules added (V577, V578, V805).
PVS-Studio 4.30 (June 23, 2011)
- The full-fledged support for analyzer's operation through command line was implemented. It is possible to verify independent files or sets of files launching the analyzer from Makefile. Also the analyzer's messages can be viewed not only on screen (for each file), but they also can be saved into single file, which later can be opened in Visual Studio and the regular processing of the analysis' results can be performed, complete with setting up error codes, message filters, code navigation, sorting etc. Details.
- New important mode of operation: Incremental Analysis. As of this moment PVS-Studio can automatically launch the analysis of modified files which are required to be rebuilt using 'Build' command in Visual Studio. All of developers in a team can now detect issues in newly written code without the inconvenience of manually launching the source code analysis - it happens automatically. Incremental Analysis operates similar to Visual Studio IntelliSence. The feature is available only in Visual Studio 2010. Details.
- "Check Selected Item(s)" command was added.
- Changes in starting "Check Solution" via command line. Details.
- New diagnostic rules added (V576).
PVS-Studio 4.21 (May 20, 2011)
- New diagnostic rules added (V220, V573, V574, V575).
- TFS 2005/2008/2010 integration was added.
PVS-Studio 4.20 (April 29, 2011)
- New diagnostic rules added (V571, V572).
- Experimental support for ARMV4/ARMV4I platforms for Visual Studio 2005/2008 (Windows Mobile 5/6, PocketPC 2003, Smartphone 2003).
- New "Show License Expired Message" option.
PVS-Studio 4.17 (April 15, 2011)
- New diagnostic rules added (V007, V570, V804)
- Incorrect display of analysis time in some locales has been fixed.
- New "Analysis Timeout" option. This setting allows you to set the time limit, by reaching which the analysis of individual files will be aborted with V006 error, or to completely disable analysis termination by timeout.
- New "Save File After False Alarm Mark" option. It allows to save or not to save a file each time after marking it as False Alarm.
- New "Use Solution Folder As Initial" option. It defines the folder which is opened while saving the analysis results file.
PVS-Studio 4.16 (April 1, 2011)
- It is possible now to define a list of files to be analyzed while launching the tool from command line. This can be used, for example, to check only the files which were updated by a revision control system. Details.
- "Check only Files Modified In" option has been added into tool's settings. This option allows you to define the time interval in which the presence of modifications in analyzed files will be controlled using "Date Modified" file attribute. In other words, this approach would allow for verification of "all files modified today". Details.
PVS-Studio 4.15 (March 17, 2011)
- There are much fewer false alarms in 64-bit analysis.
- Changes in the interface of safe-type definition.
- The error of processing stdafx.h in some special cases is fixed.
- Handling of the report file was improved.
- The progress dialogue was improved: you can see the elapsed time and the remaining time.
PVS-Studio 4.14 (March 2, 2011)
- There are much fewer false alarms in 64-bit analysis.
- New diagnostic rules were added (V566, V567, V568, V569, V803).
- A new column "Asterisk" was added in the PVS-Studio message window - you may use it to mark interesting diagnoses with the asterisk to discuss them with your colleagues later. The marks are saved in the log file.
- Now you may access PVS-Studio options not only from the menu (in the usual settings dialogue) but in the PVS-Studio window as well. This makes the process of setting the tool quicker and more convenient.
- Now you may save and restore PVS-Studio settings. It enables you to transfer the settings between different computers and workplaces. We also added the "Default settings" command.
- The state of PVS-Studio window's buttons (enabled/disabled) is saved when you launch Microsoft Visual Studio for the next time.
PVS-Studio 4.13 (February 11, 2011)
- New diagnostic rules are added V563, V564, and V565).
- The "Check for updates" command is added into the PVS-Studio menu.
- The "Hide all VXXX errors" command is added into context menu in PVS-Studio window. If you wish to enable the display of VXXX error messages again you can do it through PVS-Studio->Options->Detectable errors page.
- Suppressing false positives located within macro statements (#define) is added.
PVS-Studio 4.12 (February 7, 2011)
- New diagnostic rules are added (V006, V204, V205, V559, V560, V561, and V562).
- Changes in V201 and V202 diagnostic rules.
PVS-Studio 4.11 (January 28, 2011)
- V401 rule changed to V802.
- Fixed bug with copying messages to clipboard.
PVS-Studio 4.10 (January 17, 2011)
- New diagnostic rules are added (V558).
PVS-Studio 4.00 (December 24, 2010)
- New diagnostic rules are added (V546-V557).
- The issue of processing property sheets in Visual Studio 2010 is fixed.
- The error of traversing projects' tree is fixed.
- The "Project" field is added into the PVS-Studio window - it shows the project the current diagnostic message refers to.
- The issue of installing PVS-Studio for Visual Studio 2010 is fixed - now PVS-Studio is installed not only for the current user but for all the users.
- The crash is fixed occurring when trying to save an empty report file.
- The issue of absent safe_types.txt file is fixed.
- The error is fixed which occurred when trying to check files included into the project but actually absent from the hard disk (for instance, autogenerated files).
- Indication of processing the project's tree is added.
- The file with PVS-Studio's analysis results (.plog extension) is now loaded by double-click.
- The licensing policy is changed.
PVS-Studio 4.00 BETA (November 24, 2010)
- A new set of general-purpose static analysis rules (V501-V545, V801).
- New diagnostic rules are added (V124-V126).
- Changes in the licensing policy.
- A new window for diagnostic messages generated by the analyzer.
- Speed increase.
PVS-Studio 3.64 (27 September 2010)
- Major documentation update, new sections was added.
PVS-Studio 3.63 (10 September 2010)
- Fixed bug which occurred sometimes during analysis of files located on non-system partitions.
- Fixed bug in calculation of macros' values for certain individual files (and not the whole project).
- "What Is It?" feature was removed.
- Issues examples for 64-bit code (PortSample) and parallel code (ParallelSample) are merged into single OmniSample example, which is described particularly in documentation.
- Fixed crash related to presence of unloaded project in Visual Studio solution.
PVS-Studio 3.62 (16 August 2010)
- New rule V123: Allocation of memory by the pattern "(X*)malloc(sizeof(Y))"
- The analysis of the code from command line (without Visual Studio project) is improved.
- Diagnostic messages from tli/tlh files do not produced by default.
PVS-Studio 3.61 (22 July 2010)
- Fixed crash in VS2010 with EnableAllWarnings key enabled in project settings.
- Fixed bug related to analysis projects that does excluded from build in Configuration Manager.
- The analysis of the code is considerably improved.
PVS-Studio 3.60 (10 June 2010)
- New rule V122: Memsize type is used in the struct/class.
- New rule V303: The function is deprecated in the Win64 system. It is safer to use the NewFOO function.
- New rule V2001: Consider using the extended version of the FOO function here.
- New rule V2002: Consider using the 'Ptr' version of the FOO function here.
PVS-Studio 3.53 (7 May 2010)
- "What Is It?" feature is added. Now you can ask PVS-Studio developers about diagnistic messages produced by our analyzer.
- The analysis of the code related to usage of unnamed structures is considerably improved.
- Fixed bug in structure size evaluation in certain cases.
PVS-Studio 3.52 (27 April 2010)
- New online help has been added. The previous help system integrated into MSDN. It was not very convenient for some reasons (both for us and users). Now PVS-Studio will open the help system on our site. We refused to integrate it into MSDN anymore. As before, the pdf-version
- of the documentation is also available.
- We stopped supporting Windows 2000.
- The settings page "Exclude From Analysis" was deleted - there is now the page "Don't Check Files" instead.
- Work in Visual Studio 2010 was improved.
- We eliminated the issue of integration into VS2010 when reinstalling.
- We fixed work of the function "Mark As False Alarm" with read-only files.
PVS-Studio 3.51 (16 April 2010)
- PVS-Studio supports Visual Studio 2010 RTM.
- New rule: V003: Unrecognized error found...
- New rule: V121: Implicit conversion of the type of 'new' operator's argument to size_t type.
- You may specify filemasks on the tab "Don't Check Files" to exclude some files from analysis.
- "Exclude From Analysis" option page improved.
- MoreThan2Gb option removed from "Viva64" option page (this option is deprecated).
- If you want check code from command line then you must indicate analyzer type (Viva64 or VivaMP).
- Priority of analyzer's process is reduced. Now you can work on computer more suitable while analysis is running.
PVS-Studio 3.50 (26 March 2010)
- PVS-Studio supports Visual Studio 2010 RC. Although Visual Studio has not been released officially yet, we have already added the support for this environment into the analyzer. Now PVS-Studio integrates into Visual Studio 2010 and can analyze projects in this environment. Help system in Visual Studio 2010 has been changed, so the Help section of PVS-Studio does not integrate into the documentation yet as it is done in Visual Studio 2005/2008. But you still may use online-Help. Support of Visual Studio 2010 RC is not complete.
- A new PDF-version of Help system is available. Now we ship a 50-page PDF-document in the PVS-Studio distribution kit. It is a full copy of our Help system (that integrates into MSDN in Visual Studio 2005/2008 and is available online).
- PVS-Studio now has a new mechanism that automatically checks for new versions of the tool on our site. Checking for the updates is managed through the new option CheckForNewVersions in the settings tab called "Common Analyzer Settings". If the option CheckForNewVersions is set to True, a special text file is downloaded from pvs-studio.com site when you launch code testing (the commands Check Current File, Check Current Project, Check Solution in PVS-Studio menu). This file contains the number of the latest PVS-Studio version available on the site. If the version on the site is newer than the version installed on the user computer, the user will be asked for a permission to update the tool. If the user agrees, a special separate application PVS-Studio-Updater will be launched that will automatically download and install the new PVS-Studio distribution kit. If the option CheckForNewVersions is set to False, it will not check for the updates.
- We have implemented the support for the standard C++0x at the level it was done in Visual Studio 2010. Now it supports lambda expressions, auto, decltype, static_assert, nullptr, etc. In the future, as C++0x support in Visual C++ is developing, the analyzer PVS-Studio will also provide support for the new C++ language capabilities.
- Now you can check solutions with PVS-Studio from the command line instead of Visual Studio environment. Note that we still mean that the checking will be performed from Visual Studio involving the files of projects (.vcproj) and solutions (.sln) but it will be launched from the command line instead of IDE. This way of launching the tool may be useful when you need to regularly check the code with the help of build systems or continuous integration systems.
- New rule V1212: Data race risk. When accessing the array 'foo' in a parallel loop, different indexes are used for writing and reading.
- We added a code signature certificate in the new version of our tool. It is done for you to be sure that the distribution kit is authentic, and get fewer warnings from the operating system when installing the application.
PVS-Studio 3.44 (21 January 2010)
- Partial support of code testing for Itanium processors. Now the code that builds in Visual Studio Team System for Itanium processors may be also tested with the analyzer. Analysis can be performed on x86 and x64 systems but analysis on Itanium is not implemented yet.
- We reduced the number of the analyzer's false alarms when analyzing an array access. Now, in some cases, the analyzer "understands" the ranges of values in the for loop and does not generate unnecessary warnings on accessing arrays with these indexes. For example: for (int i = 0; i < 8; i++) arr[i] = foo(); // no warning from the analyzer.
- The number of the analyzer's false alarms is reduced - we introduced a list of data types that do not form large arrays. For example, HWND, CButton. Users may compose their own type lists.
- The installer error is corrected that occurs when installing the program into a folder different than the folder by default.
PVS-Studio 3.43 (28 December 2009)
- Option ShowAllErrorsInString removed (now it always has the value true).
- New rule V120: Member operator[] of object 'foo' declared with 32-bit type argument, but called with memsize type argument.
- New rule V302: Member operator[] of 'foo' class has a 32-bit type argument. Use memsize-type here.
- Operator[] analysis enhanced.
- Error of long removal of the program in case of recurrent installation "over the program again" corrected.
- Fixed problem related to analysis files with "^" character in filename.
PVS-Studio 3.42 (9 December 2009)
- Errors diagnostics with magic numbers enhanced. Now in a message about a problem, more information is given out; this allows to use filters in a more flexible way.
- Error during work with precompiled header files of special type corrected.
- Option DoTemplateInstantiate is now turned on by default.
- Error with preprocessor hang-up at large number of preprocessor messages corrected.
- Analysis of operator[] enhanced.
PVS-Studio 3.41 (30 November 2009)
- Error of same name files analysis during work on a multicore machine corrected.
- Error of incorrect diagnostics of some types of cast-expressions corrected.
- Parsing of overloaded functions in the analyzer improved considerably.
- Diagnostics of incorrect use of time_t type added.
- Processing of special parameters in the settings of Visual C++ project files added.
PVS-Studio 3.40 (23 November 2009)
- A new feature "Mark as False Alarm" has been added. Due to it, it is now possible to mark those lines in the source code in which false alarm of the code analyzer happens. After such marking, the analyzer will not output any diagnostic messages for such code any more. This allows to use the analyzer constantly and more conveniently in the process of software development for new code verification.
- Project Property Sheets support added, a procedure of easy-to-use Visual Studio projects setup.
- During the verification of parallel programs, the analyzer can walk the code twice, this will allow to collect more information and carry out more precise diagnostics of some errors.
PVS-Studio 3.30 (25 September 2009)
- In PVS-Studio, the possibility of testing 32-bit projects for estimating the complexity and cost of code migration to 64-bit systems has been added.
- A new rule for 64-bit code analysis has been added, V118: malloc() function accepts a dangerous expression in the capacity of an argument.
- A new rule for 64-bit code analysis has been added, V119: More than one sizeof() operators are used in one expression.
- A new rule for parallel code analysis has been added, V1211: The use of 'flush' directive has no sense for private '%1%' variable, and can reduce performance.
- Combined operation with Intel C++ Compiler has been improved (crash at the attempt of code verification with installed Intel C++ Compiler has been corrected.)
- Localized versions of Visual Studio support has been enhanced.
PVS-Studio 3.20 (7 September 2009)
- The error of incorrect output of some messages in Visual Studio localized versions has been corrected.
- Log-file loading improved.
- Critical errors processing improved - now it is easy to inform us on possible tools problems.
- Installer operation improved.
- Project files walking error corrected.
PVS-Studio 3.10 (10 August 2009)
- Templates instantiating support has been added. Now the search of potential errors is carried out not simply by template body (as it was earlier), but also template parameters substitution is made for more thorough diagnostics.
- The code analyzer can work in the mode of Linux environment simulation. We have added the support of various data models. That is why, now it is possible to verify cross platform programs on a Windows system the way it would be carried out on a Linux system.
- The error connected with incorrect functioning of the analyzer of parallel errors in 32-bit environment has been corrected.
- The work of the analyzer with templates has been considerably improved.
PVS-Studio 3.00 (27 July 2009)
- Software products Viva64 and VivaMP are united into one program complex PVS-Studio.
- The new version is a significantly upgraded software product.
- Operation of the unit of integration into Visual Studio is much more stable.
- Operation rate in multi-processor systems is increased: analysis is performed in several threads, and the number of the analyzer's operating threads can be set with the help of "Thread Count" option. By default the number of threads corresponds to the number of cores in the processor but it can be reduced.
- A possibility to operate the analyzer from the command line is added. A new option "Remove Intermediate Files" is added into the settings of the program which allows you not to remove command files created during the code analyzer's operation. These command files can be launched separately without launching Visual Studio to perform analysis. Besides, when creating new command files you can perform by analogy analysis of the whole project without using Visual Studio.
- It became more simple, convenient and quick to operate diagnosis of separate errors. Now you can enable and disable the function of showing separate errors in the analysis' results. What is the most important is that changing of the message list is performed automatically without the necessity of relaunching analysis. Having performed analysis you can scroll through the list of errors or simply disable showing of those errors which are not relevant to you project.
- Operating with error filters has been improved greatly. Filters for hiding some messages are now defined simply as a list of strings. Like in case of diagnosing separate errors, using filters doesn't demand relaunching analysis.
- Change of licensing policy. Although PVS-Studio is a single product, we provide licensing both for separate analysis units such as Viva64 and VivaMP and for all the units together. Besides, there are licenses for one user or for a team of developers. All these changes are reflected in registration keys.
- Support of localized versions of Visual Studio has been improved greatly.
- Help system for a new version of PVS-Studio integrating into MSDN has been modified and improved greatly. Description of new sections allows you to master operation with the software product better.
- Graphic design of the software product has been improved. New icons and graphics in the installer make the analyzer's appearance more beautiful.
VivaMP 1.10 (20 April 2009)
- The analysis of the code containing calls of the class static functions has been improved.
- New diagnostic rules for the analysis of errors connected with the exceptions V1301, V1302, V1303 have been implemented.
- The error of the incorrect display of the analysis progress indicator on machines with non-standard DPI has been corrected.
- Some other enhancements have been implemented.
VivaMP 1.00 (10 March 2009)
- VivaMP 1.00 release.
VivaMP 1.00 beta (27 November 2008)
- First public beta version release on the Internet.
Viva64 2.30 (20 April 2009)
- New diagnostic rule V401 has been implemented.
- Constants processing has been improved, in a number of cases, this reduces the quantity of false diagnostic warnings.
- The error of the incorrect display of the analysis progress indicator on machines with non-standard DPI has been corrected.
- A number of errors have been corrected.
Viva64 2.22 (10 Mach 2009)
- Collaboration of Viva64 and VivaMP is improved.
- Analyzer performance is improved up to 10%.
Viva64 2.21 (27 November 2008)
- Collaboration of Viva64 and VivaMP is added.
Viva64 2.20 (15 October 2008)
- Diagnosis of potentially unsafe constructions is improved. As the result the number of the code analyzer's "false alarms" is reduced approximately by 20%. Now the developer will spend less time to analyze the code diagnosed as potentially unsafe.
- Help system is amended. It has been extended and new examples have been added. As diagnosis of potentially unsafe constructions is improved in this version Help system has been also supplemented with explanations concerning the constructions which are now considered safe.
- The speed of a project's structure analysis is raised. Now the same work is performed 10 times quicker. As the result the total time of the whole project's analysis is reduced.
- C++ template analysis is improved. It's not a secret that far not all the code analyzers understand templates. We're constantly working to improve diagnosis of potentially unsafe constructions in templates. Such an improvement is made in this version.
- Format of some code analyzer's messages is amended to make it possible to set filters more accurately. Thus now, for example, the analyzer doesn't only inform about an incorrect index type while accessing an array but also shows the name of the array itself. If the developer is sure that such an array cannot cause problems in 64-bit mode at all he can filter all the messages concerning this array's name.
Viva64 2.10 (05 September 2008)
- Visual C++ 2008 Service Pack 1 support is added.
Viva64 2.0 (09 July 2008)
- Visual C++ 2008 Feature Pack (and TR1) support is added.
- Pedantic mode is added which allows you to find constructions potentially dangerous but rarely causing errors.
- Diagnosis of template functions is improved
Viva64 1.80 (03 February 2008)
- Visual Studio 2008 is fully supported now.
- Source code analysis speed is increased.
- Installer is improved. Now you can install Viva64 without administrator privileges for personal usage.
Viva64 1.70 (20 December 2007)
- The support of a new diagnostic message (V117) is added. Memsize type used in union.
- Fixed critical bug related to detection of more than one errors in source line.
- Fixed bug in type evaluation in some complex syntax.
- User Interface is improved. Now you can see a common analysis progress indicator.
- Visual Studio 2008 support is added (BETA).
Viva64 1.60 (28 August 2007)
- The support of a new diagnostic message (V112) is added. Dangerous magic number used.
- The support of a new diagnostic message (V115) is added. Memsize type used for throw.
- The support of a new diagnostic message (V116) is added. Memsize type used for catch.
- The restriction of a trial version is changed. In each analyzed file the location of only some errors is shown.
Viva64 1.50 (15 May 2007)
- C source analysis is fully supported. Now C source code may be analyzed correctly.
Viva64 1.40 (1 May 2007)
- Message suppression feature added. You can adjust filters on the message suppression page of the Viva64 settings to ignore some of the warning messages. For example, you can adjust filters to skip messages with particular error codes and messages including names of specific variables and functions.
- Ability to save/load analysis results added.
- Analysis results representation improved. The results are now displayed in the Visual Studio standard Error List window, just like the compiler messages.
Viva64 1.30 (17 March 2007)
- Representation of the process of the code analysis is improved. Unnecessary windows switching are removed, a general progress bar is created.
- Toolbar with Viva64 commands is added.
- The user now can point the analyzer if its program is using more than 2GB of RAM. On using less than 2GB some warning messages are disabled.
- The support of a new diagnostic message (V113) is added. Implicit type conversion from memsize to double type or vice versa.
- The support of a new diagnostic message (V114) is added. Dangerous explicit type pointer conversion.
- The support of a new diagnostic message (V203) is added. Explicit type conversion from memsize to double type or vice versa.
Viva64 1.20 (26 January 2007)
- Filtration of repeating error messages is added. It is useful when there are errors in header files. Earlier if *.h file with an error included into different *.cpp files the warning message about the error in the *.h file was shown several times. Now there is only one message about in the *.h file shown.
- Now Viva64 informs about the number of errors found after the code analysis. You can always see:
- - how much code is left to be checked;
- - how many errors are corrected already;
- - which modules contain the largest number of errors.
- Support of some hot keys is added. Now you can interrupt the analyzer's work with the help of Ctrl+Break. In case you want to check the current file just press Ctrl+Shift+F7.
- There are some errors of the analyzer's work corrected.
Viva64 1.10 (16 January 2007)
- With the help of the Viva64 analyzer itself we've prepared the 64-bit version of Viva64 at once! But you should not care about the choose of the right version during the installation. The installer will find out itself which version should be installed for your operation system.
- The support of a new rule is added. Now the parameters of the functions with the variable number of arguments are checked (V111-error code).
- There is no unnecessary diagnosis of the address to the array item with the help of enum values.
- There is no unnecessary diagnosis of the constructions of type int a = sizeof(int).
- The Help System is improved.
Viva64 1.00 (31 December 2006)
- First public release on the Internet.
Get started with PVS-Studio in Visual Studio
- Installing the plugin from Visual Studio Marketplace
- Entering a license
- Plugin settings
- Running PVS-Studio analysis
- Handling analysis results
- Keyboard shortcuts in the PVS-Studio plugin for Visual Studio
- Useful links
The PVS-Studio plugin for Microsoft Visual Studio provides a user-friendly interface and static analysis capabilities. It has a wide range of additional features to handle analyzer warnings.
You can install the plugin from the official plugin repository or with the help of our installer for Windows. It is available on the download page.
Installing the plugin from Visual Studio Marketplace
To install the PVS-Studio plugin for Visual Studio from Marketplace, you need to open Manage Extensions via Extensions -> Manage Extensions and enter PVS-Studio in the search bar. The search results contain the needed plugin:

After you click Download, the PVS-Studio installer for Windows automatically starts. It contains the plugin, the analyzer core, and additional tools.
The installer asks to close all active processes in the available IDEs and offers to choose plugins for all installed IDEs:

Entering a license
You need to enter the license after installation. See the documentation for more information about entering the license in Visual Studio.
Plugin settings
Besides Registration, PVS-Studio has other settings – let's discuss them in detail.
Common Analyzer Settings
The first option in the list is Common Analyzer Settings:
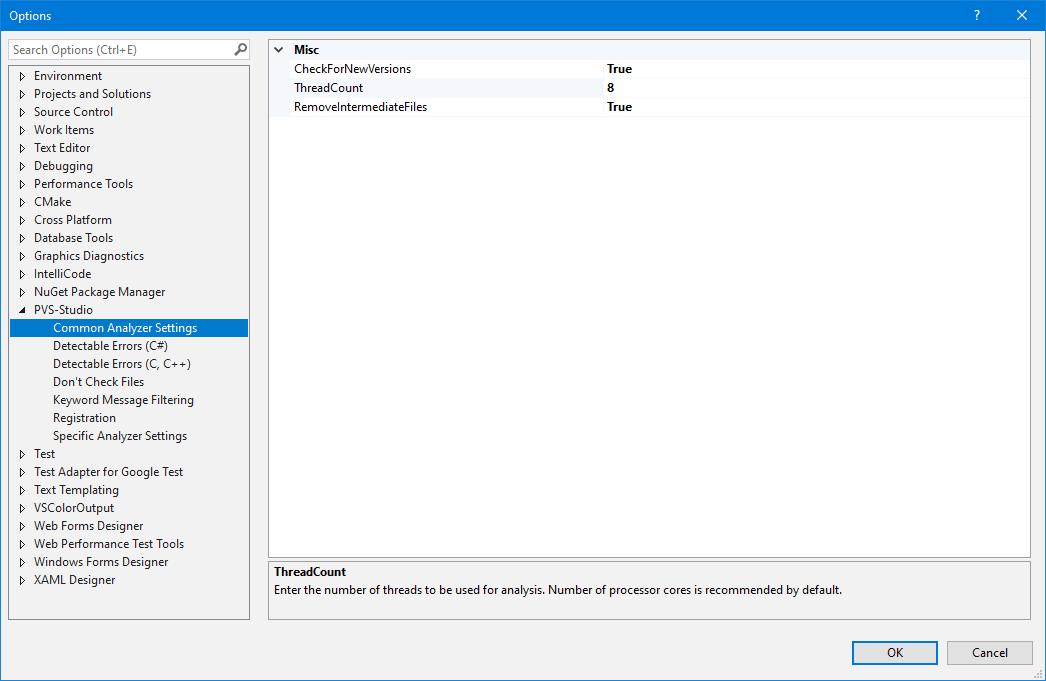
By default, optimal settings are set in this section. ThreadCount (the number of threads) is equal to the number of cores on the used processor.
If some issue is detected in the analyzer work, and you need to report us about it, use RemoveIntermediateFiles. If you select false, artifacts remain after the analysis, (preprocessed files and configuration files). They help to detect the issue.
Detectable Errors
This option allows you to choose the warnings you want to receive. You can hide or show certain warnings or entire classes of diagnostics:
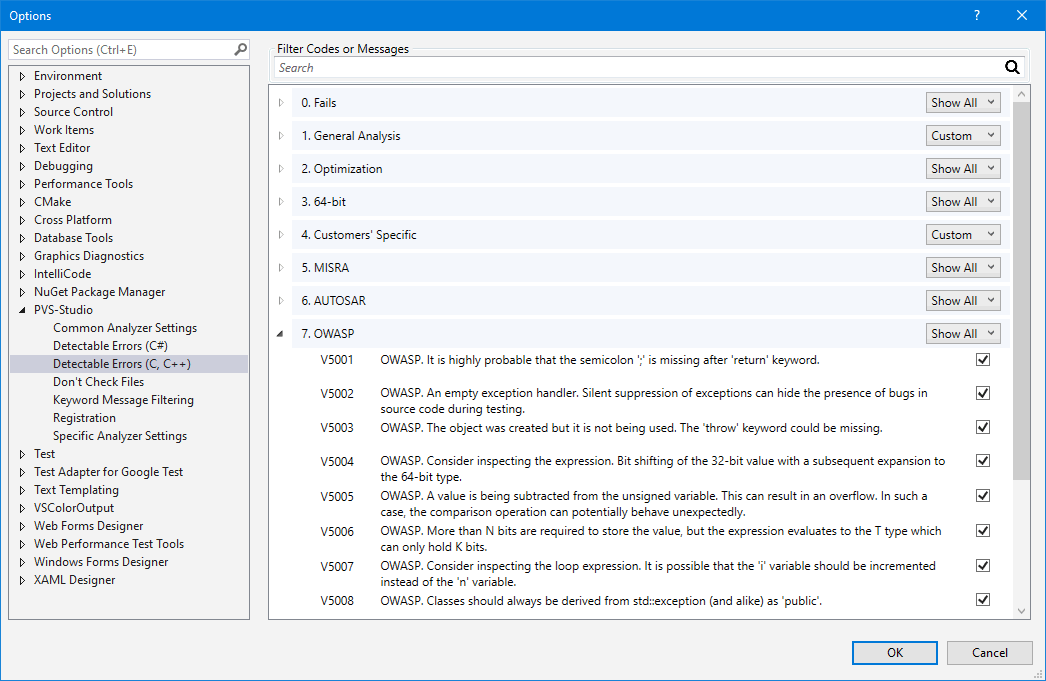
Don't Check Files
An extremely useful option. It helps to improve the quality and speed of analysis by excluding unnecessary files that, for example, do not directly relate to the project:
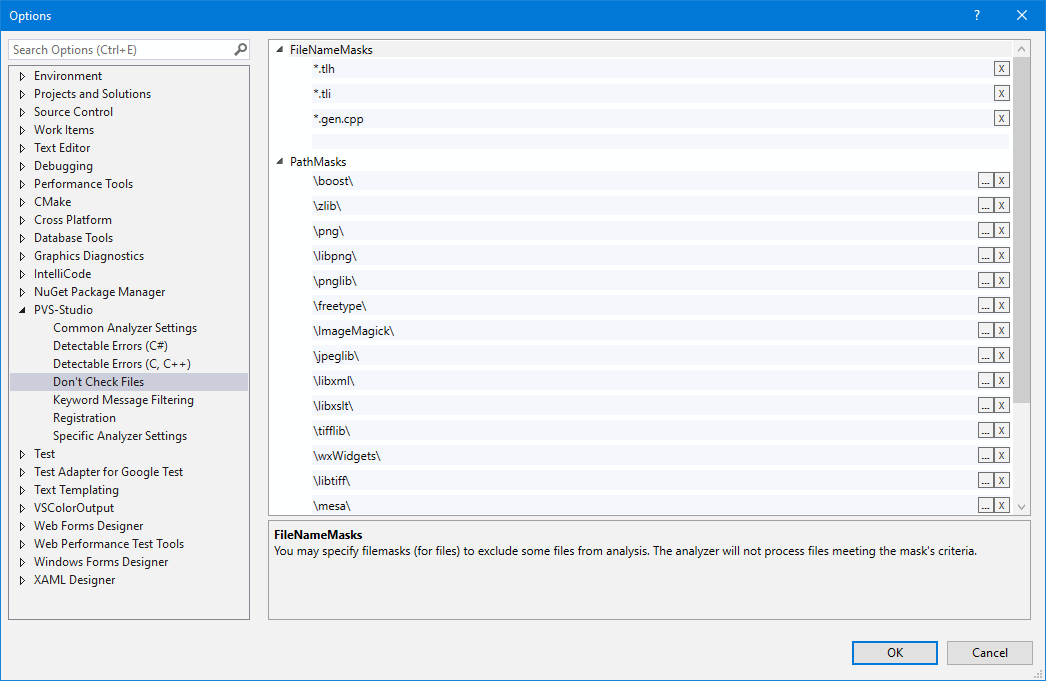
The most common excluded directories and extensions are specified by default. If you have, for example, warnings for third-party code, then you should add it to PathMasks.
For more information about Don't Check Files, see the corresponding documentation section.
Keyword Message Filtering
Using Keyword Message Filtering, you can specify keywords that you want to exclude from the analysis results:
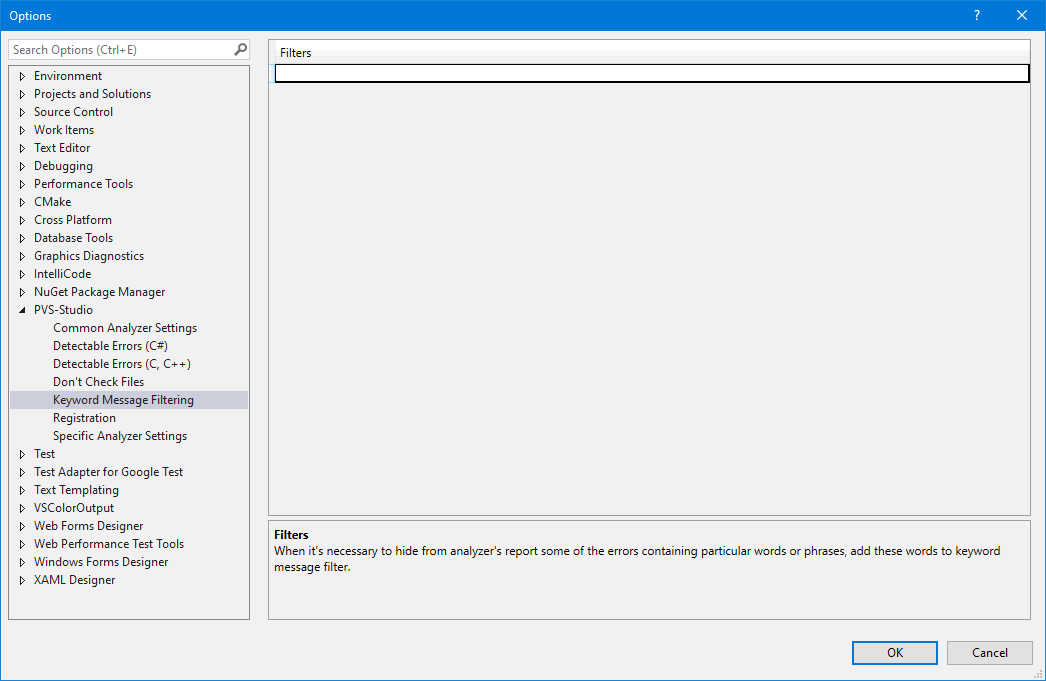
For example, you have error warnings related to printf, but you think that your code cannot contain such errors. In this case, add the printf keyword. Warnings containing the specified value are filtered immediately without rerunning the analysis.
Specific Analyzer Settings
By default, the plugin is configured to work in the most common conditions. However, if the project has specific features, you can additionally configure the analyzer with the help of Specific Analyzer Settings:

The additional settings are described in detail in a special documentation section.
Running PVS-Studio analysis
The PVS-Studio plugin supports the analysis of the entire solution and individual projects and files. To start the analysis, you can select needed files and projects and run the analysis via the context menu:
You can also run the analysis on the current file from:
- the PVS-Studio plugin menu;
- the context menu of the file;
- the context menu of the file header in the file editor.
Additionally, the "Check" menu item has several menu items for more specific analysis options:
The PVS-Studio plugin for Visual Studio allows checking projects and source files for C, C++, and C# languages. For C++, PVS-Studio can check standard Visual C++ projects that use MSBuild.
To check specific projects, such as, for example, NMake projects, you can use the compiler monitoring system.
Handling analysis results
After the analysis, analysis results appear in the IDE:
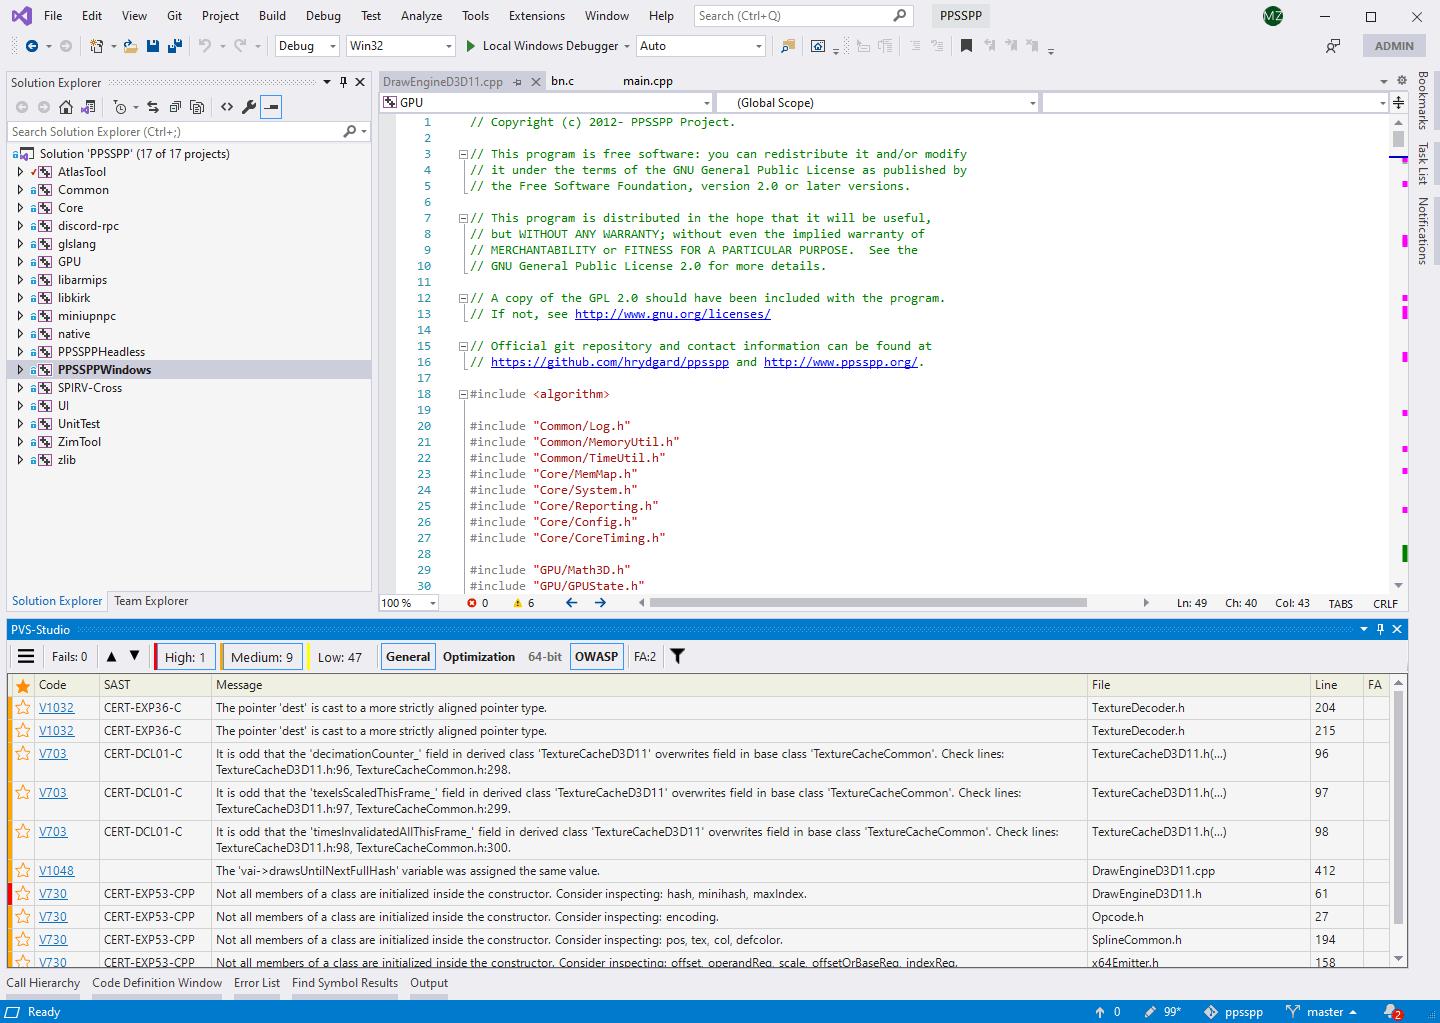
Here you can mark the warnings that interest you, suppress false positives, sort them into different categories, select certainty levels, open the documentation for diagnostics, and perform many other actions with warnings.
Double-clicking on a line allows you to view code fragment containing a suspicious place:
When you click on the hamburger button, an additional menu of the PVS-Studio panel opens:
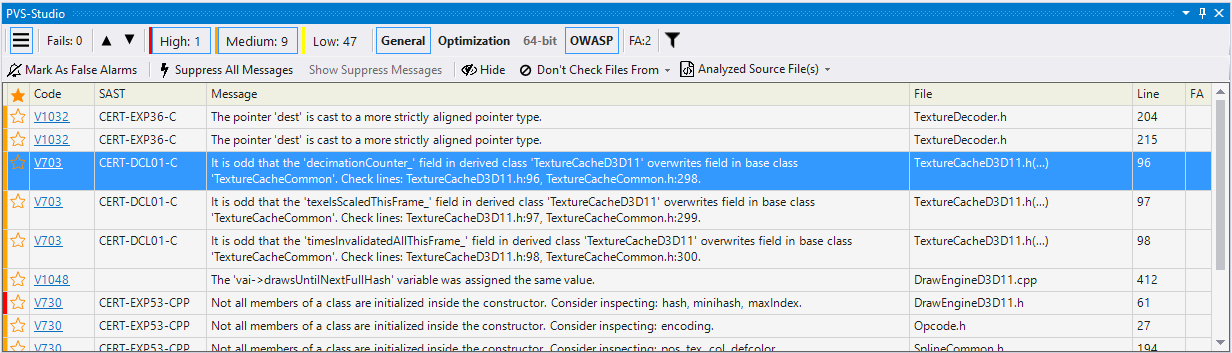
For more information about handling the diagnostic messages, see the documentation.
Suppression of analyzer warnings in legacy code
Running the analyzer for the first time on a large project, you may receive lots of warnings. You definitely should write down the most exciting ones, and you can hide the rest of them with the help of suppression mechanism. After all, your code has already been tested and works correctly. It's unlikely that you find critical issues among issued warnings (however, this may also happen).
To suppress all warnings, select Suppress All Messages in the plugin's additional panel:
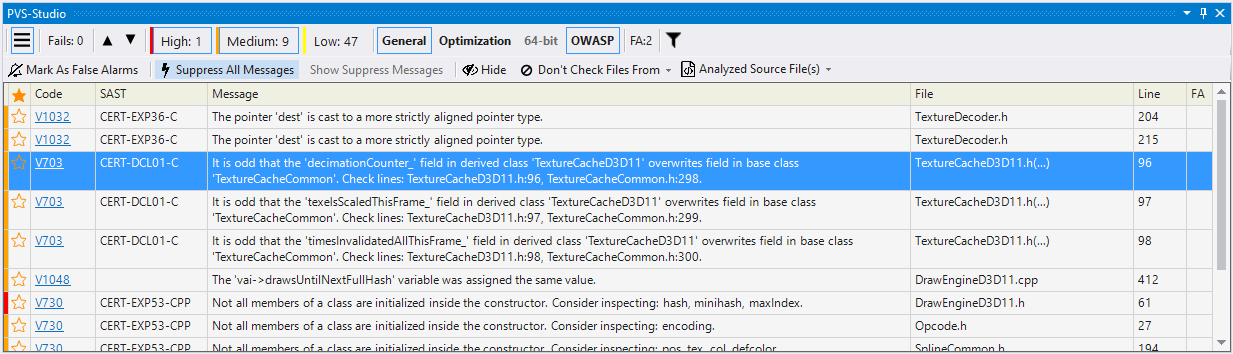
Then, they are added to special *.suppress files. The suppression mechanism takes into account neighboring lines. So, when code lines are moved, messages do not appear again. However, if you fix some place in the code next to the warning, then it is shown when the analysis runs again.
You can see a detailed description of the suppression mechanism and *.suppress in the documentation: Baselining analysis results (suppressing warnings for existing code).
You can also read the "How to introduce a static code analyzer in a legacy project and not to discourage the team" article.
Handling false positives
False positives may appear during the analysis. PVS-Studio provides a special suppression and filtering mechanism for such cases.
To mark a message as false, right-click on a warning line and select Mark selected messages as False Alarms:
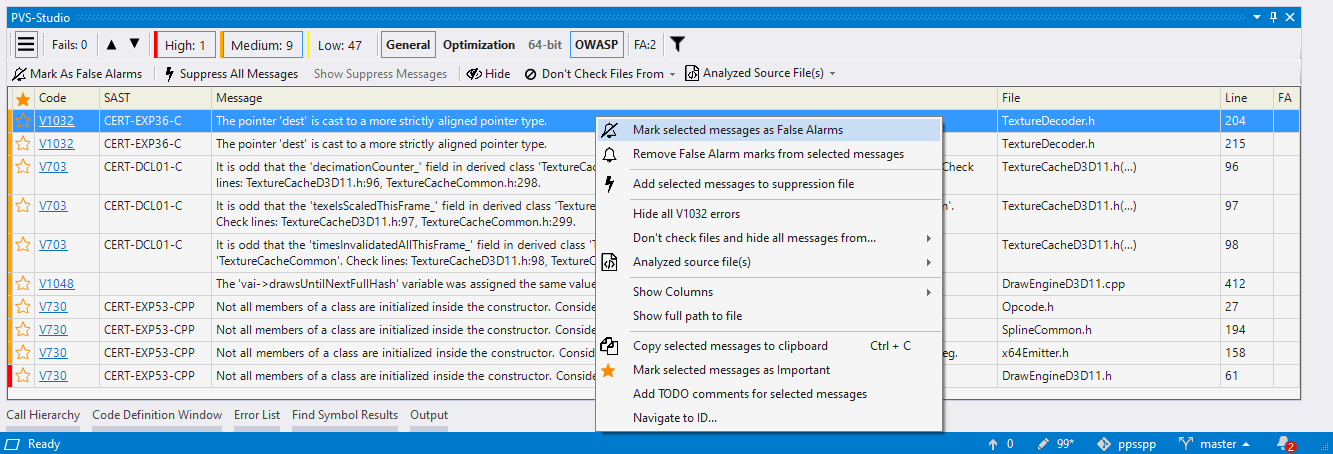
Then, a comment of the //-Vxxx type is added to a warning line. Here xxx is the number of the PVS-Studio diagnostic rule. You can also add such a comment to the code manually. The Remove False Alarm marks from selected messages command in the context menu helps you to remove the false alarm mark from selected messages.
If you don't want to add comments to the code, then you can use the suppression mechanism and add a warning to the *.suppress file. To do this, select the Add selected messages to suppression file option in the context menu:
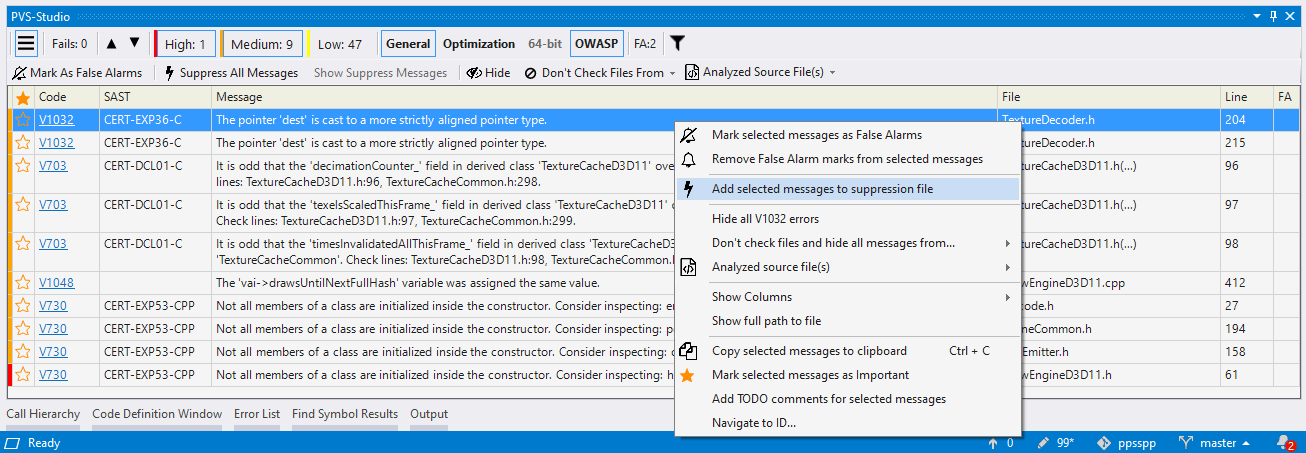
For more details about the suppression of false positive warnings, see the documentation: Suppression of false positive warnings.
View the analyzer's most interesting warnings
If you are new to the static analysis tool and would like to know what it can do, you can use the Best Warnings mechanism. This mechanism will show you the most important and reliable warnings.
To check out the analyzer's most interesting warnings, click on the 'Best' button, as shown in the screenshot below:

After that, the table with the results of the analysis will show maximum of ten of the most critical warnings of the analyzer.
Keyboard shortcuts in the PVS-Studio plugin for Visual Studio
The PVS-Studio plugin for Visual Studio has the analysis result window. This window has a dropdown menu that appears when you right-click on the analysis result window:

Some of these actions have keyboard shortcuts. Thus, you can perform them without using a mouse.
The arrow keys for navigating the analyzer's warnings also have shortcuts:
- move to the next message: Alt + [;
- move to the previous message: Alt + ].
Using shortcuts is helpful, since they speed up the analysis result processing. You can set and customize the shortcuts in settings: Tools -> Options -> Keyboard. To find shortcuts faster, enter 'PVS-Studio' in the search field of the Keyboard window.
Useful links
- Incremental analysis mode in PVS-Studio
- Baselining analysis results (suppressing warnings for existing code)
- Suppression of false positive warnings
- How to display Best Warnings
Viewing reports in SARIF format in Visual Studio Code
Please note. A better way to work in Visual Studio Code is to use the PVS-Studio extension for Visual Studio Code instead of the Sarif plugin for Visual Studio Code described in this documentation.
You can view PVS-Studio reports in Visual Studio Code via the Sarif Viewer plugin. Below are instructions on how to install the plugin, upload the PVS-Studio report to it, and work with this report.
You can analyze the code and get the report in one of the following ways:
- the command-line utilities: PVS-Studio_Cmd.exe (C++, C# Windows), pvs-studio-dotnet (C# Linux/macOS), CompilerCommandsAnalyzer.exe (C++ Windows) / pvs-studio-analyzer (C++ Linux/macOS);
- the JSON Compilation Database for C++ projects;
- the PVS-Studio plugins for IDEs: Visual Studio, JetBrains Rider, CLion, IntelliJ IDEA, Qt Creator;
- the extension for VS Code;
- the plugins for the Maven and Gradle build systems;
- the compiler monitoring system;
- the pvs-studio.jar command-line utility.
How to install the Sarif Viewer plugin
To install the 'Sarif Viewer' plugin, open Visual Studio Code, go to the 'Extensions' tab. In the search field, enter "Sarif Viewer" and click 'Install':

Note: the 'Sarif Viewer' plugin version 3.1.2 or higher is required for correct operation. If you can't find version 3.1.2 or higher in VS Code, you can find the desired version in the plugin repository on GitHub. Each version's sources have a file with the .vsix extension.
Install the plugin from the .vsix file: in the 'Extensions' tab, click on the three-dotted button. In the context menu, click 'Install from VSIX...':

In the opened window, select the .vsix file of the 'Sarif Viewer' plugin. After the plugin is installed, restart Visual Studio Code.
How to work with the analysis results
Converting a PVS-Studio report to the SARIF format
SARIF is a universal format for providing information from static analyzers. SARIF is used not only in PVS-Studio, but in other tools. For example, GitHub's Code scanning alerts, Coverity, and CodeSonar.
To convert reports, you can use command-line utilities like PlogConverter.exe for Windows and plog-converter for Linux/macOS. These utilities not only convert PVS-Studio's reports, but also process it — filter messages, for example.
The report format that should be used in Sarif Viewer is slightly different from the universal SARIF format. Therefore, when converting a report for VS Code, you should use a special SARIF format:
- 'SarifVSCode' in PlogConverter.exe;
- 'sarif-vscode' in plog-converter.
Below is an example of a command in PlogConverter.exe (Windows) to convert a PVS-Studio report to a SARIF format for Visual Studio Code:
PlogConverter.exe path\to\report.plog -t SarifVSCode ^
-o output\directory ^
-n converted_report_nameAn example of a command in plog-converter (Linux/macOS) to convert a PVS-Studio report to a SARIF format for Visual Studio Code:
plog-converter path/to/report/file.json -t sarif-vscode \
-o output/directory \
-n converted_report_nameNote. These utilities can convert a PVS-Studio report into a universal SARIF format. This format can be used in Sarif Viewer, but navigation through additional warning positions will not work.
If paths in the report start with the '|?|' mark, they need to be converted to absolute. Without this, the navigation through warnings won't work. Use the 'r' flag to replace the mark with the part of the path.
Example of a command to convert a report to SARIF format with the conversion of paths to absolute:
PlogConverter.exe path\to\report.plog -t SarifVSCode ^
-o output\directory ^
-n converted_report_name ^
-r path\to\project\folderHow to view the PVS-Studio report in VS Code
To open a report in a SARIF format, use menu items 'File > Open File':

You can also open the report from the file explorer. To do this, use the 'Open with Code' command from the context menu:

After the report is downloaded, a separate tab will open:

The plugin window has several tabs for grouping warnings:
- Locations — groups warnings by files;
- Rules — groups warnings by rules;
- Logs — groups warnings by the SARIF report files.
On the top right, there are several elements in the tab added by the plugin:
- the 'Collapse All' / 'Expand All' button. Collapses or expands all warning nodes;
- the 'Open Log' button. Opens a new/another SARIF report;
- a text filter field with a button.
A text filter allows filtering warnings from the report by any text that is displayed in the table with a list of warnings. For example, by the text of the warning message, as well as by the full or partial file name:

Click on the filter icon to open a menu with additional warning filters and checkboxes for hiding/displaying the 'BaseLine', 'Suppression', and 'Rule' columns:

The 'INFO' tab displays information about the selected warning:

If you click on a warning, the corresponding file opens on the line to which it was issued. The string is underlined by a wavy line of one of the three colors. Each color indicates the warning's certainty level and corresponds to one of the levels in the additional filters:
- Red: High — Error;
- Yellow: Medium — Warning;
- Blue: Low — Note.
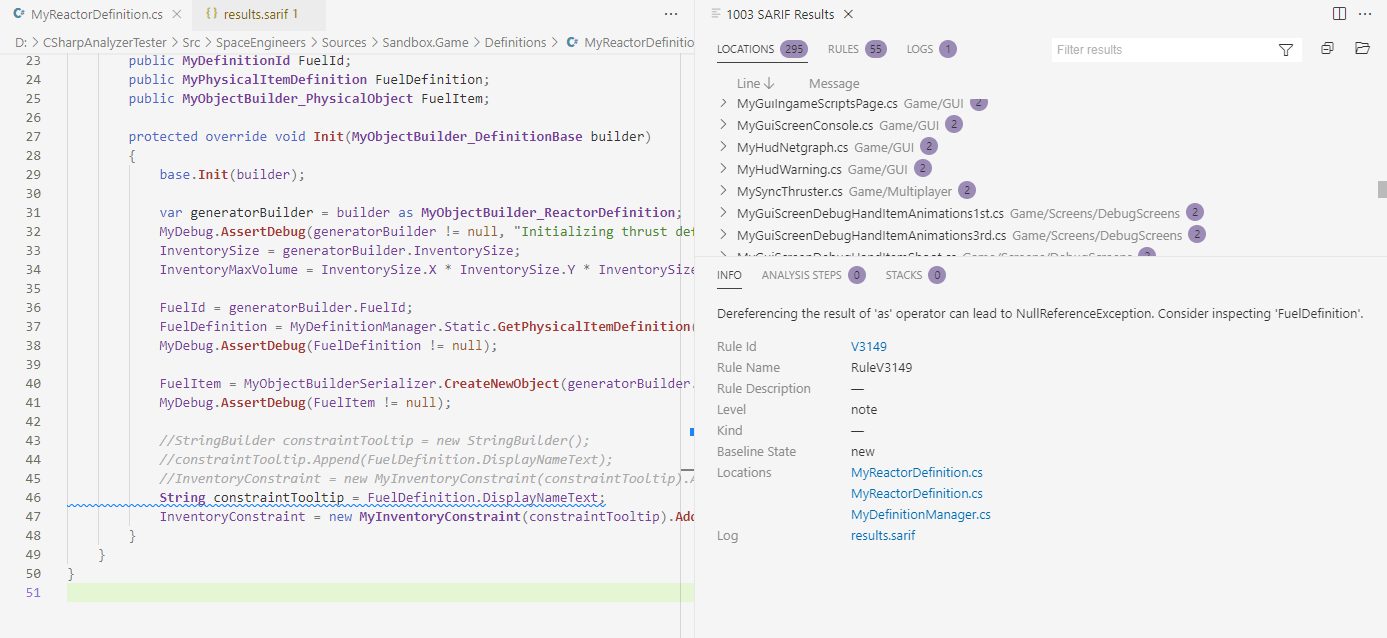
One warning may relate to several positions in code. In this case, several lines will be displayed in the 'INFO' tab next to the Locations label:

Positions can point to lines in one or more files. This makes it easier to understand the warning. Click on the text with the description of the position to open the specified file on the line associated with the position.
PVS-Studio for embedded development
- Watch, don't read (YouTube)
- Analysis of projects in Linux and macOS
- Analysis of projects in Windows
- Warnings with the V001 number
- The used compiler is not in the list
- Static Application Security Testing (SAST)
- Project analysis with PlatformIO
- Additional links
Development for embedded systems has its own specific characteristics and approaches, but control of code quality in this sphere is no less important than in the other ones. PVS-Studio supports the analysis of projects that use the following compilers:
- IAR embedded workbench
- Keil embedded development tools for Arm
- TI ARM code generation tools
- GNU embedded toolchain
Supported platforms for development are Windows, Linux and macOS.
Watch, don't read (YouTube)
Analysis of projects in Linux and macOS
After installing the analyzer in Linux or macOS, the pvs-studio-analyzer utility for projects analysis will become available. Learn more about how the utility works here.
Automatic definition of supported compilers is added in the utility. If a modified or advanced development package is used, you can list the names of the used embedded-compilers with the help of the ‑‑compiler parameter.
-C [COMPILER_NAME...], --compiler [COMPILER_NAME...]
Filter compiler commands by compiler nameAnalysis of projects in Windows
After installing the analyzer, a large set of different utilities meant for various analyzer working modes, will be available.
Console mode
The project analysis can be automated using successive runs of the following commands of the CLMonitor utility:
"C:\Program Files (x86)\PVS-Studio\CLMonitor.exe" monitor
<build command for your project>
"C:\Program Files (x86)\PVS-Studio\CLMonitor.exe" analyze ... -l report.plog ...Note. The command runs the process in a nonblocking mode.
Graphic mode
In the Compiler Monitoring UI utility, you need to change the mode to the build monitoring in the menu Tools > Analyze Your Files (C/C++) or by clicking the "eye" on the toolbar:

Before running the build monitoring, the following menu for additional analysis configuration will be available:

After running the monitoring, a project build is to be performed in an IDE or with the help of build scripts. Once the build is complete, click Stop Monitoring in the following window:

The analysis results will be available in the Compiler Monitoring UI utility after the analysis of files in the compilation.
Note. The default method of the compilation monitoring may miss some source files. The problem is especially relevant for Embedded projects since their files are written in C language and can be quickly compiled. To monitor all files that are being compiled, read the Wrap Compilers section of the documentation about monitoring utility.
Warnings with the V001 number
In the analyzer report, such warnings might be encountered:
V001: A code fragment from 'source.cpp' cannot be analyzed.Developers of compilers for embedded systems often diverge of standards and add non-standard extensions in the compiler. In the sphere of microcontrollers it is particularly prevalent and is not something unusual for developers.
However, for a code analyzer it represents non-standard C or C++ code, which requires additional support. If such warnings come up for your code, send us, please, the archive with the preprocessed *.i files received from the problematic source files and we'll add support of new compiler extensions.
You can enable the mode of saving such files while analyzing in the following way:
- In the Compiler Monitoring UI utility in the menu Tools > Options... > Common Analyzer Settings > RemoveIntermediateFiles set the false value;
- Pass the ‑‑verbose parameter to the utility pvs-studio-analyzer.
The used compiler is not in the list
The market of development packages for embedded systems is very wide, so if you haven't found your compiler in the list of supported ones, please, report us about your desire to try PVS-Studio via the feedback form and describe in detail the used development tools.
Static Application Security Testing (SAST)
To improve the quality of code or security of devices in the sphere of development for embedded systems, some people often follow different coding standards, such as SEI CERT Coding Standard and MISRA and also try to avoid the emergence of potential vulnerabilities, guided by a list of the Common Weakness Enumeration (CWE). PVS-Studio checks code compliance to such criteria.
Project analysis with PlatformIO
To analyze a project for embedded system with PVS-Studio, you can also use PlatformIO cross-platform IDE. It can manage build toolchains, debuggers and library dependencies, and is available under many mainstream operating systems, such as Windows, macOS and Linux.
To enable PVS-Studio analysis, you should add the following in configuration file (platformio.ini):
check_tool = pvs-studio
check_flags = pvs-studio: --analysis-mode=4Then use this command in the terminal:
pio checkMore details about PlatformIO static analysis support are available on its project page, as well as on PVS-Studio analyzer configuration page.
Additional links
This document includes peculiarities of launching the analyzer and checking of projects for embedded systems. As for the rest, the analyzer launch and its configuration are made the same as for other types of projects. Before using the analyzer we recommend checking out the following documentation pages:
- Getting acquainted with the PVS-Studio static code analyzer;
- Compiler monitoring system in PVS-Studio;
- How to run PVS-Studio on Linux and macOS;
- PVS-Studio SAST (Static Application Security Testing, SAST).
How to use the OWASP diagnostic group in PVS-Studio
This section describes various ways of checking code for compliance with OWASP ASVS using PVS-Studio.
How to enable the OWASP rules in PVS-Studio
You can find the description of all diagnostic rules here: "PVS-Studio messages". If you are interested in the diagnostic rules from the OWASP group, then you may also find interesting the following classifications of the PVS-Studio warnings:
As noted above, the OWASP ruleset is disabled by default. Let's look at the ways how to enable and configure these rules.
If you use the PVS-Studio plugin for IDE
If you run the analysis with the plugin for Visual Studio or some other IDE, use graphical interface to enable the OWASP ruleset.
To do this, go to the analyzer settings. For example, in Visual Studio 2019, open Extensions -> PVS-Studio -> Options:

For other IDEs, ways to enable the OWASP rules may differ. For more information, including information on how to open settings in other IDEs, read "Getting acquainted with the PVS-Studio static code analyzer on Windows".
In Options, click on the "Detectable Errors" tab for the language you need. Here you need to change the option for the OWASP group:
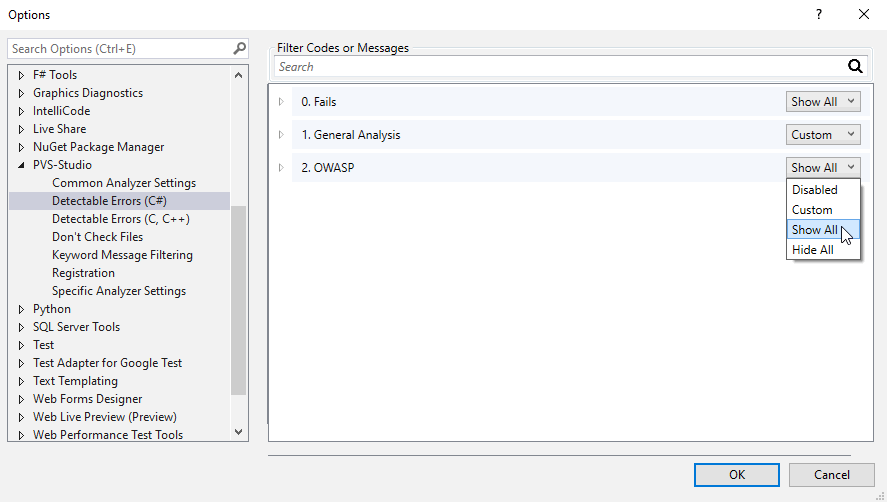
By default, the OWASP group of rules is set to 'Disabled'. That means that all the OWASP group rules are disabled for the certain language. To enable them, select 'Custom', 'Show All' or 'Hide All' depending on your needs. Read more about these and other settings in the documentation. For example, the "Settings: Detectable Errors" section contains description of the "Detectable Errors" tab.
The 'Show All' option enables the entire message group. Accordingly, the PVS-Studio output window will display the warnings that correspond to the rules from this group. At the same time, a button will appear in the upper part of the window. It displays or hides warnings from the corresponding group:
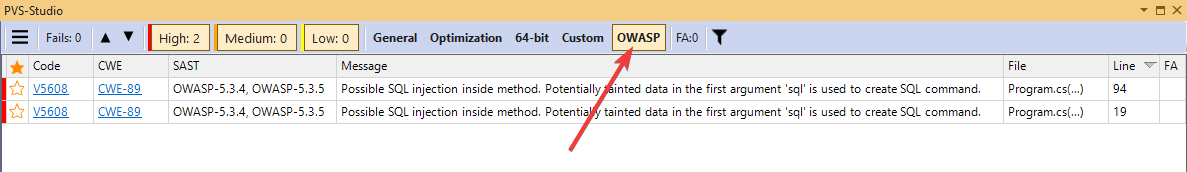
Note that each of the OWASP warnings has the corresponding SAST and CWE identifier. In addition, almost all warnings have the corresponding CWE. Find more information on how to manage the warning output window here: "Handling the diagnostic messages list in Visual Studio". You can adjust settings of the output window in other IDEs in a similar way.
If you run the analyzer from a command-line
If you run the analysis through the command line interface, then most likely you need to edit the settings file manually (i.e., not through the graphical interface).
Below is a brief description of how to enable OWASP ruleset in various situations.
How to enable OWASP rules in the C# analyzer
The main way to configure the C# analyzer for any OS is to edit the Settings.xml file. It is the same Settings.xml file that is used by plugins for Visual Studio, CLion and Rider.
By default, the file has the following path:
- Windows: "%APPDATA%\PVS-Studio\Settings.xml";
- Linux/macOS: "~/.config/PVS-Studio/Settings.xml".
Also, when you start the analysis, you can pass the path to the settings as a command-line argument. For more information about the command-line utilities usage, see "Analyzing Visual Studio/MSBuild/.NET projects from the command line using PVS-Studio".
The analyzer settings are stored in XML format. To enable the OWASP ruleset, focus on the following nodes:
- DisableOWASPAnalysisCs – if the node is false, then the OWASP ruleset for the C# analyzer will be enabled. If the node is true - the rules will be disabled;
- DisableDetectableErrors – the node that contains a list of the rule codes separated by a space (examples of diagnostic codes: V3163, V5608, V3022). The display of these rules will be disabled.
Accordingly, to enable checking code for compliance with OWASP, write the corresponding values in 'DisableOWASPAnalysis' and 'DisableOWASPAnalysisCs'. Also, make sure that the rules you need are not written in the 'DisableDetectableErrors' node.
How to enable OWASP ruleset in the C++ analyzer
Windows
To set up the C++ analyzer on Windows, you can also use the Settings.xml file (described above). It works if you run the analysis with the following tools:
- plugin for Visual Studio, Rider or CLion;
- PVS-Studio_Cmd console utility;
- C and C++ Compiler Monitoring UI.
To enable the OWASP ruleset, set the corresponding values for the 'DisableOWASPAnalysis' nodes (analogous to 'DisableOWASPAnalysisCs' for C++) and 'DisableDetectableErrors'.
Sometimes it may be necessary to run the C++ analyzer directly (via PVS-Studio.exe). In this case, you need to adjust the settings with the '*.cfg' file. The path to the file needs to be passed as the '‑‑cfg' parameter value:
PVS-Studio.exe --cfg "myConfig.cfg"To get more information on how to run the analysis this way, see "Direct integration of the analyzer into build automation systems (C/C++)". To enable the OWASP rules in the configuration file, check the value of the 'analysis-mode' parameter. The value allows you to manage the groups of diagnostic rules that are enabled. It must be the sum of numbers corresponding to the enabled groups. For example, '4' corresponds to the General Analysis, and '128' - to the analysis with the enabled OWASP rules. If you need to use only these two groups, pass '132' to 'analysis-mode'. If this parameter is not set (or the value is 0), then all available groups, including OWASP, will be used in the analysis.
Moreover, this parameter can be set as a command-line argument:
PVS-Studio.exe --analysis-mode 132 ....Linux
For Linux, we adjust settings in about the same way as when we use 'PVS-Studio.exe'. Execute the 'pvs-studio-analyzer analyze' command to run the analysis. Among the command parameters, it is worth to mention 'analysis-mode' and 'cfg'.
'‑‑analysis-mode' (or '-a') determine the warning groups which will be enabled during analysis. To enable the OWASP rules, the 'OWASP' must be written in the list of groups separated by ';'. Example:
pvs-studio-analyzer analyze .... -a GA;MISRA;OWASP'‑‑cfg' (or '-c') allows you to specify the path to a special configuration file - '*.cfg'. This file is similar to file that we used for 'PVS-Studio.exe ' (described above).
Find more information in the section "How to run PVS-Studio on Linux and macOS".
How to enable OWASP in the Java analyzer
The following documentation page is devoted to the Java analyzer: "Direct use of Java analyzer from command line". It provides all the information necessary to run the analysis, enable OWASP diagnostics, etc. To activate OWASP rules, below is a brief description of the settings that you need to change.
The way to enable the OWASP ruleset depends on the tools you use to run the analysis.
For example, if you use the plugin for Maven ('pvsstudio-maven-plugin'), then in its configuration (in the 'pom.xml' file) you need to add the 'OWASP' value to the <analysisMode> node. Also, check the values in the <enabledWarnings> and <disabledWarnings> nodes. Example:
<build>
<plugins>
<plugin>
<groupId>com.pvsstudio</groupId>
<artifactId>pvsstudio-maven-plugin</artifactId>
<version>7.14.50353</version>
<configuration>
<analyzer>
<outputType>text</outputType>
<outputFile>path/to/output.txt</outputFile>
<analysisMode>GA,OWASP</analysisMode>
</analyzer>
</configuration>
</plugin>
</plugins>
</build>If you use the plugin for Gradle, open the 'build.gradle' file and edit the 'analysmode' value in the 'pvsstudio' block. Check the 'enabledWarnings' and 'disabledWarnings' as well. Example:
apply plugin: com.pvsstudio.PvsStudioGradlePlugin
pvsstudio {
outputType = 'text'
outputFile = 'path/to/output.txt'
analysisMode = ["GA", "OWASP"]
}You can also configure both these plugins from the command line.
How to disable and filter individual diagnostic rules
After you enabled the OWASP ruleset, it may turn out that the triggerings of some rules on your project is irrelevant. For example, V5606 checks the code for compliance to the OWASP ASVS 7.4.2 position:
Verify that exception handling (or a functional equivalent) is used across the codebase to account for expected and unexpected error conditions.
According to the requirement, the V5606 rule generates a message if it detects empty catch or finally block.
Let's say, it is acceptable to have empty exception handling blocks in your project. In this case, you do not need to receive the V5606 messages. For convenience, you can hide them from the analyzer output. Use one of the methods described below.
Common Analyzer Settings
You can hide the analyzer messages through the analyzer's general settings. Change the settings either manually (as described above) or through the plugin for IDE:
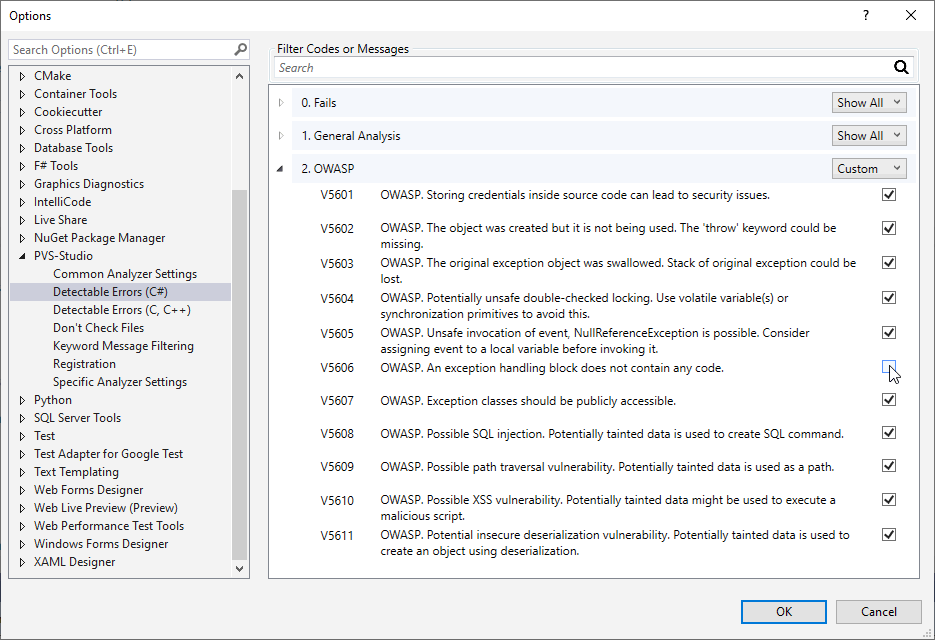
Usage of the pvsconfig file
Benefits of using pvsconfig
You cannot disable individual diagnostics (only groups as a whole) while changing the settings in the IDE plugin or editing 'Settings.xml'. Instead, the generated messages will simply be hidden when viewing the log in the IDE. In some cases, such behavior of messages can be convenient. However, in other cases it would be more logical to completely disable the diagnostic.
In addition, sometimes you need to disable the triggerings of certain levels.
For example, some rules that allow the taint analysis implementation consider parameters of publicly available methods potential sources of tainted data. You can find the explanation of such behavior in the note "Why you should check values of public methods' parameters". The analyzer issues a warning at the low certainty level when the source of potentially tainted data is parameter of public method.
It is possible that warnings about the need to validate parameters are not relevant for your project. At the same time, you don't want to completely disable the rule or hide its warnings. It's more convenient to disable warnings at a specific level.
The pvsconfig files allow the user to disable warnings at a specific level, as well as to completely disable diagnostics, redefine the level, etc.
How to create pvsconfig
Files with the pvsconfig extension allow additional adjustment of the analysis settings. Currently, one can use these files during analysis of C++ and C# projects.
The "Suppression of false positive warnings" page describes both the possibilities of disabling diagnostics through pvsconfig, as well as other ways to exclude unwanted triggerings. The description of other features, such as changing warning levels or replacing substrings in messages, find in the section "Additional diagnostics settings".
To use the functionality, simply add a file with the pvsconfig extension to the project or solution.
The most convenient way to create pvsconfig is through the IDE. Use a special template:
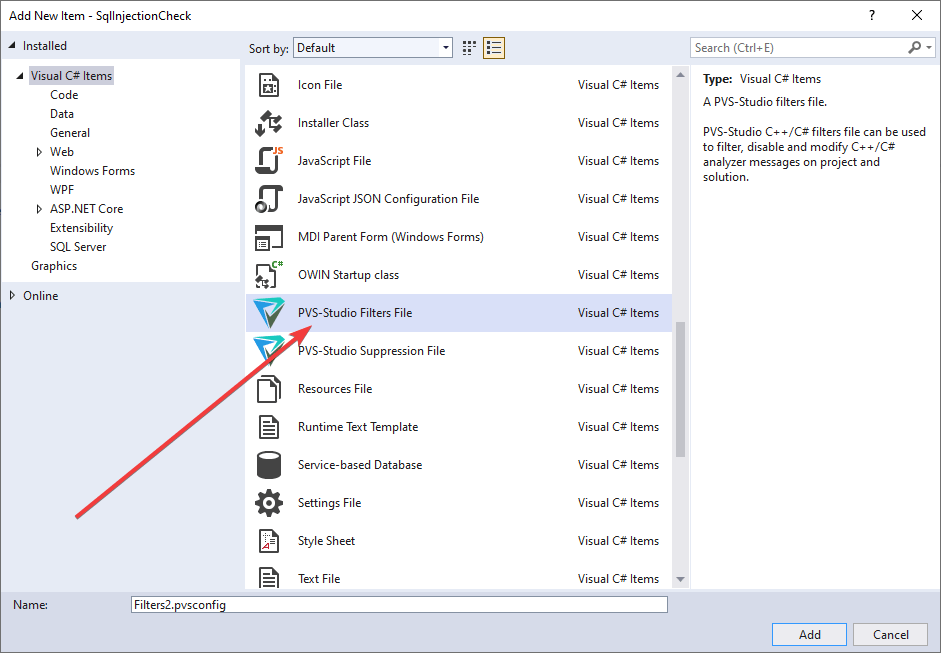
In this case, the file you created will contain various commented-out examples. It simplifies writing your own instructions:
# Example of PVS-Studio rules configuration file.
# Full documentation is available at
# https://pvs-studio.com/en/docs/manual/full/
# https://pvs-studio.com/en/docs/manual/0040/
#
# Filtering out messages by specifying a fragment from source code:
# //-V:textFromSourceCode:3001,3002,3003
#
# Turning off specific analyzer rules:
# //-V::3021,3022
#
# Changing in analyzer's output message:
# //+V3022:RENAME:{oldText0:newText0},{oldText1:newText1}
#
# Appends message to analyzer's message:
# //+V3023:ADD:{Message}
#
# Excluding directories from the analysis:
# //V_EXCLUDE_PATH \thirdParty\
# //V_EXCLUDE_PATH C:\TheBestProject\thirdParty
# //V_EXCLUDE_PATH *\UE4\Engine\*
#
# Redefining levels:
# //V_LEVEL_1::501,502
# //V_LEVEL_2::522,783,579
# //V_LEVEL_3::773
#
# Disabling groups of diagnostics:
# //-V::GA
# //-V::GA,OWASP
#
# Disabling messages with specified warning levels:
# //-V::3002:3
# //-V::3002,3008:3
# //-V::3002,3008:2,3
#
# Rule filters should be written without '#' character.Pvsconfig provides a large number of different ways to configure the analysis - from changing the level to changing the output messages themselves or completely disabling diagnostics. Let's look at some features of the pvsconfig.
Note. Some functions may be available only for specific analyzers – read more about this in the sections "Suppression of false positive warnings" and "Additional diagnostics configuration".
Example of rule disabling
To disable, for example, the V5606 rule (the one about empty catch and finally blocks), add the following line to the file:
//-V::5606Example of disabling warnings at specific level
You also can disable the diagnostic warnings at a specific level. Earlier, we studied an example with taint diagnostics that issue the 3rd level warnings if a parameter is a taint source. For example, you need to exclude warnings about potential SQL injections, where a parameter is a taint source. Add the following line to pvsconfig
//-V::5608:3Therefore, the 3rd level warnings of V5608 will be excluded from the analysis results.
Example of level redefinition
The pvsconfig has another useful feature: it helps redefine the level of warnings issued by diagnostic. For example, you can redefine the level of all V5609 triggerings:
//V_LEVEL_2::5609This line tells the analyzer to generate warnings of the V5609 rule with the second (average) certainty level.
Using PVS-Studio with IntelliJ IDEA and Android Studio
- Installing the plugin from the official JetBrains repository
- Installing the plugin from the PVS-Studio repository
- Plugin settings
- Checking code with PVS-Studio from IntelliJ IDEA and Android Studio
- Managing analysis results
- PVS-Studio Java update
The PVS-Studio analyzer can be used with IntelliJ IDEA and Android Studio. The PVS-Studio plugin provides a convenient GUI for running analysis of projects and individual files. It also helps manage diagnostic warnings.
PVS-Studio plugins for IntelliJ IDEA and Android Studio can be installed from the official JetBrains plugin repository or from the repository on our website. You can also use the PVS-Studio installer for Windows, which is available on our download page.
Installing the plugin from the official JetBrains repository
To install the PVS-Studio plugin from the official JetBrains repository, open the settings window by 'File -> Settings -> Plugins', select the 'Marketplace' tab, and enter "PVS-Studio" in the search bar. The PVS-Studio plugin appears in the search results:
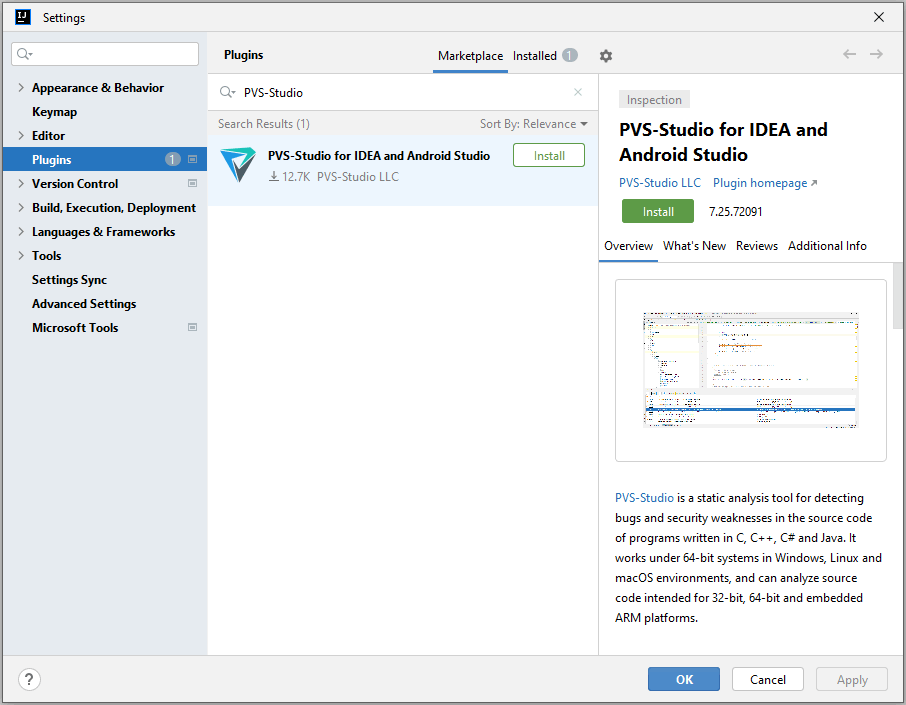
Click 'Install' next to the plugin name. After the installation, click 'Restart IDE'.
After restarting the IDE, you can use the PVS-Studio plugin to analyze your code.
Note: you don't need to download and install the Java analyzer core separately. The plugin will download and install the necessary version of core when you run the analysis in IntelliJ IDEA or Android Studio.
Installing the plugin from the PVS-Studio repository
In addition to the official JetBrains repository, the PVS-Studio plugin is also available from the PVS-Studio repository. To install the plugin from there, you first need to add this repository to the IDE. To do this, click 'File -> Settings -> Plugins' to open the plugin installation window, click the gear icon in the top-right corner and select ˈManage Plugin Repositoriesˈ from the drop-down menu:
In the opened window, enter the path: http://files.pvs-studio.com/java/pvsstudio-rider-plugins/updatePlugins.xml; and click 'OK'.

The last step of installation remains unchanged from the previous scenario of installing the plugin from the official repository. Open the 'Marketplace' tab and enter "PVS-Studio" in the search bar. Select the plugin 'PVS-Studio for IDEA and Android Studio' in the search results, click 'Install', and restart the IDE.
Plugin settings
The 'Settings' window of the PVS-Studio plugin has multiple tabs. Let's discuss each tab in detail.
Misc contains settings of the PVS-Studio analyzer core. Hover your mouse the option name to see a pop-up tooltip for that option.
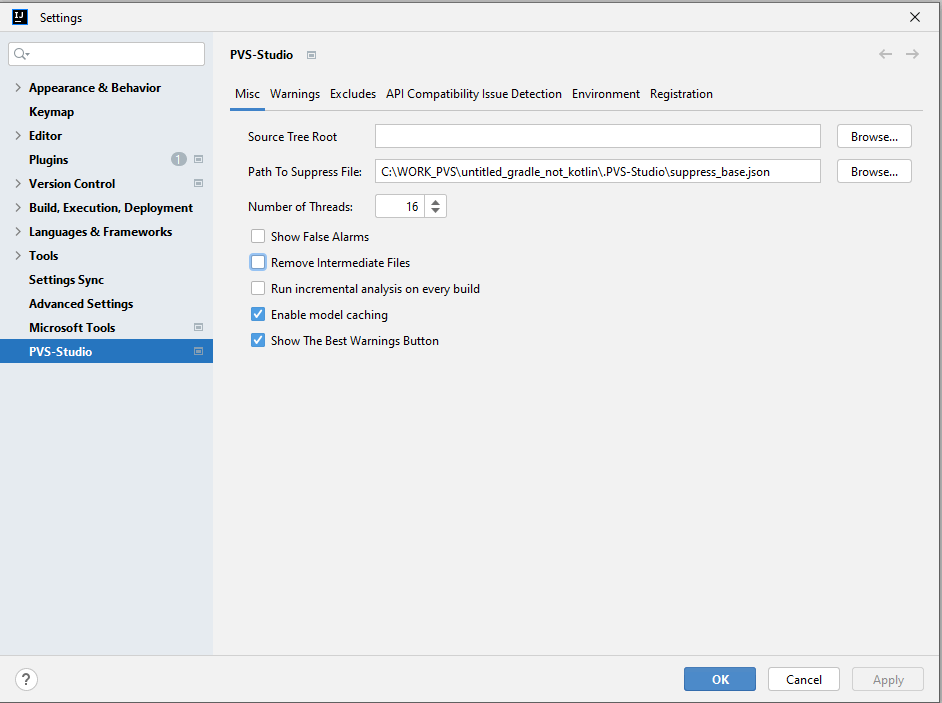
Warnings contains a list of all diagnostic rules supported by the analyzer. If you uncheck diagnostic rules, all warnings of the chosen type will be filtered out of the analyzer output window. During the next analysis run, the corresponding diagnostic rule will not be run (it will not generate any warnings):
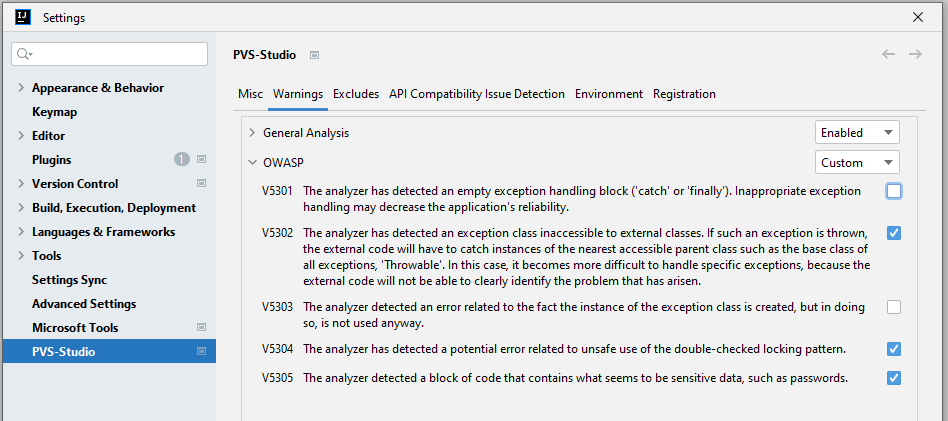
Excludes contains paths for files and directories that should be excluded from the analysis. You can set either an absolute path or a path relative to the root directory of the project:
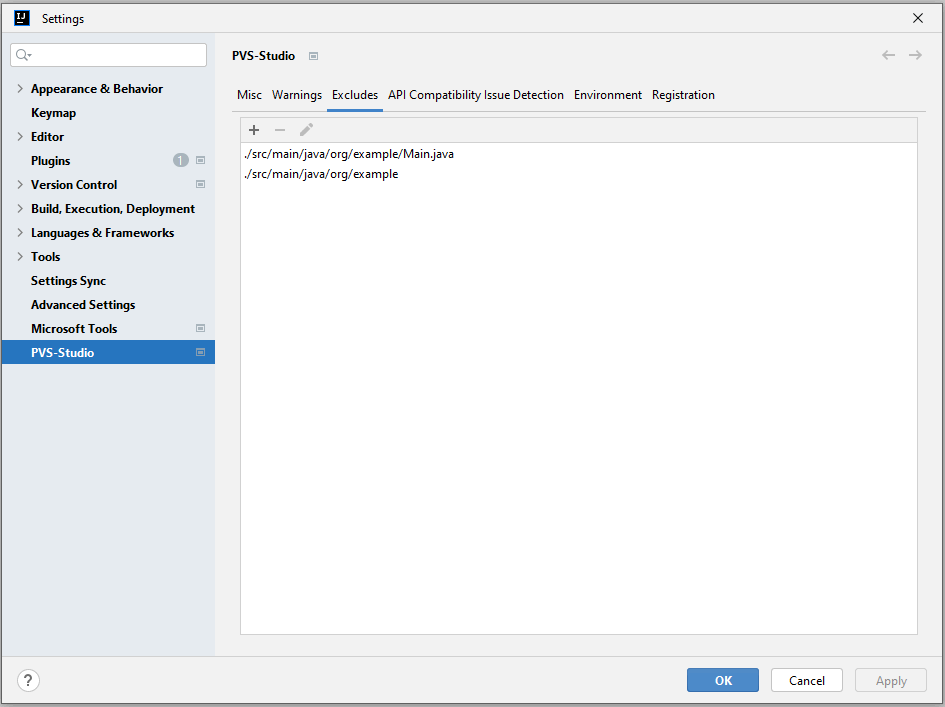
API Compatibility Issue Detection contains settings for the V6078 diagnostic (disabled by default). This diagnostic helps find out if the API JDK, used in your project, will change or disappear in upcoming JDK versions:
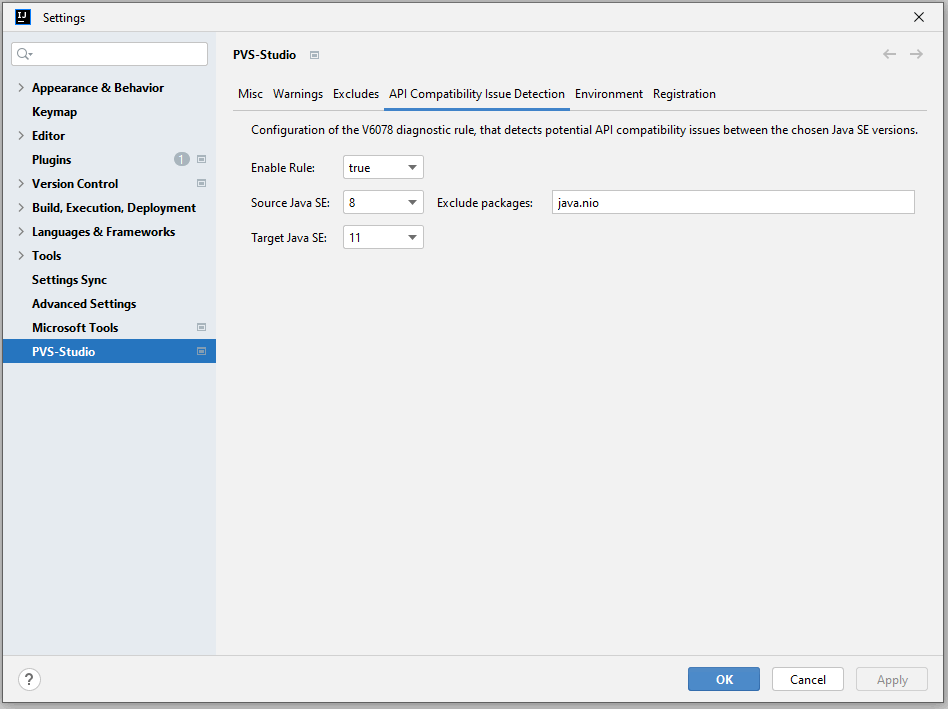
Environment contains settings that the plugin will use to run the Java analyzer core (separate JVM process pvs-studio.jar). The default values of these settings are taken from the global.json file. If you change the settings in this tab, they will be saved in a separate file. This file overrides the settings from global.json when running the analysis. The changed settings have no impact on the global.json file contents:
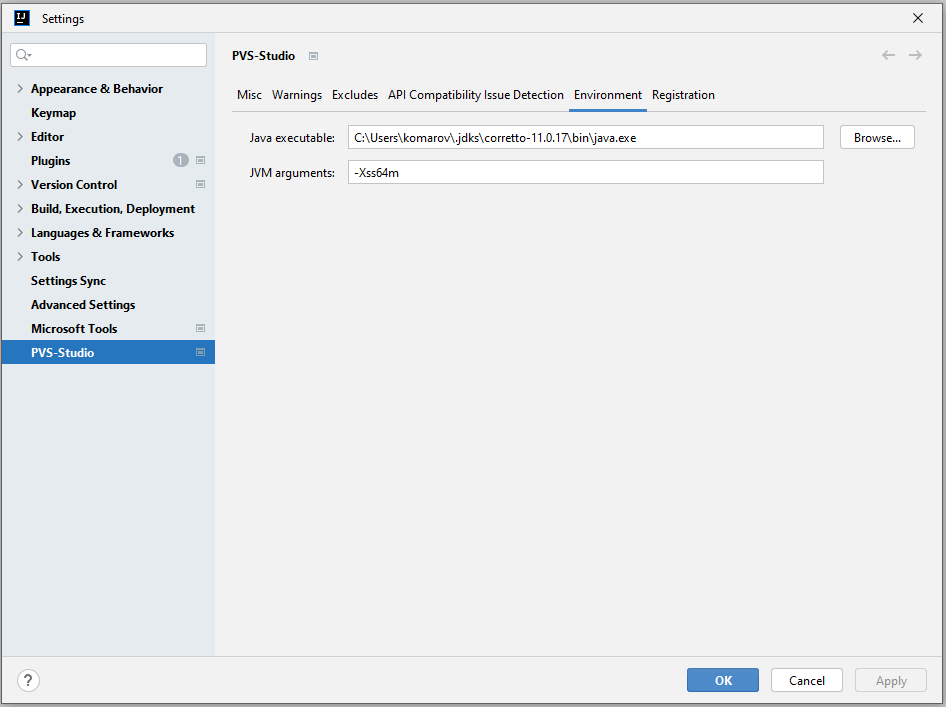
Registration displays information about the current PVS-Studio license in the system. You can also edit the information in this tab and ensure that the entered license is valid.
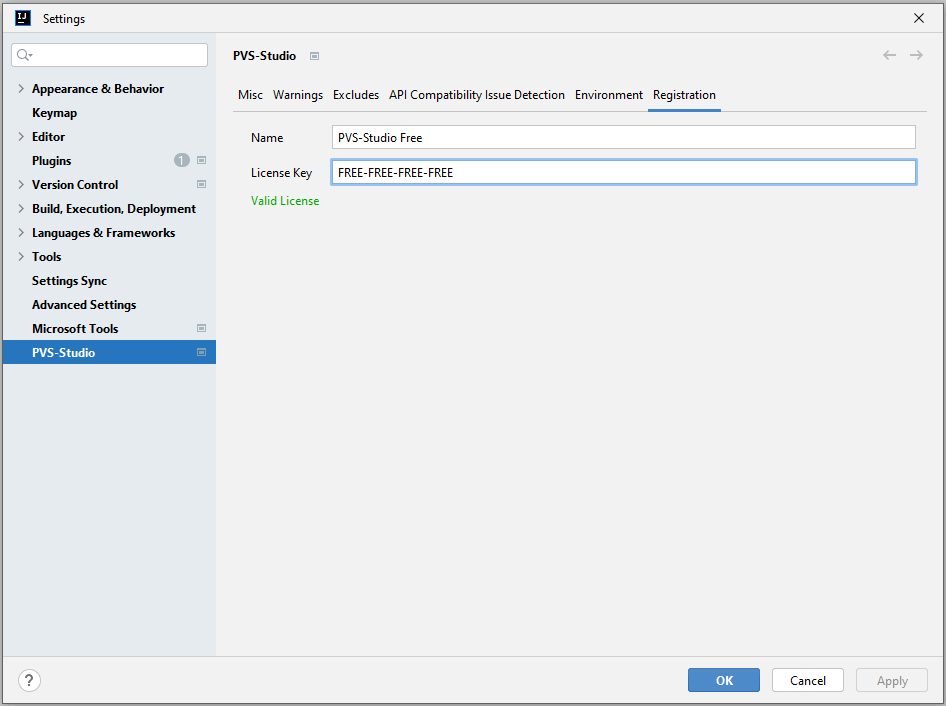
How to change the Java version to run the analyzer
By default, the analyzer runs the core with java from the PATH environment variable. To run the analysis with some other version, you can manually enter it. To do this, open the 'Environment' tab in the plugin settings and enter the path to the java file from the JDK in the 'Java executable' field. The analyzer uses this JDK version (the version of the Java language) during the analysis of project source code:
Checking code with PVS-Studio from IntelliJ IDEA and Android Studio
Before running the analysis, enter a license. To learn how to do this, please consult the documentation.
You can choose to check:
- current project;
- items selected in the 'Project' window;
- file currently opened in IDE.
Please note: when analyzing a project, the plugin starts the Java analyzer core. When the analyzer core is started, it uses the same Java language version as the JDK. The java file from the JDK is used to start the Java analyzer core (the Java executable field on the Environment tab of the plugin settings). If you want to change the Java language version to be used in the analysis, use the java file from the JDK for that version to run the Java analyzer core.
To analyze the current project, you can use 'Tools -> PVS-Studio -> Check Project'.

To analyze a file opened for editing, you can use:
- the 'Tools -> PVS-Studio -> Check Current File' menu item;
- the context menu item of the file;
- the context menu item of the file header in the file editor.

You can also select several items in the 'Explorer' window by holding down CTRL/SHIFT + Left Mouse Click. Then choose the 'Analyze with PVS-Studio' menu item:

In the examples above, we will analyze:
- *.java files (from the com.pvsstudio.formats package);
- the JsonEvaluator file (from the com.pvsstudio.projects package);
- the Main file (from the com.pvsstudio package);
- the Box file from the common module (from the com.pvsstudio package).
Managing analysis results
The analysis results generated by PVS-Studio analyzer will be displayed in the table inside the 'PVS-Studio' window:
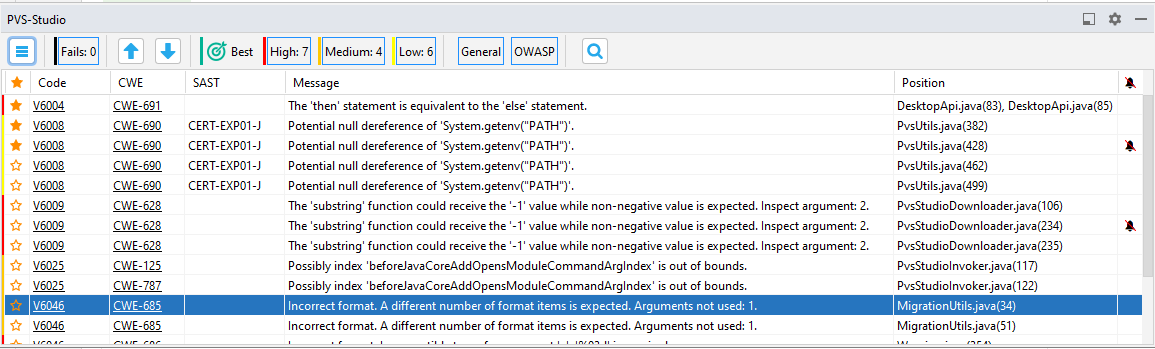
The table consists of 7 columns, arranged from left to right as follows: 'Favorite', 'Code', 'CWE', 'SAST', 'Message', 'Position', and 'False Alarms'. The analyzer messages can be sorted by any column. To change the sorting order, click the column heading. The leftmost 'Favorite' column can be used to bookmark warnings for quick search among marked messages by sorting the messages by the 'Favorite' column.

When you click a warning in the 'Code'/'CWE' columns, a webpage will open in your browser, providing a detailed description of the warning or potential vulnerability. The 'SAST' column indicates the OWASP ASVS code vulnerability identifier for the warning. The 'Message' column gives short descriptions of the warnings. The 'Position' column contains a list of files the warning refers to. The rightmost 'False Alarms' column displays warnings marked as false positives. You can find more details on managing false positives in the relevant section.
Double-click a warning in the table to open the file at the line that triggered the analyzer:
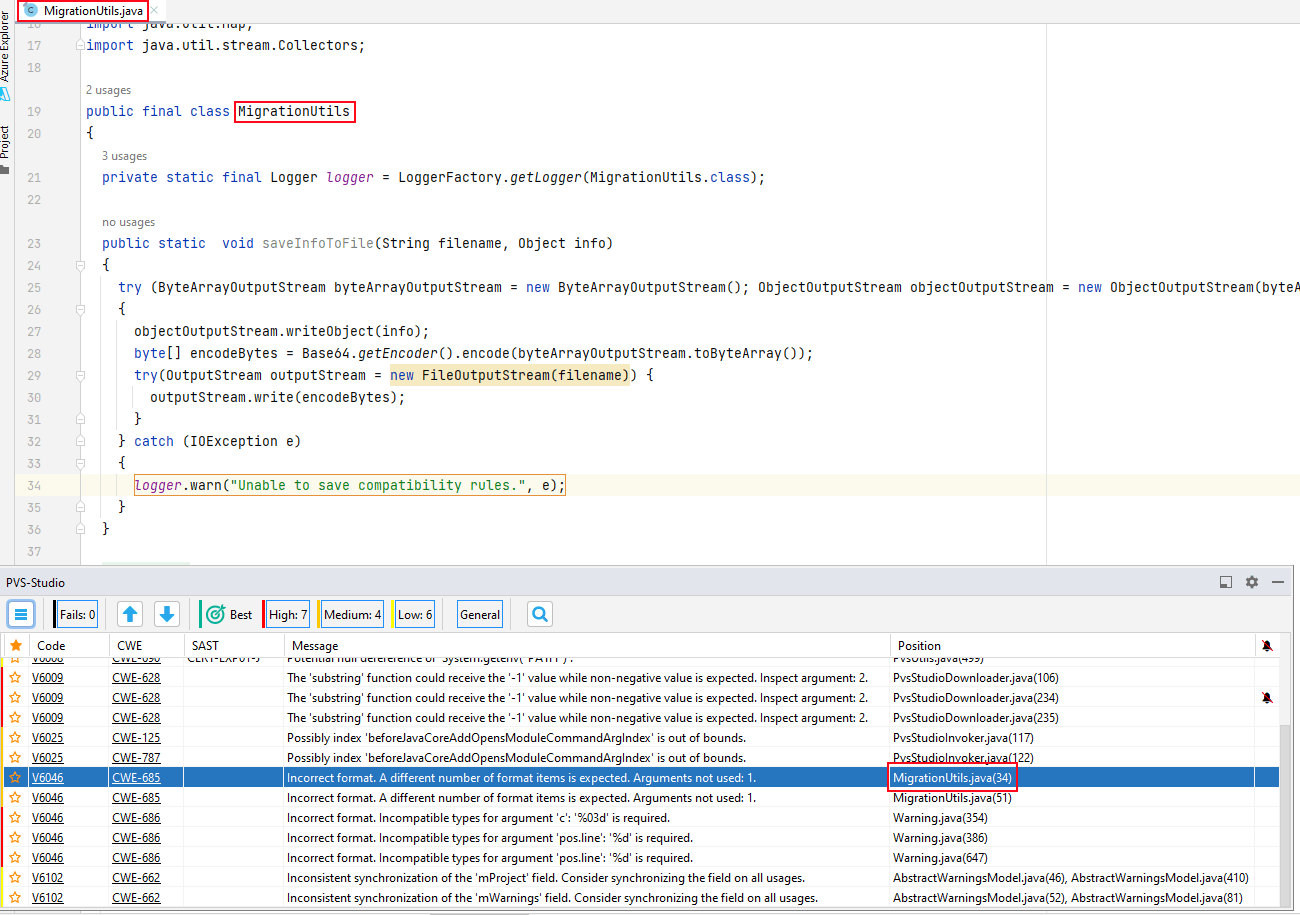
There are also two arrow buttons above the table. You can use them to move between the warnings and open the needed files in the source code editor. To the right of the arrow buttons, you can set filters by level of warnings: High, Medium, Low, and Fails. The 'Fails' filter contains errors of the analyzer itself.
When you click the search icon, an additional panel opens with text fields to search across the 'Code', 'CWE', 'SAST, 'Message', and 'Position' columns. Each field is a string filter which allows you to filter messages by the text you have entered:
Click a hamburger button in the top-left corner above the table to open an additional settings panel:

Click the gear icon to open the plugin settings main window, or click 'Tools -> PVS-Studio -> Settings'.
Viewing the most interesting analyzer warnings
If you are new to the static analysis tool and would like to learn about its capabilities, you can use the Best Warnings mechanism. This mechanism displays the most important and reliable warnings.
To view the most interesting analyzer warnings, click the 'Best' button, as shown in the screenshot below:
When the analysis is complete, you will see ten most critical warnings.
Managing false positives
Sometimes the analyzer may issue a warning for some spot in your code, but you are sure that there is no error in that fragment. Such a warning is called a false positive.
The PVS-Studio plugin allows you to mark the analyzer messages as false positives to prevent them from appearing in future checks.
To mark false positives, select one or more warnings in the 'PVS-Studio' table, right-click any row to open the dropdown menu, and select the 'Mark Selected Messages As False Alarms' menu item:

The analyzer will add a special comment with the '\\-Vxxxx' (xxxx is the PVS-Studio diagnostic number) pattern to the line where the analyzer issues a warning. You can also add such comments manually.
To display warnings previously marked as false positive in the table, click 'Tools -> PVS-Studio -> Settings' and enable the 'Show False Alarms':

Use the 'Remove False Alarm marks from selected messages' menu item in the dropdown menu to unmark selected warnings as false positives.
To learn more how to suppress warnings generated by the analyzer and other ways of suppressing warnings, consult the "Suppression of False Alarms" documentation section.
Suppressing analyzer warnings in legacy code
Lots of warnings in legacy code may pose difficulty to get started with static analysis and use it regularly. Such code is usually well-tested and stable, so you don't need to fix every warning in it. Moreover, if the code base is large, fixing it may take a long time. What's more, warnings issued on legacy code distract you from warnings issued on new code which is still in development.
To solve this problem and quickly start using static analysis regularly, PVS-Studio allows you to "disable" warnings in legacy code. To do that, click 'Tools -> PVS-Studio -> Suppress All Messages' or click the 'Suppress All Messages' button on the PVS-Studio window toolbar. The suppression mechanism bases on the special suppress file. Suppressed messages are added to this file after clicking the 'Suppress All Messages' button. During the next analysis, the warnings added to this suppress file will be excluded from the analyzer report. The suppression mechanism with the suppress file is quite flexible and can "track" suppressed messages even if you modify or move the code fragments for which a suppressed message is generated.
In the IDEA, suppressed messages are added to the suppress file — suppress_base.json. This file is written to the .PVS-Studio directory in the root directory of a project in the IDEA. To restore these warnings in the analyzer report, delete the suppress files linked to the affected projects and restart the analysis.
To learn more about warning suppression and how to handle the suppress files, consult the "Baselining analysis results" documentation section.
You can also read the article: "How to introduce a static code analyzer in a legacy project and not to discourage the team".
Dropdown menu of the warnings table
Right-click a warning in the PVS-Studio window table to open a dropdown menu with additional items to manage selected warnings.
The 'Copy Selected Messages To Clipboard' menu item copies all selected warnings in the window with PVS-Studio plugin report to the clipboard.
The 'Mark Selected Messages As Important' menu item allows you to mark a warning with an asterisk. The asterisk helps easily find it during the sorting by the Favorite column (leftmost column).
Click the 'Mark selected messages as False Alarms / Remove false alarm masks' menu item to mark selected warnings as false positives by adding a special comment to the lines of code they refer to (see the section above on managing false positives).
The 'Add Selected Messages To Suppression File' menu item allows you to suppress the warnings selected in the tab that shows PVS-Studio plugin report. During the next analysis run, these warnings will not be displayed in the window.
The 'Show Columns' menu item opens a list with column names that you can display or hide.
The 'Exclude from analysis' menu item allows to add the full or partial path name of the file. This file contains a warning to the list of folders excluded from analysis. Every file whose path name matches the filter will be excluded from the analysis.
Saving and loading analysis results
Click 'Tools -> PVS-Studio' to save or load results:
The 'Open Report' menu item opens the .json report file and loads its contents into the table in the 'PVS-Studio' output window.
The 'Recent Reports' submenu contains a list of recently opened reports. Click an item on this list to open the report file (if the file still exists at that path) to load its contents into the table in the 'PVS-Studio' window.
Select the 'Save Report' menu item to save all the messages from the table (even the filtered ones) to a .json report file. If the current list of messages has never been saved before, you will be prompted to enter a name and location where to store the report.
Similarly, use the 'Save Report As' menu item to save all the warnings from the table (even the filtered ones) to a .json file and always prompts you to specify the location where to store the report.
The 'Export Report To...' menu item allows to save the analyzer report in different formats (xml, txt, tasks, pvslog, log, html, err). Each format is useful in different situations and utilities.
The 'Export Report To HTML...' menu item allows you to save the analyzer report to a selected folder in HTML format. You can view the warnings directly in the browser and navigate through the source code files in the browser. This command creates a folder named 'fullhtml' containing the analyzer report file (index.html) in the selected folder.
Please note. Instead of the 'Export Report To HTML...' command, it's better to use the PlogConverter (Windows) and plog-converter (Linux and macOS) console utilities. They enable you to convert the analyzer report to more formats (for example, SARIF). The utilities provide additional features: filtering warnings from the report, converting paths in the report from absolute to relative (and vice versa), getting data on the differences between reports, etc.;
Keyboard shortcuts in PVS-Studio for IntelliJ IDEA and Android Studio
The PVS-Studio plugin for IntelliJ IDEA and Android Studio adds the analysis result window. This window has a dropdown menu that appears when you right-click the analysis result window:

Some of these actions have keyboard shortcuts. Thus, you can perform them without using a mouse.
The arrow keys for navigating the analyzer warnings also have shortcuts:
- Move to the next message: Alt + [;
- Move to the previous message: Alt + ].
Using shortcuts is helpful, since they speed up the analysis result processing. You can set and customize the shortcuts in settings: 'File -> Settings -> Keymap'. To find shortcuts faster, enter "PVS-Studio" in the search bar of the 'Keymap' window.
PVS-Studio Java update
If the PVS-Studio update is available, you will get a message in the analysis report.

To update the plugin, open 'File -> Settings -> Plugins', find the 'PVS-Studio for IDEA and Android Studio' plugin in the 'Installed' list, click 'Update', and restart IDE.
Using proxy
If you use proxy, you need to use proxy for downloading the ZIP archive for Java on the Download page. The archive contains the Java analyzer core (a folder named 7.30.80678 in the pvs-studio-java directory). Unpack the Java analyzer core to the standard installation path for the Java analyzer core:
- Windows: %APPDATA%/PVS-Studio-Java;
- Linux and macOS: ~/.config/PVS-Studio-Java.
As a result, a folder with the name of the Java core version, copied from the archive, should appear in the folder at the standard path for installing the analyzer Java core. You should copy the folder from the archive and name it after the version of the Java analyzer core.
Integrating PVS-Studio Java into the Gradle build system
- Integrating the PVS-Studio plugin into Gradle
- Running the analysis
- Running the analysis without network access
- Configuration
- Updating PVS-Studio Java
PVS-Studio Java static analyzer consists of two main components: the core that performs analysis, the plugins for integrating the analyzer into build systems (Maven and Gradle), and IDEs (PVS-Studio for IntelliJ IDEA and Android Studio).
With the plugins, you can:
- run and configure the analyzer in a user-friendly interface;
- deploy the analyzer core in the system;
- collect and transfer the project structure data (the set of source files and the classpath) to the analyzer core.
Integrating the PVS-Studio plugin into Gradle
To integrate the plugin, add the following code to the build.gradle script:
buildscript {
repositories {
mavenCentral()
maven {
url uri('https://files.pvs-studio.com/java/pvsstudio-maven-repository/')
}
}
dependencies {
classpath 'com.pvsstudio:pvsstudio-gradle-plugin:latest.release'
}
}
apply plugin: com.pvsstudio.PvsStudioGradlePlugin
pvsstudio {
outputType = 'text'
outputFile = 'path/to/output.txt'
analysisMode = ['GA', 'OWASP']
}Running the analysis
Before running the analysis, enter the PVS-Studio license. To learn how to do this, please consult the documentation.
To run the analysis, execute the following command:
./gradlew pvsAnalyzePlease note: when analyzing a project, the plugin starts the Java analyzer core. When the analyzer core is started, it uses the same Java language version as the JDK. The java file from the JDK is used to start the Java analyzer core (the javaPath setting). If you want to change the Java language version to be used in the analysis, use the java file from the JDK for that version to run the Java analyzer core.
Running the analysis without network access
For the plugin to work, you need to download its dependencies. If you work with the plugin on a system that does not have network access, create a local repository of the plugin dependencies.
Use this command to download the dependencies and prepare them for offline use:
./gradlew build --refresh-dependenciesRun this command from the directory that contains the build.gradle file (the project root directory). In this case, all the dependencies needed to build and analyze the project will be saved in the default local repository folder: %userprofile%/.gradle/caches/modules-2/files-2.1 on Windows or ~/.gradle/caches/modules-2/files-2.1 on Linux/macOS.
To download the dependencies, you need to have a network connection while running this command. Internet access is no longer required to continue working.
The system must be installed the same Java core version as the plugin. You can learn how to install the Java analyzer core in this documentation.
Using the analyzer in this case is no different from its normal use. To prevent gradle from downloading dependencies use the ‑‑offline flag. This command runs the analysis in offline mode:
./gradlew pvsAnalyze –-offlineConfiguration
The following is a list of analysis settings you can specify in the pvsstudio section of the build.gradle file:
- outputType = "TYPE" — the format of the analyzer report (text, log, json, xml, tasklist, html, fullhtml, errorfile). The default value is json;
- outputFile = "PATH" — the path to the report file where the analysis results are written. The file extension specified in this parameter does not affect the format of the content. The default value is $projectDir/PVS-Studio + the format extension from the outputType setting. To get a report in the fullhtml format, specify the directory where a folder named fullhtml containing the analyzer report file (index.html) will be created. The default value is $projectDir/fullhtml. Please note. Instead of the outputFile setting, it's better to use the PlogConverter (Windows) and plog-converter (Linux and macOS) console utilities. They enable you to convert the analyzer report to more formats (for example, SARIF). The utilities provide additional features: filtering warnings from the report, converting paths in the report from absolute to relative (and vice versa), getting data on the differences between reports, etc.;
- threadsNum = NUMBER — is used to set the number of threads to which the analysis will be parallelized. You can set value for this setting for the whole system in the global.json file. The default value is the number of available processors;
- sourceTreeRoot = "PATH" — the root part of the path that the analyzer uses to generate relative paths in diagnostic messages. By default, PVS-Studio shows absolute paths to the files where the analyzer found errors. With this setting, you can specify the root part of the path (path to the directory). The analyzer will automatically replace it with a special marker. The file path is replaced if it begins with the specified root path. You will be able to use the report with relative paths to view the analysis results in an environment with a different location of source files. For example, in different operating systems. The default value is absent.
- analysisMode = ["GA", ....] — the list of enabled groups of warnings. Available groups: GA (general analysis diagnostics), OWASP (OWASP ASVS compliant diagnostics). enabledWarnings, disabledWarnings, and additionalWarnings have a higher priority than this setting. That is, if a diagnostic group is disabled (or enabled), you can use these settings to enable (or disable) individual diagnostics during analysis. The default value is GA;
- enabledWarnings = ["VXXXX", ....] — the list of enabled diagnostic rules. During the analysis, the analyzer uses only the diagnostics that are specified in this list. If the value is absent, all diagnostics are enabled unless a value is specified for disabledWarnings. The priority of the enabledWarnings setting is lower than disabledWarnings and additionalWarnings but higher than analysisMode. The default value is absent.
- disabledWarnings = ["VXXXX", ....] — the list of disabled diagnostics. The diagnostics listed in this list are disabled during the analysis. If this setting is disabled, all diagnostics are enabled unless analyzeOnly or analyzeOnlyList is set. The priority of the disabledWarnings setting is higher than enabledWarnings and analysisMode but lower than additionalWarnings. The default value is absent.
- additionalWarnings = ["VXXXX", ....] — the list of diagnostic rules to be included in analysis, which are enabled by default. If a diagnostic is added to this list, its co-presence in the enabledWarnings and disabledWarnings lists is ignored. In addition, you can enable the diagnostic rule even if the diagnostic group to which it belongs is disabled (i.e. analysisMode does not contain this group). The additionalWarnings setting has a higher priority than the enabledWarnings, disabledWarnings, and analysisMode settings. The default value is absent.
- exclude = ["PATH", ....] — the list of files and/or directories to be excluded from the analysis (absolute or relative paths are expanded relative to the project root directory). If this setting is disabled, all files are analyzed unless the analyzeOnly or analyzeOnlyList setting is enabled. The exclude setting has a higher priority than the analyzeOnly and analyzeOnlyList settings. The default value is absent.
- analyzeOnly = ["PATH", ....] — the list of files and/or directories to be analyzed (absolute or relative paths that are expanded relative to the project root directory). You can also write these paths to a file line-by-line and pass the path to that file to the analyzeOnlyList setting. If this setting is disabled, all files will be analyzed unless the exclude or analyzeOnlyList setting is enabled. The analyzeOnly setting has a lower priority than the exclude setting. Files and/or directories passed in this setting are merged into a common list with files and/or directories from the analyzeOnlyList setting. The default value is absent.
- analyzeOnlyList = "PATH" — the path to the text file which contains the list of paths to files/directories to be analyzed (each entry must be on a separate line). Relative (will be expanded relative to the project root directory) and absolute paths are supported. If this setting is disabled, all files will be analyzed unless the exclude or analyzeOnly setting is enabled. The analyzeOnlyList setting has a lower priority than the exclude setting. Files and/or directories read from the file specified in this setting are merged into a common list with files and/or directories from the analyzeOnlyList setting. The default value is absent.
- suppressBase = "PATH" — the path to the suppress file which contains suppressed warnings of the analyzer. Warnings from the suppress file will not be included in the report in any subsequent project checks. You can add analyzer messages to a suppress file from the interface of PVS-Studio plugin for IntelliJ IDEA and Android Studio. You can also use the pvsSuppress task from the pvsstudio-gradle-plugin plugin. The default value is $projectDir/.PVS-Studio/suppress_base.json;
- failOnWarnings = BOOLEAN — the flag used to terminate the pvsAnalyze task with a failure if the analyzer has issued a warning. The flag allows you to monitor analyzer warnings in the analyzer report. Such behavior can be useful when you integrate the analyzer into CI/CD. The default value is false;
- incremental = BOOLEAN — the flag used to enable incremental analysis. In this mode, the analyzer checks only modified files. The default value is false;
- forceRebuild = BOOLEAN — the flag used to force rebuild the entire cached metamodel of a program. The metamodel contains information about the program structure and data types. Rebuilding the project metamodel can be necessary when the analyzer version is updated or if the project metamodel is corrupted. When this setting is used, the incremental analysis mode is disabled (the incremental setting). The default value is false;
- disableCache = BOOLEAN — the flag used to disable caching of the program metamodel. When the cache is disabled, the project model is not cached and is rebuilt each time. This flag can be useful when identifying the causes of analyzer errors. Disabling project metamodel caching also disables the incremental analysis (the incremental setting). The default value is false;
- timeout = NUMBER — the timeout for analyzing a file (in minutes). It enables you to increase or decrease the maximum amount of time taken to analyze one file. You can set value for this setting for the whole system in the global.json file. The default value is 10;
- javaPath = "PATH" — specifies the path to the Java interpreter used to start the analyzer core. You can set value for this setting for the whole system in the global.json file. The source code files are analyzed using the Java language version corresponding to the JDK build which path is set in this parameter. By default, PVS-Studio uses the path from the PATH environment variable;
- jvmArguments = ["FLAG", ....] — additional JVM flags used to execute the analyzer core. This flag enables you to configure the JVM that runs the Java analyzer core. You can set value for this setting for the whole system in the global.json file. The default value is ["-Xss64m"];
- compatibility = BOOLEAN — the flag that enables the V6078 diagnostic rule that detects potential API compatibility issues between the selected Java SE versions. The V6078 diagnostic ensures that the JDK API you are using will not be modified or will not disappear in future versions of the JDK. The default value is false;
- sourceJava = NUMBER — the Java SE version that your application is developed on. This setting is used by the V6078 diagnostic rule if the 'compatibility' setting is enabled. The minimum value is 8. The maximum value is 14;
- targetJava = NUMBER — the Java SE version to be checked for compatibility with the API used in your application (sourceJava). This setting is used by the V6078 diagnostic rule if the compatibility setting is enabled. The minimum value is 8. The maximum value is 14;
- excludePackages = ["PACK", ....] — packages to be excluded from the compatibility analysis (the V6078 diagnostic). The V6078 diagnostic rule uses this setting if compatibility is enabled. The default value is absent.
You can define the analyzer settings via the command line when running the analysis. The definition format:
-Ppvsstudio.<nameSingleParam>=value
-Ppvsstudio.<nameMultipleParam>=value1;value2;value3Example:
./gradlew pvsAnalyze -Ppvsstudio.outputType=text
-Ppvsstudio.outputFile=path/to/output.txt
-Ppvsstudio.disabledWarnings=V6001;V6002;V6003Please note that parameters explicitly passed via the command line have the highest priority.
How to change the Java version to run the analyzer
By default, the analyzer starts the core with java from the PATH environment variable. If you need to run the analysis with some other version, you can set it manually. To do this, specify the path to java from the JDK in the javaPath analyzer setting. The version of this JDK (version of Java language) will be used when analyzing the source code of the project:
....
javaPath = "C:/Program Files/Java/jdk19.0.5/bin/java"
....Updating PVS-Studio Java
By using latest.release as the plugin version in the build.gradle file, you will always have the latest version of PVS-Studio for analysis.
Using a proxy
When using a proxy, it is necessary to enter your login and password to correctly load the analyzer core.
To do this, you can use the following arguments:
- -Dhttp.proxyUser, -Dhttp.proxyPassword
- -Dhttps.proxyUser, -Dhttps.proxyPassword
- -Djava.net.socks.username, -Djava.net.socks.password
- -Dftp.proxyUser, -Dftp.proxyPassword
You can use this command to run the analysis via the plugin for Gradle that uses a proxy:
./gradlew pvsAnalyze "-Dhttp.proxyUser=USER" "-Dhttp.proxyPassword=PASS"Integrating PVS-Studio Java into the Maven build system
- Integrating the PVS-Studio plugin into Maven
- Running the analysis
- Running the analysis without network access
- Configuration
- Updating PVS-Studio Java
PVS-Studio Java static analyzer consists of two main components: the core that performs analysis, the plugins for integrating the analyzer into build systems (Maven and Gradle), and IDEs (PVS-Studio for IntelliJ IDEA and Android Studio).
With the plugins, you can:
- run and configure the analyzer in a user-friendly interface;
- deploy the analyzer core in the system;
- collect and transfer the project structure data (the set of source files and the classpath) to the analyzer core.
Integrating the PVS-Studio plugin into Maven
To integrate the plugin, add the following code to the pom.xml file:
<pluginRepositories>
<pluginRepository>
<id>pvsstudio-maven-repo</id>
<url>https://files.pvs-studio.com/java/pvsstudio-maven-repository/</url>
</pluginRepository>
</pluginRepositories>
<build>
<plugins>
<plugin>
<groupId>com.pvsstudio</groupId>
<artifactId>pvsstudio-maven-plugin</artifactId>
<version>7.30.80678</version>
<configuration>
<analyzer>
<outputType>text</outputType>
<outputFile>path/to/output.txt</outputFile>
<analysisMode>GA,OWASP</analysisMode>
</analyzer>
</configuration>
</plugin>
</plugins>
</build>Running the analysis
Before running the analysis, enter the PVS-Studio license. To learn how to do this, please consult the documentation.
To run the analysis, execute the following command:
mvn pvsstudio:pvsAnalyzeIn addition, you can incorporate the analysis into the project build cycle by adding the <execution> element:
<plugin>
<groupId>com.pvsstudio</groupId>
<artifactId>pvsstudio-maven-plugin</artifactId>
<version>7.30.80678</version>
<executions>
<execution>
<phase>compile</phase>
<goals>
<goal>pvsAnalyze</goal>
</goals>
</execution>
</executions>
</plugin>Please note: when analyzing a project, the plugin starts the Java analyzer core. When the analyzer core is started, it uses the same Java language version as the JDK. The java file from the JDK is used to start the Java analyzer core (the <javaPath> plugin setting). If you want to change the Java language version to be used in the analysis, use the java file from the JDK for that version to run the Java analyzer core.
Running the analysis without network access
For the plugin to work, you need to download its dependencies. If you work with the plugin on a system that does not have network access, create a local repository of the plugin dependencies. To do that, you may use maven-dependency-plugin.
Use this command to download the dependencies and prepare them for offline use:
mvn dependency:go-offlineRun this command from the directory that contains the pom.xml file (the project root directory). In this case, all the dependencies needed to build and analyze the project will be saved in the default local repository folder: %userprofile%/.m2/repository on Windows or ~/.m2/repository on Linux/macOS.
To save the offline repository to a different folder, use the maven.repo.local parameter. In this case, the command would look like as follows:
mvn dependency:go-offline -Dmaven.repo.local=/custom/pathTo download the dependencies, you need to have a network connection while running this command. Internet access is no longer required to continue working.
The system must be installed the same Java core version as the plugin. You can learn how to install the Java analyzer core in this documentation.
Using the analyzer in this case is no different from its normal use. To prevent maven from downloading dependencies use the ‑‑offline(-o) flag. An example of a command to run an offline analysis using a user local repository:
mvn -o pvsstudio:pvsAnalyze -Dmaven.repo.local=/custom/pathConfiguration
The <analyzer> block is used to configure the analyzer. The following is a list of analysis settings.
- <outputType>TYPE</outputType> — the format of the analyzer report (text, log, json, xml, tasklist, html, fullhtml, errorfile). The default value is json;
- <outputFile>PATH</outputFile> — the path to the report file where the analysis results are written. The file extension specified in this parameter does not affect the format of the content. The default value is ${basedir}/PVS-Studio + the format extension from the <outputType> setting. To get a report in the fullhtml format, specify the directory where a folder named fullhtml containing the analyzer report file (index.html) will be created. The default value is ${basedir}/fullhtml. Please note. Instead of the <outputFile> setting, it's better to use the PlogConverter (Windows) and plog-converter (Linux and macOS) console utilities. They enable you to convert the analyzer report to more formats (for example, SARIF). The utilities provide additional features: filtering warnings from the report, converting paths in the report from absolute to relative (and vice versa), getting data on the differences between reports, etc.;
- <threadsNum>NUMBER</threadsNum> — is used to set the number of threads to which the analysis will be parallelized. You can set value for this setting for the whole system in the global.json file. The default value is the number of available processors;
- <sourceTreeRoot>PATH</sourceTreeRoot> — the root part of the path that the analyzer uses to generate relative paths in diagnostic messages. By default, PVS-Studio shows absolute paths to the files where the analyzer found errors. With this setting, you can specify the root part of the path (path to the directory). The analyzer will automatically replace it with a special marker. The file path is replaced if it begins with the specified root path. You will be able to use the report with relative paths to view the analysis results in an environment with a different location of source files. For example, in different operating systems. The default value is absent;
- <analysisMode>GA, ....</analysisMode> — the list of enabled groups of warnings. Available groups: GA (general analysis diagnostics), OWASP (OWASP ASVS compliant diagnostics). <enabledWarnings>, <disabledWarnings>, and <additionalWarnings> have a higher priority than the <analysisMode> setting. That is, if a diagnostic group is disabled (or enabled), you can use these settings to enable (or disable) individual diagnostics during analysis. The default value is GA;
- <enabledWarnings>VXXXX, ....</enabledWarnings> — the list of enabled diagnostic rules. During the analysis, the analyzer uses only the diagnostics that are specified in this list. If the value is absent, all diagnostics are enabled unless a value is specified for <disabledWarnings>. The priority of the <enabledWarnings> setting is lower than <disabledWarnings> and <additionalWarnings> but higher than <analysisMode>. The default value is absent.
- <disabledWarnings>VXXXX, ....</disabledWarnings> — the list of disabled diagnostics. The diagnostics listed in this list are disabled during the analysis. If this setting is disabled, all diagnostics are enabled unless the <enabledWarnings> setting is set. The priority of the <disabledWarnings> setting is higher than <enabledWarnings> and <analysisMode> but lower than <additionalWarnings>. The default value is absent;
- <additionalWarnings>VXXXX, ....</additionalWarnings> — the list of diagnostic rules to be included in analysis, which are enabled by default. If a diagnostic is added to this list, its co-presence in the <enabledWarnings> and <disabledWarnings> lists is ignored. In addition, you can enable the diagnostic rule even if the diagnostic group to which it belongs is disabled (i.e. <analysisMode> does not contain this group). The <additionalWarnings> setting has a higher priority than the <enabledWarnings>, <disabledWarnings>, and <analysisMode> settings. The default value is absent;
- <exclude>PATH, ....</exclude> — the list of files and/or directories to be excluded from the analysis (absolute or relative paths are expanded relative to the project root directory). If this setting is disabled, all files are analyzed unless the <analyzeOnly> or <analyzeOnlyList> setting is enabled. The <exclude> setting has a higher priority than the <analyzeOnly> and <analyzeOnlyList> settings. The default value is absent;
- <analyzeOnly>PATH, ...</analyzeOnly> — the list of files and/or directories to be analyzed (absolute or relative paths that are expanded relative to the project root directory). You can also write these paths to a file line-by-line and pass the path to that file to the <analyzeOnlyList> setting. If this setting is disabled, all files will be analyzed unless the <exclude> or <analyzeOnlyList> setting is enabled. The <analyzeOnly> setting has a lower priority than the <exclude> setting. Files and/or directories passed in this setting are merged into a common list with files and/or directories from the <analyzeOnlyList> setting. The default value is absent;
- <analyzeOnlyList>PATH</analyzeOnlyList> — the analog of the <analyzeOnly> setting. The path to the text file which contains the list of paths to files/directories to be analyzed (each entry must be on a separate line). Relative (will be expanded relative to the project root directory) and absolute paths are supported. If this setting is disabled, all files will be analyzed unless the <exclude> or <analyzeOnly> setting is enabled. The <analyzeOnlyList> setting has a lower priority than the <exclude> setting. Files and/or directories read from the file specified in this setting are merged into a common list with files and/or directories from the <analyzeOnly> setting. The default value is absent;
- <suppressBase>PATH</suppressBase> — the path to the suppress file which contains suppressed warnings of the analyzer. Warnings from the suppress file will not be included in the report in any subsequent project checks. You can add analyzer messages to a suppress file from the interface of PVS-Studio plugin for IntelliJ IDEA and Android Studio. You can also use the pvsstudio:pvsSuppress task from the pvsstudio-maven-plugin. The default value is ${basedir}/.PVS-Studio/suppress_base.json;
- <failOnWarnings>BOOLEAN</failOnWarnings> — the flag used to terminate the pvsstudio:pvsAnalyze task with a failure if the analyzer has issued a warning. The flag allows you to monitor analyzer warnings in the analyzer report. Such behavior can be useful when you integrate the analyzer into CI/CD. The default value is false;
- <incremental>BOOLEAN</incremental> — the flag used to enable incremental analysis. In this mode, the analyzer checks only modified files. The default value is false;
- <forceRebuild>BOOLEAN</forceRebuild> — the flag used to force rebuild the entire cached metamodel of a program. The metamodel contains information about the program structure and data types. Rebuilding the project metamodel can be necessary when the analyzer version is updated or if the project metamodel is corrupted. When this setting is used, the incremental analysis mode is disabled (the <incremental> setting). The default value is false;
- <disableCache>BOOLEAN</disableCache> — the flag used to disable caching of the program metamodel. When the cache is disabled, the project model is not cached and is rebuilt each time. This flag can be useful when identifying the causes of analyzer errors. Disabling project metamodel caching also disables the incremental analysis (the <incremental> setting). The default value is false;
- <timeout>NUMBER</timeout> — the timeout for analyzing a file (in minutes). It enables you to increase or decrease the maximum amount of time taken to analyze one file. You can set value for this setting for the whole system in the global.json file. The default value is 10;
- <javaPath>PATH</javaPath> — specifies the path to the Java interpreter used to start the analyzer core. You can set value for this setting for the whole system in the global.json file. The source code files are analyzed using the Java language version corresponding to the JDK build which path is set in this parameter. By default, PVS-Studio uses the path from the PATH environment variable;
- <jvmArguments>FLAG, ....</jvmArguments> — additional JVM flags used to execute the analyzer core. This flag enables you to configure the JVM that runs the Java analyzer core. You can set value for this setting for the whole system in the global.json file. The default value is["-Xss64m"];
- <compatibility>BOOLEAN</compatibility> — the flag that enables the V6078 diagnostic rule that detects potential API compatibility issues between the selected Java SE versions. The V6078 diagnostic ensures that the JDK API you are using will not be modified or will not disappear in future versions of the JDK. The default value is false;
- <sourceJava>NUMBER</sourceJava> — the Java SE version that your application is developed on. This setting is used by the V6078 diagnostic rule if the <compatibility> setting is enabled. The minimum value is 8. The maximum value is 14;
- <targetJava>NUMBER</targetJava> — the Java SE version to be checked for compatibility with the API used in your application (<sourceJava>). This setting is used by the V6078 diagnostic rule if the <compatibility> setting is enabled. The minimum value is 8. The maximum value is 14;
- <excludePackages>"PACK", ....</excludePackages> — packages to be excluded from the compatibility analysis (the V6078 diagnostic). The V6078 diagnostic rule uses this setting if <compatibility> is enabled. The default value is absent.
You can define the analyzer settings via the command line when running the analysis. The definition format:
-Dpvsstudio.<nameSingleParam>=value
-Dpvsstudio.<nameMultipleParam>=value1;value2;value3Example:
mvn pvsstudio:pvsAnalyze -Dpvsstudio.outputType=text
-Dpvsstudio.outputFile=path/to/output.txt
-Dpvsstudio.disabledWarnings=V6001;V6002;V6003Please note that parameters explicitly passed via the command line have the highest priority.
How to change the Java version to run the analyzer
By default, the analyzer starts the core with java from the PATH environment variable. If you need to run the analysis with some other version, you can set it manually. To do this, specify the path to java from the JDK in the <javaPath> analyzer setting. The version of this JDK (version of Java language) will be used when analyzing the source code of the project:
....
<javaPath>C:/Program Files/Java/jdk19.0.5/bin/java</javaPath>
....Updating PVS-Studio Java
To update pvsstudio-maven-plugin, change the version of the plugin in the pom.xml file.
Using a proxy
When using a proxy, it is necessary to enter your login and password to correctly load the analyzer core.
To do this, you can use the following arguments:
- -Dhttp.proxyUser, -Dhttp.proxyPassword
- -Dhttps.proxyUser, -Dhttps.proxyPassword
- -Djava.net.socks.username, -Djava.net.socks.password
- -Dftp.proxyUser, -Dftp.proxyPassword
You can use this command to run the analysis via the plugin for Maven that uses a proxy:
mvn pvsstudio:pvsAnalyze "-Dhttp.proxyUser=USER" "-Dhttp.proxyPassword=PASS"Getting acquainted with the PVS-Studio static code analyzer on Windows
- Pros of using a static analyzer
- A brief overview PVS-Studio's capabilities
- System requirements and installation of PVS-Studio
- The basics of using PVS-Studio
- Work with a list of diagnostic messages
- Is it necessary to fix all the potential errors the analyzer informs about?
PVS-Studio is a static analyzer for C, C++, C# and Java code designed to assist programmers in searching for and fixing a number of software errors of different patterns. The analyzer can be used in Windows, Linux and macOS.
Working under Windows, the analyzer integrates into Visual Studio as a plugin, providing a convenient user interface for easy code navigation and error search. There is also a C and C++ Compiler Monitoring UI (Standalone.exe) available which is used independently of Visual Studio and allows analyzing files compiled with, besides Visual C++, such compilers as GCC (MinGW) and Clang. Command line utility PVS-Studio_Cmd.exe will allow to perform analysis of MSBuild / Visual Studio projects without a run of IDE or Compiler Monitoring UI, that will let, for instance, use the analyzer as a part of CI process.
PVS-Studio for Linux is a console application.
This document describes the basics of using PVS-Studio on Windows. To get information about working in Linux environment refer to articles "Installing and updating PVS-Studio on Linux" and "How to run PVS-Studio on Linux and macOS".
Pros of using a static analyzer
A static analyzer does not substitute other bug searching tools - it just complements them. Integrating a static analysis tool with the development process helps to eliminate plenty of errors at the moment when they are only "born", thus saving your time and resources on their subsequent elimination. As everyone knows, the earlier a bug is found, the easier it is to fix it. What follows from this is the idea that a static analyzer should be used regularly, for it is the only best way to get most of it.
A brief overview PVS-Studio's capabilities
Warning levels and diagnostic rule sets
PVS-Studio divides all the warnings into 3 levels of certainty: High, Medium and Low. Some warnings refer to a special Fails category. Let's consider these levels in more detail:
- High(1) - warnings with the maximum level of certainty. Such warnings often indicate errors, requiring immediate correction.
- Medium(2) - errors with lower degree of certainty, which are still worth paying attention to.
- Low(3) - warnings with a minimum level of certainty, pointing to minor flaws in the code. Warnings of this level usually have a high percentage of false positives.
- Fails - internal warnings of the analyzer informing of some problems during the work. These are warnings of the analyzer errors (for example, messages V001, V003 ans so on) and any unprocessed output of utilities, used by the analyzer itself during the analysis (a preprocessor, a command preprocessor cmd), displayed in stdout/stderr. For example, Fails messages can be the message of a preprocessor about preprocessing errors of the source code, errors of access to files (a file doesn't exist, or it is blocked by an anti-virus) and so on.
It should be borne in mind that a certain code of the error does not necessarily bind it to a particular level of certainty, and the distribution across the levels highly depends on the context, where they were generated. The output window of diagnostic messages in the plugin for Microsoft Visual Studio and the Compiler Monitoring UI has buttons of the levels, allowing to sort the warnings as needed.
You can make your work with the analyzer report even easier by using a mechanism that displays the most interesting warnings.
The analyzer has 5 types of diagnostic rules:
- General (GA) - General Analysis diagnostics. This is the main set of diagnostic rules in PVS-Studio.
- Optimization (OP) - Diagnostics of micro-optimization. These are tips concerning the improvement of efficiency and safety of the code.
- 64-bit (64) - diagnostics, allowing to detect specific errors, related to the development of 64-bit applications and migrating the code from a 32-bit platform to a 64-bit one.
- Customers' Specific (CS) - highly specialized diagnostics, developed by user requests. By default, this set of diagnostics is disabled.
- MISRA - a set of diagnostics, developed according to the MISRA standard (Motor Industry Software Reliability Association). This set of diagnostics is disabled by default.
Short description of the diagnostic groups (GA, OP, 64, CS, MISRA) with the numbers of certainty levels (1, 2, 3) are used for the shorthand notation, for example in the command line parameters. Example: GA: 1,2.
Switching a certain group of diagnostics rules set shows or hides the corresponding messages.

You may find the detailed list of diagnostic rules in the corresponding section of the documentation.
Analyzer messages can be grouped and filtered by various criteria To get more detailed information about a work with a list of analyzer warnings, please, refer to the article "Handling the diagnostic messages list".
PVS-Studio and Microsoft Visual Studio
When installing PVS-Studio, you can choose which versions of the Microsoft Visual Studio IDE the analyzer should integrate with.
After deciding on all the necessary options and completing the setup, PVS-Studio will integrate into the IDE's menu. In the figure, you can see that the corresponding command has appeared in Visual Studio's menu, as well as the message output window.

In the settings menu, you can customize PVS-Studio as you need to make it most convenient to work with. For example, it provides the following options:
- Preprocessor selection;
- Exclusion of files and folders from analysis;
- Selection of the diagnostic message types to be displayed during the analysis;
- Plenty of other settings.
Most likely, you won't need any of those at your first encounter with PVS-Studio, but later, they will help you optimize your work with the tool.
The detailed description of the plugin features for the Visual Studio you can find in the documentation section "Get started with PVS-Studio in Visual Studio".
PVS-Studio and IntelliJ IDEA
When installing the analyzer, it is possible to integrate the PVS-Studio plugin into the IntelliJ IDEA, which allows performing the analysis and handling analyzer reports right from the IDE.
After the installation, the plugin will be available in the menu 'Tools' ('Tools' > 'PVS-Studio'). The screenshot of IntelliJ IDEA with integrated PVS-Studio plugin is given below.
In the settings menu, is possible the disable diagnostic rules, exclude files / directories from the analysis, etc.
The documentation section "Direct use of Java analyzer from command line" describes operating features of the Java analyzer. It also provides alternative installation options, including installation of plugins for Maven, Gradle.
PVS-Studio and JetBrains Rider
When installing the analyzer, it is possible to integrate the PVS-Studio plugin into the JetBrains Rider, which allows performing the analysis and handling analyzer reports right from the IDE.
The plugin is available in the 'Tools' menu after its installation. Current solution / project analysis can be done the following way: 'Tools' > 'PVS-Studio' > 'Check Current Solution/Project'.
The screenshot of JetBrains Rider with integrated PVS-Studio plugin is given below.
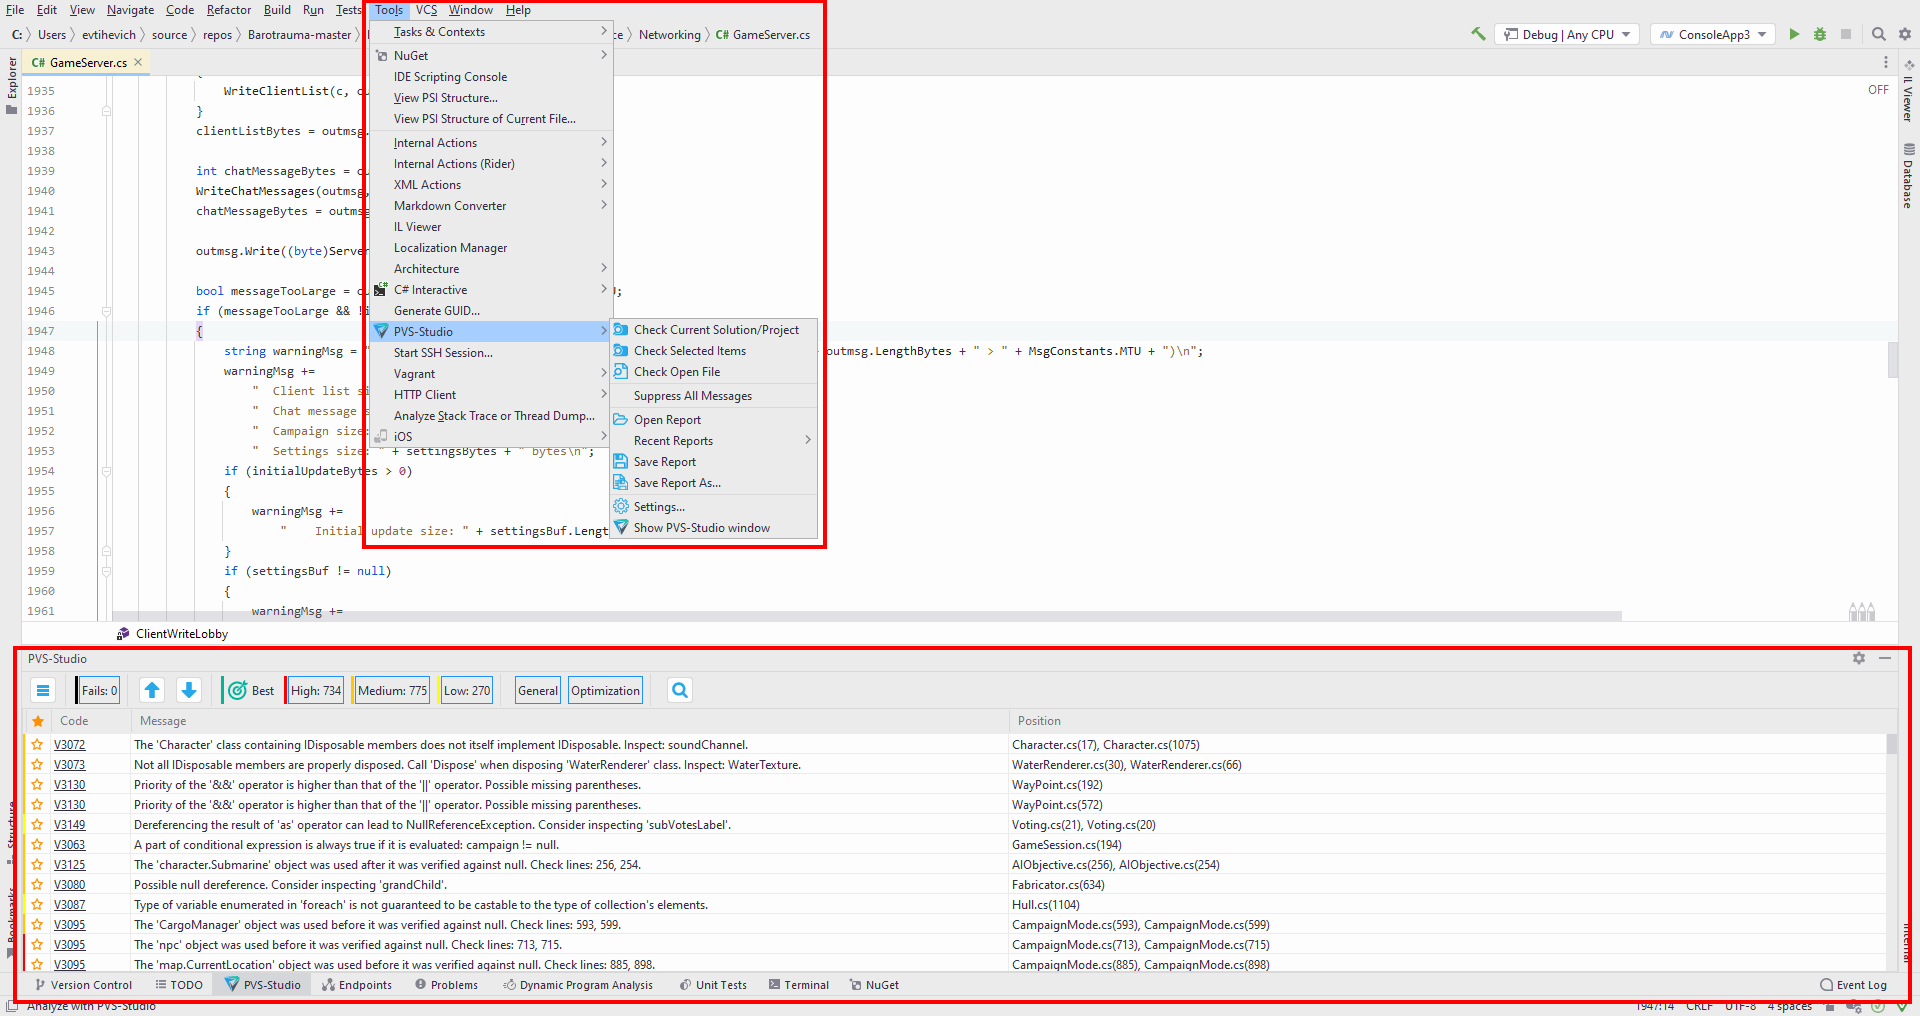
You can learn more about PVS-Studio plugin for IDE JetBrains Rider in the following documentation section: "Using PVS-Studio with JetBrains Rider".
C and C++ Compiler Monitoring UI (Standalone.exe)
PVS-Studio can be used independently of the Microsoft Visual Studio IDE. The Compiler Monitoring UI allows analyzing projects while building them. It also supports code navigation through clicking on the diagnostic messages, and search for code fragments and definitions of macros and data types. To learn more about how to work with the Compiler Monitoring UI, see the article "Viewing analysis results with C and C++ Compiler Monitoring UI".
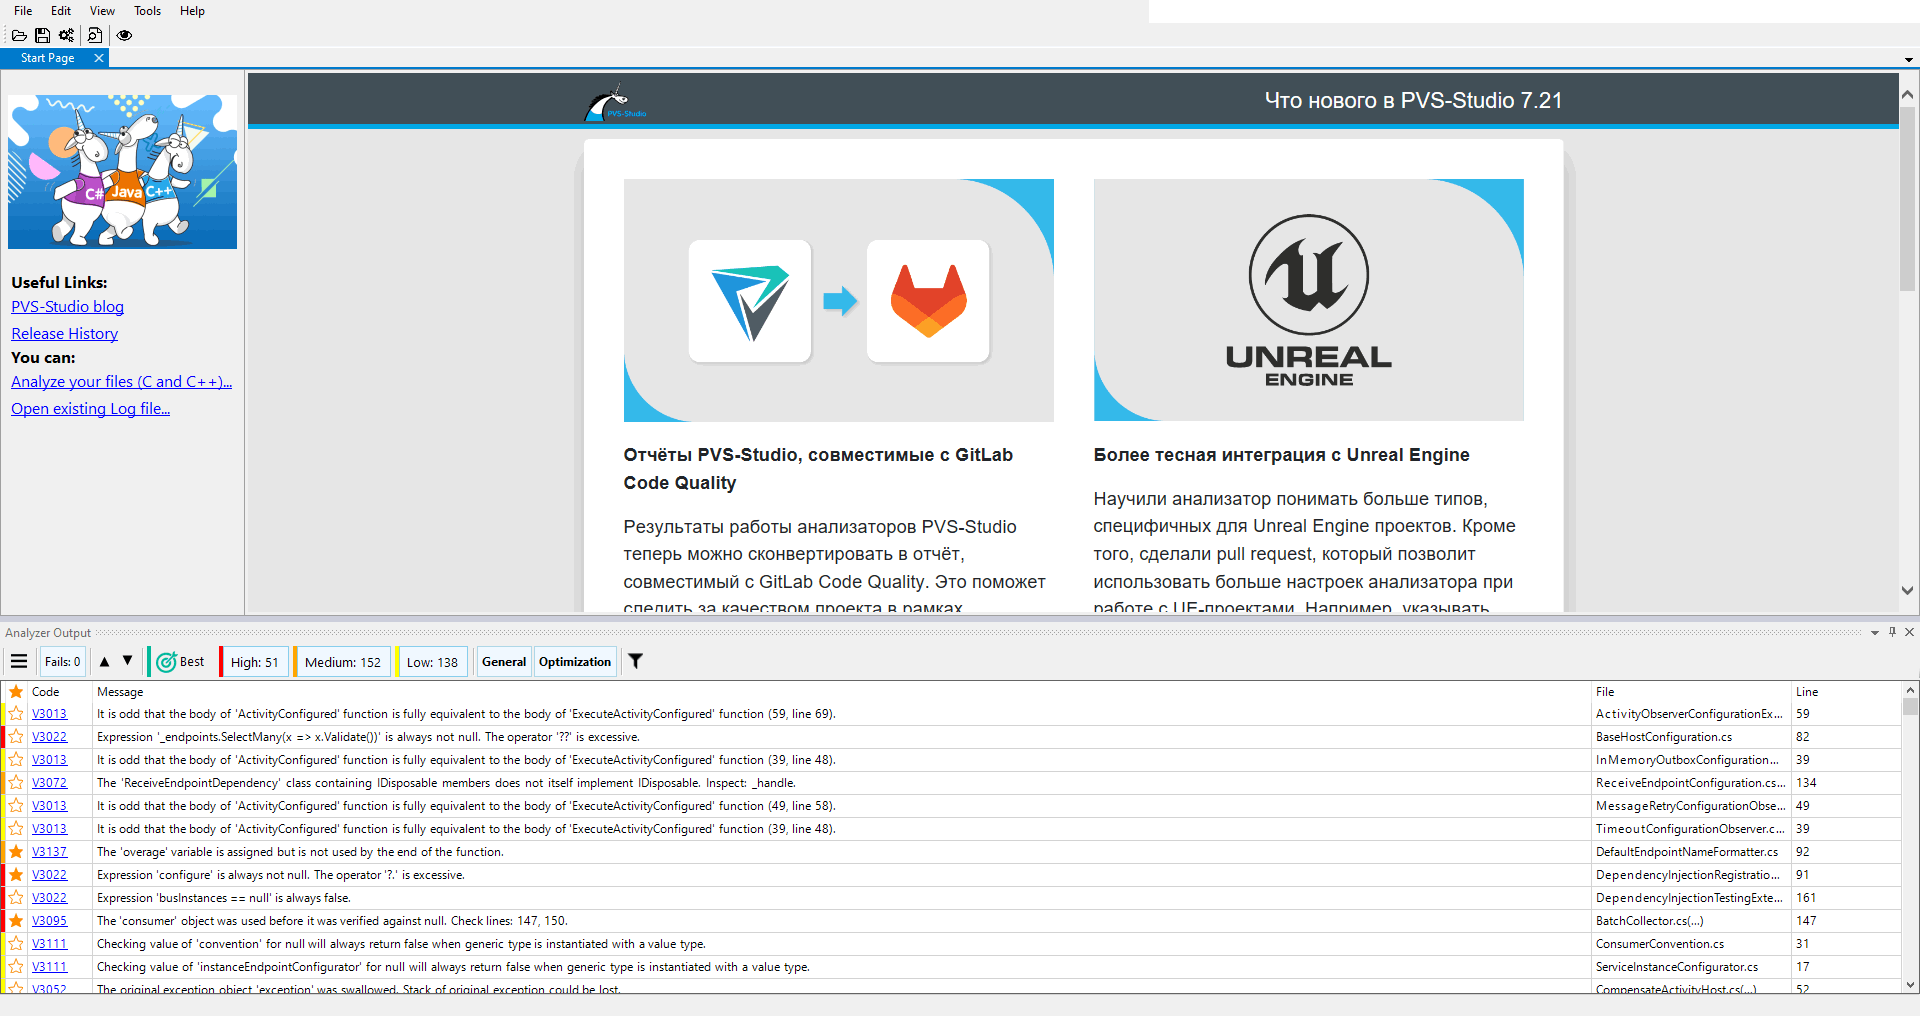
PVS-Studio_Cmd.exe
PVS-Studio_Cmd.exe is a tool, which enables the analysis of Visual Studio solutions (.sln), as well as Visual C++ and Visual C# projects (.vcxproj, .csproj) from the command line. This can be useful, for example, in the case of a need to integrate static analysis on the build server. PVS-Studio_Cmd.exe allows to perform as a full analysis of the target project, and incremental (analysis of files that have changed since the last build). View of return code of the utility work as a bitmask enables you to get detailed information on the results of the analysis and identify the problems, in case of their occurrence. Thus, using the PVS-Studio_Cmd.exe utility you can configure a scenario of static code analysis 'subtly' enough and embed it into the CI process. Using of PVS-Studio_Cmd.exe module is described in more detail in the section "Analyzing Visual C++ (.vcxproj) and Visual C# (.csproj) projects from the command line".
Help system and technical support
PVS-Studio provides an extensive help system on its diagnostic messages. This message database is accessible both from PVS-Studio's interface and at the official site. The message descriptions are accompanied by code samples with error examples, the error description, and available fixing solutions.
To open a diagnostic description, just click with the left mouse button on the diagnostic number in the message output window. These numbers are implemented as hyperlinks.
Technical support for PVS-Studio is carried out via e-mail. Since our technical support is delivered by the tool developers themselves, our users can promptly get responses to a wide variety of questions.
System requirements and installation of PVS-Studio
PVS-Studio integrates into Microsoft Visual Studio 2022, 2019, 2017, 2015, 2013, 2012, 2010 development environments. You may learn about the system requirements for the analyzer in the corresponding section of the documentation.
After you obtain the PVS-Studio installation package, you may start installing the program.

After approval of the license agreement, integration options will be presented for various supported versions of Microsoft Visual Studio. Integration options which are unavailable on a particular system will be greyed-out. In case different versions of the IDE or several IDEs are present on the system, it is possible to integrate the analyzer into every version available.

To make sure that the PVS-Studio tool was correctly installed, you may open the About window (Help/About menu item). The PVS-Studio analyzer must be present in the list of installed components.

The basics of using PVS-Studio
When working in the Visual Studio IDE, you can run different types of the analysis - at the solution, project file, the selected items, etc. For example, the analysis solutions run is executed as follows: "PVS-Studio -> Check -> Solution".

After launching the verification, the progress bar will appear with the buttons Pause (to pause the analysis) and Stop (to terminate the analysis). Potentially dangerous constructs will be displayed in the list of detected errors during the analysis procedure.

The term "a potentially dangerous construct" means that the analyzer considers a particular code line a defect. Whether this line is a real defect in an application or not is determined only by the programmer who knows the application. You must correctly understand this principle of working with code analyzers: no tool can completely replace a programmer when solving the task of fixing errors in programs. Only the programmer who relies on his knowledge can do this. But the tool can and must help him with it. That is why the main task of the code analyzer is to reduce the number of code fragments the programmer must look through and decide what to do with them.
Work with a list of diagnostic messages
in real large projects, there will be not dozens but hundreds or even thousands of diagnostic messages and it will be a hard task to review them all. To make it easier, the PVS-Studio analyzer provides several mechanisms. The first mechanism is filtering by the error code. The second is filtering by the contents of the diagnostic messages' text. The third is filtering by file paths. Let's examine examples of using filtering systems.
Suppose you are sure that the diagnostic messages with the code V112 (using magic numbers) are never real errors in your application. In this case you may turn off the display of these diagnostic warnings in the analyzer's settings:

After that, all the diagnostic warnings with the code V112 will disappear from the error list. Note that you do not need to restart the analyzer. If you turn on these messages again, they will appear in the list without relaunching the analysis as well.
Now let's look at another option - a text-based diagnostic messages filtering. Let's look at an example of analyzer warning and code on which it was issued:
obj.specialFunc(obj);Analyzer warning: V678 An object is used as an argument to its own method. Consider checking the first actual argument of the 'specialFunc' function.
The analyzer found it suspicious that the same object is passed as an argument to from which this method is called. A programmer, as opposed to the analyzer may be aware of what usage of this method is acceptable. Therefore, you might need to filter out all such warnings. You can do this by adding the related filter in settings "Keyword Message Filtering".

After that, all the diagnostic messages whose text contains that expression will disappear from the error list, without the necessity of restarting the code analyzer. You may get turn them on back by simply deleting the expression from the filter.
The last mechanism of reducing the number of diagnostic messages is filtering by masks of project files' names and file paths.
Suppose your project employs the Boost library. The analyzer will certainly inform you about potential issues in this library. But if you are sure that these messages are not relevant for your project, you may simply add the path to the folder with Boost on the page "Don't check files":

After that diagnostic messages related to files in this folder will not be displayed.
Also, PVS-Studio has the "Mark as False Alarm" function. It enables you to mark those lines in your source code which cause the analyzer to generate false alarms. After marking the code, the analyzer will not produce diagnostic warnings on this code. This function makes it more convenient to use the analyzer permanently during the software development process when verifying newly written code.
Thus, in the following example, we turned off the diagnostic messages with the code V640:
for (int i = 0; i < m; ++i)
for (int j = 0; j < n; ++j)
matrix[i][j] = Square(i) + 2*Square(j);
cout << "Matrix initialization." << endl; //-V640
....This function is described in more detail in the section "Suppression of False Alarms".
There are also some other methods to influence the display of diagnostic messages by changing the code analyzer's settings but they are beyond the scope of this article. We recommend you to refer to the documentation on the code analyzer's settings.
Is it necessary to fix all the potential errors the analyzer informs about?
When you have reviewed all the messages generated by the code analyzer, you will find both real errors and constructs which are not errors. The point is that the analyzer cannot detect 100% exactly all the errors in programs without producing the so called "false alarms". Only the programmer who knows and understands the program can determine if there is an error in each particular case. The code analyzer just significantly reduces the number of code fragments the developer needs to review.
So, there is certainly no reason for correcting all the potential issues the code analyzer refers to.
Suppression mechanisms of individual warnings and mass analyzer messages suppression are described in the articles "Suppression of False Alarms" and "Mass suppression of analyzer messages".
Analyzing Visual Studio / MSBuild / .NET projects from the command line using PVS-Studio
- Running analysis of sln and csproj/vcxproj files
- Specification of individual files for analysis
- Wildcard filtration of the analyzed
- Intermodular analysis mode
- Command-line tools exit codes
- Analysis run from the command line for C/C++ projects that don't use the Visual Studio build system
- Effect of PVS-Studio settings on command line run; filtering and converting analysis results (plog\json file)
This document covers the usage of command-line utilities for the analysis of MSBuild projects (.vcxproj / .csproj) and Visual Studio solutions.
This document covers the usage of command line utilities. Usage of plugins for Visual Studio and JetBrains Rider is described in the following documentation sections: "Getting acquainted with the PVS-Studio static code analyzer on Windows", "Using PVS-Studio with JetBrains Rider".
The command-line analyzer of MSBuild projects has various names on different platforms supported by the analyzer:
- PVS-Studio_Cmd (analysis of solutions, C#, C++ projects on Windows);
- pvs-studio-dotnet (analysis of solutions, C# projects on Linux / macOS);
The features described below are relevant for both utilities. Examples with PVS-Studio_Cmd / pvs-studio-dotnet are interchangeable unless explicitly stated otherwise.
Note. To analyze C++ projects that don't use the MSBuild build system, on Windows use the compilation monitoring system or direct integration of the analyzer into the build system. Analysis of C++ projects on Linux / macOS is described in detail in this section of the documentation.
Running analysis of sln and csproj/vcxproj files
Command line utilities are unpacked to the following directories by default:
- PVS-Studio_Cmd.exe
- Windows: "C:\Program Files (x86)\PVS-Studio\";
- pvs-studio-dotnet
- Linux: "/usr/share/pvs-studio-dotnet/";
- macOS: "/usr/local/share/pvs-studio-dotnet".
'‑‑help' command displays all available arguments of the analyzer:
PVS-Studio_Cmd.exe --helpHere is an example of how to check 'mysolution.sln':
PVS-Studio_Cmd.exe -t "mysolution.sln" -o "mylog.plog"Let's look at the main arguments of the analyzer:
- ‑‑target (-t): required parameter. Allows you to specify the object to be tested (sln or csproj/vcxproj file);
- ‑‑output (-o): path to the file, where the analysis results will be written. If this parameter is omitted, the analyzer report file will be created next to the file specified using the '‑‑target' flag. The analyzer report can be saved in 2 formats: .json and. plog. The format type is determined by the specified extension. By default, without specifying this flag, the report will be generated in the .plog format on Windows, and in the .json format on Linux and macOS;
- ‑‑platform (-p) and ‑‑configuration (-c): the check will be run for the specified platform and configuration. If these parameters are not specified, the first available "platform|configuration" (when checking the sln file) pair will be selected or "Debug|AnyCPU" (when checking a separate csproj project) or "Debug|Win32" (when checking a separate vcxproj project);
- ‑‑sourceFiles (-f): path to the text file containing a list of paths to source files for the analysis (each must be on a separate line). The argument cannot be used with the '‑‑regenerateDependencyCacheWithoutAnalysis '(-W) flag in the same command. Relative and absolute paths are supported. In this mode, when analyzing C and C++ files, a cache file of compilation is created (and used). You can control its location of which can be controlled using the '‑‑dependencyRoot' (-D) flag. Note: when this argument is used with the '‑‑selectProjects' (-S) and/or '‑‑excludeProjects' (-E) arguments, the project filtering is applied first, and then the files from '‑‑sourceFiles' (-f) are searched and analyzed among the remaining project files;
- ‑‑regenerateDependencyCache (-G): generates or updates compilation dependency cache for all project source files that is used together with the '‑‑sourceFiles' (-f) flag and starts analysis for all project source files. You can use the '‑‑selectProjects' (-S) and the '‑‑excludeProjects' (-E) flags to filter out projects. Passing the '‑‑sourceFiles' (-f) flag along with this flag causes a complete regeneration of the dependency caches for all project source files, and the analysis is done only for the list of files passed in '‑‑sourceFiles' (-f);
- ‑‑regenerateDependencyCacheWithoutAnalysis (-W): generates or updates the compilation dependency cache for all project source files that is used together with the '‑‑sourceFiles' flag (-f), without running analysis. You can use the '‑‑selectProjects' (-S) and '‑‑excludeProjects' (-E) flags to filter out projects. The argument cannot be used with the '‑‑sourceFiles' (-f) flag;
- ‑‑dependencyRoot (-D): an optional path to the directory where the source file dependency caches are located. Works in addition to the '‑‑sourceFiles' (-f) and '‑‑regenerateDependencyCache' (-G) flags;
- ‑‑dependencyCacheSourcesRoot (-R): an optional path to specify the root directory of relative source file paths in dependency caches generated with '‑‑sourceFiles' (-f) and '‑‑regenerateDependencyCache' (-G) flags;
- ‑‑settings (-s): path to the PVS-Studio configuration file. If this parameter is omitted, the Settings.xml file will be used, located in the directory "%AppData%\PVS-Studio\" on Windows or "~/.config/PVS-Studio/" on Linux / macOS. These same settings files are used by plugins (Visual Studio, Rider), which makes it possible to edit them using the PVS-Studio plugin interface in these IDEs. Please note that for the analyzer to work under Windows, the settings file must contain registration information. Various ways to enter a license are described here. Depending on the settings file used, the following rules apply:
- when using the default settings file, it must contain registration information;
- if you explicitly specify the path to the settings file, the registration information must be written either in the specified settings file or in the default settings file;
- ‑‑licFile (-l): path to the PVS-Studio license file. This flag is available only in pvs-studio-dotnet. If the parameter is omitted, the PVS-Studio.lic license file will be used, which is located in the "~/.config/PVS-Studio/ " directory.
- ‑‑suppressAll (-a): add unsuppressed warnings in suppress files of corresponding projects (disabled by default). If this flag is present, all messages will be added to the suppress warnings base after saving the check result. The flag supports 5 operating modes.
- SuppressOnly adds messages from the passed analyzer report to the suppress files without running the analysis;
- AnalyzeAndSuppress runs the analysis, saves the analyzer report, and only after this suppresses the messages found in it. This mode allows you to get a report from the analyzer on regular runs, which contains only new messages for the changed \ written code, i.e. new messages get into the new log and get immediately suppressed - they won't be issued during the subsequent check. However, if you still need to view the old messages (without rechecking), a file with the full check report (only for .plog analyzer reports) will be saved next to the analyzer report containing new messages. Read more about message suppression mode in this section of the documentation;
- ‑‑sourceTreeRoot (-e): the root part of the path that PVS-Studio will use when generating relative paths in diagnostic messages. Setting this parameter overrides the 'SourceTreeRoot' value in the PVS-Studio settings;
- ‑‑incremental (-i): incremental analysis mode. For more information about incremental analysis in PVS-Studio, see the section "PVS-Studio incremental analysis mode". Note, that this mode is available only under PVS-Studio Enterprise license. There are following modes of incremental analysis available:
- Scan - analyze all dependencies to determine, which files will be analyzed incrementally. The analysis itself won't be performed. Changes made since the last build will be taken into account, and the previous history of changes will be deleted.
- AppendScan - analyze all dependencies to determine, which files will be analyzed incrementally. The analysis itself won't be performed. Changes made since the last build, as well as all previous changes, will be taken into account.
- Analyze - perform incremental analysis. This step should be done after Scan or AppendScan and can be performed both before and after the build of a solution or project. Static analysis will only be performed for files from the list obtained by executing the Scan or AppendScan commands.
- ScanAndAnalyze - analyze all the dependencies to determine which files should be analyzed incrementally and perform incremental analysis of the edited files with the source code. Changes made since the last build will be taken into account.
- ‑‑msBuildProperties (-m): allows you to set or redefine project level properties. To set or redefine multiple project level properties, use the "|" symbol, for example: ‑‑msBuildProperties "WarningLevel=2|OutDir=bin\OUT32\"
- ‑‑excludeDefines (-x): a list of symbols that will be excluded from the current set when analyzing the project. If you need to list several symbols, use ';' as the delimiter. Example: ‑‑excludeDefines "DEF1;DEF2". This option is only taken into account when analyzing C# projects.
- ‑‑appendDefines (-d): a list of symbols that will be added to the current set when analyzing the project. If you need to list several symbols, use ';' as the delimiter. Example: ‑‑appendDefines "DEF1;DEF2". This option is only taken into account when analyzing C# projects.
- ‑‑selectProjects (-S): a list of analyzed solution's projects (sln) to be analyzed. Other projects will be excluded from the analysis. It supports listing projects using the name of the project file (with or without an extension), using an absolute or relative path. If you need to list multiple projects, use ';' as the delimiter. Example: ‑‑selectProjects Project1;"Project 2.vcxproj";".\Project3\Project3.csproj".
- ‑‑excludeProjects (-E): a list of projects in the analyzed solution (sln) that will be excluded from the analysis. It supports listing projects using the name of the project file (with or without an extension), using an absolute or relative path. If you need to list multiple projects, use ';' as the delimiter. Example: ‑‑excludeProjects Project1;"Project 2.vcxproj";".\Project3\Project3.csproj".
- ‑‑rulesConfig (-C): path to the .pvsconfig diagnostics configuration file. It can be used together with configuration files from projects / solutions and configuration files from directories:
- Windows: "%AppData%\PVS-Studio\";
- Linux / macOS: "~/.config/PVS-Studio/".
- ‑‑useSuppressFile (-u): path to the suppress files. You can specify several suppress files via this parameter. Use the ';' character to separate paths to suppress files. For example: -u "path\to\test.suppress;path\to\test.suppress.json". Read more about message suppression mode in this section of the documentation.
- ‑‑disableLicenseExpirationCheck (-h): resets return code and disables license expiration warning when the license is about to expire.
- ‑‑intermodular (-I): enables the intermodular analysis mode for C and C++ projects. In this mode, the analyzer performs a deeper code analysis by increasing the analysis time. The C# analyzer provides the intermodular analysis by default.
The console utility also has additional modes of operation:
- credentials – intended to activate the license;
- suppression – is intended for specific actions on the suppress files (to create empty suppress files, to suppress/unsuppress individual warnings, to get statistics on the suppress files).
The "suppression" mode has additional flags that are not present in the main mode (or the flags have a different name):
- ‑‑mode (-m): using this flag you can specify the submode for working with suppress files:
- CreateEmptySuppressFiles creates empty suppress files next to project files (.csproj/.vcxproj) by the specified pattern of the file name (‑‑suppressFilePattern flag). If the flag of the pattern is omitted, empty suppress files are created with the project name. This mode takes into account the flag marking suppress files with the primary tag (‑‑markAsPrimary). Primary suppress files are used to suppress several warnings selected in the PVS-Studio Output Window for Visual Studio;
- Suppress allows suppression of individual warnings from the analyzer's report file (‑‑analyzerReport). The suppressed warnings from the analyzer report are selected using filters: groups (‑‑groups), diagnostic codes (‑‑errorCodes), paths (‑‑files). This mode takes into account the ‑‑markAsPrimary flag;
- UnSuppress mode unsuppresses warnings from the passed analyzer report. UnSuppress is similar to Suppress mode in terms of the flags used, except for the ‑‑markAsPrimary flag. It is not used in this mode;
- FilterFromSuppress filters the messages in the existing report file (.plog, .json, or unparsed output of the C++ core) without running the analysis. This mode filters the messages using suppress files located next to project/solution files. Another option: pass the path to the suppress files using the –useSuppressFile (-u) flag. The file with results is saved next to the report file passed. The file is named with postfix '_filtered'.
- CountSuppressedMessages calculates the number of suppressed warnings in all suppress files. This mode can also calculate the number of relevant warnings in suppress files. If you pass the full report file (via the -o flag), you can see how many warnings in the suppress base are still relevant. You can also learn statistics for each suppress file if you run this mode with the '-r' flag.
- UpdateSuppressFiles updates suppress files and deletes the warnings that are not included in the report file passed. Please note that this mode requires a full report containing suppressed warnings. A full report is created each time the analysis is started if there are suppressed warnings. The full report file is named "*_WithSuppressedMessages.*" and is located next to the main report file. If you run this mode with a report file that doesn't contain suppressed warnings, all suppress files will be cleared.
- ‑‑analyzerReport (-R): the path to the analyzer report whose warnings are to be used in processing. Similar to -o flag from the main mode;
- ‑‑msBuildProperties (-b): key-value pairs. It is similar to -msBuildProperties (-m) flag from the main mode of PVS-Studio-Cmd.exe;
- ‑‑markAsPrimary (-M): marks suppress files as primary suppress files;
- ‑‑suppressFilePattern (-P): the name pattern for creating/using suppress files;
- ‑‑logModifiedFiles (-l): paths to all modified project and suppress files are written to the file passed in this flag. Both absolute and relative file paths can be used. A file will be created or overwritten if at least one project or suppress file has been modified. The same information is output to the console if the ‑‑progress (-r) flag is specified;
- ‑‑groups (-g): the filter of warnings from the analyzer report (-R) by diagnostic groups with warning certainty level. Example: GA:1,2,3|OWASP|64:2;
- ‑‑errorCodes (-E): the filter of warnings from the analyzer report (-R) by the analyzer diagnostic codes. Example: V501,V1001,V3001;
- ‑‑files (-f): the filter of warnings from the analyzer report (-R) by paths. Example: ‑‑files absolute/path/directory*3,8,11|relative/path/file*1|fileName
PVS-Studio command-line version supports all settings on filtering/disabling messages available in the IDE plugin for Visual Studio. You can either set them manually in the xml file, passed through the '‑‑settings' argument, or use the settings specified through the UI plugin, without passing this argument. Note that the PVS-Studio IDE plugin uses an individual set of settings for each user in the system.
Only relevant for PVS-Studio_Cmd. If you have installed multiple instances of PVS-Studio of different versions for the current system user, all instances of the program will use the installation directory specified during the last installation. To avoid conflicts in the analyzer's operation, in the settings passed with the ‑‑settings (-s) argument, the path to the installation directory (the value of the <InstallDir> element) must be specified.
Specification of individual files for analysis
PVS-Studio_Cmd allows you to selectively check individual files (for example, only files that have been modified) specified in the list passed using the '‑‑sourceFiles' (-f) flag. This significantly reduces the time required for analysis and also enables you to get the analyzer report only for specific changes in the source code.
The file list is a simple text file that contains line-by-line paths to the files being checked. Relative file paths will be expanded relative to the current working directory. You can specify both compiled source files (c/cpp for C++ and cs for C#), and header files (h/hpp for C++).
To get a list of changed files for the '‑‑sourceFiles' (-f) flag, you can use version control systems (SVN, Git, etc.). They provide the analyzer with up-to-date information about changes in the code.
When you use the mode to analyze C and C++ files, a compilation dependency cache is generated, which will be used for subsequent analysis runs. By default, dependency caches are saved in a special '.pvs-studio' subdirectory where project files (.vcxproj) are located. If necessary, you can change their storage location using the '‑‑dependencyRoot' (-D) flag. . You can also use the ‑‑dependencyCacheSourcesRoot (-R) flag to generate dependency cache files with relative paths, allowing the same dependency cache file to be used on different systems.
When you run the analysis for the first time using the '‑‑sourceFiles' flag (-f), the analyzer preprocesses all C and C++ files from the projects submitted for analysis. The information on dependencies is stored in a separate dependency cache file for each project.
On future analyzer runs with the '‑‑sourceFiles' flag (-f), the information will be added/updated to the dependency cache for:
- Files listed from the '‑‑sourceFiles' flag (-f).
- Files that do not yet have an entry in the dependency cache file. For example, new files added to the project.
- Files that previously depended on the files listed from the '‑‑sourceFiles' flag (-f). The information on dependencies is taken from the dependency cache file that was generated/updated during the last run of the analysis with the '‑‑sourceFiles' (-f) flag.
After updating the information on dependencies, all files specified in '‑‑sourceFiles' (-f) are analyzed, as well as the files that depend on these files (the information on dependencies from the previous step is used).
Before each analysis run, the compilation dependency cache is updated for all files passed in '‑‑sourceFiles' (-f) and for the files whose dependencies include files passed in the list. If there are changes in file dependencies relative to cached dependencies, these changes will be considered in the current analysis run and the cache will be updated for future runs.
To keep the dependency cache up to date, run the analysis with the '‑‑sourceFiles' (-f) flag each time when the source files are changed, or simultaneously for all changed files from multiple commits.
Skipping the analysis of changes to source files, or separately analyzing modified files in an order other than the order in which they were modified, may cause the analysis to be skipped in the future due to changes in the dependency structure of the project. For example, if a dependency on an .h file has been added to a .cpp file, that .cpp file should be added to the list of files to be checked to update the dependency cache. Otherwise, when a newly added .h file is included in the list of files to be analyzed, the analyzer will not be able to find the translation unit for which preprocessing should be performed.
If you cannot provide a guaranteed transfer of all changing project files in the '‑‑sourceFiles' (-f) mode, use the '‑‑sourceFiles' (-f) mode together with the '‑‑regenerateDependencyCache' (-G) mode. In such a case, the analyzer operation time will slightly increase (for cache regeneration, all project translation units should be preprocessed). However, it will still be much less than the time of full analysis (because only preprocessing of all project source files is performed, not the analysis itself). Cache relevance is guaranteed on every analysis run and is not dependent on the possible omission of changed files or the order in which the files were submitted for analysis.
Wildcard filtration of the analyzed
To specify the list of analyzed files with path patterns, you need to pass a specially formatted XML file to the '‑‑sourceFiles' (-f) flag. It accepts the list of absolute and relative paths and/or wildcards to analyzed files.
<SourceFilesFilters>
<SourceFiles>
<Path>C:\Projects\Project1\source1.cpp</Path>
<Path>\Project2\*</Path>
<Path>source_*.cpp</Path>
</SourceFiles>
<SourcesRoot>C:\Projects\</SourcesRoot>
</SourceFilesFilters>Intermodular analysis mode
Enabling this mode allows the analyzer to consider information not only from the analyzed file, but also from files that relate to the analyzed file. This allows for deeper and more qualitative analysis. However, it takes extra time to collect the necessary information, which will affect the time you analyze your project.
This mode is relevant to C and C++ projects. C# projects provide cross-modular analysis by default.
To start the intermodular analysis, pass the ‑‑intermodular flag to the command-line utility.
Command-line tools exit codes
The PVS-Studio_Cmd / pvs-studio-dotnet utilities have several non-zero exit codes that don't indicate a problem with the utility itself, i.e. even if the utility returned not '0', it doesn't mean that it crashed. The exit code is a bit mask that masks all possible states that occurred during the operation of the utility. For example, the utility will return a non-zero code if the analyzer finds potential errors in the code being checked. This allows you to handle this situation separately, for example, on the build server, when the analyzer usage policy doesn't imply the presence of warnings in the code uploaded in the version control system.
PVS-Studio_Cmd exit codes (Windows)
Let's look at all possible utility state codes that form the bit mask of the return code.
- '0' - the analysis was completed successfully, no errors were found in the code being checked;
- '1' - an error (crash) of the analyzer when checking one of the files;
- '2' - a general (non-specific) error during the analyzer operation, intercepted exception during operation. This usually signals the presence of an error in the analyzer code itself and is followed by this error's stack trace in stderr. If you stumbled upon such an error, please, help us make the analyzer better and send this stack trace to us;
- '4' - some of the passed command-line arguments are incorrect;
- '8' - the specified project, solution, or analyzer settings file wasn't found;
- '16' - the specified configuration and / or platform weren't found in the solution file;
- '32' - the solution or project file isn't supported or contains errors;
- '64' - invalid extension of the solution or project being checked;
- '128' - invalid or expired analyzer license;
- '256' - potential errors were found in the code being checked;
- '512' - an error occurred while performing message suppression
- '1024' - indicates that the analyzer license will expire within a month;
Here is an example of a Windows batch script for decrypting the return code of the PVS-Studio_Cmd utility:
@echo off
"C:\Program Files (x86)\PVS-Studio\PVS-Studio_Cmd.exe"
-t "YourSolution.sln" -o "YourSolution.plog"
set /A FilesFail = "(%errorlevel% & 1) / 1"
set /A GeneralExeption = "(%errorlevel% & 2) / 2"
set /A IncorrectArguments = "(%errorlevel% & 4) / 4"
set /A FileNotFound = "(%errorlevel% & 8) / 8"
set /A IncorrectCfg = "(%errorlevel% & 16) / 16"
set /A InvalidSolution = "(%errorlevel% & 32) / 32"
set /A IncorrectExtension = "(%errorlevel% & 64) / 64"
set /A IncorrectLicense = "(%errorlevel% & 128) / 128"
set /A AnalysisDiff = "(%errorlevel% & 256) / 256"
set /A SuppressFail = "(%errorlevel% & 512) / 512"
set /A LicenseRenewal = "(%errorlevel% & 1024) / 1024"
if %FilesFail% == 1 echo FilesFail
if %GeneralExeption% == 1 echo GeneralExeption
if %IncorrectArguments% == 1 echo IncorrectArguments
if %FileNotFound% == 1 echo FileNotFound
if %IncorrectCfg% == 1 echo IncorrectConfiguration
if %InvalidSolution% == 1 echo IncorrectCfg
if %IncorrectExtension% == 1 echo IncorrectExtension
if %IncorrectLicense% == 1 echo IncorrectLicense
if %AnalysisDiff% == 1 echo AnalysisDiff
if %SuppressFail% == 1 echo SuppressFail
if %LicenseRenewal% == 1 echo LicenseRenewalpvs-studio-dotnet exit codes (Linux / macOS)
Note. Since the maximum value of the exit code under Unix is limited by 255, exit codes of the PVS-Studio_Cmd (where the exit code may exceed 255) and pvs-studio-dotnet utilities are different.
Let's look at all possible utility state codes that form the bit mask of the return code.
- '0' - analysis was successfully completed, no issues were found in the source code;
- '1' - incorrect or out-of-date analyzer license;
- '2' - general error in the analyzer's operation. This includes missed command-line arguments, invalid solution or project specified for analysis, an error inside the analyzer, etc. If an error message is followed by a stack trace, please help us improve the analyzer by sending it to us;
- '4' - indicates that the analyzer license will expire within a month;
- '8' - some issues were found in the source code;
Analysis run from the command line for C/C++ projects that don't use the Visual Studio build system
Note. This section is relevant for Windows. Analysis of C++ projects on Linux / macOS is described in the corresponding section of the documentation.
If your C/C++ project doesn't use standard Visual Studio build systems (VCBuild/MSBuild) or even uses your own build system / make files via NMAKE Visual Studio projects, you will not be able to check such a project using PVS-Studio_Cmd.
In this case, you can use the compiler monitoring system, which allows you to analyze projects regardless of their build system, "intercepting" the start of compilation processes. The compilation monitoring system can be used either from the command line or through the user interface of the C and C++ Compiler Monitoring UI application.
You can also directly embed the command line launch of the analyzer core right into your build system. Mind you, this will require writing a call to the PVS-Studio analyzer.exe core for each compiled file, similar to the the way how the C++ compiler is called.
Effect of PVS-Studio settings on command line run; filtering and converting analysis results (plog\json file)
When you run code analysis from the command line, the default settings are the same as when you run analysis from the IDE (Visual Studio / Rider). You can also specify which settings file to use via the ‑‑settings argument, as described above.
For example, as for the filter system (Keyword Message Filtering and Detectable Errors), it is NOT used when analyzing from the command line. Which means that the report file will contain all error messages regardless of the parameters you set. However, when you upload the results file to the IDE, the filters will already be applied. This is because filters are applied dynamically to results. The same occurs when running from the IDE as well. This is very convenient, because when you get a list of messages, you may want to disable some of them (for example, V201). Just disable them in the settings and the corresponding messages will disappear from the list WITHOUT restarting the analysis.
The analyzer report format isn't intended for direct display or human reading. However, if you need to filter the analysis results in some way and convert them to a "readable" view, you can use the PlogConverter utility distributed with PVS-Studio.
To work with reports in different formats, you need to use different utilities:
- .plog – PlogConverter.exe (available only on Windows);
- .json – plog-converter (Linux, macOS).
The source code of both utilities is open and available for download: PlogConverter; plog-converter, which allows you to simply add support for new formats based on existing algorithms.
These utilities are described in more detail in the corresponding sections of the documentation:
- PlogConverter – "Working with XML report (. plog file)" (subsection "Converting the analysis results");
- plog-converter- "How to run PVS-Studio on Linux and macOS" (subsection "Plog Converter Utility").
Build-system independent analysis (C and C++)
- Introduction
- Working principles
- Getting started with CLMonitor.exe
- Saving compilation monitoring dump and running analysis from this dump
- Using compiler monitoring from UI client (Standalone.exe)
- Compiler monitoring from Visual Studio
- Specifics of the CLMonitor.exe use with Incredibuild
- Specifics of monitoring a build process of IAR Embedded Workbench for ARM
- Incremental analysis
- Intermodular analysis mode
- Specification of individual files for analysis
- Wrap Compilers interception mode
- Conclusion
To learn about the monitoring process on Linux, click here (the "Any project (only for Linux)" section).
Introduction
The PVS-Studio compiler monitoring system (CLMonitoring) was designed for "seamless" integration of the PVS-Studio static analyzer into any build system under Windows that employs one of the preprocessors supported by the PVS-Studio.exe command-line analyzer (Visual C++, GCC, Clang, Keil MDK ARM Compiler 5/6, IAR C/C++ Compiler for ARM) for compilation.
To perform correct analysis of the source C/C++ files, the PVS-Studio.exe analyzer needs intermediate .i files which are actually the output of the preprocessor containing all the headers included into the source files and expanded macros. This requirement defines why one can't "just take and check" the source files on the disk - besides these files themselves, the analyzer will also need some information necessary for generating those .i files. Note that PVS-Studio doesn't include a preprocessor itself, so it has to rely on an external preprocessor in its work.
As the name suggests, the compiler monitoring system is based on "monitoring" compiler launches when building a project, which allows the analyzer to gather all the information essential for analysis (that is, necessary to generate the preprocessed .i files) of the source files being built. In its turn, it allows the user to check the project by simply rebuilding it, without having to modify his build scripts in any way.
This monitoring system consists of a compiler monitoring server (the command-line utility CLMonitor.exe) and UI client (Standalone.exe), and it is responsible for launching the analysis (CLMonitor.exe can be also used as a client when launched from the command line).
In the default mode, the system doesn't analyze the hierarchy of the running processes; instead, it just monitors all the running processes in the system. It means that it will also know if a number of projects are being built in parallel and monitor them.
CLMonitor.exe can monitor only compiler runs, that have been generated by the specified (by PID) parent process. Such operational mode is provided for the case, when several projects are simultaneously built, but you need to monitor compiler runs only for a specific project or solution. Child processes monitoring mode will be described below.
Working principles
CLMonitor.exe server monitors launches of processes corresponding to the target compiler (for example cl.exe for Visual C++ and g++.exe for GCC) and collects information about the environment of these processes. Monitoring server will intercept compiler invocations only for the same user it was itself launched under. This information is essential for a correct launch of static analysis to follow and includes the following data:
- the process main folder
- the full process launch string (i.e. the name and all the launch arguments of the exe file)
- the full path to the process exe file
- the process environment system variables
Once the project is built, the CLMonitor.exe server must send a signal to stop monitoring. It can be done either from CLMonitor.exe itself (if it was launched as a client) or from Standalone's interface.
When the server stops monitoring, it will use the collected information about the processes to generate the corresponding intermediate files for the compiled files. And only then the PVS-Studio.exe analyzer itself is launched to carry out the analysis of those intermediate files and output a standard PVS-Studio's report you can work with both from the Standalone version and any of the PVS-Studio IDE plugins.
Getting started with CLMonitor.exe
Note: in this section, we will discuss how to use CLMonitor.exe to integrate the analysis into an automated build system. If you only to check some of your projects manually, consider using the UI version of C and C++ Compiler Monitoring (Standalone.exe) as described below.
CLMonitor.exe is a monitoring server directly responsible for monitoring compiler launches. It must be launched prior to the project build process. After launching the server in monitoring mode, it will trace the invocations of supported compilers.
The supported compilers are:
- Microsoft Visual C++ (cl.exe) compilers
- C/C++ compilers from GNU Compiler Collection (gcc.exe, g++.exe) and its derivatives
- Clang (clang.exe) compiler and its derivatives
- Borland C++
- QCC
- Keil MDK ARM Compiler 5/6
- IAR C/C++ Compiler for ARM
- Texas Instruments ARM Compiler
- GNU Arm Embedded Toolchain
But if you want the analysis to be integrated directly into your build system (or a continuous integration system and the like), you can't "just" launch the monitoring server because its process blocks the flow of the build process while active. That's why you need to launch CLMonitor.exe with the monitor argument in this case:
CLMonitor.exe monitorIn this mode, CLMonitor will launch itself in the monitoring mode and then terminate, while the build system will be able to continue its work. At the same time, the second CLMonitor process (launched from the first one) will stay running and monitoring the build process.
Since there are no consoles attached to the CLMonitor process in this mode, the monitoring server will - in addition to the standard stdin\stdout streams - output its messages into a Windows event log (Event Logs -> Windows Logs -> Application).
Also you can monitor only compiler runs that have been generated by a specific process specified by PID. To do this, you need to run CLMonitor.exe in the monitoring mode with arguments trace and ‑‑parentProcessID ('-p' short version). The argument ‑‑parentProcessID as a parameter has to obtain the process PID, which is supposed to be the parent of the compiler processes to run. The CLMonitor.exe command line might look as follows in this case:
CLMonitor.exe trace –-parentProcessID 10256If you perform the build from the console and you want CLMonitor.exe to monitor only the build, launched from that very console, you can run CLMonitor.exe with the argument ‑‑attach (-a):
CLMonitor.exe monitor –-attachIn this operational mode, the program will monitor only those compiler instances which are child processes of the console process, from which the build was run.
We need to take into account, that the MSBuild build system leaves some MSBuild.exe processes from the previous builds running. In this case, CLMonitor.exe monitoring child processes, won't be able to track compiler runs, generated by those remaining MSBuild.exe processes. That is so because these MSBuild.exe processes, most likely, aren't included in the hierarchy of the process specified by the argument ‑‑parentProcessID. Thus, before running CLMonitor.exe in the mode of monitoring child processes, we recommend terminating MSBuild.exe processes remaining in the system from the previous build.
Note: for the monitoring server to run correctly, it must be launched with the same privileges as the compiler processes themselves.
To ensure correct logging of messages in the system event logs, you need to launch the CLMonitor.exe process with elevated (administrative) privileges at least once. If it has never been launched with such privileges, it will not be allowed to write the error messages into the system log.
Notice that the server only records messages about its own runtime errors (handled exceptions) into the system logs, not the analyzer-generated diagnostic messages!
Once the build is finished, run CLMonitor.exe in the client mode so that it can generate the preprocessed files and call the static analyzer itself:
CLMonitor.exe analyze -l "c:\test.plog"As the '-l' argument, the full path to the analyzer's log file must be passed.
When running as a client, CLMonitor.exe will connect to the already running server and start generating the preprocessed files. The client will receive the information on all of the compiler invocations that were detected and then the server will terminate. The client, in its turn, will launch preprocessing and PVS-Studio.exe analyzer for all the source files which have been monitored.
When finished, CLMonitor.exe will save a log file (C:\ptest.plog) which can be viewed in Visual Studio PVS-Studio IDE plugin or Compiler Monitoring UI client (Standalone.exe, PVS-Studio|Open/Save|Open Analysis Report).
You can also use the analyzer message suppression mechanism with CLMonitor through the '-u' argument:
CLMonitor.exe analyze -l "c:\ptest.plog" -u "c:\ptest.suppress" -sThe '-u' argument specifies a full path to the suppress file, generated through the 'Message Suppression' dialog in Compiler Monitoring UI client (Standalone.exe, Tools|Message Suppression...). The optional '-s' argument allows you to append the suppress file specified through the -u with newly generated messages from the current analysis run.
You can also run CLMonitor.exe in the client mode so that it can generate the preprocessed files and call the analyzer in intermodular analysis mode:
CLMonitor.exe analyze -l "c:\ptest.plog" --intermodularThe ‑‑intermodular flag enables intermodular analysis mode. In this mode, the analyzer performs a deeper code analysis by increasing the analysis time.
For setting additional display parameters and messages filtration you can pass the path to the file of diagnostics configuration (.pvsconfig) using the argument '-c':
CLMonitor.exe analyze -l "c:\ptest.plog" -c "c:\filter.pvsconfig"If you need to finish monitoring without running the analysis, use the abortTrace:
CLMonitor.exe abortTraceSaving compilation monitoring dump and running analysis from this dump
CLMonitor.exe allows you to save information it gathered from monitoring a compilation process in a dump file. This will make possible re-running the analysis without the need to re-build a project and monitor this build. To save a dump you will first need to run monitoring in a regular way with either trace or monitor commands, as described above. After the build is finished, you can stop monitoring and save dump file. For this, run CLMonitor.exe with the saveDump command:
CLMonitor.exe saveDump -d c:\monitoring.zipYou can also finish monitoring, save dump file and run the analysis on the files that the monitoring have caught. For this, specify a path to the dump file to the CLMonitor.exe analyze command:
CLMonitor.exe analyze -l "c:\ptest.plog" -d c:\monitoring.zipRunning the analysis from the pre-generated dump file is possible with the following command:
CLMonitor.exe analyzeFromDump -l "c:\ptest.plog"
-d c:\monitoring.zipCompilation monitoring dump file is a simple zip archive, containing a list of parameters from compiler processes that CLMonitor had caught (such as process command line arguments, environment variables, current working directory and so on) in an XML format. The analyzeFromDump command supports running the analysis form both the zipped dump file and an un-zipped XML. If you are using an unzipped xml file, make sure that it has the xml extension.
Dump analysis also supports the ability to run analysis in the intermodular mode. To do this, pass the ‑‑intermodular flag, just like in the analysis mode:
CLMonitor.exe analyzeFromDump -l "c:\ptest.plog"
-d c:\monitoring.zip --intermodularUsing compiler monitoring from UI client (Standalone.exe)
For the "manual" check of individual projects with CLMonitor, you can use the interface of the Compiler Monitoring UI client (Standalone.exe) which can be launched from the Start menu.
To start monitoring, open the dialog box: Tools -> Analyze Your Files... (Figure 1):

Figure 1 - The compiler monitoring start dialog box
Click "Start Monitoring" button. CLMonitor.exe process will be launched and the environment main window will be minimized.
Start building your project, and when it's done, click the "Stop Monitoring" button in the bottom right-hand corner of the window (Figure 2):

Figure 2 - The monitoring management dialog box
If the monitoring server has successfully tracked all the compiler launches, the preprocessed files will be generated first and then they will be analyzed. When the analysis is finished, you will see a standard PVS-Studio's report (Figure 3):
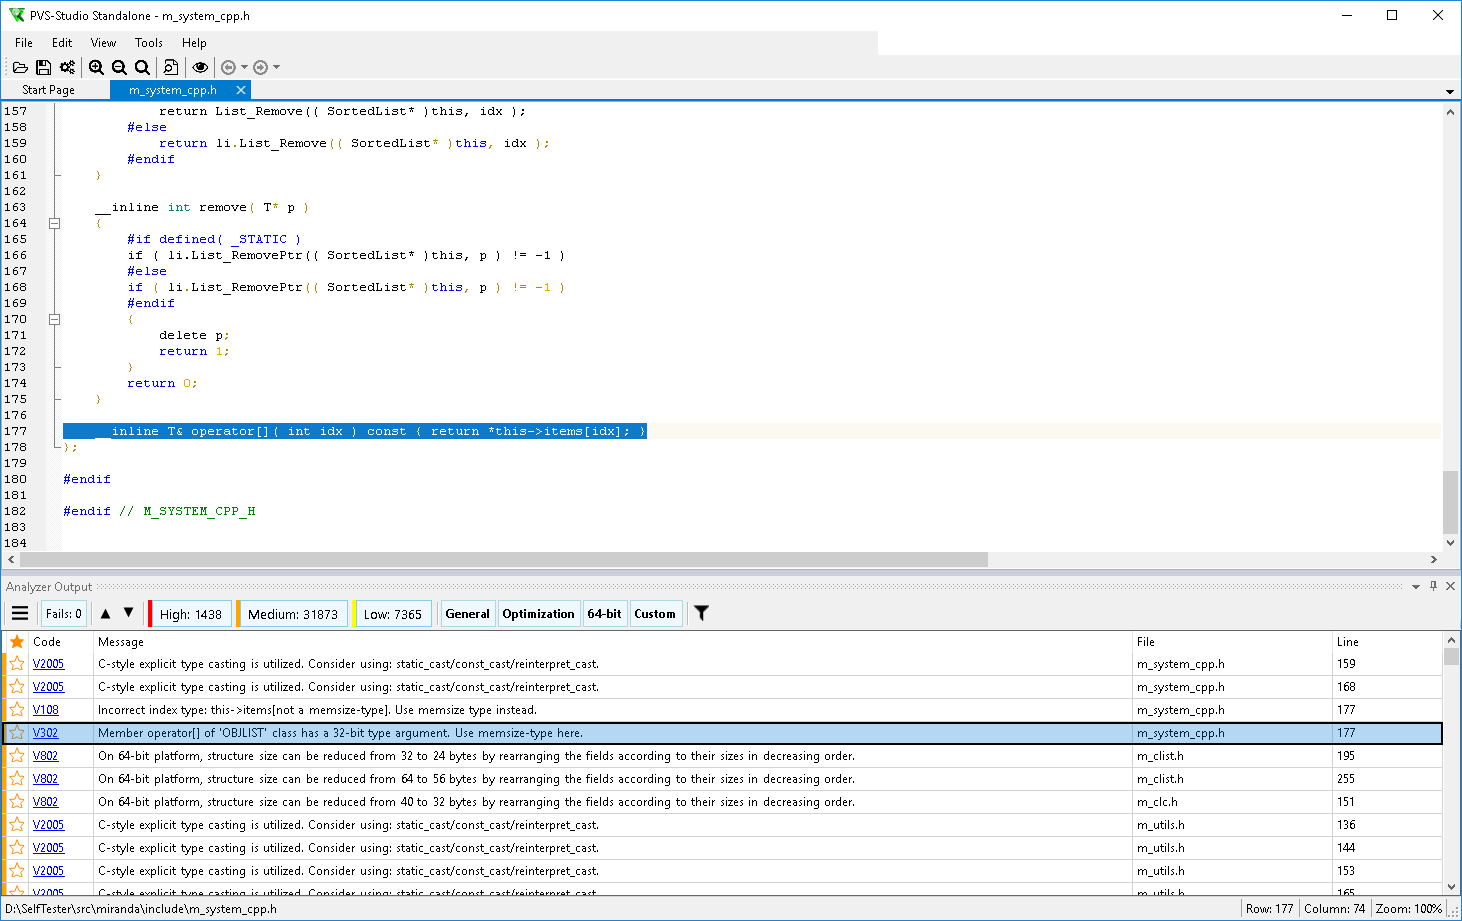
Figure 3 - The resulting output of the monitoring server and the analyzer
The report can be saved as an XML file (a .plog file): File -> Save PVS-Studio Log As...
Compiler monitoring from Visual Studio
A convenient navigation for analyzer messages and source code navigation is available in Visual Studio IDE through PVS-Studio extension. If the project to be analyzed can be opened inside this IDE, but the 'regular' analysis by PVS-Studio (i.e. PVS-Studio|Check|Solution) is not available (for example, for makefile Visual Studio projects), it is still possible to have all the benefits of Visual Studio by loading the analysis results (plog file) into PVS-Studio by the ' PVS-Studio|Open/Save|Open Analysis Report...' command. This action can also be automated, through the use of Visual Studio automation mechanism, by tying it, and also the analysis itself, to the project build event. As an example, let's review the integration of PVS-Studio analysis through compiler monitoring into a makefile project. Such type of projects is used, for instance, by the build system of Unreal Engine projects under Windows.
As a command to run the build of our makefile project, let's specify the run.bat file:
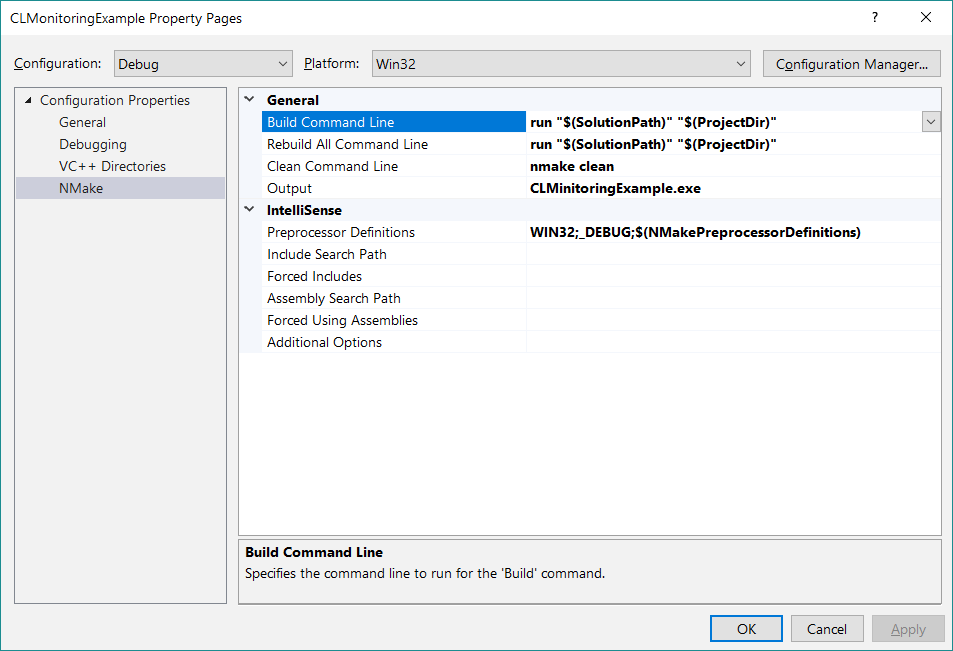
Figure 4 – configuring makefile project
The contents of the run.bat file are the following:
set slnPath=%1
set plogPath="%~2test.plog"
"%ProgramFiles(X86)%\PVS-Studio\CLMonitor.exe" monitor
waitfor aaa /t 10 2> NUL
nmake
"%ProgramFiles(X86)%\PVS-Studio\CLMonitor.exe" analyze -l %plogPath%
cscript LoadPlog.vbs %slnPath% %plogPath%As arguments to run.bat, we pass the paths to solution and project. Compiler monitoring is first launched with CLMonitor.exe. The 'waitfor' command is used as a delay between launching the monitoring and building the project – without it, monitoring might not catch the first compiler invocations. Next step is the build command itself – nmake. After build is finished, we run the analysis, and after this is complete (the analysis results are saved along the project file), we load the results into Visual Studio with the 'LoadPlog.vbs' script. Here is this script:
Set objArgs = Wscript.Arguments
Dim objSln
Set objSln = GetObject(objArgs(0))
Call objSln.DTE.ExecuteCommand("PVSStudio.OpenAnalysisReport",
objArgs(1))Here we use the DTE.ExecuteCommand function from the Visual Studio automation to access our running Visual Studio (in which our solution is currently open) instance directly from the command line. Running this command is virtually identical to clicking the 'PVS-Studio|Open/Save|Open Analysis Report...' menu item in the UI.
To find a running Visual Studio instance, we use the GetObject method. Please take a note that this method uses the solution path to identify the running Visual Studio instance. Therefore, when using it, opening the same solution in several instances of Visual Studio is inadvisable – the method could potentially "miss" and analysis results will be opened inside the wrong IDE instance – not the one that was used to run the build\analysis.
Specifics of the CLMonitor.exe use with Incredibuild
Incredibuild significantly (several times) reduces the project analysis time distributing the execution of processes to several machines. However, the CLMonitor.exe utility cannot monitor remote compiler calls and supports only tracing for local assemblies. Therefore, the result of compiler monitoring analysis launched by Incredibuild may be incorrect.
You can run the analysis through the compiler monitoring that is combined with distributed build. For this, you need to generate a dump from local compiler monitoring. Use CLMonitor.exe (how to generate a dump is described in the previous sections) and Incredibuild to run the dump analysis in distributed mode. More detailed information about the Incredibuild configuration for this mode is available here: "Speeding up the analysis of C/C++ code through distributed build systems (Incredibuild)".
Specifics of monitoring a build process of IAR Embedded Workbench for ARM
Sometimes, IAR Embedded Workbench IDE can set up the current working directory of the compiler process (iccarm.exe) to 'C:\Windows\System32' during the build process. Such behavior can cause issues with the analysis, considering that current working directory of the compiler process is where CLMonitoring stores its intermediate files.
To avoid writing intermediate files to 'C:\Windows\System32', which in turn can cause insufficient access rights errors, a workspace should be opened by double clicking the workspace file ('eww' extension) in Windows explorer. In this case, intermediate files will be stored in the workspace file's directory.
Incremental analysis
In case of necessity of performing the incremental analysis when using the compiler monitoring system, it is enough to "monitor" the incremental build, i.e. the compilation of the files that have been modified since the last build. This way of usage will allow to analyze only the modified/newly written code.
Such a scenario is natural for the compiler monitoring system. Accordingly, the analysis mode (full or analysis of only modified files) depends only on what build is monitored: full or incremental.
Intermodular analysis mode
Enabling this mode allows the analyzer to consider information not only from the analyzed file, but also from files that relate to the analyzed file. This allows for deeper, higher quality analysis. However, it takes extra time to collect the necessary information, which will affect the time you analyze your project.
To run intermodular analysis (the 'analyze' mode) or intermodular analysis from a dump (the 'analyzeFromDump' mode), pass the ‑‑intermodular flag.
Specification of individual files for analysis
The 'analyze' and the 'analyzeFromDump' modes allow you to selectively check a set of source files. The '‑‑sourceFiles' (-f) flag specifies a path to the text file that contains line-by-line paths to the files being checked. Relative file paths will be expanded relative to the current working directory. You can specify both compiled source files (.c, .cpp, etc.), and header files (.h/.hpp).
In the mode of checking the list of source files list, a compilation dependency cache is generated, which will be used for subsequent analysis runs. By default, dependency cache is saved in a special '.pvs-studio' subdirectory by 'CLMonitor.deps.json' name. If necessary, you can change its storage location using the '‑‑dependencyRoot' (-D) flag.
By default, dependency cache keeps full paths to source files of local system. You can generate portable caches by specifying a random root project directory using the '‑‑dependencyCacheSourcesRoot' (-R) flag. Paths will be saved and loaded relative to the project directory.
Wrap Compilers interception mode
The default method of the compilation monitoring may miss some source files. The problem is especially relevant for Embedded projects since their files are written in C language and can be quickly compiled. To ensure that all compilation processes are intercepted, the monitoring utility can use a more aggressive mechanism — through Image File Execution Options (IFEO) of the Windows registry. The mechanism allows to run a special wrapper right before starting each compilation process. Then the wrapper sends the necessary information to the monitoring server and continues to run the compiler. The work of the Wrap Compilers mode is transparent to the build system but requires administrator permissions to make changes to the Windows registry.
To enable this monitoring mode from command line, run the CLMonitor.exe utility in the 'monitor' or 'trace' modes with '‑‑wrapCompilers (-W)' flag that has a list of compilers. The list of compilers is separated by a comma, for example:
CLMonitor.exe trace --wrapCompilers gcc.exe,g++.exeNote that you need to specify the names of the compiler executable files with the .exe extension and without paths.
To enable the interception mode from graphical user interface, fill in the Wrap Compilers field in the monitoring start dialog box.

The IFEO mechanism has its advantages, however some precautions must be observed.
To attach wrappers before starting a process, the monitoring utility modifies the "HKEY_LOCAL_MACHINE\SOFTWARE\Microsoft\Windows NT\CurrentVersion\Image File Execution Options" registry path. In the registry path, a new key is created with the name of the executable file of the process and with the "Debugger" field in that key. The field is used to specify the command to run the wrapper so that the wrapper is launched instead of the process with the specified name of the executable file. A mistake in the field may make it impossible to start some processes. PVS-Studio does not allow to use this mode with an arbitrary set of executable files. You can use the mode only with those executable files that are recognized as well-known compilers. After the monitoring process is successfully completed, the registry entries are returned to their initial state. If the monitoring process is completed abnormally (in case of forced termination, error, or computer shutdown), the registry will not be automatically restored. However, before registry is modified, the monitoring utility creates a recovery file in "%AppData%\PVS-Studio\wrapperBackup.reg". The monitoring utility will use this file to recover the registry to initial state. The monitoring utility will use this file automatically at the next launch. Before automatic recovery, the recovery file is checked. If the file contains suspicious entries, it's not used. It's renamed to "wrapperBackup-rejected.reg". In this case, the rejected recovery file should be checked by the responsible person. The rejection of the file may indicate an incorrect configuration of the utility or the presence of malware on the computer.
Conclusion
Despite the convenience of the "seamless" analysis integration into the automated build process (through CLMonitor.exe) employed in this mode, one still should keep in mind the natural restrictions inherent in this mode. Particularly, that a 100% capture of all the compiler launches during the build process is not guaranteed. This king of failure may be caused both by the influence of the external environment (for example antivirus software) and the hardware-software environment specifics (for example the compiler may terminate too quickly when running on an SSD disk while CPU's performance is too low to "catch up with" this launch).
That's why we recommend you to provide whenever possible a complete integration of the PVS-Studio static analyzer with your build system (in case you use a build system other than MSBuild) or use the corresponding PVS-Studio IDE plugin.
Direct integration of the analyzer into build automation systems (C and C++)
- PVS-Studio analyzer independent mode
- An example of using the analyzer independent mode with Makefile project
- Managing analysis results generated from using command line analyzer mode
- Incremental analysis in independent command line mode
- Using Microsoft IntelliSense with analyzer in independent mode
- Differences in behavior of PVS-Studio.exe console version while processing one file or several files at once
This documentation section describes a deprecated method of running the analysis, which may be removed in future versions.
We recommend utilizing PVS-Studio analyzer through the Microsoft Visual Studio development environments, into which the tool is perfectly integrated. But sometimes you can face situations when command line launch is required, for instance in case of the cross-platform build system based on makefiles.
In case you possess project (.vcproj/.vcxproj) and solution (.sln) files, and command line execution is required for the sake of daily code checks, for instance, we advise you to examine the article "Analyzing Visual C++ (.vcxproj) and Visual C# (.csproj) projects from the command line".
In addition, regardless of the build system being utilized, you can use PVS-Studio compiler monitoring system.
PVS-Studio analyzer independent mode
So, how does a code analyzer work (be it PVS-Studio or any other tool)?
When the analyzer user gives a command to check some file (for example, file.cpp), the analyzer performs preprocessing of this file at first. As a result, all the macros are defined and #include-files are arranged.
The preprocessed i-file can now be parsed by the code analyzer. Pay attention that the analyzer cannot parse a file which has not been preprocessed, for it won't have information about the types, functions and classes being used. Operation of any code analyzer includes at least two steps: preprocessing and analysis itself.
It is possible that C++ sources do not have project files associated with them, for example it is possible in case of multiplatform software or old projects which are built using command line batch utilities. Various Make systems are often employed to control building process in such cases, Microsoft NMake or GNU Make for instance.
To analyze such projects it is necessary to embed the direct call for the analyzer into building process (by default, the file is located at 'programfiles%\PVS-Studio\x64\PVS-Studio.exe') , and to pass all arguments required for preprocessing to it. In fact the analyzer should be called for the same files for which the compiler (cl.exe in case of Visual C++) is being called.
The PVS-Studio analyzer should be called in batch mode for each C/C++ file or for a whole group of files (files with c/cpp/cxx etc. extensions, the analyzer shouldn't be called for header h files) with the following arguments:
PVS-Studio.exe --cl-params %ClArgs%
--source-file %cppFile% --cfg %cfgPath% --output-file %ExtFilePath%%ClArgs% — arguments which are passed to cl.exe compiler during regular compilation, including the path to source file (or files).
%cppFile% — path to analyzed C/C++ file or paths to a collection of C/C++ files (the filenames should be separated by spaces)
%ClArgs% and %cppFile% parameters should be passed to PVS-Studio analyzer in the same way in which they are passed to the compiler, i.e. the full path to the source file should be passed twice, in each param.
%licPath% — the path to the PVS-Studio license file.
%cfgPath% — path to PVS-Studio.cfg configuration file. This file is shared between all C/C++ files and can be created manually (the example will be presented below)
%ExtFilePath% — optional argument, a path to the external file in which the results of analyzer's work will be stored. In case this argument is missing, the analyzer will output the error messages into stdout. The results generated here can be viewed in Visual Studio's 'PVS-Studio' toolwindow using 'PVS-Studio/Open Analysis Report' menu command (selecting 'Unparsed output' as a file type). Please note, that starting from PVS-Studio version 4.52, the analyzer supports multi-process (PVS-Studio.exe) output into a single file (specified through ‑‑output-file) in command line independent mode. This allows several analyzer processes to be launched simultaneously during the compilation performed by a makefile based system. The output file will not be rewritten and lost, as file blocking mechanism had been utilized.
Consider this example for starting the analyzer in independent mode for a single file, utilizing the Visual C++ preprocessor (cl.exe):
PVS-Studio.exe --cl-params "C:\Test\test.cpp" /D"WIN32" /I"C:\Test\"
--source-file "C:\Test\test.cpp" --cfg "C:\Test\PVS-Studio.cfg"
--output-file "C:\Test\test.log" --lic-file ...The PVS-Studio.cfg (the ‑‑cfg parameter) configuration file should include the following lines:
exclude-path = C:\Program Files (x86)\Microsoft Visual Studio 10.0
vcinstalldir = C:\Program Files (x86)\Microsoft Visual Studio 10.0\VC\
platform = Win32
preprocessor = visualcpp
language = C++
skip-cl-exe = noLet's review these parameters:
- The exclude-path parameter contains the directories for which the analysis will not be performed. If the Visual Studio directory is not included here, the analyzer will generate error messages for its' header .h-files. But you of course cannot modify them. Therefore we recommend you to always add this path to the exclusions. It is also possible to set multiple exclude-path parameters.
- The vcinstalldir parameter indicates the directory in which the utilized preprocessor is located. The supported preprocessors are: Microsoft Visual C++ (cl.exe), Clang(clang.exe) and MinGW (gcc.exe).
- The platform parameter points to the correct version of the compiler — Win32, x64, Itanium or ARMV4. It is usually Win32 or x64.
- The preprocessor parameter indicates which preprocessor should be located at vcinstalldir. Supported values are: visualcpp, clang, gcc. Generally, one should select the preprocessor according to the compiler being used by the build automation system in question.
- The 'language' parameter determines the version of C/C++ language within the code of the file being verified (‑‑source-file) which is expected by the analyzer during its' parsing process. Possible values are: C, C++, C++CX, C++CLI. As each of the supported language variants does contain specific key words, the incorrect assignment of this parameter could potentially lead to the V001 parsing error messages.
You can filter diagnostics messages generated by analyzer using analyzer-errors and analysis-mode parameters (set them in cfg file of pass through command line). These parameters are optional.
- The analyzers-errors parameter allows you to set the codes for errors in which you are interested. For example: analyzer-errors=V112 V111. We do not recommend setting this parameter.
- The analysis-mode parameter allows you to control the analyzers being used. Values: 0 - full analysis (by default), 1 - only 64 bit analysis, 4 - only general-purpose analysis, 8 - only optimization analysis. The recommended value is 4.
Also there is a possibility to pass the analyzer a ready-made prepossessed file (i-file), by missing the preprocessing phase and by getting to the analysis. To do this, use the parameter skip-cl-exe, specifying yes. In this mode there is no need to use cl-params parameter. Instead, specify the path to the file (‑‑i-file) and set the type of the preprocessor, used to create this i-file. Specifying the path to the source file (‑‑source file) is also necessary. Despite the fact that the i-file already contains the necessary information for analysis, it may be needed to compare the i-file with the file of the source code, for example, when the analyzer has to look at unexpanded macro. Thus, the call of the analyzer in the independent mode with the specified i-file for the preprocessor Visual C++ (cl.exe) could be:
PVS-Studio.exe --source-file "C:\Test\test.cpp"
--cfg "C:\Test\PVS-Studio.cfg" --output-file "C:\Test\test.log"The configuration file PVS-Studio.cfg (parameter ‑‑cfg) should contain the following lines:
exclude-path = C:\Program Files (x86)\Microsoft Visual Studio 10.0
vcinstalldir = C:\Program Files (x86)\Microsoft Visual Studio 10.0\VC\
platform = Win32
preprocessor = visualcpp
language = C++
skip-cl-exe = yes
i-file = C:\Test\test.iThe full list of command line switches will be displayed with this argument:
PVS-Studio.exe –helpIt should be noted that when calling PVS-Studio.exe directly, the license information stored in the file 'Settings.xml' is not used. When running PVS-Studio.exe, you should explicitly specify the path to a separate file with the license. This is a text file in the UTF-8 encoding, consisting of the two lines: the name and the key.
The path to the file with the license can be either specified in the PVS-Studio configuration file or passed as a command-line argument. Appropriate parameter: lic-file.
For example, to specify the path to the license file in the .cfg file, you should add the following line:
lic-file = D:\Test\license.licAn example of using the analyzer independent mode with Makefile project
For example let's take the Makefile project which is build using VisualC++ compiler and it is declared in the project's makefile like this:
$(CC) $(CFLAGS) $<
The $(CC) macro calls cl.exe, the compilation parameters $(CFLAGS) are passed to it and finally all C/C++ files on which the current build target is dependent are inserted using the $< macro. Thereby the cl.exe compiler will be called with required compilation parameters for all source files.
Let's modify this script in such a way that every file is analyzed with PVS-Studio before the compiler is called:
$(PVS) --source-file $< --cl-params $(CFLAGS) $<
--cfg "C:\CPP\PVS-Studio.cfg"
$(CC) $(CFLAGS) $<$(PVS) - path to analyzer's executable (%programfiles%\PVS-Studio\x64\PVS-Studio.exe). Take into account that the Visual C++ compiler is being called after the analyzer on the next line with the same arguments as before. This is done to allow for all targets to be built correctly so the build would not stop because of the lack of .obj-files.
Managing analysis results generated from using command line analyzer mode
PVS-Studio tool has been developed to work within the framework of Visual Studio environment. And launching it from the command line is the function that is additional to the main working mode. However, all of analyzer's diagnostic capabilities are available.
Error messages, which were generated in this mode, could be easily redirected into the external file with the help of ‑‑output-file command line switch. This file will contain the unprocessed and unfiltered analyzer output.
Such a file could be viewed in PVS-Studio IDE extension or C and C++ Compiler Monitoring UI (Standalone.exe) by using 'Open Analysis Report' menu command (select 'Unparsed output' as a file type) and afterwards it could be saved in a standard PVS-Studio log file (plog) format. This allows you to avoid the duplication of error messages and also to use all of the standard filtering mechanisms for them.
In addition, the 'raw' unparsed output can be converted to one of the supported formats (xml, html, csv and so on) by using the PlogConverter command line tool.
Incremental analysis in independent command line mode
The users who are familiar with PVS-Studio incremental analysis mode within the IDE naturally will miss this feature in the command line mode. But fortunately, almost any build system could provide an incremental analysis just "out of the box", because by invoking "make" we recompile only file which were modified. So the incremental analysis will be automatically provided by using the independent command line version.
Using Microsoft IntelliSense with analyzer in independent mode
Although it is possible to open the unfiltered text file containing analyzer diagnostic messages from within the IDE into PVS-Studio Output window (which itself will allow you to use file navigation and filtering mechanisms), you will only be able to use the code text editor inside the Visual Studio itself, as the additional IntelliSense functionality will be unavailable (that is, autocompletion, type declarations and function navigation, etc.). And all this is quite inconvenient, especially while you are handling the analysis results, even more so with the large projects, forcing you to search class and method declarations manually. As a result the time for handling a single diagnostic message will be greatly increased.
To solve this issue, you need to create an empty Visual C++ project (Makefile based one for instance) in the same directory with C++ files being verified by the analyzer (vcproj/vcxproj file should be created in the root folder which is above every file verified). After creating an empty project you should enable the 'Show All Files' mode for it (the button is in the upper part of the Solution Explorer window), which will display all the underlying files in the Solution Explorer tree view. Then you will be able to use the 'Include in Project' context menu command to add all the necessary c, cpp and h files into your project (You will also probably have to add include directory paths for some files, for instance the ones containing third-party library includes). If including only a fraction of the files verified, you also should remember that IntelliSense possibly will not recognize some of the types from within these files, as these types could be defined right in the missing files which were not included by you.

Figure 1 — including files into the project
The project file we created could not be used to build or verify the sources with PVS-Studio, but still it will substantially simplify handling of the analysis results. Such a project could also be saved and then used later with the next iteration of analyzer diagnostics results in independent mode.
Differences in behavior of PVS-Studio.exe console version while processing one file or several files at once
The cl.exe compiler is able to process source files as either one at a time or as a whole group of files at once. In the first case the compiler is called several times for each file:
cl.exe ... file1.cpp
cl.exe ... file2.cpp
cl.exe ... file2.cppIn the second case it is called just once:
cl.exe ... file1.cpp file2.cpp file3.cppBoth of these modes are supported by the PVS-Studio.exe console version as demonstrated above in the examples.
It could be helpful for a user to understand the analyzer's logics behind theses two modes. If launched individually, PVS-Studio.exe will firstly invoke the preprocessor for each file and the preprocessed file will be analyzed after it. But when processing several files at once, PVS-Studio.exe will firstly preprocess all these files and then separate instances of PVS-Studio.exe will be invoked individually for each one of the resulting preprocessed files.
Analysis of Unreal Engine projects
- Analysis using compiler monitoring
- Running the analysis of Unreal Engine projects on Linux
- Issues with running the PVS-Studio analyzer on Unreal Engine 5.0.0, 5.0.1, and 5.0.2
- Analysis using UnrealBuildTool integration
- Integrating PVS-Studio via the compile flag
- Integrating PVS-Studio via the target file
- Integrating PVS-Studio via the Build Configuration file
- Incremental analysis
- How to calculate the path to the UnrealBuildTool actions cache file when modifying the build scripts
- How to check the Unreal Engine source code
- How to enable various diagnostic groups and other additional settings
- Performance optimization of Unreal Engine project analysis
- Handling the analysis results
- How to exclude files from the analysis with PathMasks
- Baselining analysis results in Unreal Engine projects
- Troubleshooting
Unreal Engine projects analysis is available only under the PVS-Studio Enterprise license. You can request the trial Enterprise license here.
A specialized build system called Unreal Build System is used for building Unreal Engine projects on Windows. This system is integrated over the build system used by the Visual Studio \ JetBrains Rider environment (MSBuild) by utilizing autogenerated makefile MSBuild projects. This is a special type of Visual C++ (vcxproj) projects in which the execution of the build is relegated to the execution of a command calling a third-party utility, for example (but not necessarily), Make. The use of makefile projects allows working with source code of Unreal Engine from Visual Studio \ JetBrains Rider environment, taking advantage of such features as code autocompletion, syntax highlighting, symbol navigation, etc.
Because makefile MSBuild projects themselves do not contain full information, necessary to perform the compilation, and therefore, preprocessing of C/C++ source files, PVS-Studio does not support the analysis of such projects from within Visual Studio, or by PVS-Studio_Cmd.exe command line tool. Therefore, to analyze such projects with PVS-Studio, you can go two ways - monitoring of compiler invocations (Compiler Monitoring) and direct integration of the PVS-Studio.exe C/C++ analyzer in the UnrealBuildTool utility. Let's consider these options in more detail.
Analysis using compiler monitoring
Unreal Build System uses the Visual C++ compiler-cl.exe for building on Windows. This compiler is supported by the system of PVS-Studio compiler monitoring on Windows. It can be both used from the C and C++ Compiler Monitoring UI or from CLMonitor.exe command line tool.
Compiler monitoring can be launched manually from within the Compiler Monitoring UI or it can be assigned to the event of starting\ending builds in Visual Studio. The result of the analysis by the monitoring system is a plog XML report file, which you can open from the Visual Studio PVS-Studio extension, or convert to one of the standard formats (txt, html, csv) using the PlogConverter special tool.
A more detailed description for the system of compiler monitoring is available in this section of the documentation. We recommend using this way to run the analysis when you want to check it for the first time and get acquainted with the analyzer, as this way is the easiest one to set up.
Running the analysis of Unreal Engine projects on Linux
To analyze the Unreal engine project, you need to first trace its full build. A project on Linux is built with the AutomationTool script.
pvs-studio-analyzer trace -- \
<UnrealEngine source location>/UnrealEngine/Engine/
Build/BatchFiles/RunUAT.sh \
BuildCookRun -project="<Project path>/<Project name>.uproject" \
-build -Clean -targetplatform=Linux ....
pvs-studio-analyzer analyze ....You can find the full documentation for the pvs-studio-analyzer utility on the page "Cross-platform analysis of C and C++ projects in PVS-Studio".
Instructions for working with the report obtained after the analysis can be found here: "How to view and convert analyzer's results".
Issues with running the PVS-Studio analyzer on Unreal Engine 5.0.0, 5.0.1, and 5.0.2
Unreal Engine 5.0.0, 5.0.1, and 5.0.2 has a bug because of which Unreal Engine Build Tool can't find the analyzer core on the default path: %ProgramFiles(x86)%\PVS-Studio\x64\PVS-Studio.exe:

As of now, there's a temporary solution — you need to copy the PVS-Studio.exe file from the "%ProgramFiles(x86)%\PVS-Studio\x64" folder to "...\UE_5.0\Engine\Restricted\NoRedist\Extras\ThirdPartyNotUE\PVS-Studio".
Important. This bug has been fixed in Unreal Engine 5.0.3.
This section describes the analysis of Unreal Engine projects on Windows operating system.
Analysis using UnrealBuildTool integration
In case of Unreal Build System, the developers from Epic Games provide the opportunity to use PVS-Studio through the direct integration with the build utility called UnrealBuildTool, starting from Unreal Engine 4.17.
Before starting the analysis, you should enter your license for the analyzer. For this you need to enter your data in IDE:
- 'PVS-Studio|Options...|Registration' in Visual Studio;
- 'Toos|PVS-Studio|Settings...|Registaration' in JetBrains Rider.
Please note, that before Unreal Engine version 4.20, UBT was unable to get the license information from the PVS-Studio common settings file. In case UBT does not recognize a license entered via UI, you should create a separate license file with the name of PVS-Studio.lic and place it to the '%USERPROFILE%\AppData\Roaming\PVS-Studio' directory.
Note 1. When integrating PVS-Studio with the UnrealBuildTool, the project will not be built. This is because UnrealBuildTool replaces the build process with an analysis process.
Integrating PVS-Studio via the compile flag
UnrealBuildTool allows to run the PVS-Studio analysis by adding the following flag in the command line:
-StaticAnalyzer=PVSStudioFor instance, a full command line of UnrealBuildTool might look as follows:
UnrealBuildTool.exe UE4Client Win32 Debug -WaitMutex -FromMsBuild
-StaticAnalyzer=PVSStudio -DEPLOYTo enable analysis when running from IDE, open the project properties for the chosen configuration:
- 'Properties|Configuration Properties|NMake' in Visual Studio;
- 'Properties|NMake' in JetBrains Rider;
and add the flag -StaticAnalyzer=PVSStudio in the build and rebuild options (Build Command Line / Rebuild All Command Line).
Note 1. Note that in this usage scenario, the project won't be built. Instead, all (on Rebuild command) or changed (on Build command) project files are preprocessed and then the project is analyzed.
Note 2. PVS-Studio integration with UnrealBuildTool supports not all analyzer settings, available from Visual Studio (PVS-Studio|Options...). At the moment, PVS-Studio supports adding exceptions for specific directories through 'PVS-Studio|Options...|Don't Check Files', enabling various diagnostic groups, filtration of loaded analysis results through 'Detectable Errors'.
Note 3. This approach is not supported if uproject file is opened directly in Rider. Please check the solutions for configuring uproject build below.
Note 4. When using Unreal Engine version 5.3, the analysis may crash due to inability to find generated.h files of the Unreal Engine itself. The problem is in the way UE 5.3 runs the analysis. When you start analysis using the flag, Unreal Build Tool creates additional folder named 'UnrealEditorSA' in the folder for intermediate files. This folder is defined as the one in which to look for header files. The files of a project go into this folder, but the UE's do not. At the same time, the engine header files can be used in the project. This issue has been fixed in Unreal Engine 5.4. To solve the problem while continuing to use Unreal Engine 5.3, use integration via the target file.
Integrating PVS-Studio via the target file
You can integrate PVS-Studio into the build process by modifying the target file. This scenario would be more convenient in case you often re-generate your project files.
For this, you need to add the 'StaticAnalyzer' parameter with the 'PVSStudio' value:
For version 5.0 and below:
public MyProjectTarget(TargetInfo Target) : base(Target)
{
...
WindowsPlatform.StaticAnalyzer = WindowsStaticAnalyzer.PVSStudio;
...
}For version 5.1 and higher:
public MyProjectTarget(TargetInfo Target) : base(Target)
{
...
StaticAnalyzer = StaticAnalyzer.PVSStudio;
...
}The UnrealBuildTool will now automatically start analyzing your project.
Integrating PVS-Studio via the Build Configuration file
You can integrate PVS-Studio into the build process by modifying BuildConfiguration.xml.
This file can be found under the below paths:
- Engine/Saved/UnrealBuildTool/BuildConfiguration.xml
- User Folder/AppData/Roaming/Unreal Engine/UnrealBuildTool/BuildConfiguration.xml
- My Documents/Unreal Engine/UnrealBuildTool/BuildConfiguration.xml
Kindly find below an example of minimal working configuration:
<?xml version="1.0" encoding="utf-8" ?>
<Configuration xmlns="https://www.unrealengine.com/BuildConfiguration">
<BuildConfiguration>
<StaticAnalyzer>
PVSStudio
</StaticAnalyzer>
</BuildConfiguration>
</Configuration>Note 1. Versions of Unreal Engine below 5.1 require another configuration Please check the relevant documentation and the minimal working configuration:
<?xml version="1.0" encoding="utf-8" ?>
<Configuration xmlns="https://www.unrealengine.com/BuildConfiguration">
<WindowsPlatform>
<StaticAnalyzer>
PVSStudio
</StaticAnalyzer>
</WindowsPlatform>
</Configuration>Incremental analysis
It may take a long time to analyze the whole project. Incremental analysis helps speed up the analysis by checking only those files that have been modified since the last build. Incremental analysis starts running only if you have previously performed a full build of the project. To run the incremental analysis, you need to build your Unreal Engine project (Build).
For example, if a project contains A.cpp, B.cpp and C.cpp files, then the first time you "build" (analyze) a project in the Unreal Engine versions up to 4.25, all files are analyzed. The next time the project is "built" (analyzed), if no files have been modified, no files are analyzed either. However, if A.cpp and B.cpp files are modified, only these two files will be analyzed.
Important. In UE 4.25 version or newer, instead of modified files, all files from Unreal Engine modules that include modified files will be analyzed during the project "build" (analysis). For example, suppose there is a previously built project that contains two models — "A_Module" and "B_Module". "A_Module" includes A1.cpp and A2.cpp files, and "B_Module" includes B1.cpp and B2.cpp files. If you modify the B2.cpp file and "build" (analyze) the project, both B1.cpp and B2.cpp files from "B_Module" module will be analyzed. This change made incremental analysis worse because now it analyzes all files from a module if at least one file in it has been modified. However, even now the incremental analysis can speed up the project analysis time if the project is divided into modules.How to use the analyzer with the project build (for Unreal Engine versions 4.22 and higher)
If you need to configure a simultaneous project build and its analysis in terms of one Visual Studio configuration, you can create auxiliary scripts (for our example let's name them BuildAndAnalyze and RebuildAndAnalyze, respectively) based on standard Build and Rebuild scripts.
The main change in the RebuildAndAnalyze script is a call for building a new script BuildAndAnalyze.bat, but not Build.bat.
In the BuildAndAnalyze script you need to add removal of actions cache and run of UnrealBuildTool with the analysis flag after performing a successful build.
Actions performed by UBT (builds, analysis and so on) are saved in cache.
Restoring the cache from the backup is needed to restore saved build actions. If UBT hasn't found saved build actions - build will be re-run.
Removing/restoring the cache is needed in order not to save the analysis actions, but not to lose actions on the project build at the same time. It is necessary not to save the analysis actions to the cache because the unmodified files will not be checked if the analysis is performed by the updated version of the analyzer, in which new diagnostic rules were added. Deleting/restoring the cache allows you to avoid this situation. Because of this, even unmodified files will be checked by the new diagnostics, as a result, these diagnostics may detect potential errors or vulnerabilities that were not detected before.
Note 1. Changes described above are based on the standard Build script and the standard script command line. In case if the modified script or non-standard order of arguments is used, additional changes may be required.
Initially, you need to define the number of variables that are needed to remove/restore the action cache file.
Note 2. Cache files in various Unreal Engine versions may differ in both extension and location. Take this into account when creating scripts.
SET PROJECT_NAME=%1%
SET PLATFORM=%2%
SET CONFIGURATION=%3%
SET UPROJECT_FILE=%~5
for %%i in ("%UPROJECT_FILE%") do SET "PROJECT_PATH=%%~dpi"
SET PREFIX=%PROJECT_PATH%Intermediate\Build\%PLATFORM%
SET ACTIONHISTORY_PATH=....
SET ACTIONHISTORY_BAC_PATH= "%ACTIONHISTORY_PATH:"=%.bac"For various engine versions, the corresponding ACTIONHISTORY_PATH value must be set in the script fragment above.
How to calculate the path to the UnrealBuildTool actions cache file when modifying the build scripts
For versions 4.21 and 4.22
SET ACTIONHISTORY_PATH="%PREFIX%\%PROJECT_NAME%\ActionHistory.bin"For versions 4.23 and 4.24
SET ACTIONHISTORY_PATH="%PREFIX%\%PLATFORM%\%PROJECT_NAME%\ActionHistory.dat"For version 4.25
SET ACTIONHISTORY_PATH="%PREFIX%\%PROJECT_NAME%\ActionHistory.dat"For versions 4.26 and 4.27
REM If you have the build configurations for Client/Server,
REM you need to take them into account when defining the UE_FOLDER variable.
echo %PROJECT_NAME% | findstr /c:"Editor">nul ^
&& (SET UE_FOLDER=UE4Editor) || (SET UE_FOLDER=UE4)
SET ACTIONHISTORY_PATH="%PREFIX%\%UE_FOLDER%\%CONFIGURATION%\ActionHistory.bin"For versions 5.0 and higher
REM If you have the build configurations for Client/Server,
REM you need to take them into account when defining the UE_FOLDER variable.
echo %PROJECT_NAME% | findstr /c:"Editor">nul ^
&& (SET UE_FOLDER=UnrealEditor) || (SET UE_FOLDER=UnrealGame)
SET ACTIONHISTORY_PATH="%PREFIX%\%UE_FOLDER%\%CONFIGURATION%\ActionHistory.bin"After calling UnrealBuildTool for building (and the command 'popd') you need to add the following code:
SET "UBT_ERR_LEVEL=!ERRORLEVEL!"
SET "NEED_TO_PERFORM_ANALYSIS="
IF "!UBT_ERR_LEVEL!"=="0" (
SET "NEED_TO_PERFORM_ANALYSIS=TRUE"
)
IF "!UBT_ERR_LEVEL!"=="2" (
SET "NEED_TO_PERFORM_ANALYSIS=TRUE"
)
IF DEFINED NEED_TO_PERFORM_ANALYSIS (
pushd "%~dp0\..\..\Source"
ECHO Running static analysis
IF EXIST %ACTIONHISTORY_PATH% (
ECHO Backup %ACTIONHISTORY_PATH%
COPY %ACTIONHISTORY_PATH% %ACTIONHISTORY_BAC_PATH%
ECHO Removing %ACTIONHISTORY_PATH%
DEL %ACTIONHISTORY_PATH%
)
..\..\Engine\Binaries\DotNET\UnrealBuildTool.exe
%* -StaticAnalyzer=PVSStudio -DEPLOY
popd
IF EXIST %ACTIONHISTORY_BAC_PATH% (
ECHO Recovering %ACTIONHISTORY_PATH%
COPY %ACTIONHISTORY_BAC_PATH% %ACTIONHISTORY_PATH%
ECHO Removing %ACTIONHISTORY_BAC_PATH%
DEL %ACTIONHISTORY_BAC_PATH%
)
)The most important operations from the code above are the cache removal and recovery as well as the run of UnrealBuildTool with the flag -StaticAnalyzer=PVSStudio to perform the analysis.
If needed, use the modified script when working from the IDE environment. For this, you need to specify it as the one you use in the project properties:
- 'Properties|Configuration Properties|NMake|Build Command Line' in Visual Studio;
- 'Properties |NMake|Build Command Line' in JetBrains Rider.
Note. Note that when using modified scripts, you don't need to specify the flag -StaticAnalyzer=PVSStudio in the script launching arguments, as it's already set in the script when running UnrealBuildTool for the analysis.
How to check the Unreal Engine source code
Checking the Unreal Engine code is no different from checking any other UE project.
In both cases, all files submitted for the build are analyzed. If Unreal Engine modules are to be built when the project is built, they are also checked.
To analyze a single Unreal Engine solution, add the code shown in the Integrating PVS-Studio via the target file documentation section to UnrealEditor.Target.cs (located in the UnrealEngine/Engine/Source directory):
Next, run the build with an Editor target (for example, Development Editor).
You can also use the second way to run the analysis.
Open the UE* project properties. In the NMake item, select the Build Command Line field and add the following flag to the command:
-StaticAnalyzer=PVSStudioThen, run the Unreal Engine build.
How to enable various diagnostic groups and other additional settings
Via modifying target files
Starting from version 4.25 of Unreal Engine, you can enable various diagnostic groups.
To select the desired diagnostic groups, you need to modify the project's target files.
For example, you can enable diagnostics of micro-optimizations the following way:
public MyUEProjectTarget( TargetInfo Target) : base(Target)
{
....
WindowsPlatform.PVS.ModeFlags =
UnrealBuildTool.PVSAnalysisModeFlags.Optimizations;
}Valid values for enabling the appropriate diagnostic groups are:
- Check64BitPortability;
- GeneralAnalysis;
- Optimizations;
- CustomerSpecific;
- MISRA.
To enable several groups of diagnostics, use the '|' operator:
WindowsPlatform.PVS.ModeFlags =
UnrealBuildTool.PVSAnalysisModeFlags.GeneralAnalysis
| UnrealBuildTool.PVSAnalysisModeFlags.Optimizations;Starting with Unreal Engine 5.1, you can use several more settings that can be specified in target files:
- AnalysisTimeoutFlag;
- EnableNoNoise;
- EnableReportDisabledRules.
WindowsPlatform.PVS.AnalysisTimeoutFlag sets the timeout for the analysis of one file. One of the values of the AnalysisTimeoutFlags enumeration can be assigned to this property:
- After_10_minutes (10 minutes per file);
- After_30_minutes (30 minutes per file);
- After_60_minutes (60 minutes per file);
- No_timeout (no time limit for analyzing one file).
WindowsPlatform.PVS.EnableNoNoise disables the generation of Low Certainty (Level 3) messages.
WindowsPlatform.PVS.EnableReportDisabledRules enables the display of exceptions to analyzer rules, which can be specified in comments and .pvsconfig files. Messages about where the analyzer rule exclusion information came from are displayed in the analysis results as warnings with code V012.
Via the interface of plugins for Rider/Visual Studio
If the target file enables using settings from the Settings.xml file:
public MyUEProjectTarget( TargetInfo Target) : base(Target)
{
....
WindowsPlatform.PVS.UseApplicationSettings = true;
}then you can specify the settings via the interface of plugins for Visual Studio or Rider.
In Visual Studio, the settings to enable or disable diagnostics groups are located in 'Extensions -> PVS-Studio -> Options... -> Detectable Errors (C, C++)':

In Rider, the settings to enable or disable diagnostics groups are located in 'Tools -> PVS-Studio -> Settings... -> Warnings':

Starting with Unreal Engine 5.1, some additional settings became available via the interface of plugins for Rider and Visual Studio.
In Visual Studio, go to 'Extensions -> PVS-Studio -> Options... -> Specific Analyzer Settings -> Analysis':

In Rider, go to 'Tools -> PVS-Studio -> Settings... -> Analysis -> Analysis Timeout':

Performance optimization of Unreal Engine project analysis
Disabling Unity Build during the analysis
By default, UnrealBuildTool merges translation units into large files to optimize the build. Such behavior helps optimize build time but can interfere with the code analysis. You may run out of memory because the analyzer checks large files.
We strongly recommend disabling Unity Build to avoid the memory shortage issue during the analysis.
You can disable Unity Build in the *.Traget.cs file by setting bUseUnityBuild = false;
If you want the setting to affect only the analysis process without slowing down the build, add the following to the *.Target.cs file:
For Unreal Engine 5.0 and lower:
public UE4ClientTarget(TargetInfo Target) : base(Target)
{
...
if (WindowsPlatform.StaticAnalyzer == WindowsStaticAnalyzer.PVSStudio)
{
bUseUnityBuild = false;
}
...
}
For Unreal Engine 5.1 and higher:
public UE5ClientTarget(TargetInfo Target) : base(Target)
{
...
if (StaticAnalyzer == StaticAnalyzer.PVSStudio)
{
bUseUnityBuild = false;
}
...
}To run the analysis, specify the -StaticAnalyzer=PVSStudio flag in the NMake build command. UnrealBuildTool will disable Unity Build when the StaticAnalyzer parameter is set to PVSStudio.
Disabling the Unreal Engine core analysis
Since Unreal Engine 5.4, a setting to run the analyzer only on project files (skipping the Unreal Engine core module) is available. It enables you to significantly speed up the analysis process.
To enable the setting, add the following flag to the UnrealBuildTool command line:
-StaticAnalyzerProjectOnlyIn the target.cs file, you can enable this setting as follows:
bStaticAnalyzerProjectOnly = true;Disabling the analysis of auto-generated files
To disable the analysis of auto-generated files, use the guidelines for excluding files from the analysis using PathMasks. Add the *.gen.cpp mask to the PathMasks plugin setting.
Note: starting with Unreal Engine 5.4, the analysis of auto-generated files is disabled by default. You can use the ‑StaticAnalyzerIncludeGenerated flag to enable it again.
Configuring the warning output of UnrealBuildTool
Unreal Engine 5.4 introduced a setting that sets the level of warnings issued by UnrealBuildTool during the analysis. It does not affect PVS-Studio's work but may cause a slowdown when receiving a report. The setting is enabled by default (value = 1).
Disabling (value = 0) helps to avoid the above problem. To do this, add the following flag to the UnrealBuildTool command line:
-StaticAnalyzerPVSPrintLevel=0In the target.cs file, you can do it as follows:
StaticAnalyzerPVSPrintLevel = 0;How to run the analysis automatically
To run the analysis automatically (for example, in CI/CD systems or scripts), just call the project build command.
To get the build command, open the project properties and select the NMake item. The Build Command Line field contains the searched command.
If you integrate PVS-Studio using the .target.cs file or BuildConfiguration.xml file, just use the given build command. If you integrate PVS-Studio using the UnrealBuildTool flag, add it to the build command.
The build command may look like this:
"Path_to_UE\Engine\Build\BatchFiles\Build.bat" ProjectGame Win64 DebugGame ^
-Project="Path_to_projet\ProjcetGame.uproject" ^
-WaitMutex -FromMsBuild -StaticAnalyzer=PVSStudioHandling the analysis results
The path to the file with the analysis results will be displayed in the Output (Build) Visual Studio window (or stdout, if you launched Unreal Build manually from the command line). This file with results is unparsed - it can be opened in IDE:
- by the command 'PVS-Studio|Open/Save|Open Analysis Report' by choosing the 'unparsed output' file type in Visual Studio;
- by the command 'Tools|PVS-Studio|Open Report' in JetBrains Rider.
Or you can convert the analysis results using the utility PlogConverter in the way it was described in the section for the XML log above.
You can read more about handling the list of diagnostic warnings in the article "Handling the diagnostic messages list". As for working with the analyzer report - check out the article "Managing XML Analyzer Report (.plog file)".
Automatic loading/uploading of logs in IDE
Automatic loading of the analysis log in the PVS-Studio output window when working in IDE is more convenient. For such a scenario, you need to enable the appropriate option:
- 'PVS-Studio|Options|Specific Analyzer Settings|Save/Load (analyzer report)|AutoloadUnrealEngineLog' in Visual Studio;
- 'Tools | PVS-Studio|Settings...|Settings|Save/Load (analyzer report)|Autoload Unreal Engine Log' in JetBrains Rider.
How to exclude files from the analysis with PathMasks
You can specify the directory masks in the settings of the PVS-Studio plugin for Visual Studio, the PVS-Studio plugin for Rider, and C and C++ Compiler Monitoring UI utility (Standalone.exe). If the full path to the file contains a fragment that matches with one of the PathMasks' masks, this file will be excluded from the analysis.
Important. For Unreal Engine projects, only directory masks (PathMasks) are relevant, but not file name masks (FileNameMasks).
In the plugin for Visual Studio, these settings are located in Extensions > PVS-Studio > Options... > Don't Check Files:

In Rider, masks for excluding directories are located in Tools > PVS-Studio > Settings > Excludes:
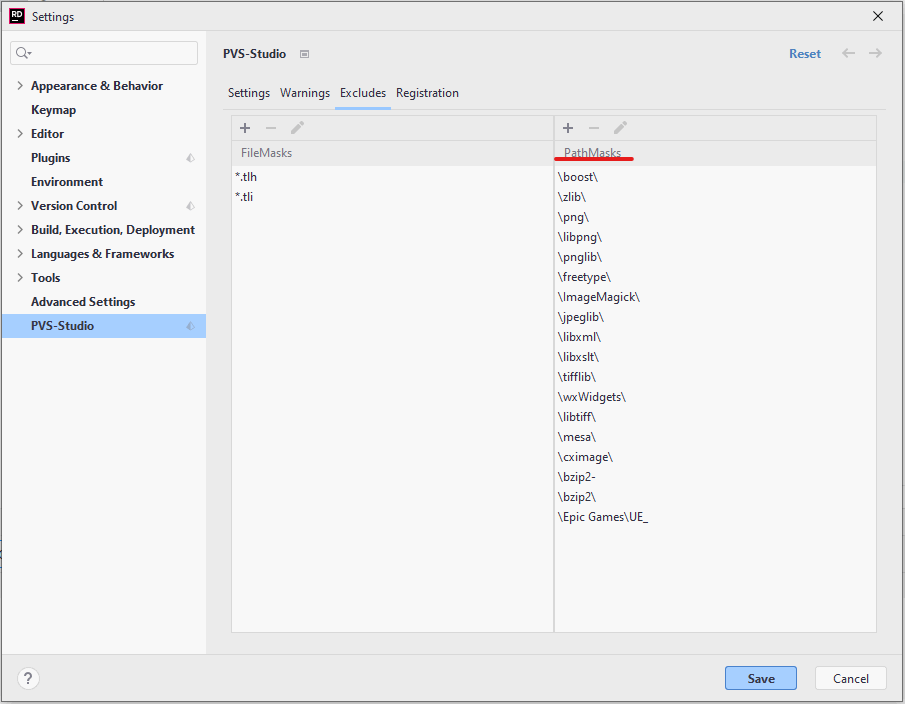
Similar settings are available for C and C++ Compiler Monitoring UI (Standalone.exe) in Tools > Options... > Don't Check Files:
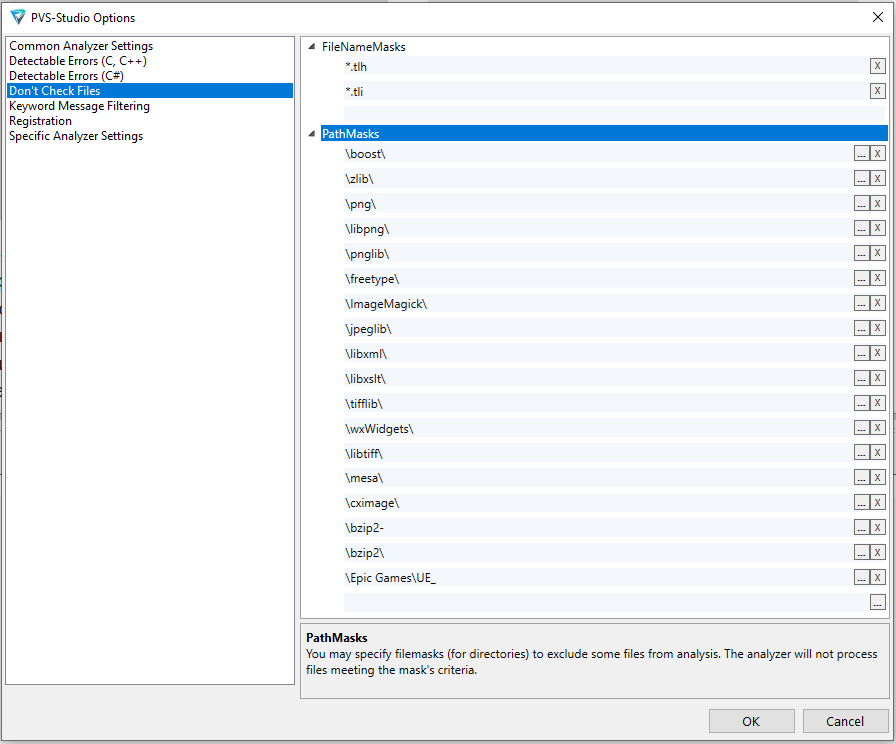
Among these masks, there is a special default mask to exclude the Unreal Engine source code: \Epic Games\UE_. This mask is added by default to prevent the analysis results from being cluttered with unnecessary warnings, information about which is unlikely to be useful for most developers.
Note. If Unreal Engine is installed in a non-default path, the analyzer's report will contain warnings issued for the Unreal Engine source code. If they bother you, then add the directory in which Unreal Engine is installed to PathMasks.
For more information on excluding files from analysis, see "Settings: Don't Check Files".
Baselining analysis results in Unreal Engine projects
Baselining of analyzer warnings is based on the message suppression feature.
Numerous analyzer warnings on legacy code often disrupt the regular use of static analysis. The legacy code is usually well tested and works stably, so it may be unnecessary to edit all the warnings there. Moreover, if the size of the code base is large enough, such edits can take a huge amount of time and effort. However, if you leave warnings for the existing code unhandled, they will disrupt the work with the warnings for the fresh code.
To solve this problem and start using static analysis on a regular basis, you can disable warnings for the legacy code. To do this, the PVS-Studio plugins for Visual Studio and JetBrains Rider have interface elements that allow you to suppress analyzer warnings in the corresponding IDEs.
The warning suppression mechanism for Unreal Engine projects in these IDEs has only one difference for the user. For UE projects, the user needs to manually add one suppress file to the solution. For non-UE projects, suppress files can also be added automatically to each project.
If you try to suppress warnings in Visual Studio or Rider for the UE project when the solution suppress file does not exist, you will get a warning. In Visual Studio:

And in Rider:

These messages describe the steps to add a solution-level suppress file.
You can see a detailed description of the suppression mechanism in these IDEs in the corresponding sections of the documentation:
- Suppression of analyzer warnings in the PVS-Studio plugins for CLion and Rider;
- Suppression of analyzer warnings in legacy code in Visual Studio.
For more information about the warning suppression mechanism, see the documentation section "Baselining analysis results (suppressing warnings for existing code)".
Suppressing analyzer warnings from the command line
If you are building your Unreal Engine project from the command line (using UnrealBuildTool.exe via the Build.bat or Rebuild.bat batch files), it may be convenient for you to use the PVS-Studio_Cmd.exe console utility to suppress the analyzer warnings. To do this, PVS-Studio_Cmd.exe has the SuppressOnly and FilterFromSuppress modes. The SuppressOnly mode allows you to save the previously received analyzer warnings to a suppress file. A command example to create a suppress file:
PVS-Studio_Cmd.exe -t path/to/solution/file ^
-a SuppressOnly ^
-o path/to/report.pvslog ^
-u path/to/suppress_file.suppressAs a result of executing this command, all the issued warnings from the path/to/report.pvslog report will be added to path/to/suppress_file.suppress. If suppress file from the -u flag doesn't exist, it will be created.
The FilterFromSuppress allows you to use the suppress file to filter the messages. Here's the example of filtering the analyzer's report with a suppress file:
PVS-Studio_Cmd.exe -t path/to/solution/file ^
-a FilterFromSuppress ^
-o path/to/report.pvslog ^
-u path/to/suppress_file.suppressAs a result of executing this command, the path/to/report_filtered.plog file will be created next to the path/to/ report.pvslog report. It will contain all analyzer warnings missing from path/to/suppress_file.suppress.
To have analyzer warnings in the report only for new or changed code, you first need to get a suppress file that will serve as a "starting point" (baseline). To get a suppress file, you need to do the following:
- run the analysis of the Unreal Engine project and get a .pvslog report (by default it is located in the ProjectDir/Saved/PVS-Studio folder);
- get a suppress file for the analyzer report using the SuppressOnly mode;
- filter the received analyzer reports with the FilterFromSuppress mode. Filter the reports using the previously obtained suppress file.
The analyzer report in the .plog format obtained after filtering in the FilterFromSuppress mode can be opened in Visual Studio with the plugin for PVS-Studio. You can also use the C and C ++ Compiler Monitoring UI utility. It is also possible to convert the .plog report to other formats using the PlogConverter.exe utility in Windows.
Troubleshooting
UnrealBuildTool + PVS-Studio work as follows:
- UnrealBuildTool collects the necessary information for PVS-Studio (start commands, compiler options, and so on);
- UnrealBuildTool runs the PVS-Studio C++ analyzer core for each compilation unit ('. cpp'):
- PVS-Studio creates a preprocessed file ('.i');
- PVS-Studio runs the analysis;
- PVS-Studio saves the report in '.pvslog';
- After analyzing all the files, UnrealBuildTool merges all the '.pvslog' files in a single file, which is usually stored in "$PROJECT\Saved\PVS-Studio\*.pvslog";
However, a problem may appear at any of the above steps. For example, the analyzer could not check one of the source files. Therefore, if the analysis fails, please contact us immediately. We'll try to find out what caused the failure and fix the issue as soon as possible.
Additional files will help us understand the cause of an issue and reproduce it. Please, attach the following additional files to the email:
- the build log that was received with the '-verbose' option;
- the '.pvslog' files. The paths to '.pvslog' may differ. They depend on the Unreal Engine version. But usually the paths to '.pvslog' are based on {PLATFORM} and {CONFIGURATION}. For example, in UE 4.26 you can find the paths to '.pvslog' in '{PROJECT}\Intermediate\Build\{PLATFORM}\UE4|UE4Editor\{CONFIGURATION}\{PROJECT}\PVS\'.
How to analyze Unity projects with PVS-Studio
- Checking the project with PVS-Studio plugins for IDE
- How to check a project from the command line
- Issues that may occur during analysis
Unity projects written in C# can be analyzed by PVS-Studio from the console or IDE. The Unity project you intend to check should be built successfully so that the analysis results are as correct and complete as possible.
You can download the analyzer distribution from this page.
Before you start working with PVS-Studio, you need to enter the license data. You can read more about entering a license here.
Checking the project with PVS-Studio plugins for IDE
How to open the Unity project in Visual Studio and JetBrains Rider
Before you start working with the Unity project code, choose your preferred script editor in the Unity settings. Use the "External Script Editor" parameter on the "External Tools" tab in the "Preferences" window. To open the window, use the "Edit" -> "Preferences" menu option in the Unity editor:

After that, you can open the Unity project in the IDE — use the "Assets" -> "Open C# Project" option in the Unity editor:

You can also open the generated Unity .sln file in the IDE. If there is no .sln file, you need to perform the actions described above in the Unity editor. That way the .sln file will be generated.
PVS-Studio and Visual Studio
You can analyze a Unity project in Visual Studio. For more information on how to use the PVS-Studio plugin, see the documentation.
The analysis can be performed for the following elements:
- the whole Unity project (.sln);
- .csproj projects generated by Assembly Definition;
- individual .cs files.
You can run the analysis from the PVS-Studio plugin submenu via the "Extensions" menu on the top menu bar:

Also, it is possible to start the analysis from the "Solution Explorer" window via the context menu by clicking on the solution element.
The analysis results appear in the "PVS-Studio" window:

PVS-Studio and JetBrains Rider
You can analyze a Unity project from JetBrains Rider. The capabilities of PVS-Studio plugin for JetBrains Rider and its capabilities are similar to those for the Visual Studio plugin. Detailed instructions on how to use the plugin for JetBrains Rider are available at the link.
You can run the analysis from the main menu:

How to check a project from the command line
You can run PVS-Studio from the command line. This way of running PVS-Studio is more convenient if you want to integrate the project analysis into your CI/CD infrastructure.
A guide on how to use the CLI version of PVS-Studio is available here.
You can check the entire solution (sln), individual projects (csproj) or some set of source code files. In the latter case, the path to the .sln/.csproj file is also required.
To analyze C# projects on Windows, use "PVS-Studio_Cmd.exe ", and on Unix-like systems — "pvs-studio-dotnet".
Example of launching PVS-Studio via the CLI on Windows:
PVS-Studio_Cmd.exe -t D:\UnityProjects\MyProject\MyProject.slnExample of running PVS-Studio via the CLI on Unix-like systems:
pvs-studio-dotnet -t ./MyUnityProject.slnBy default, the analysis report is saved in the following formats:
- plog on Windows;
- json on Linux and macOS.
You can open reports in the PVS-Studio's plugins for IDEs.
Note. Rider does not support reports in the plog format. In addition, the conversion of plog reports is not supported under Linux and macOS.
Below is the PVS-Studio plugin's menu for Visual Studio:

It is possible to convert reports into a more convenient format.
To convert the reports, use the CLI utulity — PlogConverter. The name of the utility depends on the platform. It is "PlogConverter.exe " for Windows platform and "plog-converter" for Unix-like systems. To get more detailed information about the utility, see the documentation.
Example of converting a report into HTML format on Windows (should be entered in one line):
PlogConverter.exe D:\UnityProjects\MyProject\MyProject.plog
-t FullHtml
-o D:\UnityProjects\MyProject\Example of converting a report into HTML format on Unix-like systems:
plog-converter –t fullhtml ./ ./MyProject.plogThese commands convert the report into HTML format, which is convenient for viewing in a browser and for mailing. Example of a report in the FullHtml format:
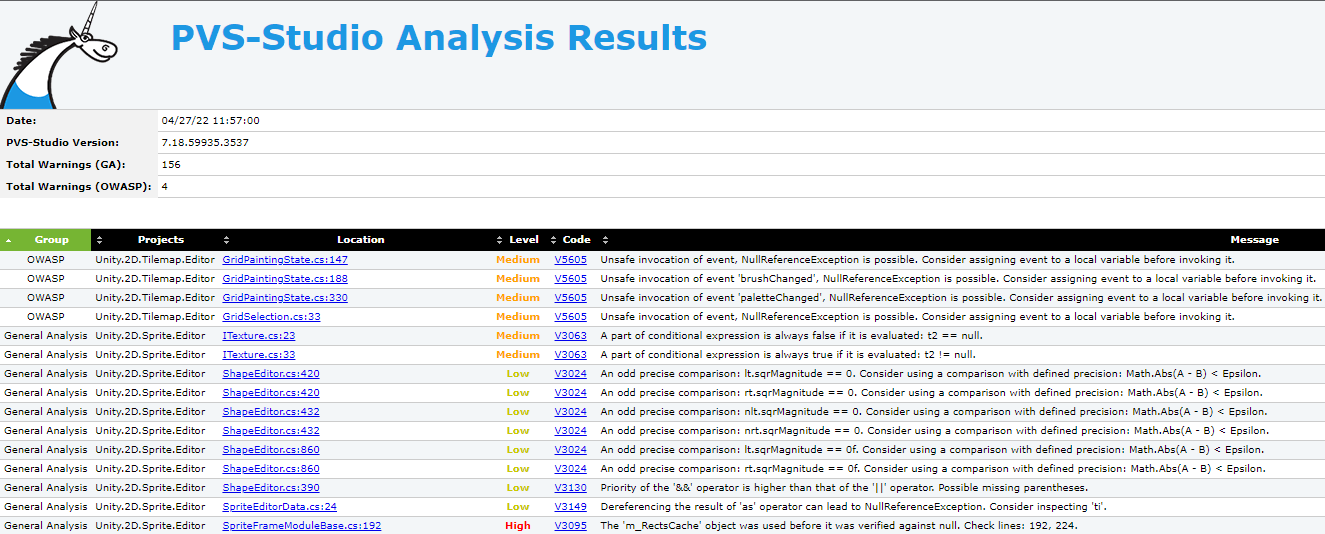
Issues that may occur during analysis
The solution file has two projects named "UnityEngine.UI"
If the "Player projects" option is enabled in the C# project generation settings, the Unity editor generates a solution file with duplicate project names. When analyzing a project with PVS-Studio, you can get the error of the following type: The solution file has two projects named "UnityEngine.UI". To perform the analysis, this option must be disabled.

After that, you may need to regenerate project files. The "Regenerate project files" button below is right for this.
Once the duplicates from the sln-file are gone, the analysis should work normally. This problem with duplicate project names is described in more detail in following article.
Do not modify project files during analysis
During the analysis, we recommend that you do not perform any actions that may modify the sln/csproj files or source code files. For example, actions such as changing or creating Assembly Definitions and Assembly Definition References, or creating new scripts.
Direct use of Java analyzer from command line
- Installing the Java analyzer core
- Arguments of the Java analyzer core
- Running the analysis
- Java analyzer configuration file
- Global Java analyzer settings file
- The return codes for the Java analyzer core
- Updating PVS-Studio Java
The PVS-Studio Java analyzer has two main components: the core performing the analysis and the plugins for integrating the analyzer into build systems (Maven, Gradle) and IDEs (PVS-Studio for IntelliJ IDEA and Android Studio).
With the plugins, you can:
- run and configure the analyzer in a user-friendly interface;
- view and filter the analysis results easily (IDE);
- collect and transfer the project structure data (the set of source files and the classpath) to the analyzer core;
- deploy the version of the analyzer core compatible with the plugin version.
Installing the Java analyzer core
On Windows, use the PVS-Studio installer to install the Java analyzer core. You can download the installer on the Download PVS-Studio page.
Also, regardless of what OS you are using, you can download the ZIP archive for Java on the Download page. The archive contains the Java analyzer core (a folder named 7.30.80678 in the pvs-studio-java directory). Unpack the Java analyzer core to the path you need or to the standard installation directory for the Java analyzer core:
- Windows: %APPDATA%/PVS-Studio-Java;
- Linux and macOS: ~/.config/PVS-Studio-Java.
Arguments of the Java analyzer core
To get information on all available arguments of the analyzer, run the ‑‑help command:
java -jar pvs-studio.jar --helpAnalyzer arguments:
- ‑‑src (-s) — the set of *.java files or directories for analysis. The value is absent by default. If you need to list multiple files/directories, use whitespace as a separator. Example: ‑‑src "path/to/file1" "path/to/file2" "path/to/dir".
- ‑‑ext (-e) — the definition of the classpath (*.jar/*.class files, directories). The value is absent by default. If you need to list multiple classpath entities, use whitespace as a separator. Example: ‑‑ext "path/to/file.jar" "path/to/dirJars".
- ‑‑ext-file — the path to the classpath file. The value is absent by default. The classpath separator is ':' on *nix systems and ';' on Windows. Example: ‑‑ext-file "path/to/project_classpath_file".
- ‑‑cfg (-c) — the configuration file for running the analyzer core. This file stores the values of the Java analyzer core command line arguments in JSON format. You can find more information on this file in the next section of the documentation. The value is absent by default.
- ‑‑help (-h) — the information on the Java analyzer core arguments outputs to the console.
- ‑‑user-name — the user name.
- ‑‑license-key — the license key.
- ‑‑license-path — the path to the license file. Note: if ‑‑user-name and ‑‑license-key are empty, the analyzer tries to retrieve licensing information from the file: %APPDATA%/PVS-Studio/Settings.xml (on Windows) or ~/.config/PVS-Studio/PVS-Studio.lic (on macOS and Linux);
- --activate-license — the flag for saving licensing information specified in the ‑‑user-name and ‑‑license-key arguments to the file by the default path: %APPDATA%/PVS-Studio/Settings.xml (on Windows) or ~/.config/PVS-Studio/PVS-Studio.lic (on macOS and Linux). The default value is false.
- ‑‑convert — is used to run the analyzer in the conversion mode. The following modes are available:
- toFullhtml converts a report with warnings to the fullhtml format;
- toSuppress converts a report with warnings to the suppress file.
- ‑‑src-convert — the path to the analyzer report which contains warnings (*. json).
- ‑‑dst-convert — the path to the file/directory where the result of the conversion is written (the path to the file for toSuppress, and the path to the directory for toFullhtml).
- ‑‑output-type (-O) — the format of the analyzer report (text, log, json, xml, tasklist, html, fullhtml, errorfile). The default value is json. Example: ‑‑output-type txt.
- ‑‑output-file (-o) — the path to the analyzer report file. The format of the report contents does not depend on the file extension specified in this argument. The default value is: ./PVS-Studio + the format extension from the ‑‑output-type argument. To get a report in the fullhtml format, specify the directory where the fullhtml folder containing the report file (index.html) is created. The default value is ./fullhtml. Please note. Instead of the ‑‑output-file argument, it's better to use the PlogConverter (Windows) and plog-converter (Linux and macOS) console utilities. They enable you to convert the analyzer report to more formats (for example, SARIF). The utilities provide additional features: filtering warnings from the report, converting paths in the report from absolute to relative (and vice versa), getting data on the differences between reports, etc.;
- ‑‑threads (-j) — the number of analysis threads. Analysis threads require more system resources but enable you to speed up the analysis of a project. You can also specify this setting for the entire system in the global.json file. The default value is the number of available processors.
- ‑‑sourcetree-root — the root part of the path that the analyzer uses to generate relative paths in diagnostic rules. By default, PVS-Studio displays absolute paths to the files where the analyzer found errors. With this setting, you can specify the root part of the path, which the analyzer will automatically replace with a special marker. The file path is replaced if it begins with the specified root path. Next, the report with relative paths can be used to view the analysis results in an environment with a different location of source files. For example, in different operating systems. The default value is absent. Example: ‑‑sourcetree-root /path/to/project/directory.
- ‑‑analysis-mode — the list of enabled groups of warnings. Available groups: GA (general analysis diagnostics), OWASP (OWASP ASVS compliant diagnostics). The ‑‑enabled-warnings, ‑‑disabled-warnings, and ‑‑additional-warnings settings have a higher priority than this setting. If a diagnostics group is disabled (or enabled), you can use the settings listed above to enable (or disable) individual diagnostics. When listing multiple groups, use whitespace as a separator. The default value is GA; Example: ‑‑analysis-mode GA OWASP.
- ‑‑enabled-warnings — the list of enabled diagnostic rules. During the analysis, the analyzer uses only the diagnostics listed in this list. If the value is absent, then all diagnostics are enabled unless a value is specified for ‑‑disabled-warnings. The ‑‑enabled-warnings setting has a lower priority than the ‑‑disabled-warnings and ‑‑additional-warnings settings, but a higher priority than ‑‑analysis-mode. The default value is absent. When listing multiple diagnostic rules, use whitespace as a separator. Example: ‑‑enabled-warnings V6001 V6002 V6003.
- ‑‑disabled-warnings — the list of disabled diagnostics. The diagnostics listed in the list are disabled during the analysis. If there are no diagnostics in the list, then all diagnostic rules are enabled unless ‑‑enabledWarnings is set. The ‑‑disabled-warnings setting has a higher priority than the enabledWarnings and ‑‑analysisMode settings, but a lower priority than –additionalWarnings. The default value is absent.
- ‑‑additional-warnings — the list of diagnostic rules to be included in analysis, which are enabled by default. If a diagnostic is added to this list, its co-presence in the ‑‑enabledWarnings and ‑‑disabledWarnings lists is ignored. In addition, it is possible to enable the diagnostic rule even if the diagnostic group to which it belongs is disabled (i.e. ‑‑analysisMode does not contain this group). The ‑‑additional-warnings setting has a higher priority than the--enabled-warnings, --disabled-warnings and ‑‑analysis-mode settings. The default value is absent. When listing multiple diagnostic rules, use whitespace as a separator. Example: ‑‑additional-warnings V6001 V6002 V6003.
- ‑‑exclude — the list of files and/or directories to be excluded from the analysis (absolute or relative paths that are expanded relative to the current working directory). When the value for this setting is absent, all files are analyzed unless a value for the ‑‑analyze-only or ‑‑analyze-only-list setting is specified. The ‑‑exclude setting has a higher priority than the —analyze-only and —analyze-only-list settings. The default value is absent. When listing multiple files or directories, use whitespace as a separator. Example: --exclude "path/to/file1" "path/to/file2" "path/to/dir".
- ‑‑analyze-only — the list of files and/or directories to be analyzed (absolute or relative paths that are expanded relative to the current working directory). You can also write these paths to a file line-by-line and pass the path to that file to the ‑‑analyze-only-list argument. When the value for this setting is absent, all files are analyzed unless a value for the ‑‑exclude or ‑‑analyze-only-list setting is specified. The ‑‑analyze-only setting has a lower priority than the ‑‑exclude setting. Files and/or directories passed in this argument are merged into a common list with files and/or directories from the ‑‑analyze-only-list argument. The default value is absent. When listing multiple files or directories, use whitespace as a separator. Example: ‑‑analyze-only "path/to/file1" "path/to/file2" "path/to/dir".
- ‑‑analyze-only-list — the path to the text file which contains the list of paths to files/directories to be analyzed (each entry must be on a separate line). Relative (will be expanded relative to the current working directory) and absolute paths are supported. When the value for this setting is absent, all files are analyzed unless a value for the ‑‑exclude or ‑‑analyze-only setting is specified. ‑‑analyze-only-list has a lower priority than the ‑‑exclude setting. Files and/or directories read from the file specified in this argument are merged into a common list with files and/or directories from the ‑‑analyze-only argument. The default value is absent.
- ‑‑suppress-base — the path to the suppress file which contains suppressed warnings of the analyzer. Warnings from the suppress file will not be included in the report in any subsequent project checks. You can add warnings to the suppress file in several ways: in the PVS-Studio plugin for IntelliJ IDEA and Android Studio, by using the pvsSuppress command, in the plugins for Gradle and Maven, by using the ‑‑convert argument which has the toSuppress value. The default value is ./.PVS-Studio/suppress_base.json.
- ‑‑fail-on-warnings — the flag used to return a non-zero code if the analyzer issued a warning for a project code. The flag allows you to monitor warnings in the analyzer's report. Such behavior of warnings can be useful when you integrate the analyzer into CI/CD. The default value is false.
- ‑‑incremental (-i) — the flag used to enable the incremental analysis mode. In this mode, the analyzer checks only modified files, which speeds up the analysis process. The default value is false.
- ‑‑force-rebuild — the flag used to force the rebuild of the entire cached metamodel of a program. The metamodel contains information about the program structure and data types. Rebuilding the project metamodel can be necessary when the analyzer version is updated or if the project metamodel is corrupted. When this flag is used, the incremental analysis mode is disabled (the ‑‑incremental flag). The default value is false.
- ‑‑disable-cache — the flag used to disable caching of the program metamodel. When the cache is disabled, the project model is not cached and is rebuilt each time. This flag can be useful when identifying the causes of the analyzer errors. Disabling project metamodel caching also disables the incremental analysis (the –incremental flag). The default value is false.
- ‑‑timeout — the timeout for analyzing a file (in minutes). It enables you to increase or decrease the maximum amount of time taken to analyze one file. You can enable this setting for the whole system in the global.json file. The default value is 10.
- ‑‑compatibility — the flag that enables the V6078 diagnostic rule that detects potential API compatibility issues between the selected Java SE versions. The V6078 diagnostic enables you to ensure that the JDK API you are using will not be modified or will not disappear in future versions of the JDK. The default value is false.
- ‑‑source-java — the Java SE version that your application is developed on. This setting is used by the V6078 diagnostic rule if the ‑‑compatibility setting is enabled. The minimum value is 8. The maximum value is 14.
- ‑‑target-java — the Java SE version to be checked for compatibility with the API used in your application (‑‑source-java). The V6078 diagnostic uses this setting if the ‑‑compatibility setting is enabled. The minimum value is 8. The maximum value is 14.
- ‑‑exclude-packages — packages to be excluded from the compatibility analysis (the V6078 diagnostic). The V6078 diagnostic uses this setting if the ‑‑compatibility setting is enabled. Example: ‑‑exclude-packages "package1" "package2" "package3".
Running the analysis
Before running the analysis, enter the PVS-Studio license. To learn how to do this, please consult the documentation.
The quick start example of the Java analyzer core:
java -jar pvs-studio.jar -s A.java B.java C.java -e Lib1.jar Lib2.jar -j4
-o report.txt -O text --user-name someName –-license-key someSerial
java -jar pvs-studio.jar -s src/main/java --ext-file classpath.txt -j4
-o report.txt -O text --license-path PVS-Studio.licPlease note:
- The analyzer needs a collection of source files (or directories with source files) to perform the analysis and the classpath to build the program metamodel correctly.
- When analyzing a project, the same Java language version as the JDK is used. The java file from the JDK is used to start the Java analyzer core. If you want to change the Java language version to be used in the analysis, use the java file from the JDK for that version to run the Java analyzer core (pvs-studio.jar).
How to change the Java version to run the analyzer
By default, the analyzer starts the core with java from the PATH environment variable. If you need to run the analysis with some other java, you can set it manually. To do this, run the Java analyzer core by using the full path to the java file from the JDK. The version of this JDK will be used when checking the source code of the project:
/path/to/jdk_folder/bin/java -jar pvs-studio.jar ^
-s A.java B.java C.java -e Lib1.jar Lib2.jar -j4 ^
-o report.txt -O text --user-name someName –-license-key someSerialJava analyzer configuration file
To simplify the command for running the analysis, you can put the command line arguments into a special JSON file. Later this file can be passed to the analyzer core through the ‑‑cfg flag.
The syntax of the file is as follows:
{
"single-value-parameter": "value",
"multiple-values-parameter": ["value1", "value2", "value3"]
}Each parameter in the configuration file is the full name of a command line flag with the value to be passed in that flag.
Example of a configuration file:
{
"src": ["A.java", "B.java", "C.java"],
"threads": 4,
"output-file": "report.txt",
"output-type": "text",
"user-name": "someName",
"license-key": "someSerial"
....
}In this case, you can run the analyzer with the following line:
java -jar pvs-studio.jar –-cfg cfg.jsonNote that parameters passed via the command line have a higher priority than parameters specified in the configuration file.
Global Java analyzer settings file
The Java analyzer core takes some settings from the global.json file. This file is located at the default installation path of the Java analyzer core:
- Windows: %APPDATA%/PVS-Studio-Java/global.json;
- Linux and macOS: ~/.config/PVS-Studio-Java/global.json.
The list of the settings:
- java — the default value is java.
- jvm-arguments — the default value is ["-Xss64m"].
- threads — the default value is the number of available processors. This value can be overridden via the ‑‑threads command line argument of the Java analyzer core.
- timeout — the default value is 10. This value can be overridden via the ‑‑timeout command line argument of the Java analyzer core.
- verbose — the default value is true.
By default, these values are used for all Java analyzer cores in the system as well as for the PVS-Studio Java plugins. If necessary, you can change the values of these parameters. For example, to ensure that all PVS-Studio plugins for Java utilize the same number of threads for analysis.
You can read more about which of these parameters can be changed in the following documentation sections:
The return codes for the Java analyzer core
- '0' – the analysis is completed. Errors can be both detected and undetected.
- '50' – an error occurred during analysis.
- '51' – invalid arguments are passed when starting the analysis.
- '52' – the invalid or expired license is used.
- '53' – the analysis is completed. The analyzer detected potential errors in the project code. This return code will only be returned when the ‑‑fail-on-warnings Java analyzer core flag is enabled.
- '54' – an attempt was made to access features available under the Enterprise license.
Updating PVS-Studio Java
When you run the analyzer, it checks whether a new version of the PVS-Studio analyzer is available. If a new version of the analyzer has been released, the file with the analysis results contains the following message: "A newer version of PVS-Studio is available (7.30.80678)". This message contains the latest version of the Java analyzer core.
Also, you can download the latest version of PVS-Studio from the file at the link.
To update the Java analyzer core, download the ZIP archive for Java on the Download page. The archive contains the Java analyzer core (a folder named 7.30.80678 in the pvs-studio-java directory). Unpack the Java analyzer core to the path you need or to the standard installation directory:
- Windows: %APPDATA%/PVS-Studio-Java
- Linux and macOS: ~/.config/PVS-Studio-Java
This process can be automated with various scripts to ensure that the latest version of the Java analyzer core is used.
How to run PVS-Studio on Linux and macOS
- Introduction
- Installing and updating PVS-Studio
- License file information
- Running the analysis
- Incremental analysis mode
- File List analysis mode
- Integration of PVS-Studio into build systems and IDEs
- Integration of PVS-Studio with continuous integration systems
- Filtering and viewing the analyzer report
- Notifying the developer teams (blame-notifier utility)
- Mass suppression of analyzer messages
- Common problems and their solutions
- Conclusion
Introduction
PVS-Studio static analyzer for C/C++ code is a console application, named pvs-studio, and several supporting utilities. For the program work it is necessary to have configured environment for a build of your project.
A new run of the analyzer is performed for every code file. The analysis results of several source code files can be added to one analyzer report or displayed in stdout.
You can use the analyzer in three basic operating modes:
- integrate the pvs-studio call into the build system;
- integrate the analyzer using the CMake modules;
- analyze a project using the pvs-studio-analyzer utility without any integrations.
Installing and updating PVS-Studio
Examples of commands to install the analyzer from the packages and repositories are given on these pages:
License file information
To get started with PVS-Studio, fill out the form to request a license. Here you can find more information on how to enter the license on Linux and macOS.
Running the analysis
Before running the analysis, you need to perform one of the following actions to get a project build model.
Important. The project must be successfully compiled and built before the analysis.
JSON Compilation Database
One of the ways to perform the analysis is to generate the compile_commands.json file in advance.
It is suitable for widely used build systems such as:
- CMake;
- Ninja;
- GNU Make;
- Qt Build System;
- Xcode;
- and others.
Important: This approach makes it much easier to perform the analysis, since the compiler runs do not need to be fully traced (the approach is described below).
This page provides instructions for running the analysis based on compile_commands.json files.
Compilation tracing (for Linux only)
If you can't get the compile_commands.json file, you can use the compiler calls trace mode. To use this method, you need to install the strace utility. The utility helps the analyzer to get the necessary information about the compilation of the project during its build.
Important: Before running the mode, the project should be cleaned. This is necessary to get all the information about the compiled files.
You can build the project and track its compilation process with the help of the following command:
pvs-studio-analyzer trace -- makeInstead of the make command, you can use any command to start the project's build with all the necessary parameters, for example:
pvs-studio-analyzer trace -- make debugAs a result of tracing, the strace_out file will be generated by default. Learn more about trace mode here.
Running project analysis
Once you have obtained the compilation tracing file (strace_out) or JSON Compilation Database (compile_commands.json), execute the following command to run the analysis:
pvs-studio-analyzer analyze -o /path/to/PVS-Studio.log \
-e /path/to/exclude-path \
-j<N>
plog-converter -a GA:1,2 \
-t json \
-o /path/to/Analysis_Report.json \
/path/to/PVS-Studio.logThe analyze command requires strace_out or compile_commands.json files in the current working directory. You can explicitly specify the location of these files using the ‑‑file (-f) flag.
The analyzer warnings are saved to the specified Analysis_Report.json file. For other methods to view and filter the report, see the "Filtering and viewing the analyzer report" section of this document.
If you use cross compilers
In this case, the compilers may have special names and the analyzer will not be able to find them. To analyze such a project, you must explicitly list the names of the compilers without the paths:
pvs-studio-analyzer analyze ... --compiler COMPILER_NAME
--compiler gcc --compiler g++ --compiler COMPILER_NAME
plog-converter ...Also, when you use cross compilers, the directory with the header files of the compiler will be changed. It's necessary to exclude such directories from the analysis with the help of -e flag, so that the analyzer doesn't issue warnings for these files.
pvs-studio-analyzer ... -e /path/to/exclude-path ...If pvs-studio-analyzer identifies the cross-compiler type incorrectly and, as a result, runs the preprocessor incorrectly, you can also set the preprocessor explicitly via the following flag:
pvs-studio-analyzer analyze ... ‑‑compiler CustomCompiler=gcc
After that, pvs-studio-analyzer will run CustomCompiler with the gcc preprocessing flags. Learn more about this here.
There shouldn't be any issues with the cross compilers during the integration of the analyzer into the build system.
Response files
You can pass the response file to the pvs-studio-analyzer utility. Response file is a file which contains other command-line arguments.
The response file argument on the command line is indicated by the '@' character, which is followed by the path to the response file (e.g. '@/path/to/file.txt'). The arguments in the response file are separated by spaces/tabs/newlines. If you want to pass an argument that contains a whitespace, you can escape the whitespace with a backslash (\) character or put the whole argument in single ('') or double ("") quotes. You can't escape quotes inside quotes. There's no difference between single-quoted and double-quoted arguments. Note that the arguments are passed as-is, no other processing takes place like shell variable expansion, glob expansion, etc. Recursive response files are supported.
Incremental analysis mode
For the pvs-studio-analyzer utility, incremental analysis mode is available (analysis of only changed files), for this, you need to run the utility with the parameter ‑‑incremental:
pvs-studio-analyzer analyze ... --incremental ...This mode works independently from the incremental project build. I.g. if your project is completely compiled, the first run of the incremental analysis will still analyze all files. During the next run only changed files will be analyzed.
For monitoring the changed files, the analyzer saves service information in a directory named .PVS-Studio in the launch directory. That's why for using this mode it is always necessary to run the analyzer in one and the same directory.
File List analysis mode
The pvs-studio-analyzer utility allows to analyze a project's specific files. This mode is necessary when checking commits and pull requests. To start the analysis, run the utility with the following settings: the ‑‑source-files or -S parameter, and a path to a file that contains a list of source files to be checked.
pvs-studio-analyzer analyze ... -S source_file_list ...To learn more about file list analysis mode, read the following documentation article: "Pull request and commit analysis".
Integration of PVS-Studio into build systems and IDEs
Examples of integration in CMake, QMake, Makefile, and WAF
Test projects are available in the official PVS-Studio repository on GitHub:
- pvs-studio-cmake-examples, CMake module itself on GitHub repository
- pvs-studio-qmake-examples
- pvs-studio-makefile-examples
- pvs-studio-waf-examples
- pvs-studio-eclipse-examples
This is what the integration with CLion, Qt Creator and Eclipse CDT looks like
Figure 1 shows an example of analyzer warnings viewed in CLion (more details here):
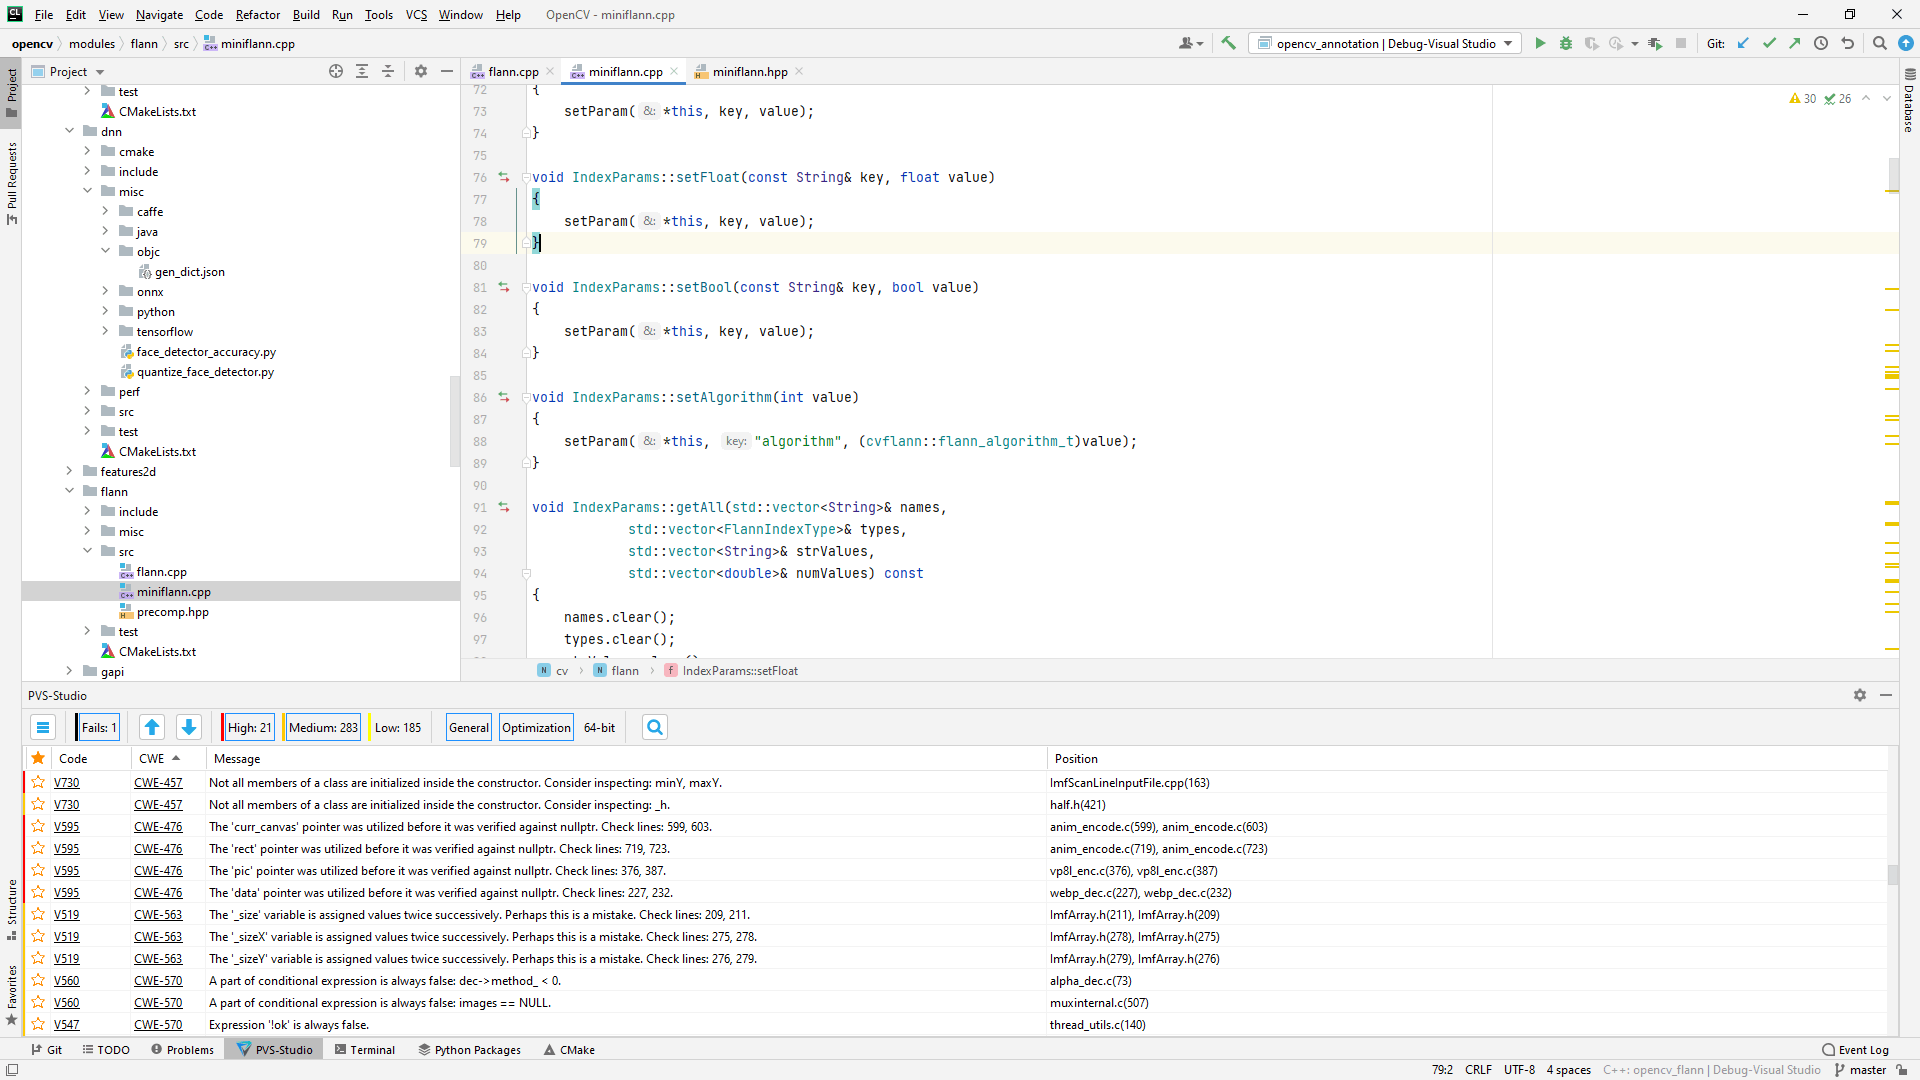
Figure 1 - PVS-Studio warnings viewed in CLion
Figure 2 demonstrates an example of analyzer warnings viewed in Qt Creator:
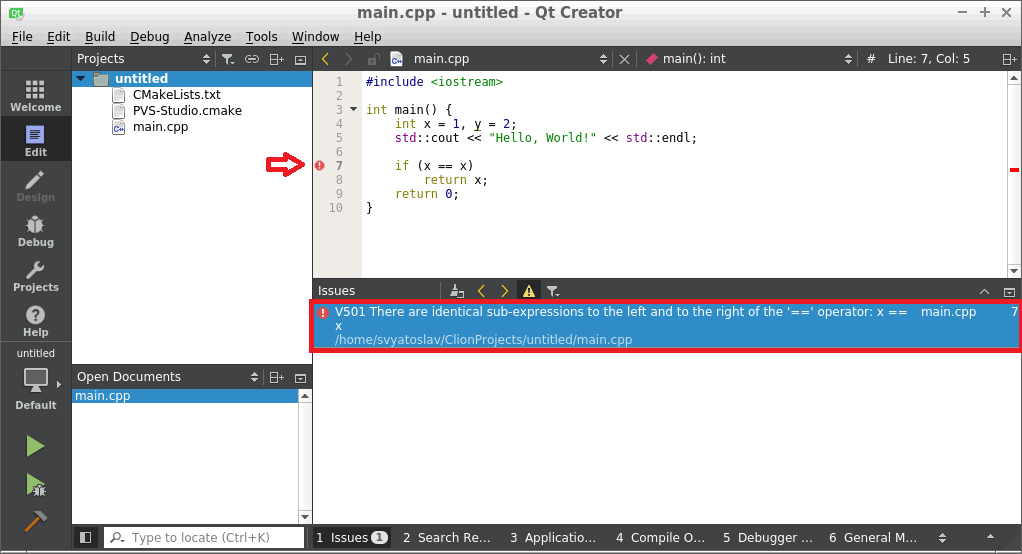
Figure 2 - PVS-Studio warnings viewed in Qt Creator
Instructions for checking CMake projects in the Qt Creator environment are located on the page "How to use PVS-Studio in Qt Creator".
There is the "PVS-Studio for QtCreator" extension. More information about it you can find here.
Figure 3 shows an example of analyzer warnings viewed in Eclipse CDT:
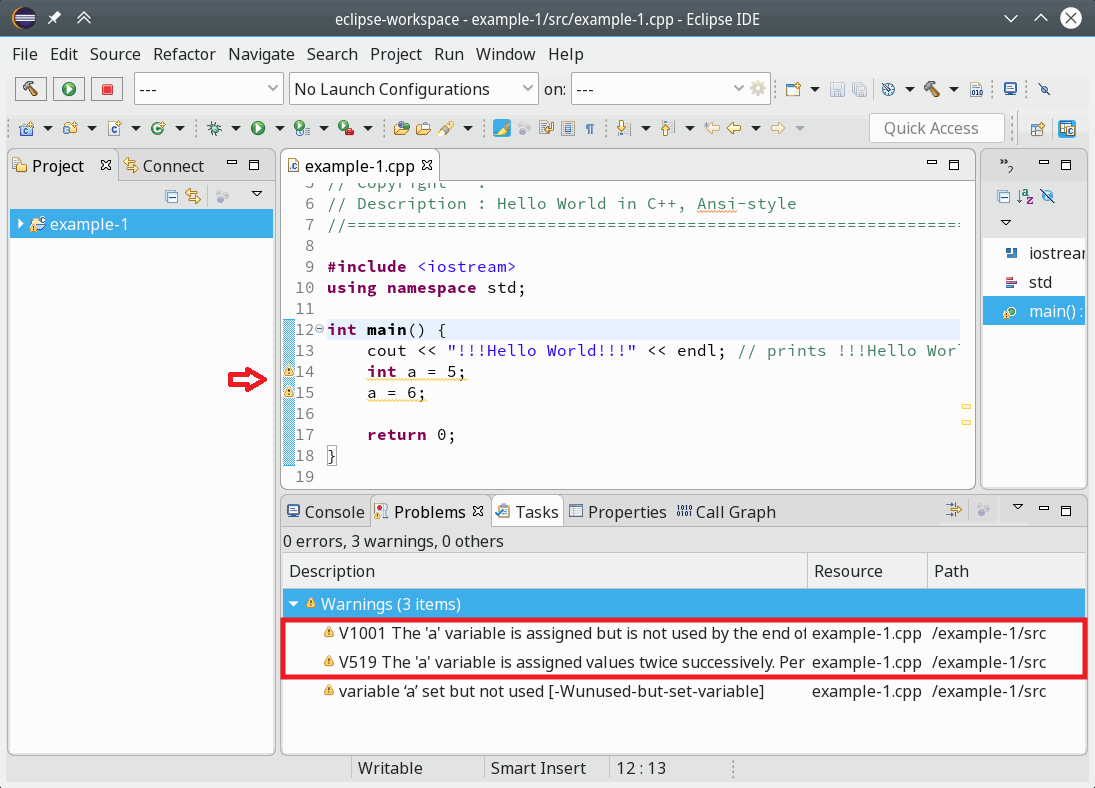
Figure 3 - PVS-Studio warnings viewed in Eclipse CDT
Preprocessor parameters
The analyzer checks not the source files, but preprocessed files. This method allows the analyzer perform a more in-depth and qualitative analysis of the source code.
In this regard, we have several restrictions for the compilation parameters being passed. These are parameters that hinder the compiler run in the preprocessor mode, or damage the preprocessor output. A number of debugging and optimization flags, for example, -O2, -O3, -g3, -ggdb3 and others, create changes which affect the preprocessor output. Information about invalid parameters will be displayed by the analyzer when they are detected.
This fact does not presuppose any changes in the settings of project to be checked, but part of the parameters should be excluded for the analyzer to run in properly.
Configuration file *.cfg
During integration of the analyzer into the build system, you should pass it a settings file (*.cfg). You may choose any name for the configuration file, but it should be written with a "‑‑cfg" flag.
Possible values for the settings in the configuration file:
- exclude-path (optional) specifies the directory whose files it is not necessary to check. Usually these are directories of system files or link libraries. There can be several exclude-path parameters.
- platform (required) specifies the platform. Possible variants: linux32 or linux64.
- preprocessor (required) specifies the preprocessor. Possible variants: gcc, clang, keil.
- language (required) parameter specifies the version of the C/C++ languages that the analyzer expects to see in the code of the file to be analyzed (‑‑source-file). Possible variants: C, C++. Incorrect setting of this parameter can lead to V001 errors, because every supported language variant has certain specific keywords.
- lic-file (optional) contains the absolute path to the license file.
- analysis-mode (optional) defines the type of warnings. It is recommended that you use the value "4" (General Analysis, suitable for most users).
- output-file (optional) parameter specifies the full path to the file, where the report of the analyzer's work will be stored. If this parameter is missing in the configuration file, all messages concerning the errors found will be displayed in the console.
- sourcetree-root (optional) by default, during the generation of diagnostic messages, PVS-Studio issues absolute, full paths to the files, where PVS-Studio detected errors. Using this setting you can specify the root part of the path that the analyzer will automatically replace with a special marker. For example, the absolute path to the file /home/project/main.cpp will be replaced with a relative path |?|/main.cpp, if /home/project was specified as the root.
- source-file (required) contains the absolute path to the source file to be analyzed.
- i-file (required) contains the absolute path to the preprocessed file.
- no-noise (optional) will disable the generation of Low Certainty messages (Level 3). When working with large-scale projects, the analyzer might generate a huge number of warnings. Use this setting when it is not possible to fix all the warnings at once, so you can concentrate on fixing the most important warnings first.
You don't need to create a new configuration file for every file you check. Just save permanent settings, such as lic-file, for example.
Integration of PVS-Studio with continuous integration systems
Any of the following methods of integration of the analysis into a build system can be automated in the system Continuous Integration. This can be done in Jenkins, TeamCity and others by setting automatic analysis launch and notification of the found errors.
It is also possible to integrate with the platform of the continuous analysis of SonarQube using the plug-in PVS-Studio. The plugin is available with the analyzer in .tgz archive available to download. Setting instructions are available on this page: "Integration of PVS-Studio analysis results into SonarQube".
You can convert PVS-Studio analysis results into a specific format to upload them into the DefectDojo DevSecOps platform. See the documentation on how to integrate analysis results into DefectDojo.
Filtering and viewing the analyzer report
Plog Converter utility
To convert the analyzer bug report to different formats (*.xml, *.tasks and so on) you can use the Plog Converter, which can be found open source. Learn more about how the utility works here.
Viewing the analyzer report in Qt Creator
The following is an example of a command which would be suitable for most users, for opening the report in Qt Creator:
plog-converter -a GA:1,2 -t tasklist
-o /path/to/project.tasks /path/to/project.logFigure 4 demonstrates an example of a .tasks file, viewed in Qt Creator:
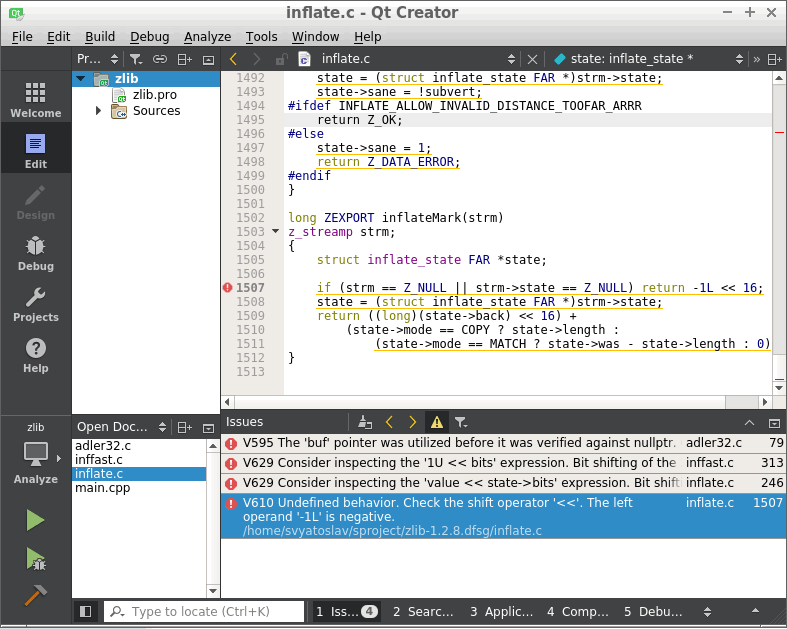
Figure 4 - A .tasks file viewed in Qt Creator
Html report view in a web browser or an email client
The analyzer report converter allows generating an Html report of two types:
1. FullHtml - full report to view the results of the analysis. You can search and sort messages by type, file, level, code and warning text. A feature of this report is the ability to navigate to the location of the error, to the source code file. The source code files themselves, which triggered the analyzer warnings, are copied in html and become a part of report. Examples of the report are shown in figures 5-6.
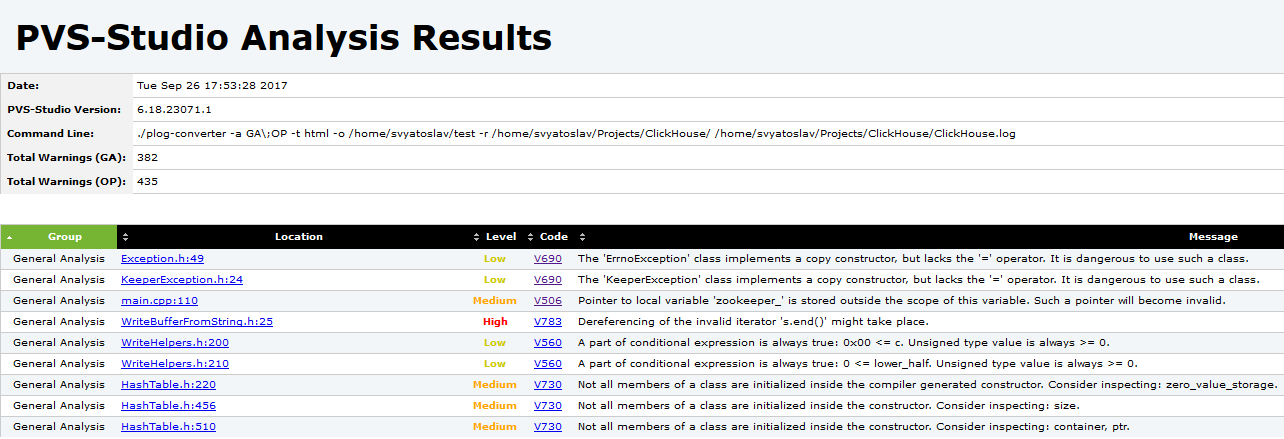
Figure 5 - Example of the Html main page report

Figure 6 - Warning view in code
Example of a command for receiving such a report:
plog-converter -a GA:1,2 -t fullhtml
/path/to/project.log -o /path/to/report_dirThis report is convenient to send in an archive, or to provide access by the local network using any web server, for example, Lighttpd, etc.
2. Html is a lightweight report, consisting of a single .html file. It contains brief information about the found warnings and is suitable for notification by email. A report example is shown on the Figure 7.
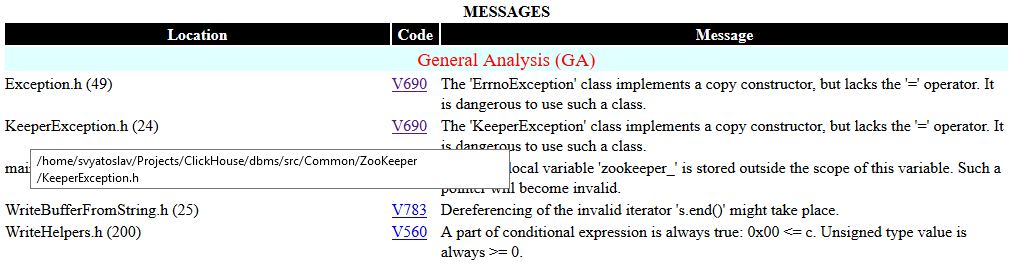
Figure 7 - Simple Html page example
Example of a command for receiving such a report:
plog-converter -a GA:1,2 -t html
/path/to/project.log -o /path/to/project.htmlViewing the analyzer report in Vim/gVim
An example of commands to open the report in gVim editor:
$ plog-converter -a GA:1,2 -t errorfile
-o /path/to/project.err /path/to/project.log
$ gvim /path/to/project.err
:set makeprg=cat\ %
:silent make
:cwThe figure 8 demonstrates an example of viewing an .err file in gVim:

Figure 8 - viewing the .err file in gVim
Viewing the analyzer report in GNU Emacs
An example of commands to open the report in Emacs editor:
plog-converter -a GA:1,2 -t errorfile
-o /path/to/project.err /path/to/project.log
emacs
M-x compile
cat /path/to/project.err 2>&1Figure 9 demonstrates an example of viewing an .err file in Emacs:

Figure 9 - viewing the .err file in Emacs
Viewing the analyzer report in LibreOffice Calc
An example of commands to convert the report in CSV format:
plog-converter -a GA:1,2 -t csv
-o /path/to/project.csv /path/to/project.logAfter opening the file project.csv in LibreOffice Calc, you must add the autofilter: Menu Bar --> Data --> AutoFilter. Figure 10 demonstrates an example of viewing an .csv file in LibreOffice Calc:

Figure 10 - viewing an .csv file in LibreOffice Calc
Configuration file
More settings can be saved into a configuration file with the following options:
- enabled-analyzers - an option similar to the -a option in the console string parameters.
- sourcetree-root - a string that specifies the path to the root of the source code of the analyzed file. If set incorrectly, the result of the utility's work will be difficult to handle.
- errors-off - globally disabled warning numbers that are enumerated with spaces.
- exclude-path - a file, the path to which contains a value from this option, will not be initialized.
- disabled-keywords- keywords. Messages, pointing to strings which contain these keywords, will be excluded from processing.
The option name is separated from the values by a '=' symbol. Each option is specified on a separate string. Comments are written on separate strings; insert # before the comment.
Notifying the developer teams (blame-notifier utility)
The blame-notifier utility is meant for automating the process of notifying developers who have committed the code in the repository for which the PVS-Studio analyzer has issued warnings. The analyzer report is passed to the blame-notifier with specification of additional parameters; the utility finds files that triggered warnings and generates an HTML-report for each "guilty" developer. It is also possible to send a full report: it will contain all warnings related to each "guilty" developer.
The following documentation section describes the ways how to install and use the utility: "Notifying the developer teams (blame-notifier utility)".
Mass suppression of analyzer messages
Mass warnings suppression allows you to easily embed the analyzer in any project and immediately start to benefit from this, i.e. to find new bugs. This mechanism allows you to plan correcting of missed warnings in future, without distracting developers from performing their current tasks.
There are several ways of using this mechanism, depending on the integration of the analyzer. Learn more about how to use the warning suppression mechanism in pvs-studio-analyzer here.
Direct integration of the analyzer in the build system
Direct integration might look as follows:
.cpp.o:
$(CXX) $(CFLAGS) $(DFLAGS) $(INCLUDES) $< -o $@
$(CXX) $(CFLAGS) $< $(DFLAGS) $(INCLUDES) -E -o $@.PVS-Studio.i
pvs-studio --cfg $(PVS_CFG) --source-file $< --i-file $@.PVS-Studio.i
--output-file $@.PVS-Studio.logIn this mode, the analyzer cannot verify source files and filter them simultaneously. So, filtration and warnings suppression would require additional commands.
To suppress all the warnings, you must also run the command:
pvs-studio-analyzer suppress /path/to/report.logTo filter a new log, you must use the following commands:
pvs-studio-analyzer filter-suppressed /path/to/report.log
plog-converter ...File with suppressed warnings also has the default name suppress_file.suppress.json, for which you can optionally specify an arbitrary name.
Common problems and their solutions
1. The strace utility issues the following message:
strace: invalid option -- 'y'You must update the strace program version. Analysis of a project without integrating it into a build system is a complex task, this option allows the analyzer to get important information about the compilation of a project.
2. The strace utility issues the following message:
strace: umovestr: short read (512 < 2049) @0x7ffe...: Bad addressSuch errors occur in the system processes, and do not affect the project analysis.
3. The pvs-studio-analyzer utility issues the following message:
No compilation units foundThe analyzer could not find files for analysis. Perhaps you are using cross compilers to build the project. See the section "If you use cross compilers" in this documentation.
Another possible scenario is when trace mode is run on a built project. This causes the resulting strace_out file to be empty. In this case, you need to clear the project after the build and run the compilation trace again.
4. The analyzer report has strings like this:
r-vUVbw<6y|D3 h22y|D3xJGy|D3pzp(=a'(ah9f(ah9fJ}*wJ}*}x(->'2h_u(ahThe analyzer saves the report in the intermediate format. To view this report, you must convert it to a readable format using a plog-converter utility, which is installed together with the analyzer.
5. The analyzer issues the following error:
Incorrect parameter syntax:
The ... parameter does not support multiple instances.One of the parameters of the analyzer is set incorrectly several times.
This can happen if part of the analyzer parameters is specified in the configuration file, and part of them is passed through the command line parameters. At the same time, some parameter was accidentally specified several times.
If you use pvs-studio-analyzer, then almost all the parameters are detected automatically, this is why it can work without a configuration file. Duplication of such parameters can also cause this error.
6. The analyzer issues the warning:
V001 A code fragment from 'path/to/file' cannot be analyzed.If the analyzer is unable to parse some code fragment, it skips it and issues the V001 warning. Such a situation doesn't influence the analysis of other files, but if this code is in the header file, then the number of such warnings can be very high. Send us a preprocessed file (.i) for the code fragment, causing this issue, so that we can add support for it.
Conclusion
If you have any questions or problems with running the analyzer, feel free to contact us.
How to integrate PVS-Studio in Qt Creator without the PVS-Studio plugin
- Viewing Reports
- Analysis of QMake projects
- Analysis of projects based on CMake
- View Report under Windows with MSVC Kit
Viewing Reports
For convenient viewing of analysis results, you can use the PVS‑Studio extension (plugin) for Qt Creator. More details about its installation and use are described in the documentation "How to use the PVS‑Studio extension for Qt Creator".
Analysis of QMake projects
Such projects can be analyzed through the built-in compile_commands.json file generation mechanism.
Analysis of projects based on CMake
You can use the PVS-Studio analyzer to check CMake projects in the Qt Creator environment.
Note. Before using the CMake module, you must enter the PVS-Studio license by running a special command for Windows and for Linux/macOS.
Then add the PVS-Studio CMake module to the project. After that, add the code to the CMakeLists.txt file of the project to create the analysis target:
include(PVS-Studio.cmake)
pvs_studio_add_target(TARGET ${PROJECT_NAME}.analyze ALL
OUTPUT
FORMAT errorfile
ANALYZE ${PROJECT_NAME}
MODE GA:1,2
LOG ${PROJECT_NAME}.log
ARGS -e C:/Qt/
HIDE_HELP)By default, when you open CMakeLists.txt of a project, Qt Creator hides additional build targets. To display them, disable the 'Hide Generated Files' option in project explorer filters:
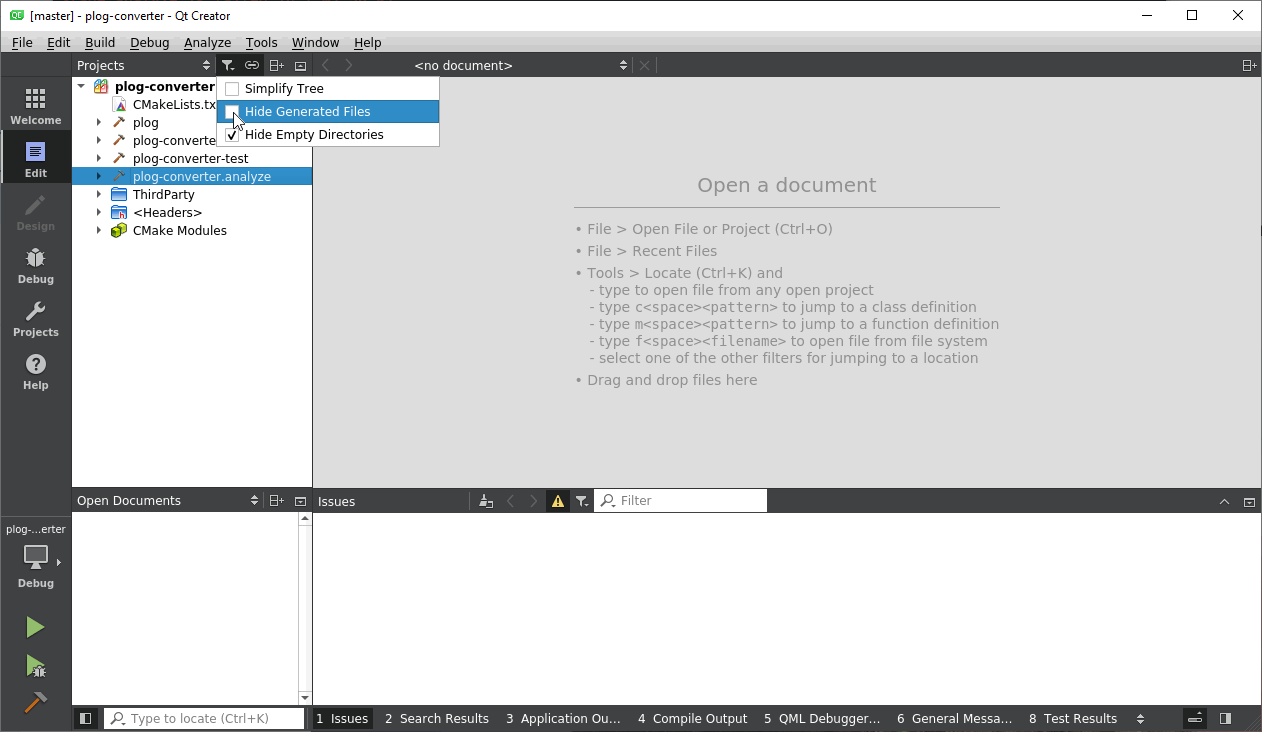
To build and run the analysis, click Build "ProjectName.Analyze" from the analysis target context menu:
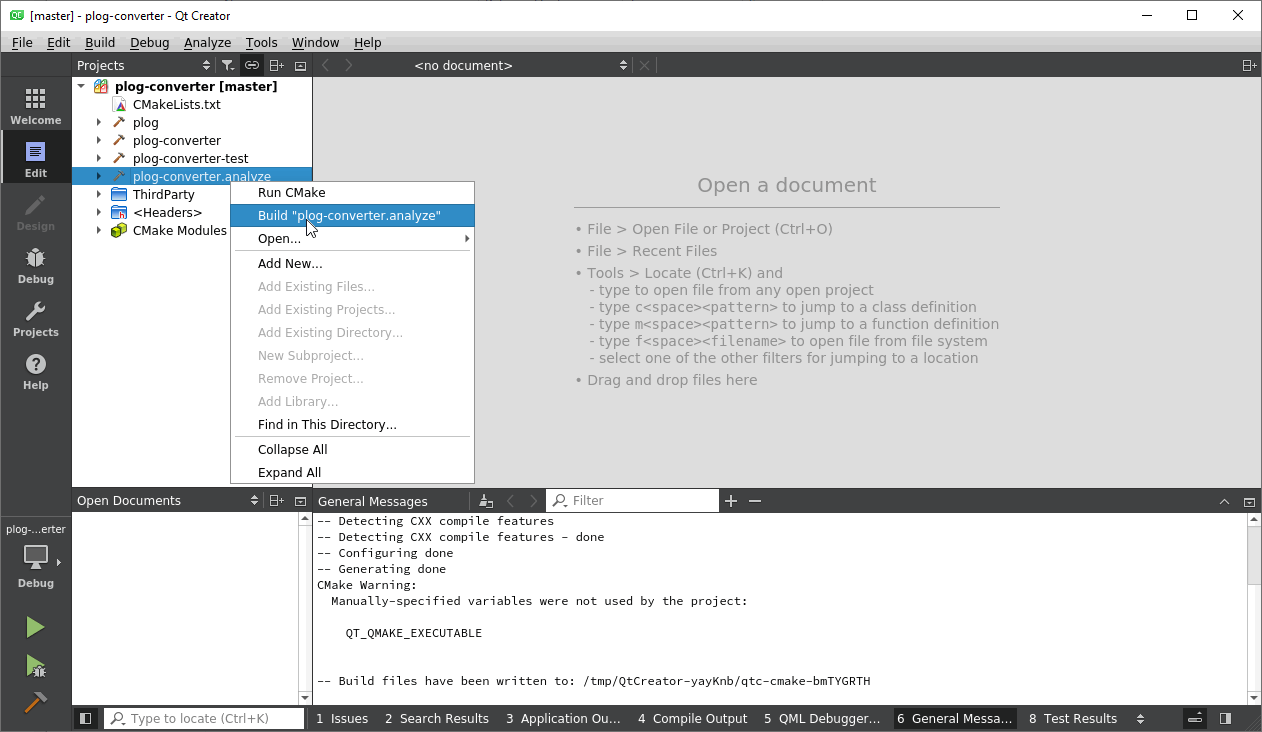
After the analysis is complete, errors found by the analyzer will be added to the 'Issues' pane:
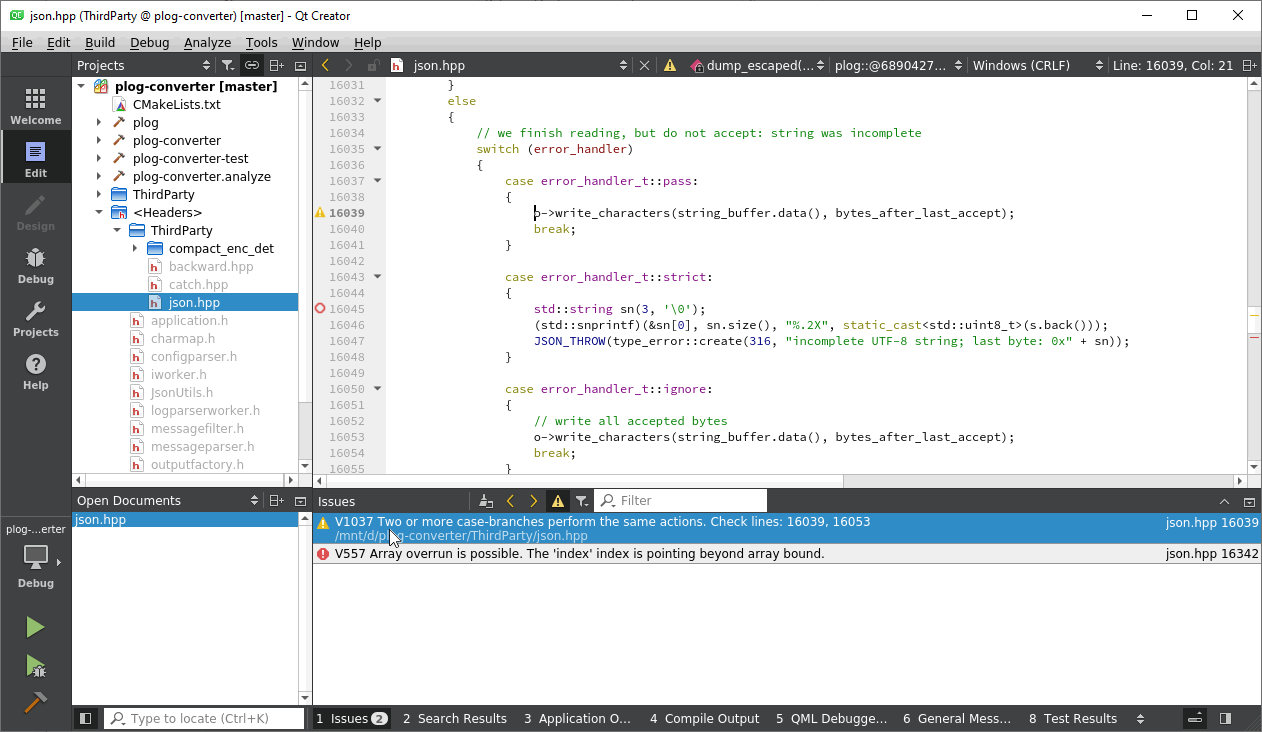
View Report under Windows with MSVC Kit
If you are using the MSVC toolkit to build projects on Windows, Qt Creator will change the warning parser to be compatible with the output of Visual Studio compilers. This output format is incompatible with the PVS-Studio output formats. As the result, the analyzer messages will not appear in the 'Issues' pane. To configure support for the errorfile format, follow these steps:
1. Switch to the 'Projects' mode (Ctrl + 5). In the 'Build & Run' section, select the desired Kit. At the bottom of the page, in the 'Custom Output Parsers' section, click on the 'here' link.
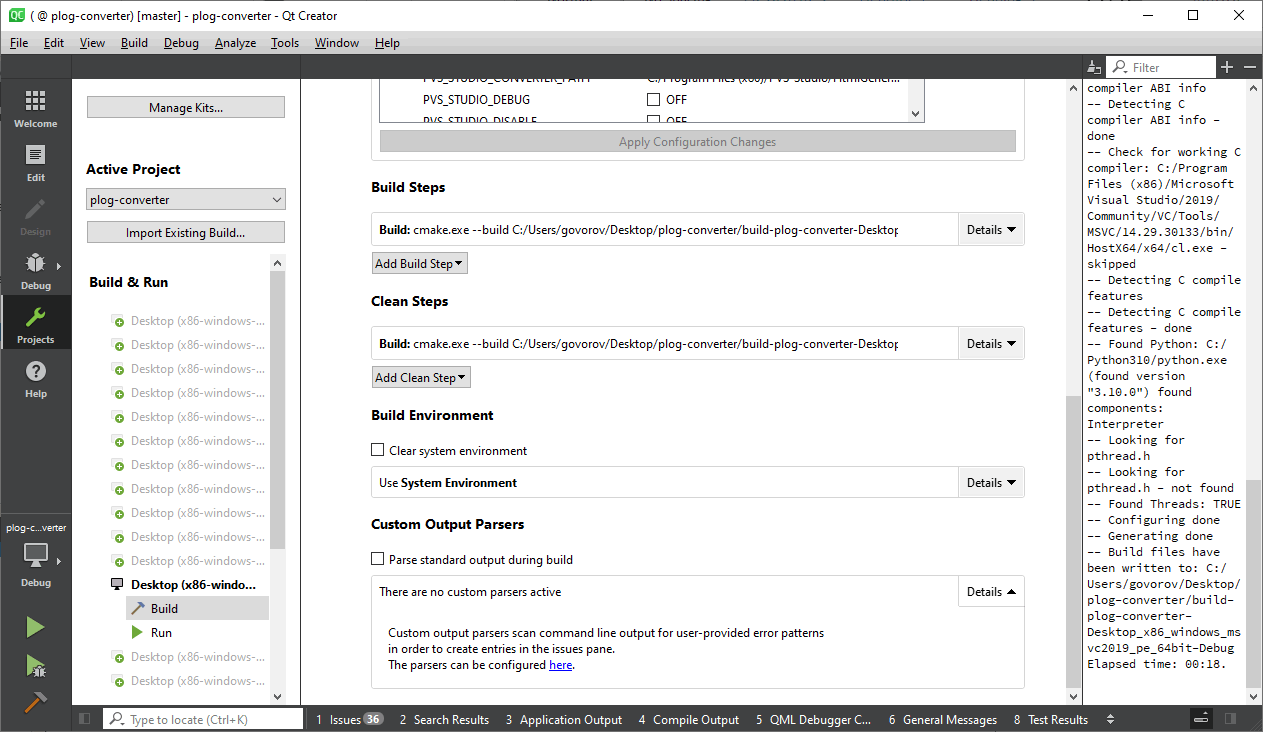
2. In the opened window, click the 'Add...' button. In the 'Error message capture pattern' lines, insert the following regular expressions:
For the Error tab
(.*):(\d+): error: (.*)For the Warning tab
(.*):(\d+): warning: (.*)Alternatively, if you want to display low level warnings
(.*):(\d+): (?:warning|note): (.*)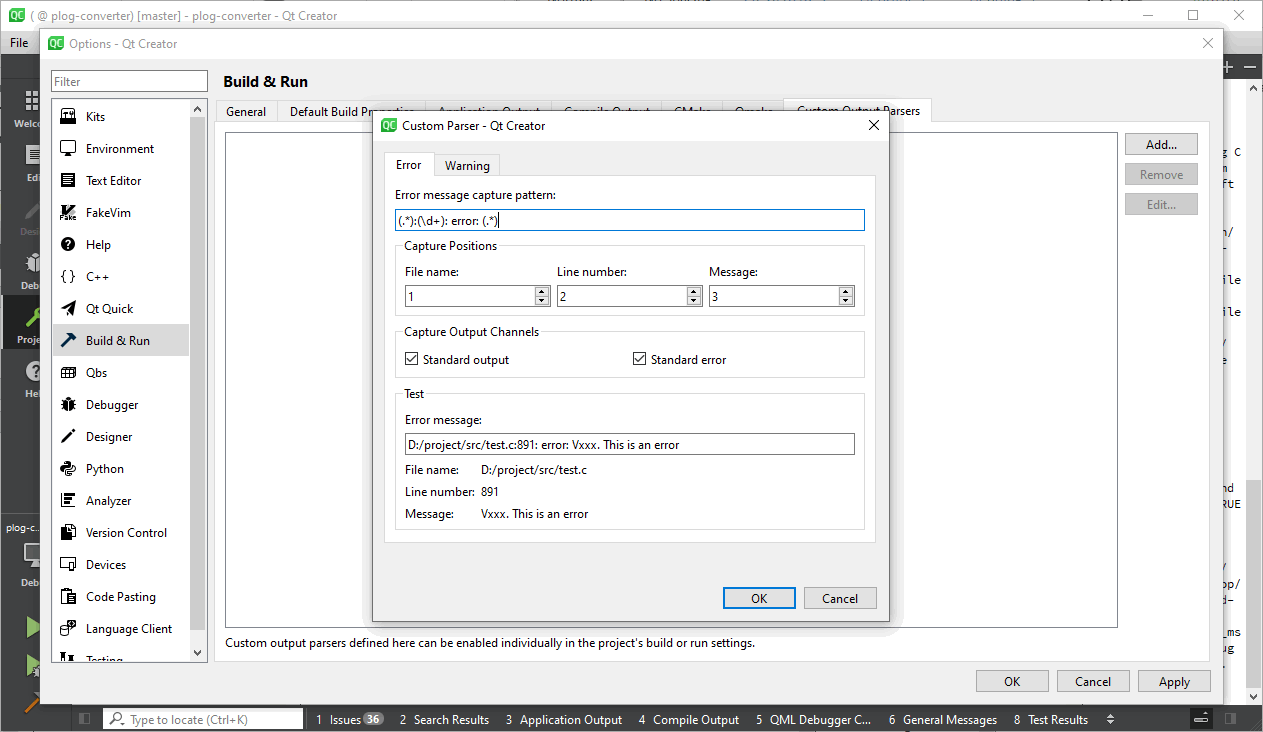
3. After configuring the regular expressions, click 'Ok'. Select a new parser and restart analysis.

As a result, the analyzer warnings will appear in the 'Issues' pane.
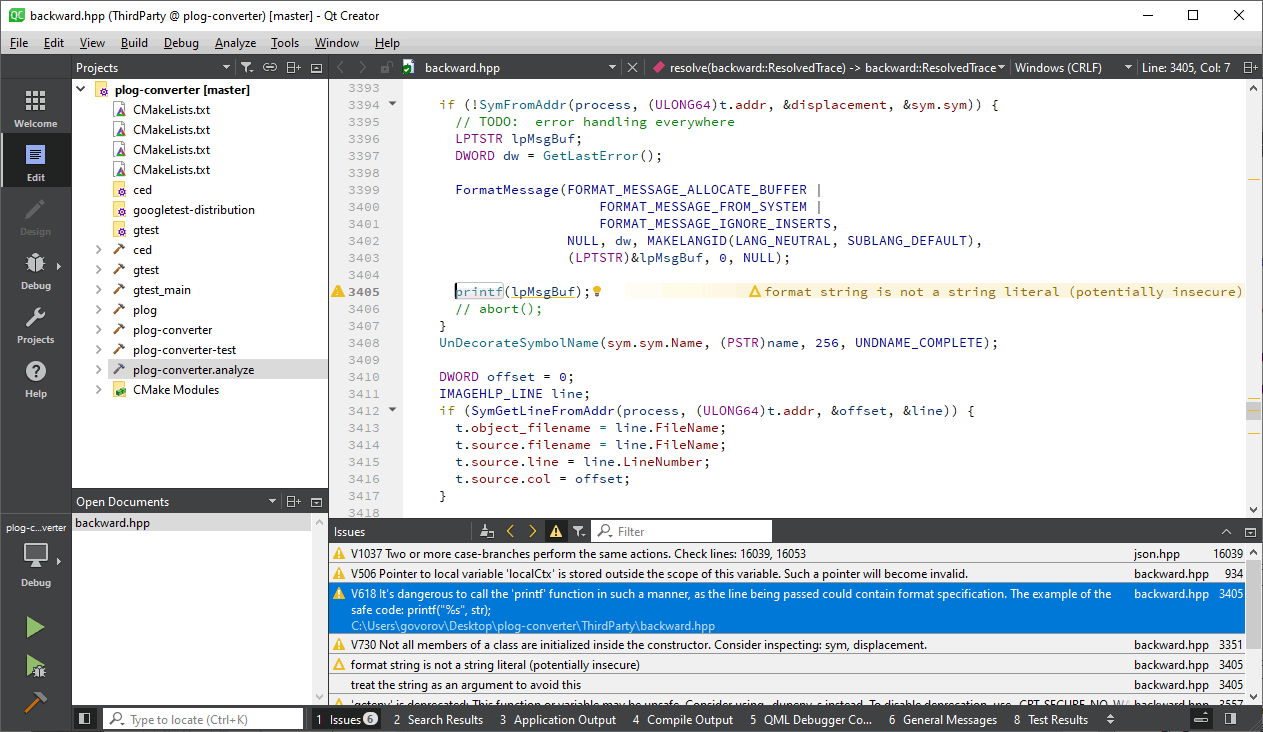
How to use the PVS-Studio extension for Qt Creator
- How to install and update the PVS-Studio extension
- Interface
- Running PVS-Studio analysis
- How to work with analysis results
- How to configure the plugin
The PVS-Studio plugin for Qt Creator provides an easy-to-use graphical interface for analyzing projects and individual files, as well as for handling the analyzer's warnings. In this document, you can find instructions on how to install and configure the extension as well as main use case scenarios.
How to install and update the PVS-Studio extension
First, you need to get the right extension version. You can find it in the PVS-Studio installation directory.
- For Windows, the default path is 'C:\Program Files (x86)\PVS-Studio\QtCreatorPlugins'.
- For Linux/macOS: '$PREFIX/lib/pvs-studio/plugins', where '$PREFIX' is the installation prefix (often it's '/usr').
Supported versions of Qt Creator
Due to restrictions of the Qt Creator integrated development environment, you can run only those plugin versions that were created specifically for this IDE. Currently, the following versions are supported: 8.0.x, 9.0.x, 10.0.x, and 11.0.x.
The 'x' character in the name of the plugin file can be replaced by any digit. That is, the 8.0.x version support means that the plugin is compatible with versions 8.0.0, 8.0.1, and 8.0.2.
The target version of Qt Creator and a platform are specified in the plugin archive's name. For example: 'pvs-studio-qtcreator-11.0.x-7.25.73595.503.windows.zip' or 'libpvs-studio-qtcreator-11.0.x-7.25.73595.503.linux.tar.gz'.
Installation with Qt Creator Wizard
To install the PVS-Studio extension, open Qt Creator and select 'Help' -> 'About Plugins':

Click 'Install Plugin...':

In the installation wizard, specify the location of the plugin archive (depending on the platform, the plugin file will have the '.zip' or '.tar.gz' extension).
Note: do not extract the plugin from the archive before installing it. Qt Creator Wizard claims to support direct plugin installation. However, this method often fails in practice. Therefore, we recommend installing the plugins without extracting them.

The installation wizard will ask you to specify a location where the plugin will be installed. Select the preferred option, click Next, and confirm the installation.
Note: administrator rights may be required for the "Qt Creator installation" location. Otherwise, you will get an error saying that you do not have permission to install the plugin to this directory.

No confirmation window will be displayed when the plugin installation is complete. After closing the installation wizard, click "OK". A message will appear saying that new plugins will be available only after restarting Qt Creator. Click 'Restart Now', and the IDE will automatically restart.

Manual installation
If you are unable to install the plugin using the installation wizard, you can do it manually. To do this, copy the plugin file to the directory with plugins for Qt Creator. Depending on the platform, the file will have the '.dll' or '.so' extension. By default, Qt Creator searches for plugins in the following directories:
Windows:
%Qt_installation_directory%\Tools\QtCreator\lib\qtcreator\plugins
%APPDATA%\Local\QtProject\qtcreator\plugins\%qt_creator_version%Linux:
/opt/Qt/Tools/QtCreator/lib/qtcreator/pluginsManual installation (option two)
You can use this option when it's impossible to install the plugin in standard directories. When starting Qt Creator, you can specify additional directories to search for plugins. Specify these directories using the '-pluginpath' flag.
For example, you can run the IDE with the following command:
- Windows: qtcreator.exe -pluginpath "%path_to_plugin_directory%"
- Linux: qtcreator -pluginpath "$path_to_plugin_directory"
How to update the plugin
To update the plugin, simply delete the files of previous versions, choose a preferred way to install the new version, and install it. You can find the plugin location by selecting 'Details' in the list of installed plugins.

How to troubleshoot problems with plugin running
When you run Qt Creator, you may see a message: the PVS-Studio plugin cannot be loaded because the suitable dependencies cannot be found (as shown below). To fix it, check the plugin version and the Qt Creator version used. You can find the Qt Creator version by going 'Help' -> 'About Qt Creator'. The plugin version is specified in the name of its file.

Since Qt Creator does not have a plugin update system, the following window may appear after updating the plugin.

The plugin has detected that you are using multiple versions at once and has automatically disabled all versions except the latest one. It is highly recommended to uninstall older versions. For your convenience, the message also lists all detected plugin versions and their locations. The currently active plugin is marked with [Active].
Interface
The PVS-Studio plugin for Qt Creator integrates into the menu bar of the IDE and the output panel.
Integration into the menu bar
After the plugin is installed, the PVS-Studio item appears in the 'Analyze' dropdown menu. This item contains the following options:
Check runs analysis.
Analysis after Build gives you quick access to incremental analysis activation.
Open/Save allows you to load and save reports.
Recent Reports stores a list of last opened reports for quick navigation. By clicking on this menu item, you can start loading the selected file.
Help contains links to the documentation and the most important pages of the analyzer website.
Options opens the Qt Creator settings in the PVS-Studio section.

Integration into the output panel
An additional item named 'PVS-Studio' appears in the Qt Creator output panel.

The PVS-Studio window has the following items:
1 — report control bar. The first button allows clearing the current table with warnings. The two other buttons (with arrows) allow you to navigate the table. Please note that these buttons don't navigate table rows, but positions. That is, navigating the table will open the files specified in the warnings.
2 — quick filters bar. Contains buttons for displaying additional menu and advanced filters as well as certainty level checkboxes and buttons with warning categories. When you click on the hamburger button, you'll see the following items:

- Check contains options for running the analysis.
- Open/Save allows you to upload/save the report.
- Show False Alarms shows/hides warnings marked as false alarms. The number in parenthesis shows the number of false alarms in the current report. When you activate it, an additional column appears in the warning table.
- Options... shows the Qt Creator's settings window with the active PVS-Studio section.
- Edit Source Tree Root... allows you to quickly change the Source Tree Root settings. When activated, this item calls a dialog window where you can choose the existing directory. Please note that this option is visible only if the report contains warnings with relative paths to files. You can read more about this setting in the additional functionality section.
3 — the output area. This area solely consists of table with warnings. Further we'll describe this item in more detail.
4 — the panel control elements. The first button allows you to expand the output area by height, the second one allows you to hide the panel.
5 — a button to display the PVS-Studio panel.
Integration into settings
Integration into settings adds a new section named "PVS-Studio" into a list of existing sections.
The PVS-Studio settings section is divided into 5 subsections (one tab for each section). For more information on the purpose of each section and the settings included in them, see the "How to configure the plugin" section.
Running PVS-Studio analysis
The plugin can analyze projects and their parts as well as individual files. Currently, the plugin supports the following project types:
- CMake;
- Qmake;
- Qbs.
There are several ways to run the analysis:
- via the Analyze menu in the main Qt Creator window;
- via the context menu in the project tree (projects, folders, and individual files are supported);
- via the menu in the PVS-Studio output panel;
- via the context menu of the current file;
When running the analysis with any of the listed methods, a window with the analysis progress will appear in the notification area. The analyzer warnings will appear in the table as they are received. You can stop the analysis that has already started using a special button in the header of the output panel. Alternatively, you can click "cross" that is located at the end of the notification progress bar (hover the cursor over the progress bar to see it).

When starting the analysis, the contents of the '.PVS-Studio' folder in the project's source code directory are also checked. If there are user configuration files (with the *.pvsconfig extension) or suppress files (with the *.suppress.json extension), they will be passed to the analyzer for further processing.
Note: at the moment, the PVS-Studio plugin for Qt Creator supports the handling of only one suppress file. A special entry will appear in the report if multiple suppress files are found. It will also indicate which file is being used in the analysis.
In case of issues with running the analysis, a pop-up window with a detailed description of an issue will be displayed.
Additional analysis modes
The plugin supports incremental analysis. In this mode, the analysis will automatically start every time the project is built successfully. However, the analyzer will check only those files that have been changed since its last running. If you want to know more about the incremental analysis mode, see the specific documentation.
You can enable incremental analysis in the plugin settings (General->Incremental analysis). You can also use the 'Analysis after Build' menu item in the PVS-Studio submenu of the main window.

The plugin also provides the intermodular analysis mode. PVS-Studio's intermodular analysis extends the capabilities of interprocedural analysis to functions which declared in translation units that are different from the one to which the currently analyzed file belongs. Check the documentation to learn more on what intermodular analysis is, and what are its benefits.
To run the intermodular analysis, select the 'Analyze with PVS-Studio (Intermodular)' item in the context menu of the top-level project. Intermodular analysis of individual project parts is not possible.

How to work with analysis results
Note: the PVS-Studio extension for Qt Creator supports reports only in the JSON format. To display the report in a different format, you need to convert it to the JSON format.
To convert the report, use command-line utilities (PlogConverter.exe for Windows and plog-converter for Linux / macOS). These utilities allow not only to convert PVS-Studio reports into different formats, but also process it. For example, filter warnings. Read more about these utilities here.
Example of a command to convert the PVS-Studio report to the JSON format using PlogConverter.exe (Windows):
PlogConverter.exe path\to\report.plog -t json ^
-n PVS-StudioExample of a command to convert the PVS-Studio report to the JSON format using plog-converter (Linux and macOS):
plog-converter path/to/report/file.json -t json \
-o PVS-Studio.jsonHow to upload the PVS-Studio JSON report in Qt Creator
If you already have the PVS-Studio report, and you want to view it in Qt Creator, open the PVS-Studio panel, click on the menu button and select 'Open/Save' -> 'Open Analysis Report...':

You can also open the report using the menu bar: 'Analyze -> PVS-Studio -> Open/Save -> Open Analysis Report...':

After you select and upload the report, you'll get the output area and the warnings displayed in a table:

How to navigate the report
The PVS-Studio result output window is designed to simplify navigation through the project code and code fragments containing potential errors. Double-click on the warning in the table to open the position (a file and a code line) to which the warning was issued.
Left-click on the table header to sort the contents by the selected column.
Right-click on the table header to open the context menu. Using this menu, you can show/hide additional columns as well as display full paths to files in the position column.

The warning table supports multiple selection. To activate it, left-click on and hold it while scrolling through the rows. You can also use keyboard shortcuts:
- 'Shift+Click 'or 'Shift+arrows' — multiple selection/cancel
- 'Ctrl+Click' – single selection/cancel
Note: almost all elements in the plugin have tooltips. To see them, hold the cursor over the item for a few seconds.
Columns in the report and their purpose
Level shows the unnamed first column. It displays correspondence between the certainty level and color (importance/certainty in the descending order): red — High level, orange — Medium level, yellow — Low level.
Star shows if the warnings are marked as favorite. Click on a cell in this column to mark the warning as favorite or remove the mark. This is helpful when you noticed an interesting warning and would like to return to it later.
ID shows the warning's order number in a report. This is helpful when you need to sort the report in order in which warnings are received from the analyzer.
Code shows which warnings relate to which diagnostics. Click on this cell to see the documentation on the diagnostic rule.
CWE shows the correspondence between diagnostics and the CWE classification. Click on this cell to open the documentation with the description of this security weakness.
SAST shows the diagnostics' compliance with various safety and security standards (SEI CERT, MISRA, AUTOSAR, etc.).
Message shows the text of a warning issued by the analyzer.
Project shows the name of a project, the analysis of which resulted in a warning.
Position shows the position (file name and a line number, separated by a colon), to which a warning was issued. If you need to view the full path to the file, right-click on the table header and select 'Show full path to file'. If the analyzer warning contains several positions, (...) appears at the end of it. In this case, when you click on the position column, you'll see a list with all additional positions.

FA shows if the warning is marked as false alarm.
Note: some columns may be hidden by default. To display/hide them, right-click on the table header. In the context menu, select 'Show Columns' and then select the desired column.
Context menu
When you right-click on any warning, you'll see the context menu with a list of available additional actions:

The 'Mark As' menu contains commands to quickly mark or remove the mark from the selected warnings. As for now, you can mark warnings as favorites or as false alarms. Please note that the contents of this menu change depending on the status of selected warnings.
'Suppress selected messages' allows you to suppress the currently selected messages to the suppression file. See the "How to suppress warnings" section for more details.
The 'Copy to clipboard' menu allows copying information about selected warnings. Contains several sub-items:
- All copies full information about the warning (a diagnostic number, security classifiers, a full analyzer message, a file name, and a string). Note that CWE and/or SAST ids will be included in the message only if the corresponding columns are displayed;
- Message copies only the warning text;
- Path to file copies the full path to file.
'Hide all %N errors' allows to hide all warnings related to this diagnostic from the report. When you click on this item, a pop-up window appears to confirm the operation. If you confirm the operation, the analyzer messages will be filtered out instantly.

The 'Don't check files from' submenu contains parts of the path to the position's file. Use this item when you need to hide all warnings issued on files from the selected directory. When you select a value, a pop-up window appears to confirm the operation. This window also contains a tip on how to disable this filter:

The 'Analyzed source files' menu contains a list of files, analysis of which resulted in this warning. This menu is helpful when warnings were issued on header files.
How to filter a report
The PVS-Studio filtering mechanisms allow you to quickly find and display diagnostic messages separately or in groups.
All filtering mechanisms (quick and advanced filters) listed below can be combined with each other and with sorting simultaneously. For example, you can filter messages by level and diagnostic groups, exclude all messages except for those containing specified text, and then sort them by position.
Quick filters
The quick filters bar contains several buttons that allow you to enable/disable displaying warnings from certain diagnostic groups. When the list of active categories changes, all filters are also re-calculated.

Note: the button for the 'Fails' group is displayed only if the report contains errors related to the analyzer (Their 'Code' starts with V0..).
You can read a detailed description of the certainty levels and diagnostic groups in the documentation section "Getting acquainted with the PVS-Studio static code analyzer on Windows".
Advanced filters
You can see advanced filters if you click on 'Quick Filters'. The status of the additional filters bar (shown/hidden) does not affect the active filters. That is, you can hide this bar and filters won't be reset.

When you activate it, you'll see an additional bar that contains an input field to filter all table columns. The bar also has a button for quick clearing all filters (Clear All).

To activate the filter, press 'Enter' after you enter the text in the input field. Please note that some filters support multiple filtering (for example, Code). When you hover the cursor over the input field, a tooltip with this remainder will appear.
How to suppress warnings
When you run the analyzer for the first time to check a large project, there may be a lot of warnings. We recommend you to note the most interesting ones and hide the rest using the warning suppression mechanism.
To suppress all warnings, select 'Suppress All Messages' from the plugin menu:

If you click it, an additional window will appear asking you which warning messages you would like to suppress:
- All suppresses all the warnings in the table (even those that are hidden with filters and settings);
- Only Filtered suppresses only those warnings that are currently in the table.

To suppress warnings to an existing suppression file, select the desired item. If the warning suppression file is not found, it will be created in the following directory: '%root_directory_of_a_project's_ source_code%/.PVS-Studio'.
If the suggested option doesn't work for you, you can use targeted warning suppression. To do this, select the necessary rows in the table, open the context menu, and select 'Add message to suppression file'.

How to configure the plugin
To access the Qt Creator plugin settings, select the PVS-Studio section in the general settings list. You can also use the 'Options...' menu items of the plugin.
The plugin settings are stored in the 'qtcsettings.json' file which is located in:
- Windows: '%APPDATA%\PVS-Studio\qtcsettings.json';
- Linux/macOS: '~/.config/PVS-Studio/qtcsettings.json'.
All plugin settings are divided into 5 tabs:
- General shows general plugin settings;
- Detectable Errors shows configuration of active warnings;
- Don't Check Files filters warnings by path masks and file names;
- Keyboard Message Filtering filters warnings by keywords;
- Registration is a field where you can enter your registration data for the analyzer.
The 'General' tab
This tab contains the basic settings of the analyzer and the plugin.

Incremental analysis enables the incremental analysis mode.
Remove intermediate files automatically deletes temporary files that the analyzer created during a session.
Analysis Timeout allows you to set the time (in seconds) after which the analysis of the current file will be skipped.
Thread Count shows the number of threads used for analysis. The larger value may speed up the analysis, although it may cause the analyzer to crash due to the lack of memory. It's better to set the value that is equal to the number of your processor's physical cores.
Display false alarms enables/disables displaying false positive warnings in the report. If you activate this setting, a new column appears in the report table.
Save file after False Alarm mark saves the changed file after a False Alarm comment is inserted.
Source Tree Root contains a path which should be used to open positions that use relative paths. For example, the '\test\mylist.cpp' relative path is written in the warning, while Source Tree Root contains the 'C:\dev\mylib' path. If the plugin tries to go to the position from the warning, the 'C:\dev\mylib\test\mylist.cpp' file will be opened.
For a detailed description of using relative paths in the PVS-Studio report files, see here.
Help Language specifies the preferred language of the documentation. This setting is used to open the documentation on the analyzer website.
The 'Detectable Errors' tab
This tab contains a list and a description of all analyzer warnings. In this tab, you can also enable/disable diagnostic groups or separate diagnostic rules.

In the upper part of the window, you can do a full-text search for the description of the diagnostics and their numbers. If you click on the diagnostic's code, a corresponding documentation will open. If you hover the cursor over the text, you'll see a tooltip with a full text of the diagnostic rule. When you click on 'OK' or 'Apply', a warning table is updated to match the current filters.
All diagnostics are divided into groups. You can set the following states for them:
- Disabled is used if a category is disabled and all its warnings will not be shown in the warning list. Also, its button will be hidden from the quick filters bar (except for the General category).
- Custom is used if the category is active and the items have different states.
- Show All activates the category and all its child items.
- Hide All deactivates the category and its child items. The category button remains on the quick filters bar.
The full list of diagnostics is available on the "PVS-Studio Messages" page.
The 'Don't Check Files' tab
This tab contains lists for filtering warnings by file names or path masks. If the name or path meets at least one mask, it will be hidden from the report.

The following wildcard characters are supported:
* — any number of any characters
? — any one character
To add an entry, click on 'Add' and enter the text in the field that appears. To remove an entry, select it and click on 'Remove'. Entries with empty fields will be deleted automatically. You can edit the existing entries by double-clicking on it or by selecting it and clicking on 'Edit'.
When you click on 'OK' or 'Apply', a warning table is updated to match the current filters.
The 'Keyword Message Filtering' tab
The tab contains a keyword editor, warnings with which will be hidden in reports. Keywords from this list are checked only by the data in the 'Message' column.

This feature can be helpful if you need to hide warnings from a specific function and class — just add them to the list.
The 'Registration' tab
The tab contains a form for entering the license data, which will be used when running the analyzer. The registration process is described here.

Shortcuts
Shortcuts speed up the processing of the analysis results. You can assign/change the shortcuts in the 'Options -> Environment -> Keyboard' settings. To find them faster, type 'PVS-Studio' into the 'Keyboard Shortcuts' window search field.

Analysis of C and C++ projects based on JSON Compilation Database
General information
One of the ways to represent the structure of a C++ project is the JSON Compilation Database format. It's a file that contains the compilation parameters necessary to create object files from the source code of a project. Usually, the file has the name 'compile_commands.json'. A compilation database in JSON-format consists of an array of "command objects", where each command object specifies one way a translation unit is compiled in the project.
You can use the 'compile_commands.json' file to compile a project or analyze the project by third-party utilities. The PVS-Studio C and C++ analyzer works with this format as well.
Running the analysis and getting the report
To analyze the project on Linux and macOS, you need to use 'pvs-studio-analyzer' utility. To analyze the project on Windows, use 'CompileCommandsAnalyzer.exe' utility. The utility is usually located in the 'C:\Program Files (x86)\PVS-Studio' folder. Read more information about CompileCommandsAnalyzer and pvs-studio-analyzer here.

Important: The project must be successfully compiled and built to be analyzed.
To start the analysis and get the report, you need to run two commands.
The command example for Linux and macOS:
pvs-studio-analyzer analyze -f path_to_compile_commands.json \
-o pvs.log -e excludepath -j<N>
plog-converter -a GA:1,2 -t tasklist -o project.tasks pvs.logThe command example for Windows:
CompilerCommandsAnalyzer.exe analyze ^
-f path_to_compile_commands.json ^
-o pvs.log -e exclude-path -j<N>
PlogConverter.exe -a GA:1,2 -t Plog -o path_to_output_directory ^
-n analysis_report pvs.logIf you run the analysis from the directory with the 'compile_commands.json' file, you may disable the '-f' flag.
To exclude directories with third-party libraries and/or tests from the analysis, you can use the '-e' flag. If there are several paths, it's necessary to write the '-e' flag for each path:
-e third-party -e testsThe analysis can be parallelized into multiple threads with the help of '-j' flag.
More detailed instructions for utilities on Linux/macOS and Windows are available here and here.
How to generate compile_commands.json
If by default the project does not contain 'compile_commands.json', you can choose one of the ways to generate such a file.
CMake project
To generate 'compile_commands.json, add one flag to the CMake call:
cmake -DCMAKE_EXPORT_COMPILE_COMMANDS=On .It's possible to create the 'compile_commands.json' file only if the generator supports the JSON format. For example, such generators are Makefile and Ninja:
cmake -DCMAKE_EXPORT_COMPILE_COMMANDS=On -G Ninja .
cmake -DCMAKE_EXPORT_COMPILE_COMMANDS=On -G "NMake Makefiles" .To use the Ninja generator for Windows, it is often required to execute commands from the Visual Studio developer's command line (e.g., 'x64 Native Tools Command Prompt for VS', etc.).
Ninja project
If the project is built directly with Ninja and there is a 'build.ninja' file in the project folder, use the following command to generate 'compile_commands.json':
ninja -t compdb > compile_commands.jsonQBS project
To generate 'compile_commands.json' in a project that use Qt Build System, execute the following command:
qbs generate --generator clangdbText Toolkit utility
Having trouble getting the 'compile_commands.json' file using GNU make? Try Text Toolkit. You can generate a compilation database either using the Web interface (only for Linux and macOS), or by launching a Python script. To generate a database online, take the following steps:
- run the command 'make -nwi > output.txt';
- copy the contents of the 'output.txt ' file and paste them to the window on the Text Toolkit website;
- click the 'Generate' button to generate the compilation database in JSON format;
- copy the obtained commands to the 'compile_commands.json' file.
To generate the 'compile_commands.json' using Python, you need to clone a repository from GitHub and run the following command:
ninja -nv | python path_to_texttoolkit_dir\cdg.pyBear utility (only for Linux and macOS)
The Bear (version 2.4 or higher) utility collects compilation parameters by intercepting the compiler calls during project build. To generate 'compile_commands.json', run the following command
bear -- <build_command>The 'build_command' can be any build command such as 'make all' or './build.sh'.
intercept-build utility (only for Linux and macOS)
The 'intercept-build' utility in scan-build is similar to the Bear utility. The command to generate 'compile_commands.json':
intercept-build <build_command>Compilation Database Generator utility (only for Linux and macOS)
Compile Database Generator (compiledb) is a utility that generates compilation databases for Makefile-based build systems. The example of the 'compile_commands.json' generation:
compiledb -n makeThe '-n' flag means that the build won't happen (dry run).
Xcode project (macOS only)
With the xcpretty utility, you can generate 'compile_commands.json'. To do this, run the following command:
xcodebuild [flags] | xcpretty -r json-compilation-databaseqmake project
To generate 'compile_commands.json' in the project that uses qmake, you can use IDE QtCreator version 4.8 or higher. Open the desired project and select 'Build->Generate Compilation Database for %project_name%' in the menu bar:

The generated 'compile_commands.json' file will be in the project's build directory.
Note: this method of obtaining 'compile_commands.json' does not have automation. We recommend to use this method only to evaluate the analyzer.
Using PVS-Studio with the CMake module
- Before you start
- How to add a module to the project
- How to configure the module
- How to start the analysis
Besides the compile_commands.json mode, you can work with PVS-Studio in CMake with a special CMake module. This mode allows you to integrate the analyzer into a CMake-based project in a deeper way. For example, you can set specific goals for the analysis. Thus, you can check only those parts that you need, not the whole project.
Before you start
Make sure you entered the license key (Linux/macOS section). Otherwise, the analysis won't run. You can read more about entering the license here.
How to add a module to the project
The easiest and recommended way to add a module to the project is to use FetchContent for automatic load. You can do it like this:
include(FetchContent)
FetchContent_Declare(
PVS_CMakeModule
GIT_REPOSITORY "https://github.com/viva64/pvs-studio-cmake-module.git"
GIT_TAG "master"
)
FetchContent_MakeAvailable(PVS_CMakeModule)
include("${pvs_cmakemodule_SOURCE_DIR}/PVS-Studio.cmake")Such code will load the Git repository with the module into the generated cache folder. Thus, you'll integrate the analyzer into your project. Note: master is the latest version. If you have problems with it, try to take the latest release tag of the current analyzer's version.
You can load the file with the PVS-Studio.cmake module yourself if you don't want to have unnecessary dependencies on FetchContent.
Don't forget to update the module with the release of a new analyzer's version to avoid problems in its work. In the GIT_TAG parameter, you can specify the master branch to always use the latest version of the module.
How to configure the module
To run the analyzer, CMake module adds a separate target for the build. When you run the build of this target, the analysis will run with the parameters that you specified when adding this target. To add the analysis target, use the pvs_studio_add_target command. For example:
cmake_minimum_required(VERSION 3.5)
project(pvs-studio-cmake-example CXX)
add_executable(example main.cpp)
# Optional:
# include(FetchContent)
# FetchContent_Declare(....)
# FetchContent_MakeAvailable(....)
include(PVS-Studio.cmake)
pvs_studio_add_target(TARGET example.analyze ALL
OUTPUT FORMAT json
ANALYZE example
MODE GA:1,2
LOG target.err
ARGS -e /path/to/exclude-path)This small CMake file contains one target to build the executable file and one target to run the analysis. Let's look at the parameters of the pvs_studio_add_target command:
Target options
- ALL — the analysis is started automatically when the all target is built. So, it will work with each project build;
- TARGET — the name of the target created for the analysis. To run the analysis, just build this target;
- ANALYZE — targets to analyze. To also analyze the dependencies of these targets, add the RECURSIVE flag;
- RECURSIVE — recursively analyze targets dependencies;
- COMPILE_COMMANDS — use compile_commands.json instead of specifying targets in the ANALYZE option. It works with CMAKE_EXPORT_COMPILE_COMMANDS and available only when you use Makefile or Ninja generators.
Output options
- OUTPUT — prints the analyzer output into the build log;
- LOG — the report file. If you don't specify it, the PVS-Studio.log file will be used in the directory with the CMake cache;
- FORMAT — the report format. In this case, json is an error format with support for multi-file navigation. You can find a list of available formats here (section "Plog Converter utility");
- MODE — enable diagnostic groups and their levels.
Analysis options
- PLATFORM - platform name. Available options: win32, x64/win64, linux32, linux64, macos, arm (IAR Embedded Workbench), pic8 (MPLAB XC8), tms (Texas Instruments C6000);
- PREPROCESSOR - preprocessed file format (clang/visualcpp/gcc);
- LICENSE — path to the .lic file;
- CONFIG — path to the .cfg file;
- CFG_TEXT — contents of the .cfg file;
- SUPPRESS_BASE — path to the suppress file in the .suppress.json format;
- KEEP_COMBINED_PLOG — do not delete the combined .pvs.raw file for subsequent processing by the plog-converter utility.
Other options
- DEPENDS — additional dependencies for the target;
- SOURCES — list of source files for analysis;
- BIN — path to pvs-studio-analyzer (macOS/Linux) or CompilerCommandsAnalyzer.exe (Windows);
- CONVERTER — path to plog-converter (macOS/Linux) or HtmlGenerator.exe (Windows);
- C_FLAGS — additional flags for the C compiler;
- CXX_FLAGS — additional flags for the C++ compiler;
- ARGS — additional arguments for pvs-studio-analyzer/CompilerCommandsAnalyzer.exe;
- CONVERTER_ARGS — additional arguments for plog-converter/HtmlGenerator.exe .
How to exclude files from analysis
To exclude files from analysis, use the ARGS option by passing the paths through the -e (‑‑exclude-path) flag, as shown in the example above. You can specify absolute, relative paths, or a search mask (glob). Note that relative paths will be expanded in relation to the build directory. This approach allows you, for example, to exclude third-party libraries from the analysis.
How to start the analysis
To start the analysis, build the target added to pvs_studio_add_target. For example, this is how the analysis run looks like for the example above:
cmake --build <path-to-cache-dir> --target example1.analyzeBefore the run, all the targets specified for analysis in the ANALYZE parameter are built.
Here you can find examples of the PVS-Studio integration in CMake.
Running PVS-Studio in Docker
- Linux Docker images for projects in C and C++
- Linux Docker images for projects in Java
- Windows Docker images for projects in C, C++, and C#
- Windows Docker images for projects in Java
- References
Docker is a software for automating deployment and management of applications in environments that support OS-level virtualization (containers). Docker can "pack" an application with its entire environment and dependencies into a container, that can then be deployed at any system with Docker installation.
Below you can read about:
- ways to get Docker images with the latest version of PVS-Studio for various OS and programming languages;
- examples of running analysis in a container;
- ways to configure the analyzer.
Linux Docker images for projects in C and C++
Creating an image
You can use Dockerfile to build an image with the latest version of PVS-Studio included.
On debian-based systems:
FROM gcc:7
# INSTALL DEPENDENCIES
RUN apt update -yq \
&& apt install -yq --no-install-recommends wget \
&& apt clean -yq
# INSTALL PVS-Studio
RUN wget -q -O - https://files.pvs-studio.com/etc/pubkey.txt | apt-key add - \
&& wget -O /etc/apt/sources.list.d/viva64.list \
https://files.pvs-studio.com/etc/viva64.list \
&& apt update -yq \
&& apt install -yq pvs-studio strace \
&& pvs-studio --version \
&& apt clean -yqOn zypper-based systems:
FROM opensuse:42.3
# INSTALL DEPENDENCIES
RUN zypper update -y \
&& zypper install -y --no-recommends wget \
&& zypper clean --all
# INSTALL PVS-Studio
RUN wget -q -O /tmp/viva64.key https://files.pvs-studio.com/etc/pubkey.txt \
&& rpm --import /tmp/viva64.key \
&& zypper ar -f https://files.pvs-studio.com/rpm viva64 \
&& zypper update -y \
&& zypper install -y --no-recommends pvs-studio strace \
&& pvs-studio --version \
&& zypper clean -allOn yum-based systems:
FROM centos:7
# INSTALL DEPENDENCIES
RUN yum update -y -q \
&& yum install -y -q wget \
&& yum clean all -y -q
# INSTALL PVS-Studio
RUN wget -q -O /etc/yum.repos.d/viva64.repo \
https://files.pvs-studio.com/etc/viva64.repo \
&& yum install -y -q pvs-studio strace \
&& pvs-studio --version \
&& yum clean all -y -qNote. PVS-Studio for Linux also can be acquired using following permalinks:
https://files.pvs-studio.com/pvs-studio-latest.deb
https://files.pvs-studio.com/pvs-studio-latest.tgz
https://files.pvs-studio.com/pvs-studio-latest.rpm
Command to build an image:
docker build -t viva64/pvs-studio:7.30 -f DockerfileNote. A base image and dependencies must be changed according to the target project.
Running a container
To start the analysis, for example, of a CMake-based project, execute the following command:
docker run --rm -v "~/Project":"/mnt/Project" \
-w "/mnt/Project" viva64/pvs-studio:7.30 \
sh -c 'mkdir build && cd build &&
cmake -DCMAKE_EXPORT_COMPILE_COMMANDS=On .. && make -j8 &&
pvs-studio-analyzer analyze ... -o report.log -j8 ...'It is recommended that you run the converter of analyzer-generated reports (plog-converter) outside the container to ensure that reports contain correct paths to the source files. The only report type that you may want to generate inside the container is fullhtml (an HTML report file that supports message sorting and code navigation). To have other report types generated, you will need to additionally configure the analyzer.
When checking non-CMake projects in a container using the compiler call tracing mode, you may get this error:
strace: ptrace(PTRACE_TRACEME, ...): Operation not permitted
Error: Command strace returned 1 code.To eliminate this error, run Docker with extended privileges by executing this command:
docker run ... --security-opt seccomp:unconfined ...or like this:
docker run ... --cap-add SYS_PTRACE ...Configuring the analyzer
Specifying the license file
Since a container's lifetime is limited, the analyzer license file should be committed into the image or specified by mounting the directory containing that file and specifying the path to it:
pvs-studio-analyzer analyze ... -l /path/to/PVS-Studio.lic ...Restoring paths to source files in the report
To get a report with correct paths to the source files, specify the path to the project directory first:
pvs-studio-analyzer analyze ... -r /path/to/project/in/container ...After that, run the report converter outside the container.
On Linux or macOS:
plog-converter ... -r /path/to/project/on/host ...On Windows:
PlogConverter.exe ... -r /path/to/project/on/hostOn Windows, you can also use the Compiler Monitoring UI utility to open the report file without converting it.
Excluding directories from analysis
You can exclude the compiler directory or directories with third-party libraries or tests by adding the -e parameter:
pvs-studio-analyzer analyze ... -e /path/to/tests ... -e /path/to/contrib ...Specifying the cross compiler
If your container includes a cross compiler or compiler without aliases (for example, g++-7), its name must be specified additionally:
pvs-studio-analyzer analyze ... -C g++-7 -C compilerName ...Linux Docker images for projects in Java
Creating an image
Installing from an archive
FROM openkbs/ubuntu-bionic-jdk-mvn-py3
ARG PVS_CORE="7.30.80678"
RUN wget "https://files.pvs-studio.com/java/pvsstudio-cores/${PVS_CORE}.zip"\
-O ${PVS_CORE}.zip \
&& mkdir -p ~/.config/PVS-Studio-Java \
&& unzip ${PVS_CORE}.zip -d ~/.config/PVS-Studio-Java \
&& rm -rf ${PVS_CORE}.zipCommand to build an image:
docker build -t viva64/pvs-studio:7.30 -f DockerfileCommitting the analyzer layer
The analyzer is unpacked automatically at the first analysis of a project. You can specify the container's name and perform the analysis first:
docker run --name analyzer
-v "D:\Project":"/mnt/Project"
openkbs/ubuntu-bionic-jdk-mvn-py3
sh -c "cd /mnt/Project && mvn package
&& mvn pvsstudio:pvsAnalyze -Dpvsstudio.licensePath=/path/to/PVS-Studio.lic"and then commit to a new image:
docker commit analyzer viva64/pvs-studio:7.30Note. A base image and dependencies must be changed according to the target project. Make sure you install and launch the analyzer as the same user.
Running the container
Regular checks should be launched in the same way with the ‑‑rm parameter added:
docker run --rm -v "D:\Project":"/mnt/Project"
openkbs/ubuntu-bionic-jdk-mvn-py3
sh -c "cd /mnt/Project
&& mvn package
&& mvn pvsstudio:pvsAnalyze -Dpvsstudio.licensePath=/path/to/PVS-Studio.lic"Configuring the analyzer
When integrating PVS-Studio into Maven or Gradle, you can configure the analyzer according to the instructions from the documentation:
- Integrating PVS-Studio Java into the Gradle build system
- Integrating PVS-Studio Java into the Maven build system
Windows Docker images for projects in C, C++, and C#
Creating an image
To build a ready-made image with the latest version of the PVS-Studio analyzer, you can use the following Dockerfile:
# escape=`
FROM mcr.microsoft.com/dotnet/framework/runtime:4.8
SHELL ["cmd", "/S", "/C"]
# INSTALL chocolatey
RUN `
@"%SystemRoot%\System32\WindowsPowerShell\v1.0\powershell.exe" -NoProfile`
-InputFormat None -ExecutionPolicy Bypass `
-Command " [System.Net.ServicePointManager]::SecurityProtocol = 3072; `
iex ((New-Object System.Net.WebClient).DownloadString `
('https://chocolatey.org/install.ps1'))" `
&& `
SET "PATH=%PATH%;%ALLUSERSPROFILE%\chocolatey\bin"
# INSTALL Visual Studio Build Tools components (minimal)
RUN `
choco install -y visualstudio2019buildtools `
--package-parameters "--quiet --wait --norestart --nocache `
--add Microsoft.VisualStudio.Workload.VCTools;includeRecommended `
--add Microsoft.VisualStudio.Workload.ManagedDesktopBuildTools`
;includeRecommended"
# INSTALL PVS-Studio
RUN `
choco install -y pvs-studioAfter running the following command in the Dockerfile directory, you can get a ready-made image:
docker build -t viva64/pvs-studio:7.30 .The ready-made Docker image has minimal dependencies to analyze C++/C# "Hello World" projects. If your project requires additional components of Visual Studio Build Tools, then you should install it by adjusting the script. You can find the list of available components here.
This image has the latest available versions of Build Tools for Visual Studio 2019 and PVS-Studio using Chocolatey. To install a specific version of Build Tools 2019, you need to explicitly specify it during installation. For example,
choco install visualstudio2019buildtools --version=16.10.0.0 ...You can learn more about the available versions here.
If you want to install Build Tools for Visual Studio 2017, use the same installation instructions.
If you don't need Chocolatey, you can install everything yourself by preparing all the the necessary installers. Next to Dockerfile, you need to create a directory with installers of the necessary versions (PVS-Studio, VS Build Tools, etc.). Dockerfile:
# escape=`
FROM mcr.microsoft.com/dotnet/framework/runtime:4.8
SHELL ["cmd", "/S", "/C"]
ADD .\installers C:\Installers
# INSTALL Visual Studio Build Tools components (minimal)
RUN `
C:\Installers\vs_BuildTools.exe --quiet --wait --norestart --nocache `
--add Microsoft.VisualStudio.Workload.VCTools;includeRecommended `
--add Microsoft.VisualStudio.Workload.ManagedDesktopBuildTools`
;includeRecommended `
|| IF "%ERRORLEVEL%"=="3010" EXIT 0
# INSTALL PVS-Studio
RUN `
C:\Installers\PVS-Studio_setup.exe `
/verysilent /suppressmsgboxes /norestart /nocloseapplications
# Cleanup
RUN `
RMDIR /S /Q C:\InstallersNote. If your project requires additional configuration of the environment and dependencies, then you need to modify the Dockerfile yourself accordingly.
Running the container
To run the analysis, when running the container, you need to mount all the necessary external dependencies. For example, the project directory, the file with the analyzer settings (Settings.xml ), etc.
The command to run the analysis may look like this:
docker run --rm -v "path\to\files":"C:\mnt" -w "C:\mnt" \
viva64/pvs-studio:7.30 \
"C:\Program Files (x86)\PVS-Studio\PVS-Studio_Cmd.exe" \
--target ".\Project\Project.sln" --output ".\Report.plog" \
--settings ".\Settings.xml" --sourceTreeRoot "C:\mnt"After that you'll get report "path\to\files\Report.plog". You can open this report in the plugin for Visual Studio or in the Compiler Monitoring UI utility.
Note. The 'sourceTreeRoot' option is the root part of the path. PVS-Studio uses it when generating relative paths in diagnostic messages. This allows us to avoid invalid paths in a report.
Configuring the analyzer
You can configure the analyzer via:
- command line when starting the analyzer;
- special settings file 'Settings.xml'. You can prepare it in advance. For example, you can prepare it using the graphical interface of the plugin for Visual Studio. By default, this file is in the "%AppData%\PVS-Studio\" directory.
Windows Docker images for projects in Java
Creating an image
To make the analyzer core work, you only need to have Java 11+. If you use a build tool (Maven, Gradle), then you also need to configure an environment for it.
To get a Maven Docker image and the latest version of the PVS-Studio analyzer, you can use one of the following options:
Installation from the archive:
# escape=`
FROM csanchez/maven:3.8.3-azulzulu-11-windowsservercore-ltsc2019
SHELL ["cmd", "/S", "/C"]
ARG PVS_CORE="7.30.80678"
RUN `
powershell -Command `
Invoke-WebRequest `
"https://files.pvs-studio.com/java/pvsstudio-cores/%PVS_CORE%.zip" `
-OutFile .\pvs-studio.zip`
&& `
powershell -Command `
Expand-Archive `
-LiteralPath '.\pvs-studio.zip' `
-DestinationPath \"%APPDATA%\PVS-Studio-Java\" `
&& `
DEL /f .\pvs-studio.zipAfter running the following command in the Dockerfile directory, you can get a ready-made image:
docker build -t viva64/pvs-studio:7.30 .A layer commit option with the analyzer
The analyzer is downloaded automatically when you analyze the project for the first time. You can pre-set the container name and run the project analysis:
docker run --name analyzer ^
-v "path\to\project":"C:/mnt/Project" ^
-w C:\mnt\Project ^
csanchez/maven:3.8.3-azulzulu-11-windowsservercore-ltsc2019 ^
mvn package pvsstudio:pvsAnalyzeThen commit to the new image:
docker commit analyzer viva64/pvs-studio:7.30Note. If you use Gradle, you don't need to have a pre-installed build system — gradlew will do everything for you. Therefore, it is enough to take a Java 11+ image as the Dockerfile base.
Running the container
You should run the project analysis regularly in the same way:
docker run --name analyzer ^
--rm ^
-v "path\to\project":"C:/mnt/Project"^
-w C:\mnt\Project^
viva64/pvs-studio:7.30 ^
mvn package pvsstudio:pvsAnalyze '-Dpvsstudio.licensePath=./PVS-Studio.lic'This launch is different from the previous one because we specify the '‑‑rm' option. Thus, the container does not remain in memory after the launch. You also need to specify the path to the license. In this example the license was put in the root of the project.
Note that every time you launch the analysis, Maven will download all the necessary dependencies to its local repository. To avoid this, you can mount the local Maven repository of the host machine at the launch. For example:
docker run ... -v "%M2_REPO%":"C:\Users\ContainerUser\.m2" ...Configuring the analyzer
When integrating PVS-Studio into Maven or Gradle, you can configure the analyzer according to the instructions from the documentation:
- Integrating PVS-Studio Java into the Gradle build system
- Integrating PVS-Studio Java into the Maven build system
References
- Installing and updating PVS-Studio on Linux;
- Installing and updating PVS-Studio on macOS;
- How to run PVS-Studio on Linux and macOS;
- Direct use of Java analyzer from command line.
Running PVS-Studio in Jenkins
- Automating the analyzer run
- Plugin to visualize analysis results
- Warnings Next Generation plugin
- Additional links
Automating the analyzer run
In order to automate the analysis process in CI (Continuous Integration) you have to run the analyzer as a console application.
In Jenkins you can create one of the following build steps:
- Execute Windows batch command
- Windows PowerShell
- Execute shell
and write the analysis command (and the command to convert the report in the needed format).
Examples of commands to run and integrate the analyzer into build systems are given on the following pages of documentation:
- How to run PVS-Studio on Linux and macOS;
- How to run PVS-Studio on Windows;
- How to run PVS-Studio Java.
Plugin to visualize analysis results
Download the PVS-Studio Plugin on the download page in the section about Jenkins. The pvs-studio.hpi file will be saved on the disk. Jenkins plugins are distributed in such packages for manual installation.
You can install the plugin via UI by going to the menu Manage Jenkins > Manage Plugin > Advanced > Upload Plugin > Choose File, or via Jenkins CLI:
java -jar jenkins-cli.jar -s http://localhost:8080/ install-plugin SOURCE ...PVS-Studio Plugin enables publishing static analysis results. To do this, it uses the analyzer report as an .html file, formed in the following ways:
Windows: C, C++, C#
PlogConverter.exe ... --renderTypes Html ...Linux/macOS: C, C++
plog-converter ... --renderTypes html ...Windows/Linux/macOS: Java
In the settings of the plugins for Maven and Gradle in the outputType field set the html value.
To publish the analysis results in the project settings you have to add the post-build step (section Post-build Actions) Publish PVS-Studio analysis result. Mandatory field - Path to PVS-Studio analysis report, which sets the path to the .html file, the contents of which will be displayed on the build page. Relative (related to project's workspace) paths are supported. Jenkins' environment variables are also supported.
If you need to display combined results from several analyzer reports, you can combine them using the above converting utilities. Additional filtration of analysis results is available in a similar way.
To use the plugin from pipeline scripts, add the following:
step([$class: 'PVSStudioPublisher', targetHtmlPath: 'report.html'])where report.html is a path to an .html report file.
After successful publishing of PVS-Studio analysis results, they will be displayed on build pages. The results of the analysis are saved for each build that allows you to view the analyzer report corresponding to a specific build.
If the resulting analyzer report is large, its preview will be displayed on the build page. The full report will be available for viewing by clicking the links View full report over / under the report preview, or Full PVS-Studio analysis report in the menu on the left.
Build page look, displaying the results of PVS-Studio analysis:
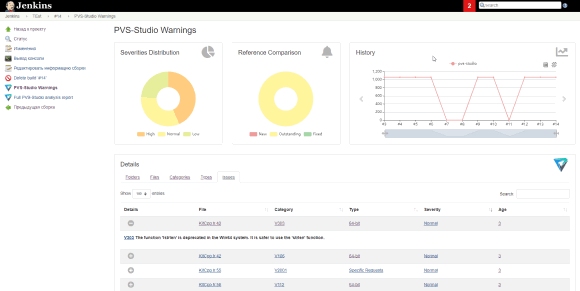
Warnings Next Generation plugin
Warnings NG plugin supports PVS-Studio analyzer reports, starting from the plugin version 6.0.0. This plugin is designed to visualize the results of various analyzers.
You can install the plugin from the standard Jenkins repository in the menu Manage Jenkins > Manage Plugins > Available > Warnings Next Generation Plugin:

To publish the analysis results, in project settings, you have to add the post-build step (Post-build Actions section) Record compiler warnings and static analysis results.. Next, you need to open the list Tool and choose PVS-Studio. In the Report File Pattern field you can specify the mask or the path to the analyzer report. Reports with extensions .plog and .xml.are supported.
The Report Encoding field specifies the encoding in which the report file will be read. If the field is empty, the encoding of the operation system in which Jenkins is run, will be used. Fields Custom ID and Custom Name override the identifier and the name of the chosen utility in the interface.
To publish analysis results through pipeline scripts, add the following:
recordIssues enabledForFailure: true,sourceCodeEncoding:'UTF-8',
tool: PVSStudio(pattern: 'report.plog')where report.plog is the analyzer report.
Here are some ways to generate a report in the needed format:
Windows: C, C++, C#
Reports with .plog extension are standard for Windows.
Linux/macOS: C, C++
plog-converter ... --renderTypes xml ...Windows/Linux/macOS: Java
In the settings for plugin for Maven and Gradle in the outputType field set the value xml.
After building the project a new element will appear in the PVS-Studio Warnings menu on the left. Clicking on it opens a page that visualizes data of the report created by the PVS-Studio analyzer:
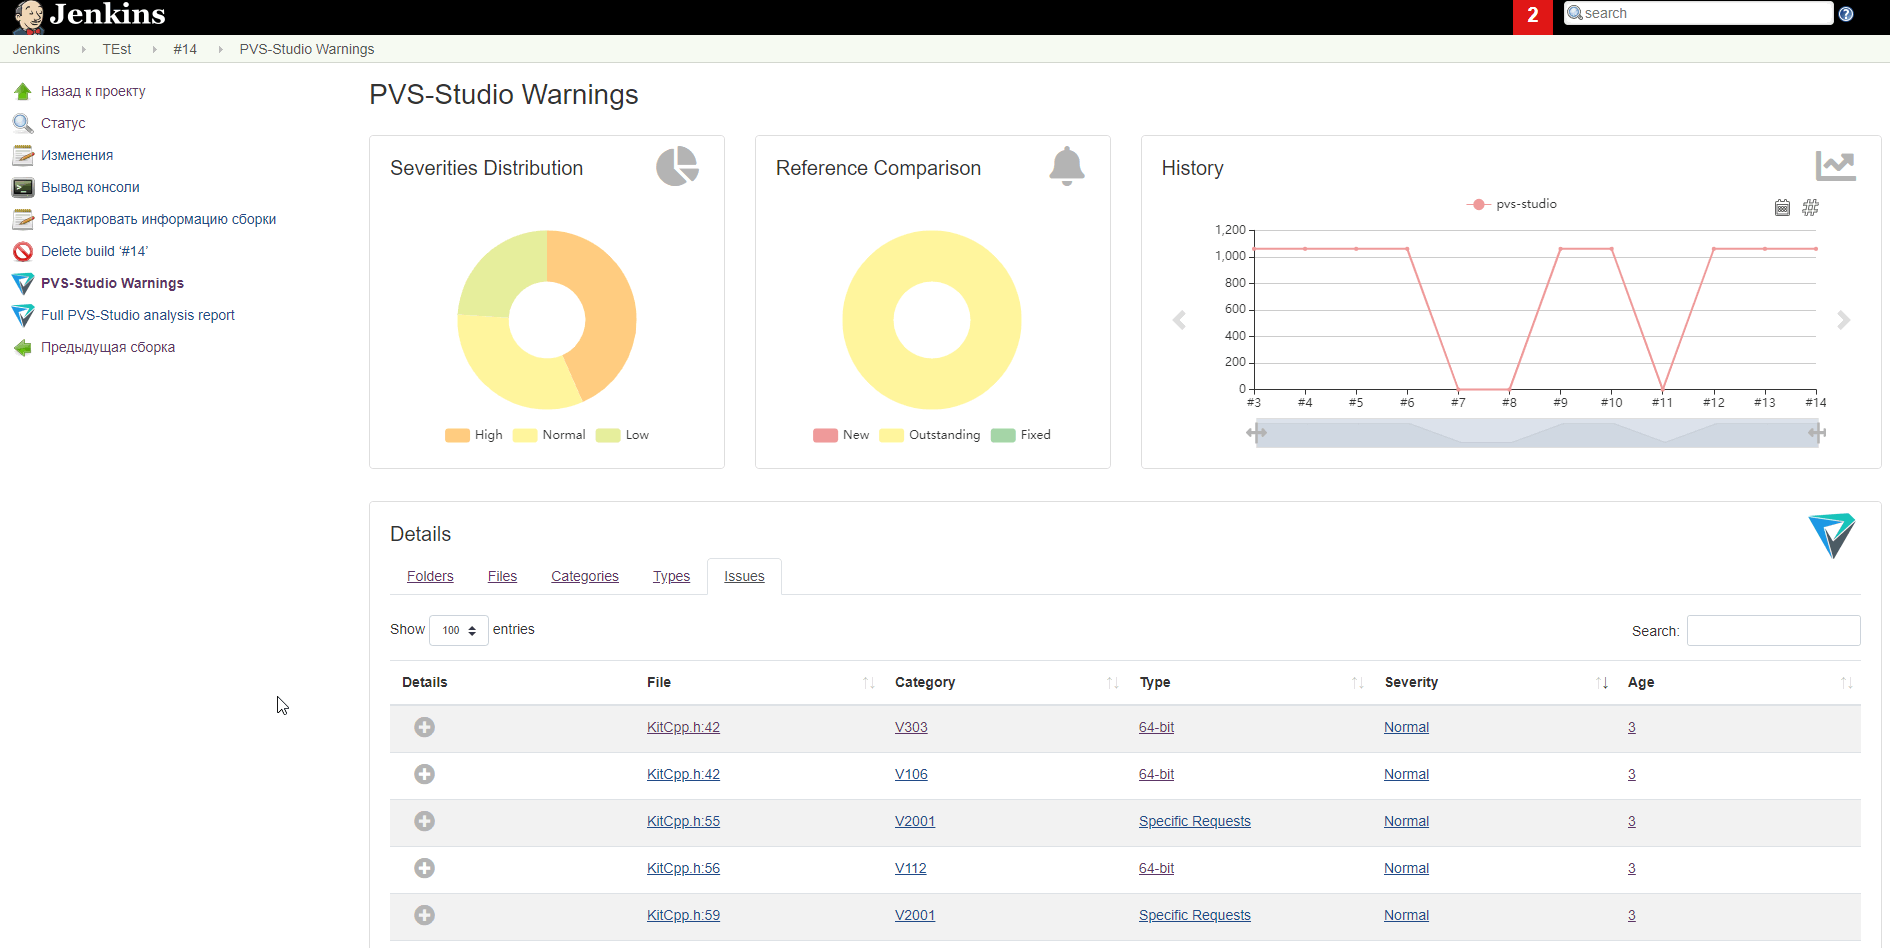
Also, when you click on the value in the File column, the browser will open a source file on the line where the error was found. If the file doesn't open, it means that the report was generated outside the build directory or the files involved in the report have been moved or deleted.
Note. In Jenkins, to view warnings from the uploaded analyzer report in source code files (the links in the File column), the following condition must be met: when starting the Record compiler warnings and static analysis results step (the Post-build Actions section), the project files, whose paths are specified in the analyzer report (*.plog file), should be located in the Jenkins job workspace. The source code files to which the analyzer issued warnings are cached for each build of the Jenkins job. So, after performing the Record compiler warnings and static analysis results step (the Post-build Actions section), you can clear the Jenkins job workspace without losing the ability to view warnings in source code files using Jenkins. If files do not open, then the report was created outside the Jenkins job workspace, or the cached source code files (that were used to create the report) in the Jenkins job build directory have been moved or deleted.

In other CIs, configuration of the analyzer run and handling reports are performed in the same way.
Additional links
- Warnings NG plugin documentation (GitHub);
- Running PVS-Studio in TeamCity;
- PVS-Studio and continuous integration;
- Integrating PVS-Studio analysis results into SonarQube.
Running PVS-Studio in TeamCity
To automate analysis in TeamCity, use the analyzer as a console application.
In TeamCity, create a Build Step with the following parameters:
- Runner type: Command Line;
- Step Name: <name>;
- Run: Custom script;
- Custom script: <script>.
Add two commands to the script: an analysis command and an optional command that converts the report to the format you need.
The documentation below provides sample commands to process analysis results and to integrate analysis into build systems:
- How to run PVS-Studio on Linux and macOS;
- How to run PVS-Studio on Windows;
- How to run PVS-Studio Java.
Viewing analysis results
HTML reports
In TeamCity, you can add HTML analyzer reports to a build's artifacts.
First, generate an HTML report that has the code navigation feature:
Windows: C, C++, C#
PlogConverter.exe ... --renderTypes FullHtml ...Linux/macOS: C, C++
plog-converter ... --renderTypes fullhtml ...Windows/Linux/macOS: Java
Access Maven or Gradle plugin settings. Indicate 'fullhtml' in the 'outputType' field.
Proceed to 'Edit Configuration Settings -> General Settings -> Artifact paths' and specify the HTML report's directory.
After the build succeeds, the analyzer's fullhtml report will be available in artifacts. To access it, open the 'Artifacts' tab and click the 'index.html' file. You can also display the report on a special build session report tab. To do this, proceed to the project settings, open 'Report Tabs' and click 'Create new build report tab'.
In the 'Start page' field, specify the 'index.html' path relative to the artifact folder. For example, if the 'Artifacts' tab looks as follows:

enter 'fullhtml/index.html' into 'Start Page'. After you add the tab, it will display analysis results:
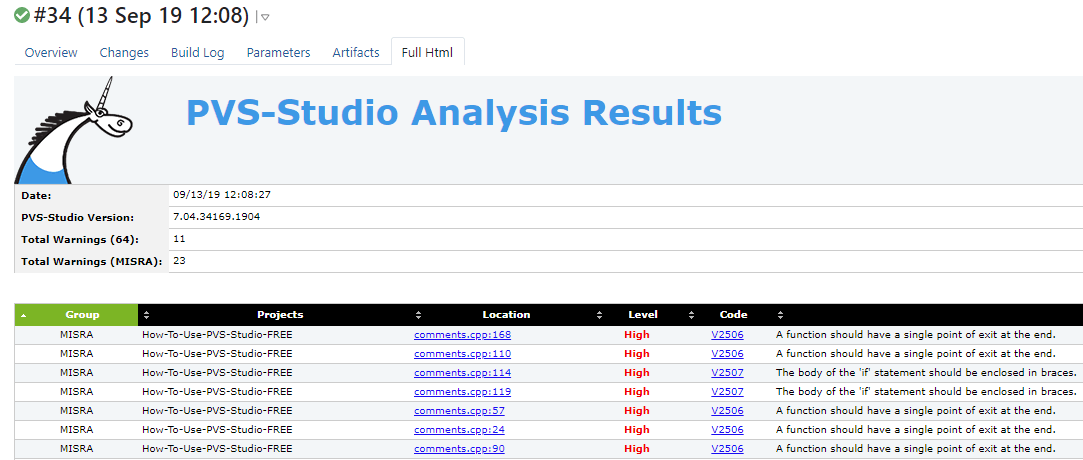
When clicked, analyzer warnings open in a new browser tab:
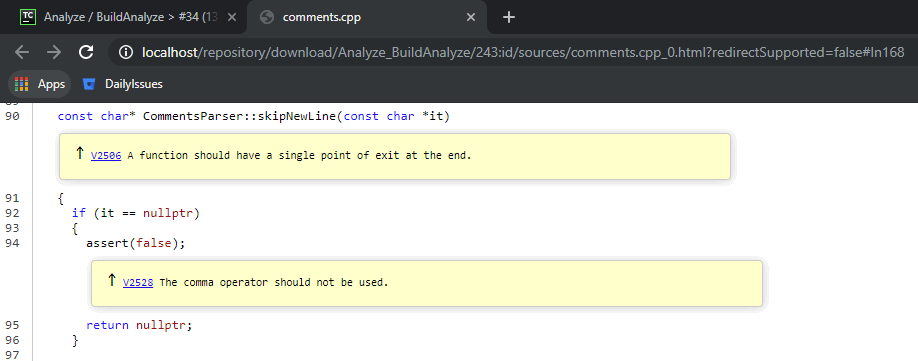
Standard TeamCity reports
The 'plog-converter' utility supports standard TeamCity reports - TeamCity Inspections Type. After generating a report, print it with stdout at any step of the build.
Below are ways to do it:
Windows: C, C++, C#
PlogConverter.exe ... –-renderTypes=TeamCity -o TCLogsDir ...
Type TCLogsDir\MyProject.plog_TeamCity.txtLinux/macOS: C, C++
plog-converter ... -t teamcity -o report_tc.txt ...
cat report_tc.txtWindows/Linux/macOS: Java
Support is coming soon.
After the build succeeds, TeamCity will display the analyzer report on a new build information tab:
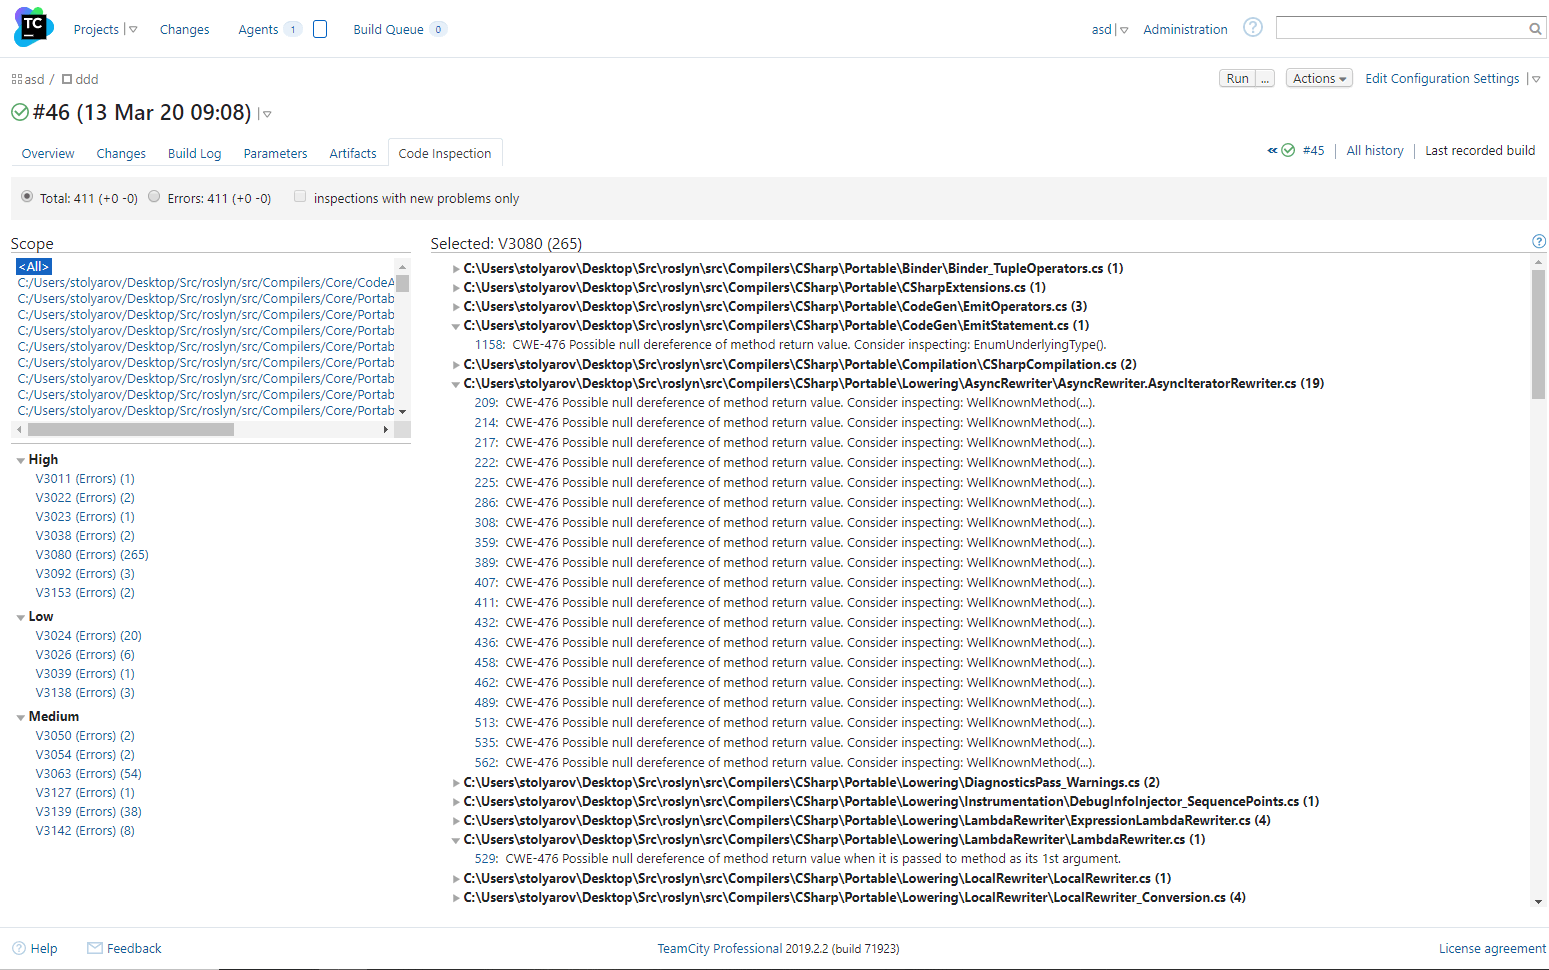
To navigate to the code that triggered a diagnostic, click the line number to the left of this diagnostic. TeamCity will take you to the code if the following conditions are met: you have specified the absolute source file path, your project is open in an IDE (Eclipse, Visual Studio, IntelliJ IDEA), and you have installed the TeamCity plugin.
Running PVS-Studio in Travis CI
Travis CI is a service to build and test software stored on GitHub. Travis CI does not require program code changes to use it. Travis CI stores all its settings in the '.travis.yml' file located in the repository root.
This documentation describes an example of the PVS-Studio integration for analyzing C and C++ code. The commands to run PVS-Studio for analyzing C# or Java code will be different. Please consult the following documentation sections: "Analyzing Visual Studio / MSBuild / .NET projects from the command line using PVS-Studio" and "Direct use of Java analyzer from command line".
Prepare the CI
First, define variables needed to create the analyzer license file and to mail analysis reports. To switch to the Settings page, click the "Settings" button to the left of the required repository.

This opens the Settings window.

Settings are grouped into the following sections:
- "General" settings configure task auto-run triggers;
- "Auto Cancellation" settings affect a build's auto-cancellation;
- "Environment Variables" settings allow you to define environment variables that contain public or confidential information, such as credentials or ssh keys;
- "Cron Jobs" settings configure task run schedule.
In the "Environment Variables" section, create the 'PVS_USERNAME' and 'PVS_KEY' variables that store the static analyzer's username and license key.

Add the 'MAIL_USER' and 'MAIL_PASSWORD' variables that contain the username and password for the email where you want to receive reports.

At the task's start, Travis CI gets instructions from the '.travis.yml' file that is in the repository root.
You can use Travis CI to run static analysis on a virtual machine or within a pre-configured container. These two approaches produce the same result. However, if you have a container with a specific environment where you run and test your product, and do not want to reproduce this environment in Travis CI, you can use an existing Docker container to run the analyzer.
Running the analyzer on a virtual machine
This tutorial uses a virtual machine based on Ubuntu Trusty to build and test a project.
First, specify the project's language (in this case, it's C) and list compilers required to build the project:
language: c
compiler:
- gcc
- clangNote: if you specify more than one compiler, tasks for each of them will run in parallel. For more information, see the documentation.
Add the analyzer's repository, and set dependencies and additional packages:
before_install:
- sudo add-apt-repository ppa:ubuntu-lxc/daily -y
- wget -q -O - https://files.pvs-studio.com/etc/pubkey.txt |sudo apt-key add -
- sudo wget -O /etc/apt/sources.list.d/viva64.list
https://files.pvs-studio.com/etc/viva64.list
- sudo apt-get update -qq
- sudo apt-get install -qq coccinelle parallel
libapparmor-dev libcap-dev libseccomp-dev
python3-dev python3-setuptools docbook2x
libgnutls-dev libselinux1-dev linux-libc-dev pvs-studio
libio-socket-ssl-perl libnet-ssleay-perl sendemail
ca-certificatesThen prepare the project's environment:
script:
- ./coccinelle/run-coccinelle.sh -i
- git diff --exit-code
- export CFLAGS="-Wall -Werror"
- export LDFLAGS="-pthread -lpthread"
- ./autogen.sh
- rm -Rf build
- mkdir build
- cd build
- ../configure --enable-tests --with-distro=unknownProceed to create a license file and start the project's analysis.
The first command gets the '$PVS_USERNAME' and '$PVS_KEY' values from the project settings and uses this data to create the analyzer's license file.
- pvs-studio-analyzer credentials $PVS_USERNAME $PVS_KEY -o PVS-Studio.licThe next command runs the project build trace:
- pvs-studio-analyzer trace -- make -j4Then start static analysis.
Note: when using a trial license, specify the '‑‑disableLicenseExpirationCheck ' parameter.
- pvs-studio-analyzer analyze -j2 -l PVS-Studio.lic
-o PVS-Studio-${CC}.log
–-disableLicenseExpirationCheckThe last command converts analysis results to an html report.
- plog-converter -t html PVS-Studio-${CC}.log
-o PVS-Studio-${CC}.htmlSince TravisCI does not allow changes in email notifications, use the 'sendemail' package:
- sendemail -t mail@domain.com
-u "PVS-Studio $CC report, commit:$TRAVIS_COMMIT"
-m "PVS-Studio $CC report, commit:$TRAVIS_COMMIT"
-s smtp.gmail.com:587
-xu $MAIL_USER
-xp $MAIL_PASSWORD
-o tls=yes
-f $MAIL_USER
-a PVS-Studio-${CC}.log PVS-Studio-${CC}.htmlBelow is the entire contents of the '.travis.yml' file used to configure running PVS-Studio analysis in TravisCI:
language: c
compiler:
- gcc
- clang
before_install:
- sudo add-apt-repository ppa:ubuntu-lxc/daily -y
- wget -q -O - https://files.pvs-studio.com/etc/pubkey.txt |sudo apt-key add -
- sudo wget -O /etc/apt/sources.list.d/viva64.list
https://files.pvs-studio.com/etc/viva64.list
- sudo apt-get update -qq
- sudo apt-get install -qq coccinelle parallel
libapparmor-dev libcap-dev libseccomp-dev
python3-dev python3-setuptools docbook2x
libgnutls-dev libselinux1-dev linux-libc-dev pvs-studio
libio-socket-ssl-perl libnet-ssleay-perl sendemail
ca-certificates
script:
- ./coccinelle/run-coccinelle.sh -i
- git diff --exit-code
- export CFLAGS="-Wall -Werror"
- export LDFLAGS="-pthread -lpthread"
- ./autogen.sh
- rm -Rf build
- mkdir build
- cd build
- ../configure --enable-tests --with-distro=unknown
- pvs-studio-analyzer credentials $PVS_USERNAME $PVS_KEY -o PVS-Studio.lic
- pvs-studio-analyzer trace -- make -j4
- pvs-studio-analyzer analyze -j2 -l PVS-Studio.lic
-o PVS-Studio-${CC}.log
--disableLicenseExpirationCheck
- plog-converter -t html PVS-Studio-${CC}.log -o PVS-Studio-${CC}.html
- sendemail -t mail@domain.com
-u "PVS-Studio $CC report, commit:$TRAVIS_COMMIT"
-m "PVS-Studio $CC report, commit:$TRAVIS_COMMIT"
-s smtp.gmail.com:587
-xu $MAIL_USER
-xp $MAIL_PASSWORD
-o tls=yes
-f $MAIL_USER
-a PVS-Studio-${CC}.log PVS-Studio-${CC}.htmlRunning the analyzer within a container
To run the static analyzer in a container, first, use the following 'Dockerfile' to create the container:
FROM docker.io/ubuntu:trusty
ENV CFLAGS="-Wall -Werror"
ENV LDFLAGS="-pthread -lpthread"
RUN apt-get update && apt-get install -y software-properties-common wget \
&& wget -q -O - https://files.pvs-studio.com/etc/pubkey.txt |
sudo apt-key add - \
&& wget -O /etc/apt/sources.list.d/viva64.list
https://files.pvs-studio.com/etc/viva64.list \
&& apt-get update \
&& apt-get install -yqq coccinelle parallel
libapparmor-dev libcap-dev libseccomp-dev
python3-dev python3-setuptools docbook2x
libgnutls-dev libselinux1-dev linux-libc-dev
pvs-studio git libtool autotools-dev automake
pkg-config clang make libio-socket-ssl-perl
libnet-ssleay-perl sendemail ca-certificates \
&& rm -rf /var/lib/apt/lists/*The configuration file to start the container may look as follows:
before_install:
- docker pull docker.io/oandreev/lxc
env:
- CC=gcc
- CC=clang
script:
- docker run
--rm
--cap-add SYS_PTRACE
-v $(pwd):/pvs
-w /pvs
docker.io/oandreev/lxc
/bin/bash -c " ./coccinelle/run-coccinelle.sh -i
&& git diff --exit-code
&& ./autogen.sh
&& mkdir build && cd build
&& ../configure CC=$CC
&& pvs-studio-analyzer credentials
$PVS_USERNAME $PVS_KEY -o PVS-Studio.lic
&& pvs-studio-analyzer trace -- make -j4
&& pvs-studio-analyzer analyze -j2
-l PVS-Studio.lic
-o PVS-Studio-$CC.log
--disableLicenseExpirationCheck
&& plog-converter -t html
-o PVS-Studio-$CC.html
PVS-Studio-$CC.log
&& sendemail -t mail@domain.com
-u 'PVS-Studio $CC report, commit:$TRAVIS_COMMIT'
-m 'PVS-Studio $CC report, commit:$TRAVIS_COMMIT'
-s smtp.gmail.com:587
-xu $MAIL_USER -xp $MAIL_PASSWORD
-o tls=yes -f $MAIL_USER
-a PVS-Studio-${CC}.log PVS-Studio-${CC}.html"Note: To start the container, specify the '‑‑cap-add SYS_PTRACE' or '‑‑security-opt seccomp:unconfined' parameter. This is necessary because Travis CI uses the system 'ptrace' call for compilation tracing.
Receiving analysis results
After you upload the '.travis.yml' configuration file to the repository root, Travis CI gets notified about changes in the project and automatically starts the build.
The console displays detailed build and analysis information.

After Travis CI completes the tests, it emails two messages with static analysis results - one for each compiler that built the project, in this case, for 'gcc' and 'clang'.
Running PVS-Studio in CircleCI
CircleCI is a cloud CI service that allows developers to build, test and deploy software automatically. You can use the service to build container software and software on Windows, Linux and macOS virtual machines.
This documentation describes an example of the PVS-Studio integration for analyzing C and C++ code. The commands to run PVS-Studio for analyzing C# or Java code will be different. Please consult the following documentation sections: "Analyzing Visual Studio / MSBuild / .NET projects from the command line using PVS-Studio" and "Direct use of Java analyzer from command line".
Configuring CI
When you run a project build, CircleCI reads the task's configuration from the following repository file: '.circleci/config.yml'.
Before adding the configuration file, create variables to store analyzer license data, and add them to the project. To do this, click 'Settings' in the left navigation panel, choose 'Projects' in the 'ORGANIZATION' group and click a gear to the right of the required project.

In the settings window, access the 'Environment Variables' section and create the 'PVS_USERNAME' and 'PVS_KEY' variables that contain your PVS-Studio username and license key.

Now create the '.circleci/config.yml' file.
First, indicate the image of the virtual machine where you plan to build and analyze your project. The full list of images is available here.
version: 2
jobs:
build:
machine:
image: ubuntu-1604:201903-01Next, use the package manager to add repositories and install the project's tools and dependencies:
steps:
- checkout
- run: sudo -- sh -c "
add-apt-repository -y ppa:team-xbmc/xbmc-ppa-build-depends
&& add-apt-repository -y ppa:wsnipex/vaapi
&& add-apt-repository -y ppa:pulse-eight/libcec
&& apt-get update"
- run: sudo apt-get install -y
automake autopoint build-essential cmake
curl default-jre gawk gdb gdc gettext git-core
gperf libasound2-dev libass-dev libbluray-dev
libbz2-dev libcap-dev libcdio-dev libcec4-dev
libcrossguid-dev libcurl3 libcurl4-openssl-dev
libdbus-1-dev libegl1-mesa-dev libfmt3-dev
libfontconfig-dev libfreetype6-dev libfribidi-dev
libfstrcmp-dev libgif-dev libgl1-mesa-dev
libglu1-mesa-dev libiso9660-dev libjpeg-dev
liblcms2-dev libltdl-dev liblzo2-dev libmicrohttpd-dev
libmysqlclient-dev libnfs-dev libpcre3-dev libplist-dev
libpng-dev libpulse-dev libsmbclient-dev libsqlite3-dev
libssl-dev libtag1-dev libtinyxml-dev libtool libudev-dev
libusb-dev libva-dev libvdpau-dev libxml2-dev libxmu-dev
libxrandr-dev libxrender-dev libxslt1-dev libxt-dev
mesa-utils nasm pmount python-dev python-imaging
python-sqlite rapidjson-dev swig unzip uuid-dev yasm
zip zlib1g-dev wgetAdd the PVS-Studio repository and install the analyzer:
- run: wget -q -O - https://files.pvs-studio.com/etc/pubkey.txt
| sudo apt-key add -
&& sudo wget -O /etc/apt/sources.list.d/viva64.list
https://files.pvs-studio.com/etc/viva64.list
- run: sudo -- sh -c "apt-get update
&& apt-get install pvs-studio -y"Build project dependencies:
- run: sudo make -C tools/depends/target/flatbuffers PREFIX=/usr/localGenerate the project build script:
- run: mkdir build && cd build && cmake -DCMAKE_BUILD_TYPE=Debug ..Register and run PVS-Studio
Use the following command to register the analyzer's license:
- run: pvs-studio-analyzer credentials -o PVS.lic ${PVS_USER} ${PVS_KEY}One possible way to analyze a C++ project is to trace compiler calls when building a project:
- run: pvs-studio-analyzer trace -- make -j2 -C build/After tracing, run the analysis:
- run: pvs-studio-analyzer analyze -j2 -l PVS.lic
-o PVS-Studio.log --disableLicenseExpirationCheckThe analysis will issue a file with "raw" analysis results. Convert it to an html report:
- run: plog-converter -t html -o PVS-Studio.html PVS-Studio.logAfter the tests are complete, you can store the analysis results as an artifact:
- run: mkdir PVS_Result && cp PVS-Studio.* ./PVS_Result/
- store_artifacts:
path: ./PVS_ResultBelow is the complete '.circleci/config.yml' file's contents:
version: 2.1
jobs:
build:
machine:
image: ubuntu-1604:201903-01
steps:
- checkout
- run: sudo -- sh -c "
add-apt-repository -y ppa:team-xbmc/xbmc-ppa-build-depends
&& add-apt-repository -y ppa:wsnipex/vaapi
&& add-apt-repository -y ppa:pulse-eight/libcec
&& apt-get update"
- run: sudo apt-get install -y automake autopoint
build-essential cmake curl default-jre gawk gdb
gdc gettext git-core gperf libasound2-dev libass-dev
libbluray-dev libbz2-dev libcap-dev libcdio-dev
libcec4-dev libcrossguid-dev libcurl3 libcurl4-openssl-dev
libdbus-1-dev libegl1-mesa-dev libfmt3-dev libfontconfig-dev
libfreetype6-dev libfribidi-dev libfstrcmp-dev libgif-dev
libgl1-mesa-dev libglu1-mesa-dev libiso9660-dev libjpeg-dev
liblcms2-dev libltdl-dev liblzo2-dev libmicrohttpd-dev
libmysqlclient-dev libnfs-dev libpcre3-dev libplist-dev
libpng-dev libpulse-dev libsmbclient-dev libsqlite3-dev
libssl-dev libtag1-dev libtinyxml-dev libtool libudev-dev
libusb-dev libva-dev libvdpau-dev libxml2-dev libxmu-dev
libxrandr-dev libxrender-dev libxslt1-dev libxt-dev mesa-utils
nasm pmount python-dev python-imaging python-sqlite
rapidjson-dev swig unzip uuid-dev yasm zip zlib1g-dev wget
- run: wget -q -O - https://files.pvs-studio.com/etc/pubkey.txt
| sudo apt-key add –
&& sudo wget -O /etc/apt/sources.list.d/viva64.list
https://files.pvs-studio.com/etc/viva64.list
- run: sudo -- sh -c "apt-get update && apt-get install pvs-studio -y"
- run: sudo make -C tools/depends/target/flatbuffers PREFIX=/usr/local
- run: mkdir build && cd build && cmake -DCMAKE_BUILD_TYPE=Debug ..
- run: pvs-studio-analyzer credentials -o PVS.lic ${PVS_USER} ${PVS_KEY}
- run: pvs-studio-analyzer trace -- make -j2 -C build/
- run: pvs-studio-analyzer analyze -j2 -l PVS.lic
-o PVS-Studio.log --disableLicenseExpirationCheck
- run: plog-converter -t html -o PVS-Studio.html PVS-Studio.log
- run: mkdir PVS_Result && cp PVS-Studio.* ./PVS_Result/
- store_artifacts:
path: ./PVS_ResultAfter these instructions are uploaded to the repository, CircleCI automatically starts the project build.

After the analysis is finished, you can download analysis result files from the 'Artifacts' tab.

Running PVS-Studio in GitLab CI/CD
Running PVS-Studio in GitLab CI/CD
GitLab is an online service designed to manage repositories. You can register an account and use GitLab's official website. Alternatively, you can install and deploy GitLab on your server.
This documentation describes an example of the PVS-Studio integration for analyzing C and C++ code. The commands to run PVS-Studio for analyzing C# or Java code will be different. Please consult the following documentation sections: "Analyzing Visual Studio / MSBuild / .NET projects from the command line using PVS-Studio" and "Direct use of Java analyzer from command line".
When starting a task, GitLab CI uses instructions from the '.gitlab-ci.yml' file. There are two ways to add this file: you can create it in a local repository and upload it to the website, or click the 'Set up CI/CD' button to add it. For this tutorial, use the second option:

Write a sample script:
image: debian
job:
script:Download the analyzer and the 'sendemail' utility:
- apt-get update && apt-get -y install wget gnupg
- wget -O - https://files.pvs-studio.com/etc/pubkey.txt | apt-key add -
- wget -O /etc/apt/sources.list.d/viva64.list
https://files.pvs-studio.com/etc/viva64.list
- apt-get update && apt-get -y install pvs-studio
sendemailNext, install build utilities and dependencies. Refer to this OBS build as an example:
- apt-get -y install build-essential cmake
make pkg-config libx11-dev libgl1-mesa-dev
libpulse-dev libxcomposite-dev
libxinerama-dev libv4l-dev libudev-dev libfreetype6-dev
libfontconfig-dev qtbase5-dev
libqt5x11extras5-dev libx264-dev libxcb-xinerama0-dev
libxcb-shm0-dev libjack-jackd2-dev libcurl4-openssl-dev
libavcodec-dev libqt5svg5 libavfilter-dev
libavdevice-dev libsdl2-dev ffmpeg
qt5-default qtscript5-dev libssl-dev
qttools5-dev qttools5-dev-tools qtmultimedia5-dev
libqt5svg5-dev libqt5webkit5-dev libasound2
libxmu-dev libxi-dev freeglut3-dev libasound2-dev
libjack-jackd2-dev libxrandr-dev libqt5xmlpatterns5-dev
libqt5xmlpatterns5 coccinelle parallel
libapparmor-dev libcap-dev libseccomp-dev
python3-dev python3-setuptools docbook2x
libgnutls28-dev libselinux1-dev linux-libc-dev
libtool autotools-dev
libio-socket-ssl-perl
libnet-ssleay-perl ca-certificatesCreate an analyzer license file. By default, the 'PVS-Studio.lic' file is created in the '~/.config/PVS-Studio' directory by default. In this case, you do not need to specify the license file in the analyzer startup settings. The analyzer will recognize it automatically:
- pvs-studio-analyzer credentials $PVS_NAME $PVS_KEY
Here, 'PVS_NAME' and 'PVS_KEY' are variables for the PVS-Studio username and license key. You can specify these values in the repository settings. To set these values, go to 'Settings -> CI/CD -> Variables'.

Call the 'cmake' command to build the project:
- cmake -DCMAKE_EXPORT_COMPILE_COMMANDS=On /builds/Stolyarrrov/obscheck/
- make -j4Then start the analyzer:
- pvs-studio-analyzer analyze -o PVS-Studio.logThe analyzer will issue 'PVS-Studio.log' file with raw analysis results. Use the 'plog-converter' utility to convert them into an easy-to-read format.
For example, convert the report to html:
- plog-converter -t html PVS-Studio.log -o PVS-Studio.htmlTo download the report, you can use artifacts. Alternatively, you can email the report. The code below demonstrates how to do this. Use the 'sendemail' utility:
- sendemail -t $MAIL_TO
-m "PVS-Studio report, commit:$CI_COMMIT_SHORT_SHA"
-s $GMAIL_PORT
-o tls=auto
-f $MAIL_FROM
-xu $MAIL_FROM
-xp $MAIL_FROM_PASS
-a PVS-Studio.log PVS-Studio.htmlThe complete '.gitlab-ci.yml' listing:
image: debian
job:
script:
- apt-get update && apt-get -y install wget gnupg
- wget -O - https://files.pvs-studio.com/etc/pubkey.txt | apt-key add -
- wget -O /etc/apt/sources.list.d/viva64.list
https://files.pvs-studio.com/etc/viva64.list
- apt-get update && apt-get -y install pvs-studio
sendemail
- apt-get -y install build-essential cmake
pkg-config libx11-dev libgl1-mesa-dev
libpulse-dev libxcomposite-dev
libxinerama-dev libv4l-dev libudev-dev libfreetype6-dev
libfontconfig-dev qtbase5-dev
libqt5x11extras5-dev libx264-dev libxcb-xinerama0-dev
libxcb-shm0-dev libjack-jackd2-dev libcurl4-openssl-dev
libavcodec-dev libqt5svg5 libavfilter-dev
libavdevice-dev libsdl2-dev ffmpeg
qt5-default qtscript5-dev libssl-dev
qttools5-dev qttools5-dev-tools qtmultimedia5-dev
libqt5svg5-dev libqt5webkit5-dev libasound2
libxmu-dev libxi-dev freeglut3-dev libasound2-dev
libjack-jackd2-dev libxrandr-dev libqt5xmlpatterns5-dev
libqt5xmlpatterns5 coccinelle parallel
libapparmor-dev libcap-dev libseccomp-dev
python3-dev python3-setuptools docbook2x
libgnutls28-dev libselinux1-dev linux-libc-dev
libtool autotools-dev
make libio-socket-ssl-perl
libnet-ssleay-perl ca-certificates
- pvs-studio-analyzer credentials $PVS_NAME $PVS_KEY
- cmake -DCMAKE_EXPORT_COMPILE_COMMANDS=On /builds/Stolyarrrov/obscheck/
- make -j4
- pvs-studio-analyzer analyze -o PVS-Studio.log
- plog-converter -t html PVS-Studio.log -o PVS-Studio.html
- sendemail -t $MAIL_TO
-m "PVS-Studio report, commit:$CI_COMMIT_SHORT_SHA"
-s $GMAIL_PORT
-o tls=auto
-f $MAIL_FROM
-xu $MAIL_FROM
-xp $MAIL_FROM_PASS
-a PVS-Studio.log PVS-Studio.htmlClick the 'commit' button. If you did everything correctly, you will see the "This GitLab CI configuration is valid" entry. To track the task's progress, go to the 'CI/CD -> Pipelines'.

You can click the 'running' button to see the terminal of the virtual machine that runs the specified build and analysis script. After a while you will get the 'Job succeeded' message.
Converting analysis results into a Code Quality report
To convert the PVS-Studio analysis results into a Code Quality report, use the Plog Converter utility.
To make sure that paths to the source files in the report are displayed correctly, use the ‑‑sourcetree-root (-r) flag when running the analysis. Below is the command to run the analysis:
- pvs-studio-analyzer analyze -r "path/to/build/project" -o PVS-Studio.logThe conversion command:
- plog-converter -t gitlab -o PVS-Studio.log.gitlab.json PVS-Studio.logFor tasks on Windows, use the following command:
- PlogConverter.exe -t GitLab -o .\ PVS-Studio.plogAfter the report is generated, save it as an artifact. To do this, add the step written below to the '.gitlab-ci.yml' configurational file:
artifacts:
reports:
codequality: [./PVS-Studio.log.gitlab.json]As a result, the analyzer warnings will appear in the Code Quality tab.
How to use PVS-Studio in GitHub Actions
GitHub Actions is a platform that allows you to solve CI/CD tasks related to code in GitHub repositories. It automates reactions to events in the repository via scripted Workflows. This allows you to automatically check the project's buildability and start testing as soon as new code is added to repository. Workloads can use the environments of cloud virtual machines or self-hosted agents with the provided configuration.
This documentation describes an example of the PVS-Studio integration for analyzing C and C++ code. The commands to run PVS-Studio for analyzing C# or Java code will be different. Please consult the following documentation sections: "Analyzing Visual Studio / MSBuild / .NET projects from the command line using PVS-Studio" and "Direct use of Java analyzer from command line".
Running full analysis manually
To create a new Workflow, create a YAML script in the directory of the '.github/workflows' repository.
Let's look at the following example of the 'build-analyze.yml' script which allows to fully test the project in PVS-Studio:
name: PVS-Studio build analysis
on: workflow_dispatch
jobs:
build-analyze:
runs-on: ubuntu-latest
steps:
- name: Check out repository code
uses: actions/checkout@v2
- name: Install tools
run: |
wget -q -O - https://files.pvs-studio.com/etc/pubkey.txt \
| sudo apt-key add -
sudo wget -O /etc/apt/sources.list.d/viva64.list \
https://files.pvs-studio.com/etc/viva64.list
sudo apt update
sudo apt install pvs-studio
pvs-studio-analyzer credentials ${{ secrets.PVS_STUDIO_CREDENTIALS }}
- name: Build
run: |
cmake -DCMAKE_EXPORT_COMPILE_COMMANDS=On -B build .
cmake --build build -j
- name: Analyze
run: |
pvs-studio-analyzer analyze -f build/compile_commands.json -j
- name: Convert report
run: |
plog-converter -t sarif -o pvs-report.sarif PVS-Studio.log
- name: Publish report
uses: github/codeql-action/upload-sarif@v1
with:
sarif_file: pvs-report.sarif
category: PVS-StudioThe 'name' field at the script's beginning specifies the name of the current Workflow, which will be displayed in the GitHub interface.
The 'on' field determines the event that would trigger the Workflow. The 'workflow_dispatch' value indicates that the task is started manually. To run it, click on the 'Run workflow' button on the corresponding Workflow.
The 'runs-on' field indicates on which system the task should be executed. GitHub Actions provides cloud servers on Windows, Linux, and macOS systems. In this case we use Ubuntu.
Next comes the 'steps' sequence that performs some actions or a sequence of shell commands.
The 'Check out repository code' step downloads the current version of the repository code.
The 'Install tools' step installs and activates PVS-Studio with the registration data. PVS-Studio is activated via an encrypted variable 'secrets.PVS_STUDIO_CREDENTIALS'. It contains user ID and a key.
To create a secret, go to 'Settings > Secrets > Actions' and click the 'New repository secret' button.
Create a new variable with a username and a key. GitHub saves it in encrypted form and after that it cannot be viewed. The variable text is modified even in the console output.

The 'Build' step builds the project. In this case — via CMake. It also generates the 'compile_commands.json' file that's used by the analyzer to determine the analysis targets.
The 'Analyze' step starts the project analysis and saves the result as an internal representation in the 'PVS-Studio.log' default file.
For more information about the pvs-studio-analyzer run parameters, see the documentation.
The 'Convert report' step coverts the analyzer report into the required format, in this case — SARIF. The plog-converter utility converts and combines reports from different analysis runs and filters messages in them.
Finally, the 'Publish report' step publishes the final report, and after that you can view it in the 'Security' tab.
Analysis of changes in the repository
To analyze file changes right after they're sent to the repository, create a new script 'analyze-changes.yml'.
name: PVS-Studio analyze changes
on:
push:
paths:
- '**.h'
- '**.c'
- '**.cpp'
jobs:
analyze-changes:
runs-on: ubuntu-latest
steps:
- name: Check out repository code
....
- name: Get list of changed source files
run: |
echo "$(git diff --name-only \
${{ github.event.before }}..${{ github.event.after }})" \
> source-files.txt
cat source-files.txt
- name: Install tools
....
- name: Build
run: |
cmake -DCMAKE_EXPORT_COMPILE_COMMANDS=On -B build .
cmake --build build -j
- name: Analyze
run: |
pvs-studio-analyzer analyze -f build/compile_commands.json \
-S source-files.txt -j
- name: Convert report
....
- name: Publish report
....The script has the 'push' event that's triggered by changes in the repository. Besides, this event has the 'paths' path filters. Thus, the analysis starts only when the source code files are changed.
The 'Get list of changed source files' step for the 'Analyze' step receives a list of changed files for the analysis.
The complete build of the project here is required if the project has files whose contents are generated during the build process.
Using the GitHub Actions tools, you can implement a variety of scenarios, including changes not only in the main branch, but also in other branches or pull requests.
Running PVS-Studio in Azure DevOps
Azure DevOps is a cloud platform that helps developers write and run applications, and stores data on remote servers. The platform contains the following tools: Azure Pipeline, Azure Board, Azure Artifacts, and others. They speed up development and improve code quality.
This documentation describes an example of the PVS-Studio integration for analyzing C# code. The commands to run PVS-Studio for analyzing C, C++ or Java code will be different. Please consult the following documentation sections: "Cross-platform analysis of C and C++ projects in PVS-Studio" and "Direct use of Java analyzer from command line".
In this tutorial we'll integrate analysis into a project's build.
Go to 'Pipelines -> Builds' and create a new Build pipeline.

Specify the project's source. For example, GitHub.

Authorize the Azure Pipelines application and specify the repository that contains the project.

Choose 'Starter pipeline' as the pipeline template.

To run static code analysis, you can use a Microsoft-hosted or self-hosted agent.
Use a Microsoft-hosted agent
Microsoft-hosted agents are regular virtual machines. You can request one to run a Pipeline. The virtual machine is automatically discarded after the task is completed. These agents are convenient because you do not need to maintain or update them.
Replace the default build configuration with the following code:
# Configure launch triggers. Run only for changes in the master branch.
trigger:
- master
# Since virtual machines do not allow third-party software,
# run a Docker container
# on a Windows Server 1803 virtual machine.
pool:
vmImage: 'win1803'
container: microsoft/dotnet-framework:4.7.2-sdk-windowsservercore-1803
steps:
# Download the analyzer distribution.
- task: PowerShell@2
inputs:
targetType: 'inline'
script: 'Invoke-WebRequest
-Uri https://files.pvs-studio.com/PVS-Studio_setup.exe
-OutFile PVS-Studio_setup.exe'
- task: CmdLine@2
inputs:
workingDirectory: $(System.DefaultWorkingDirectory)
script: |
# Restore the project and download dependencies.
nuget restore .\ShareX.sln
# Create a directory for analyzer report files.
md .\PVSTestResults
# Install the analyzer.
PVS-Studio_setup.exe /VERYSILENT /SUPPRESSMSGBOXES
/NORESTART /COMPONENTS=Core
# Register license information.
"C:\Program Files (x86)\PVS-Studio\PVS-Studio_Cmd.exe"
credentials
-u $(PVS_USERNAME)
-n $(PVS_KEY)
# Run PVS-Studio analysis.
"C:\Program Files (x86)\PVS-Studio\PVS-Studio_Cmd.exe"
-t .\ShareX.sln
-o .\PVSTestResults\ShareX.plog
# Convert the report to the html format.
"C:\Program Files (x86)\PVS-Studio\PlogConverter.exe"
-t html
-o .\PVSTestResults\
.\PVSTestResults\ShareX.plog
# Publish analyzer reports.
- task: PublishBuildArtifacts@1
inputs:
pathToPublish: PVSTestResults
artifactName: PVSTestResultsNow add variables needed to create a license file. To do this, open the Pipeline editing window, and click 'Variables' in the upper-right corner.

Add the 'PVS_USERNAME' and 'PVS_KEY' variables that the username and license key values. When creating the 'PVS_KEY' variable, check 'Keep this value secret'. This keeps the value encrypted and prevents it from showing up on the task execution log.

To analyze the project, click the 'Run' that starts the Pipeline.
Use a self-hosted agent
A second way to run analysis is to use a self-hosted agent. Self-hosted agents are agents you configure and manage on your own. Such agents support more software you may need to build and test a project.
Before you can use these agents for static analysis, configure them as the instructions say, and then install and configure the static analyzer.
To run tasks on self-hosted agents, replace the default configuration with the following code:
# Configure launch triggers. Master branch analysis.
trigger:
- master
# Set tasks to run on a self-hosted agent selected from the 'MyPool' pool.
pool: 'MyPool'
steps:
- task: CmdLine@2
inputs:
workingDirectory: $(System.DefaultWorkingDirectory)
script: |
# Restore the project and download dependencies.
nuget restore .\ShareX.sln
# Create a directory for analysis report files
md .\PVSTestResults
# Run PVS-Studio analysis.
"C:\Program Files (x86)\PVS-Studio\PVS-Studio_Cmd.exe"
-t .\ShareX.sln
-o .\PVSTestResults\ShareX.plog
# Convert the report to the html format.
"C:\Program Files (x86)\PVS-Studio\PlogConverter.exe"
-t html
-o .\PVSTestResults\
.\PVSTestResults\ShareX.plog
# Publish analyzer reports.
- task: PublishBuildArtifacts@1
inputs:
pathToPublish: PVSTestResults
artifactName: PVSTestResultsAfter the task is completed, you can download an archive with reports from the 'Summary' tab. Alternatively, you can get reports by email. Use the Send Mail tool to configure email settings.

Additional features
Completing a run with a failure
If you want the build step to stop and return an error message if there are analyzer warnings, you can use the PlogConverter utility. With PlogConverter utility you can set a warning level at which the run will stop. An example of the code fragment to set the stop step to the end of the configuration:
- task : PowerShell@2
inputs:
targetType: 'inline'
script: |
& "C:\Program Files (x86)\PVS-Studio\PlogConverter.exe" -t json -a GA:1
-o .\PVSTestResults\ .\PVSTestResults\TestTask.plog
--indicateWarnings --noHelpMessages
IF ($LASTEXITCODE -eq 0) {exit 0} ELSE {Write-Host
"##vso[task.logissue type=error]Analysis log contains High level warnings.";
Write-Host "##vso[task.complete result=Failed;]"; exit 0 }Use the ‑‑analyzer (-a) flag of the PlogConverter utility to change the type of warnings the task will respond to.
Viewing analysis results
You can use the SARIF SAST Scans Tab extension to view the analyzer's report on the run results page.
To convert a report to the SARIF format and use the extension, add the following steps:
- task: CmdLine@2
inputs:
workingDirectory: $(System.DefaultWorkingDirectory)
script: "C:\Program Files (x86)\PVS-Studio\PlogConverter.exe" -t sarif
-o .\PVSTestResults\ .\PVSTestResults\TestTask.plog
- task: PublishBuildArtifacts@1
inputs:
PathtoPublish: .\PVSTestResults\TestTask.plog.sarif
ArtifactName: CodeAnalysisLogsAfter completing the pipeline, the analyzer's report will be added to the run result page in the Scans tab.

Running PVS-Studio in AppVeyor
AppVeyor is a continuous integration web service. It is designed to build and test software located on GitHub and a number of other source code storage services.
This documentation describes an example of the PVS-Studio integration for analyzing C and C++ code. The commands to run PVS-Studio for analyzing C# or Java code will be different. Please consult the following documentation sections: "Analyzing Visual Studio / MSBuild / .NET projects from the command line using PVS-Studio" and "Direct use of Java analyzer from command line".
General Settings
You need to set the environment variables that will generate the license file. To do this, go to the desired project, open the 'Settings' tab. In the sidebar that appears, go to the 'Environment' tab. Next, add two variables — 'PVS_KEY' and 'PVS_USERNAME':

They will contain the license key and the user name respectively. These variables are needed to check the analyzer license.
Running PVS-Studio in AppVeyor by example of the C++ project
Analysis of the entire project
To run the analysis, you need to add a script. To do this, go to the 'Tests' tab in the sidebar, click 'Script' in the window that appears:

In the form that appears, add the following code:
sudo apt-get update && sudo apt-get -y install jq
wget -q -O - https://files.pvs-studio.com/etc/pubkey.txt \
| sudo apt-key add -
sudo wget -O /etc/apt/sources.list.d/viva64.list \
https://files.pvs-studio.com/etc/viva64.list
sudo apt-get update && sudo apt-get -y install pvs-studio
pvs-studio-analyzer credentials $PVS_USERNAME $PVS_KEY
PWD=$(pwd -L)
pvs-studio-analyzer analyze -j8 \
-o PVS-Studio.log \
--disableLicenseExpirationCheck
plog-converter -t errorfile PVS-Studio.log --cerr -wNote. Assigning the value of the 'pwd' command to the '$PWD' variable is necessary for the analyzer to work correctly, since AppVeyor modifies the variable to a different value for its service purposes.
The result of the project analysis will be saved to the 'PVS-Studio.errorfile' file.
Documentation on the utilities used:
Pull requests analysis
To analyze pull requests, you need to make additional settings.
On the 'General' tab, enable the build cache saving in Pull Requests (the checkbox is located at the bottom of the page):

Next, go to the 'Environment' tab and specify the folder for caching (the field for adding is at the bottom of the page):

Without this setting, the entire project will be analyzed.
To run the analysis, you need to add a script. To do this, go to the 'Tests' tab in the settings panel, click 'Script' in the window that appears:
In the form that appears, add the following code:
sudo apt-get update && sudo apt-get -y install jq
wget -q -O - https://files.pvs-studio.com/etc/pubkey.txt \
| sudo apt-key add -
sudo wget -O /etc/apt/sources.list.d/viva64.list \
https://files.pvs-studio.com/etc/viva64.list
sudo apt-get update && sudo apt-get -y install pvs-studio
pvs-studio-analyzer credentials $PVS_USERNAME $PVS_KEY
PWD=$(pwd -L)
if [ "$APPVEYOR_PULL_REQUEST_NUMBER" != '' ]; then
PULL_REQUEST_ID="pulls/$APPVEYOR_PULL_REQUEST_NUMBER"
MERGE_BASE=`wget -qO - \
https://api.github.com/repos/${APPVEYOR_REPO_NAME}/${PULL_REQUEST_ID} \
| jq -r ".base.ref"`
git diff --name-only HEAD origin/$MERGE_BASE > .pvs-pr.list
pvs-studio-analyzer analyze -j8 \
-o PVS-Studio.log \
--disableLicenseExpirationCheck \
--dump-files --dump-log pvs-dump.log \
-S .pvs-pr.list
else
pvs-studio-analyzer analyze -j8 \
-o PVS-Studio.log \
--disableLicenseExpirationCheck
fi
plog-converter -t errorfile PVS-Studio.log --cerr -wNote. Assigning the value of the 'pwd' command to the '$PWD' variable is necessary for the analyzer to work correctly, since AppVeyor modifies the variable to a different value for its service purposes.
If the pull request is analyzed, the difference between the branches will be obtained. After that, the analysis for the modified files will start. Otherwise, the entire project will be analyzed.
The result of the project analysis will be saved to the 'PVS-Studio.errorfile' file.
Documentation on the utilities used:
Here is the documentation on the analysis of the pull/merge requests.
Running PVS-Studio in Buddy
Buddy is a platform that allows you to automate the building, testing, and publishing of software. It supports the following hosting services: GitHub, Bitbucket, GitLab.
This documentation describes an example of the PVS-Studio integration for analyzing C and C++ code. The commands to run PVS-Studio for analyzing C# or Java code will be different. Please consult the following documentation sections: "Analyzing Visual Studio / MSBuild / .NET projects from the command line using PVS-Studio" and "Direct use of Java analyzer from command line".
General Settings
Creating a pipeline
First, create a pipeline where the analysis will be launched. To do this, go to the project settings and click 'New pipeline':

In the window that appears, specify the configuration, the pipeline name, and the condition for its launch. After entering the data, click 'Add pipeline':

Pipeline setup (only for pull requests analysis)
To analyze pull requests, select 'On events' as the trigger. The trigger event is 'Git create branch, tag or PR'. Next, go to the trigger settings and add 'all pull requests' on the 'Wildcard' tab:

Choosing a compiler
Once the pipeline is created, you need to specify the compiler to build the project. Let's take GCC as an example and type its name into the search bar:

In the list of found compilers, select the one you need.
Creating environment variables
After the compiler is selected, you need to set the environment variables that will generate the license file. To do this, click 'Variables' and add the 'PVS_USERNAME' and 'PVS_KEY' variables. They will contain the user name and the license key respectively.

Installing the analyzer
Go to the 'Docker' tab and click 'Package & Tools':

In the form that appears, enter the analyzer installation commands:
apt-get update && apt-get -y install wget gnupg jq
wget -q -O - https://files.pvs-studio.com/etc/pubkey.txt | apt-key add -
wget -O /etc/apt/sources.list.d/viva64.list \
https://files.pvs-studio.com/etc/viva64.list
apt-get update && apt-get -y install pvs-studioRunning PVS-Studio in Buddy by example of the C++ project
Analysis of the entire project
To analyze the entire project, go to the 'Run' tab:

In the form that appears, enter the following commands to start the analyzer:
pvs-studio-analyzer credentials $PVS_USERNAME $PVS_KEY
pvs-studio-analyzer analyze -j8 \
-o PVS-Studio.log \
--disableLicenseExpirationCheck
plog-converter -t errorfile PVS-Studio.log --cerr -wAfter entering the data, click 'Add this action'.
After execution of this pipeline, a report will be generated with the analysis results. It will be saved to the 'PVS-Studio.errorfile' file.
Documentation on the utilities used:
Pull requests analysis
To analyze pull requests, go to the 'Run' tab.
In the form that appears, enter the pull/merge requests analysis commands:
pvs-studio-analyzer credentials $PVS_USERNAME $PVS_KEY
if [ "$BUDDY_EXECUTION_PULL_REQUEST_NO" != '' ]; then
PULL_REQUEST_ID="pulls/$BUDDY_EXECUTION_PULL_REQUEST_NO"
MERGE_BASE=`wget -qO - \
https://api.github.com/repos/${BUDDY_REPO_SLUG}/${PULL_REQUEST_ID} \
| jq -r ".base.ref"`
git fetch origin
git diff --name-only HEAD origin/$MERGE_BASE > .pvs-pr.list
pvs-studio-analyzer analyze -j8 \
-o PVS-Studio.log \
--disableLicenseExpirationCheck \
-S .pvs-pr.list
else
pvs-studio-analyzer analyze -j8 \
-o PVS-Studio.log \
--disableLicenseExpirationCheck
fi
plog-converter -t errorfile PVS-Studio.log --cerr -wAfter entering the data, click 'Add this action'.
After execution of this pipeline, a report will be generated with the result of checking the modified files. It will be saved to 'PVS-Studio.errorfile'.
Documentation on the utilities used:
Here is the documentation on the analysis of the pull/merge requests.
Notifying the developer teams (blame-notifier utility)
The blame-notifier utility is meant for automating the process of notifying developers who have committed the code in the repository for which the PVS-Studio analyzer has issued warnings. The analyzer report is passed to the blame-notifier with specification of additional parameters; the utility finds files that triggered warnings and generates an HTML-report for each "guilty" developer. It is also possible to send a full report: it will contain all warnings related to each "guilty" developer.
The blame-notifier utility is available only under the PVS-Studio Enterprise license. You can request the trial Enterprise license here.
Note. The utility's name differs under different platforms. Under Windows it has the name BlameNotifier.exe, under Linux and macOS - blame-notifier. If we aren't talking about the utility for a specific OS, the name "blame-notifier" is used to avoid duplication in this document.
The blame-notifier utility on Linux and macOS requires .NET Runtime 8.0.
Installation
On Windows
The BlameNotifier utility can be found in the PVS-Studio installation directory ("C:\Program Files (x86)\PVS-Studio\" by default).
On Linux
Installation from repositories
For debian-based systems:
wget -q -O - https://files.pvs-studio.com/etc/pubkey.txt | \
sudo apt-key add -
sudo wget -O /etc/apt/sources.list.d/viva64.list \
https://files.pvs-studio.com/etc/viva64.list
sudo apt-get update
sudo apt-get install blame-notifierFor yum-based systems:
wget -O /etc/yum.repos.d/viva64.repo \
https://files.pvs-studio.com/etc/viva64.repo
yum update
yum install blame-notifierFor zypper-based systems:
wget -q -O /tmp/viva64.key https://files.pvs-studio.com/etc/pubkey.txt
sudo rpm --import /tmp/viva64.key
sudo zypper ar -f https://files.pvs-studio.com/rpm viva64
sudo zypper update
sudo zypper install blame-notifierDirect links to download
On macOS
Installation from Homebrew
Installation:
brew install viva64/pvs-studio/blame-notifierUpdate:
brew upgrade blame-notifierDirect links to download
Usage
Use the "‑‑help" flag to display basic information about the utility:
blame-notifier --helpAn example of using the blame-notifier utility (in one line):
blame-notifier path/to/PVS-Studio.log
--VCS Git
--recipientsList recipients.txt
--server ... --sender ... --login ... --password ...Utility options
Here's a quick description of the utility's parameters:
- ‑‑VCS (or -v): required parameter: a type of version control system that the utility will be working with. Supported systems: Git, Svn, Mercurial, Perforce.
- ‑‑recipientsList (or -r): the path to the text file, containing the list of report recipients. The file format is described below.
- ‑‑srcRoot (or -t): sets up a replacement for a special "SourceTreeRoot" marker. If the analyzer's log was generated with this marker, this parameter is needed to restore the paths to files.
- ‑‑analyzer (or -a): filters warnings according to the mask. More details about the filtration masks are given below.
- ‑‑excludedCodes (or -e): sets up the list of warnings (separated with ",") that shouldn't be included in the resulting report.
- ‑‑settings (or -c): sets the path to the PVS-Studio settings file. This flag is relevant only when working on Windows. BlameNotifier will read settings of disabled warnings from the passed settings file. In fact, this parameter expands the list of disabled warnings of the parameter "‑‑excludedCodes".
- ‑‑server (or -x): required parameter: SMTP server for mail sending.
- ‑‑sender (or -s): required parameter: sender's email address.
- ‑‑login (or -l): required parameter: username for authorization.
- ‑‑password (or -w): password for authorization.
- ‑‑port (or -p): mail delivery port (25 by default).
- ‑‑days (or -d): show analyzer warnings for the last N days, where N is a positive value. If the value is not specified or set to 0, all warnings for the entire time period will be displayed.
- ‑‑sortByDate (or -S): sort analysis results by modification date of the source code that triggered analyzer warning. Off by default.
- ‑‑maxTasks (or -m): the maximum number of concurrently running blame-processes. By default, or if a negative number is set, blame-notifier will use 2* N processes (where N is the number of CPU cores).
- ‑‑progress (or -g): turn loggings on/off. Off by default.
- ‑‑enableSSL: enable SSL protocol. Off by default.
- ‑‑vcsBasedRecipientsList: automatically retrieve a list of recipients from the specified VCS. This flag is available for the following VCSs: Perforce. Off by default.
- ‑‑messageSubject: the message subject. If this parameter is not specified, blame-notifier sends a message with a default subject: "Full PVS-Studio Analysis Results for Solution: <SolutionName>"
- ‑‑messageAttachment: a list of paths to files which should be attached to the message. If you need to attach several files, separate the paths with the ';' mark and enclose the list in quotation marks.
When using the utility, at least one of the flags, via which the list of reports recipients is set, has to be specified: '‑‑recipientsList' or '‑‑vcsBasedRecipientsList'.
If necessary, these flags can be used jointly.
Report recipients file format
File format with a list of report recipients:
# Recipients of the full report
username_1 *email_1
...
username_N *email_N
# Recipients of individually assigned warnings
username_1 email_1
...
username_N email_NYou can comment on the line with the symbol "#". For full report recipients, you need to add the "*" symbol at the beginning or end of an email address. The full report will include all warnings sorted by developers.
Format of masks filtration
The filtering masks look like this: MessageType:MessageLevels.
"MessageType" can take one of the following values: GA, OP, 64, CS, MISRA, Fail.
"MessageLevels" can take a value of 1 to 3.
A combination of different masks through ";" is possible (without spaces), for example:
--analyzer=GA:1,2;64:1In this case, general-analysis warnings (GA) of 1 and 2 levels, and 64-bit warnings of the 1 level will be handled.
PVS-Studio and continuous integration
- How to use static analysis most efficiently
- Preparing for CI
- Integrating PVS-Studio into the CI process
- Analyzing the source code of MSBuild / Visual Studio projects
- Analyzing projects that use uncommon build systems
- Handling analysis results
- Sending analysis results via email with help BlameNotifier
- Conclusion
This article discusses integration of PVS-Studio into the continuous integration process on Windows. Integration into the CI process on Linux is discussed in the article "How to run PVS-Studio on Linux".
How to use static analysis most efficiently
Before talking on the subject of this article, it would be useful for you to know that running PVS-Studio solely on the build server is effective yet inefficient. A better solution is to build a system that could perform source code analysis at two levels: locally on the developers' machines and on the build server.
This concept stems from the fact that the earlier a defect is detected, the less expensive and difficult it is to fix. For that reason, you want to find and fix bugs as soon as possible, and running PVS-Studio on the developers' machines makes this easier. We recommend using the incremental analysis mode, which allows you to have analysis automatically initiated only for recently modified code after the build.
However, this solution does not guarantee that defects will never get to the version control system. It is to track such cases that the second security level - regular static analysis on the build server - is needed. Even if a bug does slip in, it will be caught and fixed in time. With the analysis integrated into night builds, you will get a morning report about the errors made the day before and be able to fix the faulty code quickly.
Note. It is not recommended to have the analyzer check every commit on the server, as the analysis process may take quite a long time. If you do need to use it in this way and your project is built with MSBuild build system, use the incremental analysis mode of command line module 'PVS-Studio_Cmd.exe'. For details about this mode, see the section "Incremental analysis in command line module 'PVS-Studio_Cmd.exe'" of this paper. You can also use utility 'CLMonitor.exe' (for C and C++ code only) to analyze your source files in this mode (regardless of the build system). To learn more about the use of 'CLMonitor.exe' utility, see the section "Compiler monitoring system" of this paper.
Preparing for CI
Preparing for integration of PVS-Studio into the CI process is an important phase that will help you save time in the future and use static analysis more efficiently. This section discusses the specifics of PVS-Studio customization that will make further work easier.
Unattended deployment of PVS-Studio
You need administrator privileges to install PVS-Studio. Unattended installation is performed by running the following command from the command line (in one line):
PVS-Studio_setup.exe /verysilent /suppressmsgboxes
/norestart /nocloseapplicationsExecuting this command will initiate installation of all available PVS-Studio components. Please note that PVS-Studio may require a restart to complete installation if, for example, the files being updated are locked. If you run the installer without the 'NORESTART' flag, it may restart the computer without any prior notification or dialogue.
The package includes utility 'PVS-Studio-Updater.exe', which checks for analyzer updates. If there are updates available, it will download and install them on local machine. To run the utility in 'silent' mode, use the same options as with installation:
PVS-Studio-Updater.exe /verysilent /suppressmsgboxesSettings file is generated automatically when running the Visual Studio with installed PVS-Studio plugin or running C and C++ Compiler Monitoring UI (Standalone.exe), and it can then be edited or copied to other machines. The information about the license is also stored in the settings file. The default directory of this file is:
%AppData%\PVS-Studio\Settings.xmlTo learn more about unattended deployment of PVS-Studio, see the article "Unattended deployment of PVS-Studio".
Preliminary configuration of the analyzer
Before running the analyzer, you need to configure it to optimize handling of the warning list and (if possible) speed up the analysis process.
Note. The options discussed below can be changed by manually editing the settings file or through the settings page's interface of the Visual Studio plug-in or Compiler Monitoring UI.
It may often be helpful to exclude certain files or even entire directories from analysis - this will allow you to keep the code of third party libraries unchecked, thus reducing the overall analysis time and ensuring that you will get only warnings relevant to your project. The analyzer is already configured by default to ignore some files and paths such as the boost library. To learn more about excluding files from analysis, see the article "Settings: Don't Check Files".
At the phase of analyzer integration, you also want to turn off those PVS-Studio diagnostics that are irrelevant to the current project. Diagnostics can be disabled both individually and in groups. If you know which diagnostics are irrelevant, turn them off right away to speed up the check. Otherwise, you can turn them off later. To learn more about disabling diagnostic rules, see the article "Settings: Detectable Errors".
Suppression of the warnings related to the old code
When integrating static analysis into an existing project with a large codebase, the first check may reveal multiple defects in its source code. The developer team may lack the resources required for fixing all such warnings, and then you need to hide all the warnings triggered by the existing code so that only warnings triggered by newly written/modified code are displayed.
To do this, use the mass warning suppression mechanism, described in detail in the article "Mass suppression of analyzer messages".
Note 1. If you need to hide only single warnings, use the false positive suppression mechanism described in the article "Suppression of False Alarms".
Note 2. Using SonarQube, you can specify how warnings issued within a certain period are displayed. You can use this feature to have the analyzer display only those warnings that were triggered after the integration (that is, turn off the warnings triggered by old code).
Integrating PVS-Studio into the CI process
Integrating PVS-Studio into the CI process is relatively easy. In addition, it provides means for convenient handling of analysis results.
Integration of PVS-Studio with the SonarQube platform is available only under the PVS-Studio Enterprise license. You can request the trial Enterprise license here.
The principles of analysis of the projects, based on different build systems will be described below, as well as the utilities for working with the results of analysis.
Analyzing the source code of MSBuild / Visual Studio projects
This section discusses the most effective way of analyzing MSBuild / Visual Studio solutions and projects, i.e. Visual Studio solutions (.sln) and Visual C++ (.vcxproj) and Visual C# (.csproj) projects.
General information
Project types listed above can be analyzed from the command line by running the 'PVS-Studio_Cmd.exe' module, located in PVS-Studio's installation directory. The default location is 'C:\Program Files (x86)\PVS-Studio\'.
You can modify analysis parameters by passing various arguments to 'PVS-Studio_Cmd.exe'. To view the list of all available arguments, enter the following command:
PVS-Studio_Cmd.exe --helpThe analyzer has one obligatory argument, '‑‑target', which is used to specify the target object for analysis (a .sln, .vcxproj, or .csproj file). The other arguments are optional; they are discussed in detail in the article "Analyzing Visual C++ (.vcxproj) and Visual C# (.csproj) projects from the command line".
The following example demonstrates how to start analysis of a .sln file (in one line):
PVS-Studio_Cmd.exe --target "targetsolution.sln" --platform "Any CPU"
--output "results.plog" --configuration "Release"Executing this command will initiate analysis of .sln file 'targetsolution.sln' for platform 'Any CPU' in 'Release' configuration. The output file ('results.plog') will be created in the directory of the solution under analysis. The check will be performed with the standard analyzer settings since no specific settings have been specified.
The 'PVS-Studio_Cmd.exe' module employs a number of non-zero exit codes, which it uses to report the final analysis status. An exit code is a bit mask representing all states that occurred while the utility was running. In other words, a non-zero exit code does not necessarily indicate an error in the utility's operation. For a detailed description of exit codes, see the above-mentioned article "Analyzing Visual C++ (.vcxproj) and Visual C# (.csproj) projects from the command line".
Note: If you need to execute commands from the CustomBuild task (for example, to generate code files) before running the analysis, you can specify a special directive for PVS-Studio. In this case, the analyzer first executes all the necessary commands and then runs the analysis. You can find more details in the "Executing commands from the CustomBuild task before running the analysis" section.
Displaying analysis results only for newly written / modified code
If you use the analyzer regularly, you may want it to issue warnings triggered only by newly written/modified code. With night builds on the build server, this would allow you to view only those warnings that were triggered by mistakes made on the previous day.
To turn on this mode, run the 'PVS-Studio_Cmd.exe' module with the command line argument '‑‑suppressAll'. When this flag is present, the utility will add all the messages to the database of suppressed warnings (.suppress files of the corresponding projects) after saving the analysis results. This will prevent those messages from appearing at the next check. In case you need to view the old warnings again, the complete analysis log can be found in the same directory where the .plog file with new messages is located.
To learn more about the mass warning suppression mechanism, see the article "Mass suppression of analyzer messages".
Note. When using the SonarQube platform, you can keep track of new messages without applying the suppression mechanisms. To do this, configure it to display changes only for the past day.
Incremental analysis in command line module 'PVS-Studio_Cmd.exe'
PVS-Studio's incremental analysis mode allows you to check only those files that have been modified/affected since the last build. This mode is available in both the Visual Studio plug-in and the command line module. With incremental analysis, only warnings triggered by modified code will be displayed, thus reducing the analysis time by excluding unaffected parts of the solution from analysis.
This mode is useful when your continuous integration system is configured to run an automatic incremental build every time changes in the version control system are detected; that is, when the project is built and analyzed on the build server many times during the day.
The use of incremental analysis in the 'PVS-Studio_Cmd.exe' module is controlled by the flag '‑‑incremental'. The following modes are available here:
- Scan - analyze dependencies to determine which files must be included into incremental analysis. The analysis process itself is not initiated.
- Analyze - run incremental analysis. This step must be performed after the Scan step and can be performed both before and after building the solution/project. Only those files that have changed since the last build will be analyzed.
- ScanAndAnalyze - analyze dependencies to determine which files must be included into incremental analysis, and immediately start incremental analysis.
To learn more about PVS-Studio's incremental analysis, see the article "PVS-Studio's incremental analysis mode".
Note. There are a few details to keep in mind about this mode. Specifically, you could encounter a file locking issue when PVS-Studio uses Visual C++'s preprocessor ('cl.exe'). It has to do with the fact that the 'cl.exe' compiler may lock a file while preprocessing it, causing writing of this file to fail. When the Clang preprocessor is used, this issue is much rarer. Please keep this in mind when configuring the server to run incremental analysis rather than full-fledged analysis at night.
Analysis of CMake projects
If you need to analyze CMake projects, it is recommended that you convert them into Visual Studio solutions and continue to work with these. This will allow you to use the 'PVS-Studio_Cmd.exe' module's capabilities in full.
Analyzing projects that use uncommon build systems
If your project uses a build system other than MSBuild, you will not be able to analyze it with the command line module 'PVS-Studio_Cmd.exe'. The package, however, includes utilities to make it possible to analyze such projects too.
Compiler monitoring system
The PVS-Studio Compiler Monitoring system, or CLMonitoring, is designed to provide 'seamless' integration of PVS-Studio into any build system under Windows that employs one of the preprocessors supported by the command line module 'PVS-Studio.exe' for compilation.
The monitoring server (CLMonitor.exe) monitors the launches of processes corresponding to the target compiler and collects information about these processes' environment. The server monitors only those processes that run under the same user profile where it has been launched.
Supported compilers:
- Microsoft Visual C++ compilers (cl.exe);
- C/C++ compilers of the GNU Compiler Collection (gcc.exe, g++.exe);
- Clang compiler (clang.exe) and Clang-based compilers.
Before integrating the monitoring server into the build process, start the 'CLMonitor.exe' module with the argument 'monitor':
CLMonitor.exe monitorThis command will tell the monitoring server to call itself in monitoring mode and terminate, while the build system will be able to continue with its tasks. Meanwhile, the second CLMonitor process (called by the first) will be still running and monitoring the build process.
Once the build is complete, you will need to launch the 'CLMonitor.exe' module in client mode to generate preprocessed files and start static analysis proper:
CLMonitor.exe analyze -l "c:\ptest.plog" -u "c:\ptest.suppress" -sThis command contains the following arguments:
- analyze - run the 'CLMonitor.exe' module for analysis;
- -l - full path to the file the analysis results will be saved to;
- -u - path to suppress file;
- -s - append all new messages of the current check to the suppress file.
To learn more about the use of the compiler monitoring system, see the article "Compiler monitoring system in PVS-Studio".
Note. The compiler monitoring system has a number of drawbacks stemming from the natural limitations of this approach, namely the impossibility to guarantee a 100% intercept of all the compiler launches during the build process (for example, when the system is heavily loaded). Another thing to remember is that when several build processes are running in parallel, the system may intercept compiler launches related to another build.
Direct integration into build automation systems
Note. In direct integration mode, the analyzer can check only C/C++ code.
Direct integration may be necessary when you cannot use the command line module 'PVS-Studio_Cmd.exe' (since the project is built with a system other than MSBuild) and the compiler monitoring system (see the note in the corresponding section).
In that case, you need to integrate a direct call of the analyzer ('PVS-Studio.exe') into the build process and provide it with all the arguments required for preprocessing. That is, the analyzer must be called for the same files that the compiler is called for.
To learn more about direct integration into build automation systems, see the article "Direct integration of the analyzer into build automation systems (C/C++)".
Handling analysis results
Once the check has finished, the analyzer outputs a .plog file in the XML format. This file is not intended to be handled manually (read by the programmer). The package, however, includes special utilities whose purpose is to provide a convenient way to handle the .plog file.
Preliminary filtering of analysis results
The analysis results can be filtered even before a start of the analysis by using the No Noise setting. When working on a large code base, the analyzer inevitably generates a large number of warning messages. Besides, it is often impossible to fix all the warnings straight out. Therefore, to concentrate on fixing the most important warnings first, the analysis can be made less "noisy" by using this option. It allows completely disabling the generation of Low Certainty (level 3) warnings. After restarting the analysis, the messages from this level will disappear from the analyzer's output.
When circumstances will allow it, and all of the more important messages are fixed, the 'No Noise' mode can be switched off - all of the messages that disappeared before will be available again.
To enable this setting use the specific analyzer settings page.
PlogConverter
'PlogConverter.exe' is used to convert the analyzer report into one of the formats that could be read by the programmer:
- text file with analysis results. It may be convenient when you want the analysis results (for example, new diagnostic messages) output into the log of the build system or CI server;
- HTML report with a short description of the analysis results. It suits best for the e-mailing of the notifications;
- HTML report with sorting of the analysis results according to the different parameters and navigation along the source code;
- CSV table with analysis results;
- Tasks file to be viewed in QtCreator;
- text file with a summary table showing the number of messages across severity levels and groups of diagnostics.
This example demonstrates how to use 'PlogConverter.exe' utility (in one line):
PlogConverter.exe test1.plog -o "C:\Results" -r "C:\Test"
-a GA:1 -t HtmlThis command converts the 'test1.plog' file into an .html file that will include the first-level diagnostic messages of the GA (general-analysis) group. The resulting report will be written to 'C:\Results', while the original .plog file will stay unchanged.
To see full help on 'PlogConverter' utility's parameters, run the following command:
PlogConverter.exe --helpNote. 'PlogConverter' utility comes with the source files (in C#), which can be found in the archive 'PlogConverter_src.zip'. You can adopt the algorithm of parsing a .plog file's structure to create your own output format.
To learn more about 'PlogConverter', see the article "Managing the analysis results (.plog file)".
SonarQube
Analysis results can be imported into the SonarQube platform, which performs continuous code quality inspection. To do this, use the 'sonar-pvs-studio-plugin' included into the package. This plugin allows you to add warnings issued by PVS-Studio to the SonarQube server's message database. This, in its turn, enables you to view bug occurrence/fixing statistics, navigate the warnings, view the documentation on diagnostic rules, and so forth.
Once added to SonarQube, all PVS-Studio messages are assigned type Bug. SonarQube's interface keeps the same layout of message distribution across diagnostic groups as in the analyzer.
To learn more about integrating analysis results into SonarQube, see the article "Integration of PVS-Studio analysis results into SonarQube".
Sending analysis results via email with help BlameNotifier
Sending analysis report copies to developers is an effective way to inform them about the results. It can be done with the help of special utilities such as SendEmail. SonarQube provides this option as well.
Another way to inform the developers is to use 'BlameNotifier' utility, which also comes with the PVS-Studio package. This application allows you to form reports in a flexible way. For example, you can configure it so that it will send individual reports to the developers who submitted faulty code; team leaders, development managers, etc. will get a complete log with the data about all the errors found and developers responsible for them.
For basic information about the utility, run the following command:
BlameNotifier.exe --helpTo learn more about 'BlameNotifier', see the article "Managing the analysis results (.plog file)", section "Notifying the developer team".
Conclusion
If you have any questions, please use the feedback form.
Incremental analysis mode in PVS-Studio
- Watch, don't read (YouTube)
- Windows: C, C++, C#
- Linux/macOS: C, C++
- Linux/macOS: C#
- Windows/Linux/macOS: Java
- References
Server incremental analysis mode from command line is available only under PVS-Studio Enterprise license. You can request the trial Enterprise license here. IDE incremental analysis on developer's machine is available under all PVS-Studio license types.
It is possible to run analysis on the entire code base independently – say, once a day during night builds. However, to get the most out of the analyzer, you need to be able to find and fix bugs as early as possible. In other words, the optimal way to use a static analyzer is to run it on freshly written code right away. Of course, having to manually run a check every time you modify a few files and wait for it to finish makes this scenario complicated and incompatible with the idea of intense development and debugging of new code. It's simply inconvenient, after all. However, PVS-Studio has a solution to this problem.
Note that it is advisable to examine all the diagnostic messages generated after the very first full analysis of the code base, and fix any bugs found. As for the remaining warnings, you can either mark them as false positives, turn off irrelevant diagnostics or diagnostic sets, or suppress whatever messages you haven't addressed to get back to them some other time. This approach allows you to keep the warning list uncluttered by meaningless and irrelevant warnings.
Watch, don't read (YouTube)
Windows: C, C++, C#
Microsoft Visual Studio
To enable the post-build incremental analysis mode, click Extensions > PVS-Studio > Analysis after Build (Modified Files Only):

This option is enabled by default.
Once this mode is activated, PVS-Studio will automatically analyze all recently modified files in the background immediately after the build is finished. When the analysis starts, an animated PVS-Studio icon will appear in the Windows taskbar notification area:

The drop-down menu from the notification area includes commands that allow you to pause or abort the current check.
To keep track of modified files, the analyzer relies on the build system. A complete rebuild will cause it to check all the files comprising the project, so you need to use incremental build to be able to check only modified files. If any bugs are detected during incremental analysis, their number will be displayed on the tab of the PVS-Studio window in Visual Studio, and Windows notification will pop-up:

Clicking on the icon in the notification area (or on the notification itself) will take you to the PVS-Studio Output window.
When working within Visual Studio, you can set an incremental analysis timeout or the maximum level of analyzer warnings. These settings can be tweaked in PVS-Studio > Options > Specific Analyzer Settings > IncrementalAnalysisTimeout and PVS-Studio > Options > Special Analyzer Settings > IncrementalResultsDisplayDepth.
Command-line analyzer for MSBuild projects (PVS-Studio_Cmd.exe)
The incremental analysis mode can also be used with Visual Studio solutions when using the command-line utility (PVS-Studio_Cmd.exe). This practice is good for speeding up analysis on the CI server and employs incremental build approaches similar to those used in MSBuild.
To set up incremental analysis on the server, use the following commands:
PVS-Studio_Cmd.exe ... --incremental Scan ...
MSBuild.exe ... -t:Build ...
PVS-Studio_Cmd.exe ... --incremental Analyze ...Here's a complete description of all the modes of incremental analysis:
- Scan – scan all dependencies to determine which files need to be analyzed. No actual check will be run. This step must be performed before building a solution or project. The scan results will be saved to temporary.pvs-studio directories, located in the same directories where the project files are stored. Only changes made since the last build will be taken into account; all earlier change history stored in the .pvs-studio directory will be erased.
- AppendScan – scan all dependencies to determine which files need to be analyzed. No actual check will be run. This step must be performed before building a solution or project. The scan results will be saved to temporary.pvs-studio directories located in the same directories where the project files are stored. All changes made since the last build and all earlier changes will be taken into account.
- Analyze – run incremental analysis. This step must follow the Scan or AppendScan step and can be performed either before or after building a solution or project. Only the files on the list generated at the Scan or AppendScan step will be analyzed. If the 'Remove Intermediate Files' option of PVS-Studio's settings is set to True, the temporary .pvs-studio directories created at the scan step will be removed at the end of the check.
- ScanAndAnalyze – scan all dependencies to determine which files need to be analyzed and run incremental analysis on the modified source files immediately. This step must be performed before building a solution or project. Only changes made since the last build will be taken into account.
Compiler Monitoring UI
If you need to use incremental analysis along with the compiler monitoring system, you simply need to "trace" the incremental build, i.e. the compilation of files modified since the previous build. This way, you will be able to analyze only modified or new code.
This scenario is natural to the compiler monitoring system, as it is based on the tracing of compiler invocations during the build process, and, thus, collects all the information needed to analyze the source files the compilation of which has been traced. Therefore, which type of analysis will be performed depends on which type of build is being traced: full or incremental.
To learn more about the compiler monitoring system, see the article "Compiler monitoring system in PVS-Studio".
Linux/macOS: C, C++
CMake projects
To check a CMake project, you can use a JSON Compilation Database file. To have the required compile_commands.json file generated, add the following flag to the CMake call:
cmake -DCMAKE_EXPORT_COMPILE_COMMANDS=On <src-tree-root>To enable incremental analysis for such projects, add the ‑‑incremental flag to the analyze command:
pvs-studio-analyzer analyze ... --incremental ...File dependencies and modification history will be stored in the .PVS-Studio directory as the analyzer's work does not depend on the build system in this mode. This directory must be preserved for the analyzer to be able to work in this analysis mode.
If your CMake generator doesn't allow generating a compile_commands.json file, or if this file can't be generated conveniently, you may directly integrate PVS-Studio into CMake: using the direct integration module will allow you to run incremental analysis along with incremental build.
Makefile projects
You can specify an analyzer invocation command after the compiler command in the scripts of the Make build system or other similar systems:
$(CXX) $(CFLAGS) $< ...
pvs-studio --source-file $< ...This will let incremental analysis and incremental build run together, with the information about modified files retrieved from the build system.
A collection of examples demonstrating the integration of PVS-Studio into Makefile can be found in the GitHub repository: pvs-studio-makefile-examples.
Other projects (Linux only)
You can check any project without integrating the analyzer into a build system by running the following commands:
pvs-studio-analyzer trace – make
pvs-studio-analyzer analyze ...Any build command with all the necessary parameters can be substituted instead of make.
In this mode, the analyzer traces and logs child processes of the build system and spots compilation processes among them. If you build the project in incremental build mode, only modified files will be analyzed as well.
Linux/macOS: C#
The incremental analysis mode of C# projects under Linux and macOS is the same as the one described above in the section "Command line analyzer for MSBuild projects (PVS-Studio_Cmd.exe)" except for the following:
- 'pvs-studio-dotnet' is used instead of 'PVS-Studio_Cmd.exe';
- 'dotnet' is used for the build, not 'MSBuild.exe'.
Windows/Linux/macOS: Java
IntelliJ IDEA
To turn on the post-build incremental analysis mode in the plugin for IntelliJ IDEA, click Analyze > PVS-Studio > Settings > PVS-Studio > Misc > Run incremental analysis on every build:

Once this mode is activated, PVS-Studio will automatically analyze all recently modified files in the background immediately after the build is finished. All issued warnings will be collected in the PVS-Studio window:

Maven plugin
To enable incremental analysis in the maven plugin, set the incremental flag:
<plugin>
<groupId>com.pvsstudio</groupId>
<artifactId>pvsstudio-maven-plugin</artifactId>
....
<configuration>
<analyzer>
....
<incremental>true</incremental>
....
</analyzer>
</configuration>
</plugin>Once this mode is activated, the pvsstudio:pvsAnalyze command will start the analysis of only those files that have been modified since the last check.
Gradle plugin
To enable incremental analysis in the gradle plugin, set the incremental flag:
apply plugin: com.pvsstudio.PvsStudioGradlePlugin
pvsstudio {
....
incremental = true
....
}Once this mode is activated, the pvsAnalyze command will start the analysis of only those files that have been modified since the last check.
References
- Analyzing Visual Studio projects from the command line
- How to run PVS-Studio on Linux and macOS
- Direct use of Java analyzer from command line
- PVS-Studio and continuous integration
Analysis in commit and branch merge mode (pull/merge requests)
- General principles of pull/merge request analysis
- Analysis integration into VCS
- File list checking mode
- Analyzing C# files
- Analyzing C and C++ files
- Analyzing Java files
Pull/merge request check is available only in the Enterprise license. You can request a trial Enterprise license here.
The commit and the branch pull/merge analysis mode allow you to analyze only those files that have changed relative to the current state of the branch (the one the commit or pull/merge request is made to). This reduces the analysis time and simplifies the review of its results: the analyzer's report contains warnings issued for errors in the modified files.
This document describes the general principles of the pull/merge request analysis. You can find examples for specific CIs in the following documentation sections:
General principles of pull/merge request analysis
To analyze files that were changed during the branch merge, the files must be separated from all other files in the project. To do this, after the merge is done, you need to get the difference between the HEAD branch from where the pull/merge request is made and the branch where the changes will be made.
Let's look at the commit tree:

In this case, a 'quickFix' branch was created. After work is completed in the branch, a pull/merge request opens. Use the following command to get the difference between the current state of the 'master' branch and the last commit in the 'quickFix' branch (you have to be on the 'quickFix' branch at the time it is executed):
git diff --name-only HEAD master > .pvs-pr.listThis way you get a list of modified files relative to the latest commits in the 'master' and 'quickFix' branches. The names of the modified files will be saved in '.pvs-pr.list'.
Note. In the example of getting the files for analysis, we use the 'git' version control system. However, you can use any version control system that allows you to get a list of modified files.
To check the sent pull/merge request, you need to analyze the received file list.
Getting list of modified files
In this section, you can find examples of commands for getting a list of modified files.
For Git:
To get a list of modified files before a commit, execute the command:
git diff --cached --name-only > .pvs-pr.listTo get a list of modified files between two commits, execute the command:
git diff --name-only CommitA CommitB > .pvs-pr.listFor SVN:
On Windows, you can execute the following command in PowerShell:
Write-Host (svn status | Select-String -Pattern '^[AM]\W*(.*)'
| %{$_.Matches.Groups[1].value}) -Separator "`b`n" > .pvs-pr.litsOn Linux:
svn status -q | grep -oP "^[M|A]\W*\K(.*)" > .pvs-pr.listFor Mercurial:
hg log --template "{files % '{file}\n'}\n" > .pvs-pr.listFor Perforce:
p4 diff -f -sa > .pvs-pr.listAnalysis integration into VCS
Most version control systems (VCSs) support tracking events in a repository using special hooks. Usually, hooks are regular script files that the VCS runs. They can be used both on the client side (local developer machine) and on the VCS server (if you have your own VCS server). Using hooks on the VCS server enables you to configure a global policy for all developers in the company.
Each version control system has its own scenarios for using hooks. To learn more, please consult the documentation for your VCS.
You can integrate PVS-Studio directly into the VCS server. Follow the plan.
- Define the event that triggers the analysis. The hook should be executed before the VCS commits the new changes. For example, it can be the commit or push operations.
- Decide where you would like to run the analysis. You can run it on a VCS server or on a separate machine. Remember: for successful analysis, your project should be built on the machine on which the analysis is performed.
- Write the hook that will:
- Get a list of changes in a commit or a push. You will need not only a list of modified files but also a patch file that contains the changes (for example, it is required for Git).
- If you would like to run the analysis on a VCS server, you will need to have a local copy of your repository there. Apply a patch file to this copy and run the analysis in the mode of checking the list of files.
- If you plan to run the analysis on a separate machine, send the changes to the remote machine using a special command (for example, via ssh), apply a patch file there, and run the analysis in the mode of checking the list of files.
- Next, process the analysis results. To reject the operation if there are analyzer messages, exit the hook with the non-zero code. You can do it using the PlogConverter utility, which converts analyzer reports. The -w flag indicates that the utility should be closed with the exit code of 2 if there are any warnings in the filtered report.
Keep in mind that executing the hooks is usually a blocking operation. It means that until the hook is executed, the commit or push operations will not close. Hence, using hooks can slow down the process of pushing changes to the repository.
Note: this scenario is quite difficult to implement, and we strongly recommend you use the VCS hooks only to create CI system triggers.
File list checking mode
To check the list of files, pass a text file that contains absolute or relative paths to the files for analysis to the analyzer (relative paths will be expanded according to the working directory). Write each of the paths on a new line. Text that is not the path to the source-code file is ignored (this may be useful for commenting).
Example of the contents of a file with paths:
D:\MyProj\Tests.cs
D:\MyProj\Common.cs
D:\MyProj\Form.csBelow are the options to run the analysis for different languages and operating systems.
Analyzing C# files
To check C# files, use the 'PVS-Studio_Cmd' utility for Windows and 'pvs-studio-dotnet' for Linux and macOS.
The path to the file that contains the list of files for analysis is passed using the '-f' argument (detailed information about the arguments see in the documentation). The format of this file is described in the "File list checking mode" section.
You can check the return code to see if there are any analyzer warnings. The return codes are described in the documentation.
Windows
Example of a command to run the analysis:
PVS-Studio_Cmd.exe -t MyProject.sln ^
-f .pvs-pr.list ^
-o Analysis_Report.jsonFiles from '.pvs-pr.list' contained in the 'MyProject.sln' solution will be analyzed. The analysis results will be saved to the 'Analysis_Report.json' file.
Linux and macOS
Example of a command to run the analysis:
pvs-studio-dotnet -t MyProject.sln \
-f .pvs-pr.list \
-o Analysis_Report.jsonFiles from '.pvs-pr.list' contained in the 'MyProject.sln' solution will be analyzed. The analysis results will be saved to the 'Analysis_Report.json' file.
Analyzing C and C++ files
To check C and C++ files, use the following utilities:
- pvs-studio-analyzer / CompilerCommandsAnalyzer (Windows, Linux and macOS);
- CLMonitor (Windows);
- PVS-Studio_Cmd (Windows).
The check method for each utility is described below.
The first launch of the analysis generates a dependency file of all the project's source files from the header files. The analyzer will update it automatically on subsequent runs. It is possible to create/update the dependency file without running the analysis. This process will be described for each of the utilities in the corresponding section.
pvs-studio-analyzer / CompilerCommandsAnalyzer.exe (Windows, Linux and macOS)
Note. The way to analyze project files that use the MSBuild system is described in the "PVS-Studio_Cmd (Windows, Visual Studio\MSBuild)" section.
Depending on the operating system on which the analysis is performed, the utility will have different names:
- Windows: 'CompilerCommandsAnalyzer.exe';
- Linux and macOS: 'pvs-studio-analyzer'.
The examples in this documentation use the 'pvs-studio-analyzer' name. The scenario to analyze files with 'CompilerCommandsAnalyzer.exe' is similar to that described here.
To use 'pvs-studio-analyzer', generate either the 'compile_commands.json' file, or a file with the results of the compilation trace (relevant only for Linux). The analyzer needs these files to have information about the compilation of specific files.
Generating 'compile_commands.json'
See the documentation for ways to generate the 'compile_commands.json' file.
Generating a trace file (Linux only)
See the documentation for ways to generate the trace file. By default, the result of tracing is written to the 'strace_out' file.
There are two options for analysis using a trace file. You can either perform a full tracing of the entire project's build at each start, or you can cache the result of the tracing and use it.
The downside of the first method is that a full tracing contradicts the idea of a quick check of commits or pull/merge requests.
The second way is bad because the analysis result may be incomplete if the dependency structure of source files changes after the tracing (for example, a new #include will be added to one of the source files).
For this reason, we do not recommend the use of the file list checking with the trace log for commit or pull/merge request checking. In case you are able to do an incremental build during the commit checking, consider using the incremental analysis mode.
Example of commands to analyze files and to update dependencies
Let's look at an example of using 'pvs-studio-analyzer'. The path to the file that contains the list of files for analysis is passed using the '-S' argument (detailed information about the utility's arguments see in the documentation). The format of this file is described in the "File list checking mode" section.
Note. If the compilation information was obtained using the compilation trace mode, the trace file is passed using the '-f' flag (by default, its name is 'strace_out').
Example of a command to analyze files:
pvs-studio-analyzer analyze -S .pvs-pr.list \
-f compile_commands.json \
-o Analysis_Report.jsonThis command generates a report with the result of checking the files contained in '.pvs-pr.list'. The analysis results will be saved to the 'Analysis_Report.json' file.
To generate or update a dependency file without starting the analysis, use the '‑‑regenerate-depend-info' flag with the 'skip-analysis' key. The command to update will look as follows:
pvs-studio-analyzer analyze -S .pvs-pr.list \
-f compile_commands.json \
–-regenerate-depend-info skip-analysisUse the '‑‑regenerate-depend-info' flag with the 'run-analysis' key to force an update of the dependency cache with the subsequent start of the analysis.
By default, the dependency cache file is generated in the '.PVS-Studio' folder, which is created in the working directory. The cache is contained in the 'depend_info.json' file.
Getting information about the presence/absence of warnings in the analyzer report
To get information about the presence of analyzer warnings, use the utilities:
- Windows — 'PlogConverter.exe';
- Linux and macOS — 'plog-converter'.
Here's documentation on these utilities.
Example of using 'PlogConverter.exe':
PlogConverter.exe Analysis_Report.json ^
-t html ^
-n PVS-Studio ^
--indicateWarningsExample of using 'plog-converter':
plog-converter Analysis_Report.json \
-t html \
-n PVS-Studio \
--indicate-warningsThe path to the file with the analysis results is passed as the first command line argument. Use the '-t' argument to specify the format in which the report should be saved. The '-n' argument specifies the file name of the converted report. '‑‑indicateWarnings' for 'PlogConverter.exe ' and '‑‑indicate-warnings' for 'plog-converter' flags allow you to set the return code 2 if there are analyzer warnings in the report.
CLMonitor (Windows)
The path to the file that contains the list of files for analysis is passed using the '-f' argument (detailed information about the arguments see in the documentation). The format of this file is described in the "File list checking mode" section.
Example of a command to run the analysis:
CLMonitor.exe analyze -l "Analysis_Report.json" ^
-f ".pvs-pr.list"This command will generate a report with the result of checking the files contained in '.pvs-pr.list'. The analysis results will be saved to the 'Analysis_Report.json' file.
To get information about the presence of analyzer warnings, you can use the 'PlogConverter' utility: If there are no analyzer warnings, the return code is 0. If there are warnings, the return code is 2. Here's documentation on these utilities.
Example of using 'PlogConverter':
PlogConverter.exe Analysis_Report.json \
-t html \
-n PVS-Studio \
--indicate-warningsThe path to the file with the analysis results is passed as the first command line argument. Use the '-t' argument to specify the format in which the report should be saved. The '-n' argument specifies the file name of the converted report. '‑‑indicateWarnings' for 'PlogConverter.exe ' and '‑‑indicate-warnings' for 'plog-converter' flags allow you to set the return code 2 if there are analyzer warnings in the report.
PVS-Studio_Cmd (Windows, Visual Studio\MSBuild)
If the needed files with code are included in a Visual Studio project that uses the MSBuild system, the analysis is performed with the PVS-Studio_Cmd utility.
The path to the file that contains the list of files for analysis is passed using the '-f' argument (detailed information about the arguments see in the documentation). The format of this file is described in the section "File list checking mode".
You can check the return code to see if there are any analyzer warnings. The return codes are described in the documentation.
Example of a command to run the analysis:
PVS-Studio_Cmd.exe -t MyProject.sln ^
-f .pvs-pr.list ^
-o Analysis_Report.jsonFiles from the '.pvs-pr.list' contained in the 'MyProject.sln' solution will be analyzed. The analysis results will be saved to the 'Analysis_Report.json' file.
To update dependencies without running the analysis, use the '-W':
PVS-Studio_Cmd.exe -t MyProject.sln ^
-f .pvs-pr.list ^
-WUse the '-G' flag to force an update of the dependency cache with the subsequent start of the analysis.
By default, the dependency cache file is generated at the project level and saved to the '.pvs-studio' folder. The file containing the cache has a name of the 'projectName.vcxproj.deps.json' form (the part of the file name, in our case it is 'projectName.vcxproj', corresponds to the project name). Accordingly, if you analyze the files belonging to the same solution but to different projects, the '.pvs-studio' folder with the dependency file will be created in the directory of each project.
You can change the directory where the cache is saved. To do this, use the '-D' parameter. The path to the directory where you want to save the cache is passed as the parameter's value.
To set relative paths in dependency caches, use the '-R' flag. You need to pass the path as an argument to the flag. According to this path, the paths in the dependency cache files will be expanded.
Analyzing Java files
To check Java files, use the 'pvs-studio.jar ' utility. You can find the detailed information about the utility and its arguments in the documentation.
Windows, Linux and macOS
The path to the file that contains the list of files to be analyzed is passed using the '‑‑analyze-only-list' flag. The format of this file is described in the "File list checking mode" section.
To analyze the list of files, you also need to pass the path to the project containing these files. To do this, use the '-s' argument. The '-e' argument defines the classpath. If you need to use multiple classpath entities, separate them by a space.
Example of a command to run the analysis:
java -jar pvs-studio.jar -s projectDir ^
--analyze-only-list .pvs-pr.list ^
-e Lib1.jar Lib2.jar ^
-j4 ^
-o report.json ^
-O json ^
--user-name userName ^
--license-key keyAs a result, the files recorded in the '.pvs-pr.list' will be analyzed. The analysis results will be saved to the 'report.json' file.
To get information about the presence of warnings, use the '‑‑fail-on-warnings' flag. When it is used, the analyzer returns code 53 if there are warnings in the analysis results.
Integration of PVS-Studio analysis results into DefectDojo
- Converting a report to a DefectDojo-compatible format
- Uploading the PVS-Studio report to DefectDojo
- Viewing the PVS-Studio report in DefectDojo
- Handling false positives
- Quality Gate in DefectDojo
DefectDojo is a DevSecOps tool for tracking errors and vulnerabilities. It provides features for working with reports, including the ability to merge results, memorize false positives, and delete duplicate warnings. DefectDojo also can save metrics and track their changes in charts. With this tool, you can conveniently handle PVS-Studio analysis results and eliminate errors in code.
DefectDojo has several deployment options. Here's how you can install and configure it. This page contains general documentation.
Converting a report to a DefectDojo-compatible format
To work with the PVS-Studio report in DefectDojo, convert it to a special format.
To convert your report, use the PlogConverter.exe command line tool for Windows and plog-converter for Linux/macOS. With these tools, you can not only convert the PVS-Studio report to different formats but also additionally handle it. For instance, you can filter messages.
Here's an example of a command to convert a PVS-Studio report for DefectDojo using PlogConverter.exe (Windows):
PlogConverter.exe path\to\report.plog ^
-t DefectDojo ^
-o output\dir ^
-n converted_report_nameHere's an example of a command to convert a PVS-Studio report for DefectDojo using plog-converter (Linux/macOS):
plog-converter path/to/report.json \
-t defectdojo \
-o path/to/report.defectdojo.json \
-n converted_report_nameUploading the PVS-Studio report to DefectDojo
After you have converted the report, upload it to DefectDojo. To do that, add a new engagement in DefectDojo. The analysis results will be stored there. To add engagement, select 'Add New Interactive Engagement'.

Then, upload the report to the created engagement. You can use the DefectDojo API or manually upload the report.
To manually upload the report, open engagement, click the menu button in the 'Tests' table, and select 'Import Scan Result'.

In the opened window specify 'Generic Findings Imports' in the 'Scan type' field. In the 'Choose report file' field specify the report you want to upload.
Use the DefectDojo API to automate report uploading. Here's an example of a command to upload the report:
curl -X POST
-H Authorization:"Token 44ac826dc4f3b6add1161dab11b49402618efaba"
-F scan_type="Generic Findings Import"
-F file=@"path/to/report.json"
-F engagement=1
-H Content-Type:multipart/form-data
-H accept:application/json defctdojohost/api/v2/import-scan/To get an authorization token, select 'API v2 Key' in the DefectDojo user menu.

The engagement identifier to which the report should be uploaded is specified in the 'engagement' parameter. You can find the identifier in the URL of the selected engagement.

Specify the path to the report in the 'file' parameter.
Viewing the PVS-Studio report in DefectDojo
After uploading the report, you can view it in DefectDojo. Select the engagement to which the report was uploaded and open the necessary analysis result. The last uploaded report is the first in the list.

A page with a list of analyzer warnings opens.

DefectDojo supports filtering and sorting warnings by various parameters. For example, you can leave only some diagnostic rules or warnings with a certain CWE identifier enabled.

Click 'Column visibility' to open a menu with a list for hiding/displaying columns.

The 'Name' field contains the diagnostic rule number. Click it to see the detailed information about a warning.

The opened page contains the following information:
- A warning's level of certainty;
- The warning's status;
- The CWE identifier and the link to the official Common Weakness Enumeration website with a description of an issue;
- The path to the file and the line of code to which the analyzer issued a warning;
- A brief description of the warning;
- A link to a detailed description of the warning on the PVS-Studio website.
Handling false positives
DefectDojo allows you to mark warnings as False Positives.
An additional DefectDojo configuration is required to save the markup of false positives when loading a new report.
Open the DefectDojo settings ('Configuration -> System Settings' or 'http://defectdojohost/system_settings') and enable the 'False positive history' option.
Then, add the following entry to the 'local_settings.py' file:
HASHCODE_FIELDS_PER_SCANNER=
{"PVS-Studio Scan (Generic Findings Import)":["unique_id_from_tool"]}The file should be located in the 'dojo/settings/' directory. If you are running DefectDojo via 'docker-compose.yml', put the ('local_settings.py') file in the 'docker/extra_settings/' folder. In this case, 'local_settings.py' copies to the 'dojo/settings/' folder when running the docker container.
These settings ensure that warnings marked as False Positive do not lose this status when a new report is loaded. The status does not change, even if the line of code that triggered the analyzer has shifted.

You can also enable the 'Deduplicate findings' setting. In this case, when the report contains an already loaded warning, it will have the additional 'Duplicate' status.
To mark a warning as false, you need to click it, then click the 'Bulk Edit' button, select the 'Status' and 'False Positive' items.

Quality Gate in DefectDojo
Quality Gate indicates whether a project's code complies with the threshold values of metrics. In DefectDojo, you can't configure Quality Gate using the Web interface. However, with the help of API, you can get the necessary information to implement Quality Gate.
An example of the script for using Quality Gate in DefectDojo is here.
For the script to work, set these environment variables:
- DD_HOST — the DefectDojo host address,
- DD_API_TOKEN — the current API v2 Key
This is how you can run the script:
python ./qualitygate.py --engagement 6 --critical 0 --high 10 ^
--medium 50 --low 250'engagement' is the number of the engagement to which the report is uploaded.
'critical', 'high', 'medium', 'low' are the thresholds for the number of PVS-Studio warnings at different certainty levels.
The script gets the latest report from the provided engagement and determines the number of messages by their certainty levels. After this, a check is carried out to ensure that the number of warnings is less than the ones received.
As we can see, the script in the example above will return code 1 if the report contains at least one Critical warning or more than 10 High, 50 Medium, 250 Low warnings.
You can set your Quality Gate logic by changing the quality_gate() function.
Integrating PVS-Studio Analysis Results into SonarQube
- System requirements
- Integrating PVS-Studio with the SonarQube Docker image
- PVS-Studio plugins and how to install them
- Maintaining repository compatibility when upgrading to new SonarCXX plugin version
- Creating and setting up a Quality Profile
- Code analysis and importing results into SonarQube
- For software security specialists
- Additional features of the PVS-Studio plugin
- Customizing the analyzer before analysis
- Automatic updates of PVS-Studio plugins
- Recommendations and limitations
Integration of PVS-Studio with the SonarQube platform is available only under the PVS-Studio Enterprise license. You can request the trial Enterprise license here.
SonarQube is an open-source platform developed by SonarSource for continuous inspection of code quality to perform automatic reviews with static analysis of code to detect bugs, code smells, and security vulnerabilities on 20+ programming languages. SonarQube offers reports on duplicated code, coding standards, unit tests, code coverage, code complexity, comments, bugs, and security vulnerabilities. SonarQube can record metrics history and provides evolution graphs.
SonarQube's capabilities are shown here.
To import analysis results into SonarQube, PVS-Studio provides a special plugin, which allows you to add messages produced by PVS-Studio to the message base of the SonarQube server. SonarQube's Web interface allows you to filter the messages, navigate the code to examine bugs, assign tasks to developers and keep track of the progress, analyze bug amount dynamics, and measure the code quality of your projects.
System requirements
- Operating system: Windows, Linux, macOS;
- Java 8 or higher;
- SonarQube 7.6 or higher;
- PVS-Studio analyzer;
- PVS-Studio Enterprise-license.
Integrating PVS-Studio with the SonarQube Docker image
The easiest and fastest way to deploy a SonarQube server is to use the SonarQube image from Dockerhub.
To upload PVS-Studio analyzer reports to SonarQube, the latest version of the PVS-Studio plugin for SonarQube should be installed (you can download it here). One of the C/C++ plugins should also be installed if these languages are used in the projects you are analyzing.
Below is a sample Docker file, it creates an image with SonarQube Community Edition and all required plugins:
# To use SonarQube Enterprise Edition, replace "lts-community" with "lts"
# in the tag of the base docker image.
FROM sonarqube:lts-community
USER root
# Installing the curl utility
RUN apk add curl || (apt-get update && apt-get install -y curl)
# Use the latest version of the plugin.
# You can find it at:
# https://pvs-studio.com/en/pvs-studio/download-all/
ARG PVS_VER=7.27.75620.2023
# Installing the PVS-Studio plugin for SonarQube.
RUN curl -Lo \
/opt/sonarqube/extensions/plugins/sonar-pvs-studio-plugin-$PVS_VER.jar \
https://cdn.pvs-studio.com/sonar-pvs-studio-plugin-$PVS_VER.jar
# If you want to use a different version of the plugin,
# you can change it here.
ARG C_VER=cxx-2.1.1
ARG C_JAR=sonar-cxx-plugin-2.1.1.488.jar
# Installing the SonarCXX plugin (it is required to work with C/C++ projects)
RUN curl -Lo \
/opt/sonarqube/extensions/plugins/$C_JAR \
https://github.com/SonarOpenCommunity/sonar-cxx/releases/download/$C_VER/$C_JAR
# Changing the account that will be used in the container
USER sonarqubeOnce you have created the file, use the command to build the Docker image:
docker build -f dockerfile -t sonarqube-pvs-studio ./To run the SonarQube container from a pre-built image, use the following command:
docker run -p 9000:9000 sonarqube-pvs-studioNote: to avoid losing data from SonarQube when removing the container, mount directories using the paths that are defined in the SonarQube container instructions in DockerHub. Here is an example of a command to start a container with mounted directories:
docker run -v /path/to/data:/opt/sonarqube/data
-v /path/to/logs:/opt/sonarqube/logs
-v /path/to/extentions:/opt/sonarqube/extensions
-p 9000:9000 sonarqube-pvs-studioTo see SonarQube running in a Docker container in your browser, follow the link: http://localhost:9000/.
To log in, enter the default SonarQube administrator login and password:
Login: admin
Password: adminSet a new password for the administrator account after logging in.
PVS-Studio plugins and how to install them
The following plugins for SonarQube are available for PVS-Studio users:
- sonar-pvs-studio-plugin.jar - a plugin which allows importing PVS-Studio analysis results into a project on the SonarQube server. You can download it here;
- sonar-pvs-studio-lang-plugin.jar - a plugin which allows creating a quality profile for the C/C++/C# languages. This plugin is provided for compatibility of PVS-Studio plugins when moving from older versions of SonarQube to newer ones. This plugin allows you to keep the metrics/statistics obtained earlier and will probably be discarded in future releases. When creating a new project, use a profile with one of the standard languages (C++, C#, Java).
Once the SonarQube server is installed, copy the plugin (sonar-pvs-studio-plugin.jar) to this directory:
SONARQUBE_HOME/extensions/pluginsDepending on what language the analysis results refer to, install the corresponding plugins from the list below (some of them may be installed by default, depending on the SonarQube edition in use):
- SonarCXX plugin (GitHub)
- SonarC# plugin (Marketplace)
- SonarJava plugin (Marketplace)
- SonarCFamily (Marketplace). This plugin is for SonarQube Developer Edition only.
Restart the SonarQube server.
Maintaining repository compatibility when upgrading to new SonarCXX plugin version
Note. If you immediately use the updated version of SonarCXX (2.0.+) for your project, then the information below is irrelevant for you.
Developers made numerous changes to SonarCXX 2.0.+, taking into account the experience of previous versions. One of the profound changes - renaming the language key from 'C++' to 'CXX'. As a result, the PVS-Studio plugin now generates different unrelated repositories for these languages by default. If you update the SonarCXX plugin without prior configuration and then download the PVS-Studio report, all the pre-existing PVS-Studio Issues are considered deleted. All Issues from the report are considered new.
If you need to update SonarCXX and maintain the Issues history from PVS-Studio (for example, keep the statuses like Won't Fix or False Positive with all comments), follow these instructions:
- if you use Quality Profile for C++ that you have been configuring for a long time, backup its copy and replace '<language>c++</language>' with '</language>cxx<language>' in the saved file;
- stop the SonarQube server;
- in the configuration file of the SonarQube server on the "SonarQubeFolder/conf/sonar.properties" path, add the 'sonar.pvs-studio.enableCompatibilitySonarCXXRepositories=true' line;
- replace the Sonar CXX plugin file in the SonarQubeFolder/extentions/plugins/ folder with the new plugin version (2.0.+);
- run the SonarQube server (SonarQubeFolder/bin/windows-x86-64/StartSonar.bat);
- restore the pre-saved Quality Profile or create a new one for the CXX language;
- if necessary, enable the rules from the PVS-Studio repository in the Quality Profile for the CXX language;
- set the pre-saved/created Quality Profile as the default profile (Set as Default).
At this point, you can use the restored Quality Profile for the CXX language and upload PVS-Studio reports for projects.
IMPORTANT: If you previously uploaded the PVS-Studio reports with the new Sonar CXX plugin (2.0.+) and did not add a line from the instructions to the "SonarQubeFolder/conf/sonar.properties" file, then all Issues that were previously uploaded will change their status to Removed and disappear over time (by default, 30 days).
Creating and setting up a Quality Profile
Note. Below you can see the Quality Profile setting with pre-installed PVS-Studio and SonarC++ Community (v2.0.4) plugins. Please, note that if you use SonarC++ Community plugin version lower than 2.0+, then instead of the CXX language, there will be C++ (Community) / C(Community).
A Quality Profile is a collection of diagnostic rules to apply during an analysis. You can include PVS-Studio diagnostics into existing profiles or create a new profile. Every profile is bound to a particular programming language, but you can create several profiles with different rule sets. The ability to perform any action on quality profiles is granted to members of the sonar-administrators group.
A new profile is created using the menu command Quality Profiles -> Create:

To include PVS-Studio diagnostics into the active profile, select the desired repository through Rules -> Repository:

After that, click on the Bulk Change button to add all of the diagnostics to your profile, or select the desired diagnostics manually.
Diagnostics activation window:

You can also filter diagnostics by tags before selecting them for your profile:

After creating/tweaking your profiles, set one of them as the default profile:

The default profile is started automatically for source files written in the specified language. You don't necessarily have to group your profiles based on the utilities used. You can create a single profile for your project and add diagnostics from different utilities to it.
Since in SonarQube each extension of the analyzed file must be uniquely assigned to one programming language, SonarC++ Community plugin version 2.0+ does not define file extensions by default. It helps to avoid conflicts with other language plugins. You need to define them yourself:
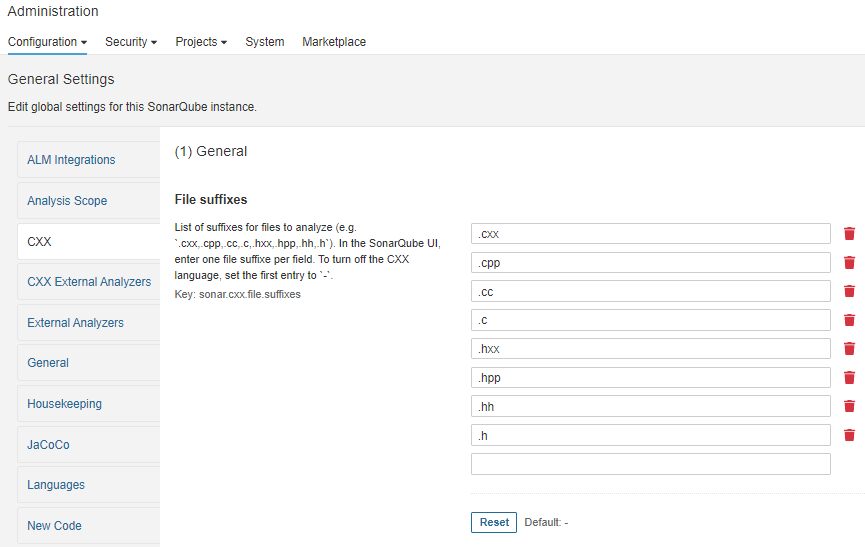
When a new PVS-Studio version releases, new diagnostics may appear, so you will have to update the plugin on the SonarQube server and add the new rules to the Quality Profile that uses PVS-Studio diagnostics. One of the sections below describes how to set up automatic updates.
Code analysis and importing results into SonarQube
Analysis results can be imported into SonarQube using the SonarQube Scanner utility. It requires a configuration file named sonar-project.properties and stored in the project's root directory. This file contains analysis parameters for the current project, and you can pass all or some of these settings as launch parameters of the SonarQube Scanner utility.
Before running the analysis, enter the PVS-Studio license. To learn how to do this, please consult the documentation.
Below we will discuss the standard scanner launch scenarios for importing PVS-Studio analysis results into SonarQube on different platforms. SonarQube Scanner will automatically pick up the configuration file sonar-project.properties in the current launch directory.
SonarScanner for .NET for C# projects
There are two SonarScanner versions available for C# projects:
- SonarQube Scanner (sonar-project.properties is required);
- SonarQube Scanner for .NET (sonar-project.properties is not required).
The difference between the two is that SonarQube Scanner for .NET has a narrower focus. Compared to SonarQube Scanner, it shows more statistics provided by SonarQube for a C# project. For example, for a report loaded by SonarQube Scanner, the tab with the list of projects (project preview) in SonarQube does not display brief project statistics, unlike for a report loaded using SonarQube Scanner for .NET:
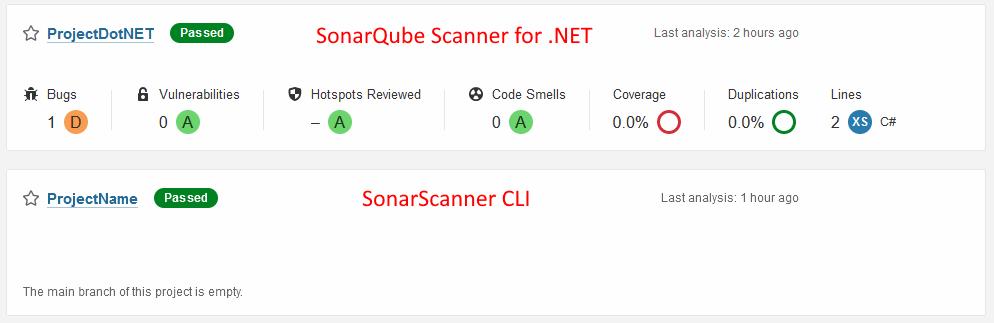
Windows: C, C++, C#
MSBuild projects are checked with the PVS-Studio_Cmd.exe utility.
Option 1
By launching the PVS-Studio_Cmd once, you can get both an analysis report and the configuration file sonar-project.properties:
PVS-Studio_Cmd.exe ... -o Project.plog --sonarqubedata ...This is what the scanner launch command looks like:
sonar-scanner.bat ^
-Dsonar.projectKey=ProjectKey ^
-Dsonar.projectName=ProjectName ^
-Dsonar.projectVersion=1.0 ^
-Dsonar.pvs-studio.reportPath=Project.plog ^
-Dsonar.login=admin ^
-Dsonar.password=NEW_ADMIN_PASSWORDOption 2
When working with SonarQube Scanner for .NET for C# projects, use a special set of commands. You do not need to create the sonar-project.properties file (the ‑‑sonarqubedata argument from PVS-Studio_Cmd.exe) when starting the analysis.
- SonarQube Scanner for .NET Framework:
SonarScanner.MSBuild.exe begin ... /d:sonar.pvs-studio.reportPath=Project.plog
MSBuild.exe Project.sln /t:Rebuild ...
PVS-Studio_Cmd.exe -t Project.sln ... -o Project.plog
SonarScanner.MSBuild.exe end- SonarQube Scanner for .NET:
dotnet <path to SonarScanner.MSBuild.dll>
begin /d:sonar.pvs-studio.reportPath=Project.plog
dotnet build Project.sln /t:Rebuild ...
PVS-Studio_Cmd.exe -t Project.sln ... -o Project.plog
dotnet <path to SonarScanner.MSBuild.dll>
endWindows, Linux, macOS: Java
Add the following lines to the Java project under analysis (depending on the project type):
Maven
<outputType>json</outputType>
<outputFile>output.json</outputFile>
<sonarQubeData>sonar-project.properties</sonarQubeData>Gradle
outputType = 'json'
outputFile = 'output.json'
sonarQubeData='sonar-project.properties'Java analyzer core
Windows:
java -jar pvs-studio.jar ^
-s ./ ^
--ext-file /path/to/file/with/classpath/entries ^
-o output.json ^
--output-type json ^
--sonarqubedata sonar-project.propertiesLinux/macOS:
java -jar pvs-studio.jar \
-s ./ \
--ext-file /path/to/file/with/classpath/entries \
-o output.json \
--output-type json \
--sonarqubedata sonar-project.propertiesJust like in the previous case, the configuration file will be created automatically once the Java analyzer has finished the check.
The scanner launch command will look like this:
Windows:
sonar-scanner.bat ^
-Dsonar.projectKey=ProjectKey ^
-Dsonar.projectName=ProjectName ^
-Dsonar.projectVersion=1.0 ^
-Dsonar.pvs-studio.reportPath=output.json ^
-Dsonar.login=admin ^
-Dsonar.password=NEW_ADMIN_PASSWORDLinux/macOS:
sonar-scanner \
-Dsonar.projectKey=ProjectKey \
-Dsonar.projectName=ProjectName \
-Dsonar.projectVersion=1.0 \
-Dsonar.pvs-studio.reportPath=output.json \
-Dsonar.login=admin \
-Dsonar.password=NEW_ADMIN_PASSWORDLinux, macOS: C, C++, C#
If you work with a C/C++ project, you need to create the configuration file manually. For example, it may include the following contents:
sonar.projectKey=my:project
sonar.projectName=My project
sonar.projectVersion=1.0
sonar.pvs-studio.reportPath=report.json
sonar.sources=path/to/directory/with/project/sourcesOption 1
If you have a C# project, you can get the analyzer report along with the configuration file with the help of the following command:
pvs-studio-dotnet .... -o report.json –sonarqubedataYou can run the scanner with this command:
sonar-scanner\
-Dsonar.projectKey=ProjectKey \
-Dsonar.projectName=ProjectName \
-Dsonar.projectVersion=1.0 \
-Dsonar.pvs-studio.reportPath=report.json \
-Dsonar.login=admin \
-Dsonar.password=NEW_ADMIN_PASSWORDOption 2
When working with SonarQube Scanner for .NET for C# projects, use a special set of commands. You do not need to create the sonar-project.properties file (the ‑‑sonarqubedata argument from pvs-studio-dotnet) when starting the analysis:
dotnet <path to SonarScanner.MSBuild.dll>
begin /d:sonar.pvs-studio.reportPath=report.json
dotnet build Project.sln /t:Rebuild ...
pvs-studio-dotnet .... -o report.json
dotnet <path to SonarScanner.MSBuild.dll> endsonar-project.properties
To fine-tune the analysis further, you can compose the configuration file manually from the following settings (or edit the automatically created file when checking MSBuild and Java projects):
- sonar.pvs-studio.reportPath - path to the analyzer report in the .plog (for MSBuild projects) or .json format;
- sonar.pvs-studio.licensePath - path to the PVS-Studio license file (when checking an MSBuild project, you can pass this parameter using sonar.pvs-studio.settingsPath). Default path on Linux and macOS -- ~/.config/PVS-Studio/PVS-Studio.lic;
- sonar.pvs-studio.sourceTreeRoot - path to the project directory on the current computer for cases when the report was generated on another computer, Docker container, etc. This parameter enables you to pass reports containing relative paths to sonar.pvs-studio.reportPath (when checking an MSBuild project, you can pass this parameter using sonar.pvs-studio.settingsPath);
- sonar.pvs-studio.settingsPath - path to the Settings.xml file for MSBuild projects checked on Windows. This file already contains information about licencePath and sourceTreeRoot, so you don't have to specify them explicitly. Default path -- %AppData%\PVS-Studio\Settings.xml. File is used on Windows only;
- sonar.pvs-studio.cwe - specifies if CWE IDs are added to analyzer warnings. This option is off by default. Use the value active to enable;
- sonar.pvs-studio.misra - specifies if MISRA IDs are added to analyzer warnings. This option is off by default. Use the value active to enable;
- sonar.pvs-studio.language - activates the C/C++/C# language plugin. This option is off by default. Use the value active to turn it on. Enable this option if you are using a profile with the C/C++/C# languages added through a separate PVS-Studio plugin. This plugin is provided for compatibility of PVS-Studio plugins when moving from older versions of SonarQube to newer ones. It allows you to keep the metrics/statistics obtained earlier and will probably be discarded in future releases.
The other standard scanner configuration parameters are described in the general documentation on SonarQube.
Uploading a report when using the SonarCFamily plugin
When using the PVS-Studio plugin together with the SonarCFamily plugin, you need to additionally use SonarSource Build Wrapper or Compilation Database (since SonarQube 9.1) when uploading PVS-Studio report. Detailed instructions on how to use them can be found on the SonarQube website.
When uploading the report, you need to specify the property sonar.cfamily.build-wrapper-output or sonar.cfamily.compile-commands as an argument when launching sonar-scanner (e.g. -Dsonar.cfamily.build-wrapper-output=directory_with_Build_Wrapper_results) or add the property to the sonar-project.properties file.
Multi-module Project
When subproject directories are located at different levels, it becomes impossible to upload the results of several subprojects to SonarQube in one project with standard settings. This is because this sub-project structure requires additional adjustment of the indexer in the SonarScanner utility.
You can set up such a project correctly by using modules where each module is configured for one subproject:
sonar.projectKey=org.mycompany.myproject
sonar.projectName=My Project
sonar.projectVersion=1.0
sonar.sources=src
sonar.modules=module1,module2
module1.sonar.projectName=Module 1
module1.sonar.projectBaseDir=modules/mod1
module2.sonar.projectName=Module 2
module2.sonar.projectBaseDir=modules/mod2There are two ways to specify the path to the PVS-Studio analysis file.
The first way
Specify different reports for modules:
....
sonar.modules=module1,module2
module1.sonar.projectName=Module 1
module1.sonar.projectBaseDir=modules/mod1
module1.sonar.pvs-studio.reportPath=/path/to/report1.plog
module2.sonar.projectName=Module 2
module2.sonar.projectBaseDir=modules/mod2
module2.sonar.pvs-studio.reportPath=/path/to/report2.plogThe second way
Specify one report at the project level:
sonar.projectKey=org.mycompany.myproject
sonar.projectName=My Project
sonar.projectVersion=1.0
sonar.sources=src
sonar.pvs-studio.reportPath=/path/to/report.plog
sonar.modules=module1,module2
....In this case, each module will download only warnings relevant to it from the report. Unfortunately, a warning (WARN) will be issued for the files from other modules, indicating the absence of files in the SonarScanner utility output, but all analysis results will be downloaded correctly.
For software security specialists
PVS-Studio's capabilities of detecting potential vulnerabilities are described on the page PVS-Studio SAST (Static Application Security Testing).
Security-related information on the code under analysis provided by PVS-Studio is additionally highlighted by SonarQube in the imported analysis results.
Cwe, cert, misra tags
PVS-Studio warnings can be grouped based on different security standards through Issues -> Tag or Rules -> Tag:
- misra
- cert
- cwe
You can also select a particular CWE ID if available (when a warning falls into several CWE IDs at once, it will be marked with a single cwe tag; use prefixes in the warning text to filter by IDs):

Security Category
In SonarQube [7.8, 8.4], a new filter by security categories is available on pages Issues and Rules. Using this filter, SonarQube lets to classify rules according to security standards, such as:
- Sans Top 25
- OWASP Top 10
- CWE
Rules and issues from PVS-Studio mapped with CWE ID can also be grouped in the following menu (Security Category -> CWE):
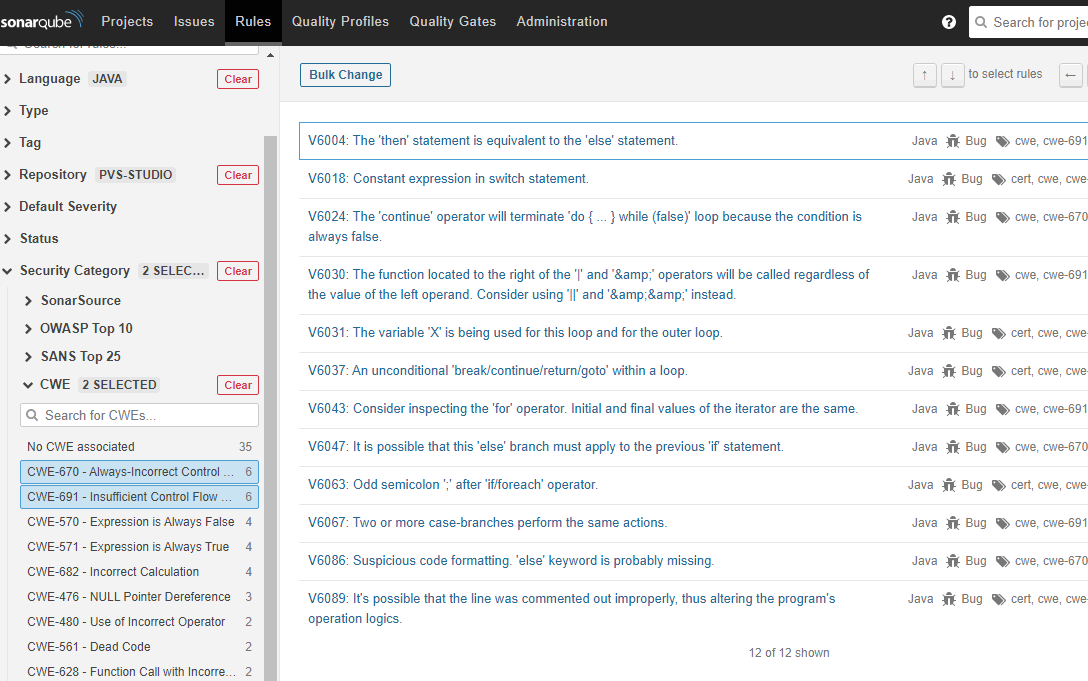
Note. Starting from the SonarQube 8.5 version, only Issues/Rules related to security of the 'Vulnerability' or 'Security Hotspot' type will be able to get to the Security Category tab.
PVS-Studio warnings as potential vulnerabilities
All the rules in PVS-Studio are of the 'Bug' type by default. If you need to change the 'Bug' rule type for 'Vulnerability' when having a CWE ID, then you need to add the following line in the '$SONARQUBE_HOME\conf\sonar.properties' server configuration file:
sonar.pvs-studio.treatPVSWarningsAsVulnerabilities=activeFor the changes to be applied, you need to restart the SonarQube server. Once you have done this, the rules with the CWE ID will have the 'Vulnerability' type, and the new generated issues will already take this change into account.
Note. If you had old issues before, this change will not affect them. You'll need to manually change the type of these issues.
CWE and MISRA prefixes in warnings
The configuration file sonar-project.properties provides the following options:
sonar.pvs-studio.cwe=active
sonar.pvs-studio.misra=activeThey are used to enable the inclusion of CWE and MISRA IDs into analyzer warnings:

Warnings can be filtered by tags anytime, regardless of the specified options.
Statistics on detected CWE and MISRA problems
The tab Projects -> Your Project -> Measures shows various code metrics calculated each time a check is launched. All collected information can be visualized as graphs. The Security section allows you to track the number of warnings with CWE and MISRA tags for the current project:

The other, general, metrics of PVS-Studio warnings can be viewed in a separate section, PVS-Studio.
Additional features of the PVS-Studio plugin
Most actions available to SonarQube users are standard for this platform. These actions include viewing and sorting analysis results, changing warning status, and so on. For this reason, this section will focus only on the additional features that come with the PVS-Studio plugin.
Sorting warnings by groups
PVS-Studio warnings are divided into several groups, some of which may be irrelevant to the current project. That's why we added an option allowing you to filter diagnostics by the following tags when creating a profile or viewing the analysis results:
|
PVS-Studio diagnostics group |
SonarQube tag |
|---|---|
|
General analysis |
pvs-studio#ga |
|
Micro-optimizations |
pvs-studio#op |
|
64-bit errors |
pvs-studio#64 |
|
MISRA |
pvs-studio#misra |
|
Customers' specific diagnostics |
pvs-studio#cs |
|
Analyzer fails |
pvs-studio#fails |
These are the standard tags used in PVS-Studio warnings:
|
Code quality control standards |
SonarQube tag |
|---|---|
|
CWE |
cwe |
|
CERT |
cert |
|
MISRA |
misra |
Unlike the pvs-studio# tag group, the standard SonarQube tags may include, depending on the active quality profile, messages from other tools in addition to those from PVS-Studio.
Viewing code metrics
The tab Projects -> Your Project -> Measures shows various code metrics calculated each time a check is launched. When installing the analyzer plugin, a new section, PVS-Studio, is also added, where you can find useful information on your project and have graphs plotted:

Customizing the analyzer before analysis
When working with a large code base, the analyzer will inevitably generate a lot of messages, and it's usually impossible to address them all at once. In order to focus on the most important warnings and keep the statistics "uncluttered", you can do some tweaking of the analyzer settings and log filtering before launching SonarQube Scanner. There are several ways to do this.
1. You can have less "noise" in the analyzer's output by using the No Noise option. It allows you to completely turn off messages of the Low Certainty level (which is the third level). After restarting the analysis, all messages of this level will disappear from the analyzer's output. To enable this option, use the settings window "Specific Analyzer Settings" in Windows or refer to the general documentation for Linux and macOS.
2. You can speed up the check by excluding external libraries, test code, etc. from analysis. To add files and directories to the exceptions list, use the settings window "Don't Check Files" in Windows or refer to the general documentation for Linux and macOS.
3. If you need additional control over the output, for example, message filtering by level or error code, use the message filtering and conversion utility (Plog Converter) for the current platform.
4. If you need to change a warning's level, you can do so in the settings of the analyzer itself rather than in SonarQube. PVS-Studio has the following certainty levels: High, Medium, Low, and Fails. The respective levels in SonarQube are Critical, Major, Minor, and Info. See the page "Additional diagnostics configuration" on how to change warnings' levels.
Automatic updates of PVS-Studio plugins
The update procedure can be automated with SonarQube Web Api. Suppose you have set up an automatic PVS-Studio update system on your build server (as described in the article "Unattended deployment of PVS-Studio"). To update the PVS-Studio plugins and add the new diagnostics to the Quality Profile without using the Web interface, perform the following steps (the example below is for Windows; the same algorithm applies to other operating systems):
- Copy the sonar-pvs-studio-plugin.jar file from the PVS-Studio installation directory to $SONARQUBE_HOME\extensions\plugins.
- Restart the SonarQube server.
Suppose your SonarQube server is installed in C:\Sonarqube\ and is running as a service; PVS-Studio is installed in C:\Program Files (x86)\PVS-Studio\. The script which will automatically update the PVS-Studio distribution and sonar-pvs-studio-plugin will then look like this:
set PVS-Studio_Dir="C:\Program Files (x86)\PVS-Studio"
set SQDir="C:\Sonarqube\extensions\plugins\"
rem Update PVS-Studio
cd /d "C:\temp\"
xcopy %PVS-Studio_Dir%\PVS-Studio-Updater.exe . /Y
call PVS-Studio-Updater.exe /VERYSILENT /SUPPRESSMSGBOXES
del PVS-Studio-Updater.exe
rem Stop the SonarQube server
sc stop SonarQube
rem Wait until the server is stopped
ping -n 60 127.0.0.1 >nul
xcopy %PVS-Studio_Dir%\sonar-pvs-studio-plugin.jar %SQDir% /Y
sc start SonarQube
rem Wait until the server is started
ping -n 60 127.0.0.1 >nul- Specify the key for the Quality Profile where you want the new diagnostics activated. This key can be retrieved through the GET request api/qualityprofiles/search, for example (in one line):
curl http://localhost:9000/api/qualityprofiles/search
-v -u admin:adminThe server's response will be as follows:
{
"profiles": [
{
"key":"c++-sonar-way-90129",
"name":"Sonar way",
"language":"c++",
"languageName":"c++",
"isInherited":false,
"isDefault":true,
"activeRuleCount":674,
"rulesUpdatedAt":"2016-07-28T12:50:55+0000"
},
{
"key":"c-c++-c-pvs-studio-60287",
"name":"PVS-Studio",
"language":"c/c++/c#",
"languageName":"c/c++/c#",
"isInherited":false,
"isDefault":true,
"activeRuleCount":347,
"rulesUpdatedAt":"2016-08-05T09:02:21+0000"
}
]
}Suppose you want the new diagnostics to be added to your PVS-Studio profile for the languages 'c/c++/c#'. The key for this profile is the value c-c++-c-pvs-studio-60287.
- Run the POST request api/qualityprofiles/activate_rules and specify the parameters profile_key (obligatory) and tags. The obligatory parameter profile_key specifies the key for the SonarQube profile where the diagnostics will be activated. In our example, this parameter has the value c-c++-c-pvs-studio-60287.
Note that a profile key may contain special characters, so the URL characters need to be escaped when passing the key in the POST request. In our example, the profile key c-c++-c-pvs-studio-60287 must be converted into c-c%2B%2B-c-pvs-studio-60287
The tags parameter is used to pass the tags of the diagnostics you want activated in your profile. To activate all PVS-Studio diagnostics, pass the pvs-studio tag.
The request for adding all diagnostics to a PVS-Studio profile will look like this (in one line):
curl --request POST -v -u admin:admin -data
"profile_key=c-c%2B%2B-c-pvs-studio-60287&tags=pvs-studio"
http://localhost:9000/api/qualityprofiles/activate_rulesRecommendations and limitations
- The SonarQube server deletes closed issues older than 30 days by default. We recommend that you disable this option so that you could keep track of the number of warnings addressed over a long time period (say, a year);
- If you have modules specified in the sonar-project.properties file and you have a separate analyzer report for each of them, you need to merge these reports using the PlogConverter utility and specify the resulting report once in sonar.pvs-studio.reportPath.
- The developers of SonarQube recommend using SonarQube Scanner for MSBuild to analyze MSBuild projects. This scanner is a wrapper around the standard SonarQube scanner .It makes the creation of the sonar-project.properties configuration file easier by automatically adding modules (projects of a solution) to it and specifying the paths to the source files to be analyzed. However, we faced some limitations that lead to creating incorrect configuration files when working with complex projects. Because of that, we recommend using the standard SonarQube scanner to import PVS-Studio analysis results.
- All source files that you want analyzed must be stored on the same disk. This limitation is imposed by the SonarQube platform. Source files stored on disks other than that specified in the sonar.projectBaseDir property will not be indexed, and the messages generated for those files will be ignored.
How to upload analysis results to Jira
Jira is an issue tracking and project management system. It may be convenient to fix the static code analyzer warnings within the framework of a created issue.
Here are the reasons why it's not recommended to create a new issue for each warning:
- There can be a lot of warnings (a large team, many commits)
- The analyzer report may contain false or unfiltered warnings
- Some warnings are quicker to fix than to create an issue
However, to fix some warnings or bugs you need to capture and monitor them in the issue management system.
Users who work with PVS-Studio, SonarQube and Jira at once can create issues from the analyzer warnings in semi-automatic mode. To do this, use the SonarQube Connector for Jira app built into Jira. You can add it to your project in the Jira Software menu > Apps > Find new apps > SonarQube Connector for Jira.
To create an issue from a PVS-Studio warning, follow several steps:
- Analyze a project and save a report in the .xml format
- Upload the report to SonarQube using the PVS-Studio plugin
- Synchronize the SonarQube Connector for Jira with the SonarQube server
- Manually select warnings to convert them into issues
Issues creation from the selected warnings looks as follows:

Note: To upload the analyzer warnings to SonarQube, the PVS-Studio Enterprise license is required. You can request the trial Enterprise license here.
Unattended deployment of PVS-Studio
- Unattended deployment
- Configuring an update source
- Installation using the Chocolatey package manager
- Deploying licenses and customizing settings
- Deploying the analyzer without installation
In this article we describe working in the Windows environment. Working in the Linux environment is described in the article "How to run PVS-Studio on Linux".
Unattended deployment
As for most of other software setting up PVS-Studio requires administrative privileges.
Unattended setup is performed by specifying command line parameters, for example:
PVS-Studio_Setup.exe /verysilent /suppressmsgboxes
/norestart /nocloseapplicationsPVS-Studio may require a reboot if, for example, files that require update are locked. To install PVS-Studio without reboot, use the 'NORESTART' flag. Please also note that if PVS-Studio installer is started in a silent mode without this flag, the computer may be rebooted without any warnings or dialogs.
By default, all available PVS-Studio components will be installed. In case this is undesirable, the required components can be selected by the 'COMPONENTS' switch (following is a list of all possible components):
PVS-Studio_setup.exe /verysilent /suppressmsgboxes
/nocloseapplications /norestart /components= Core,
Standalone,MSVS,MSVS\2010,MSVS\2012,MSVS\2013,MSVS\2015,MSVS\2017,
MSVS\2019,MSVS\2022,IDEA,JavaCore,Rider,CLionBrief description of components:
- components with 'MSVS' prefix in their name are corresponding to Microsoft Visual Studio plug-in extensions;
- the 'Core' component is a mandatory one; it contains a core command-line analyzer engine, which is required for all of the IDE extension plug-ins to operate;
- the Standalone component installs compiler monitoring system, which allows to analyze any kind of C, C++ project as long as such project uses one of the supported compilers;
- the 'IDEA' component corresponds to the PVS-Studio plugin for the IntelliJ IDEA development environment;
- the 'JavaCore' component corresponds to the analyzer core for Java;
- the 'Rider' component corresponds to the PVS-Studio plugin for the Rider development environment.
During installation of PVS-Studio all instances of Visual Studio / IntelliJ IDEA / Rider should be shut down, however to prevent user's data loss PVS-Studio does not shut down Visual Studio / IntelliJ IDEA / Rider.
The installer will exit with '100' if it is unable to install the extension (*.vsix) for any of the selected versions of Visual Studio.
Use 'HELP' to get additional information about the flags:
PVS-Studio_setup.exe /helpThe PVS-Studio-Updater.exe can perform check for analyzer updates, and, if an update is available, it can download it and perform an installation on a local system. To start the updater tool "silently", the same arguments can be utilized:
PVS-Studio-Updater.exe /VERYSILENT /SUPPRESSMSGBOXESIf there are no updates on the server, the updater will exit with the code '0'. As PVS-Studio-Updater.exe performs a local deployment of PVS-Studio, devenv.exe should not be running at the time of the update as well.
If you connect to Internet via a proxy with authentication, PVS-Studio-Updater.exe will prompt you for proxy credentials. If the proxy credentials are correct, PVS-Studio-Updater.exe will save them in the Windows Credential Manager and will use these credentials to check for updates in future. If you want to use the utility with proxy without authorization you can do it using proxy flag (/proxy=ip:port).
Configuring an update source
Starting from version 7.24 PVS-Studio for Windows supports changing of an update source. This can be useful if you do not want the developers to update PVS-Studio right after the release.
For example, you can create a group of users who will receive the updates first and a group of users who should receive the updates after the first group has tested the product.
For the first group no configuration changes are required, they will receive updates from the PVS-Studio release channel.
For the second group, an alternative update channel should be deployed. All you need to do is to place version.xml file and PVS-Studio distribution package on your server. After that you should change the update source on the second group's developer machines.
The update source information is stored in the system registry: 'HKEY_LOCAL_MACHINE\SOFTWARE\WOW6432Node\ProgramVerificationSystems\PVS-Studio' in the 'UpdateUrl' key. By default, the standard address to the version.xml file is written there, the file contains the information about an update. You can specify address to alternative version.xml file located on your server. For example: https://myserver.com/version.xml
The version.xml file has the following structure:
<ApplicationUpdate>
<!--PVS-Studio update version-->
<Version>7.23</Version>
<!--Link to download-->
<FileURL>https://myserver.com/PVS-Studio_setup.exe</FileURL>
<CompatibilityVersion>1</CompatibilityVersion>
</ApplicationUpdate>PVS-Studio will now check for updates via the version.xml file which is stored on the myserver.com server, and if there is an update, it will download it from this server.
Installation using the Chocolatey package manager
Another possible installation option is to use the Chocolatey package manager. When using this installation option, the package manager itself has to already be installed.
The installation command of the latest available PVS-Studio package version:
choco install pvs-studioThe installation command of a specific PVS-Studio package version:
choco install pvs-studio --version=7.05.35617.2075When installing the package, you can also set the list of installed components in a similar way to those listed in the section "Unattended deployment" of this document. To specify components, use the flag '‑‑package-parameters'. The components are equivalent to those described above and differ only in the syntax of some parameters:
- Standalone;
- JavaCore;
- IDEA;
- Rider;
- MSVS2010;
- MSVS2012;
- MSVS2013;
- MSVS2015;
- MSVS2017;
- MSVS2019.
Only the 'Core' component is installed by default. When listing the installation components, there is no need to specify 'Core'.
Here's the example of the command which the analyzer will install with the components 'Core' and 'Standalone':
choco install pvs-studio --package-parameters="'/Standalone'"Deploying licenses and customizing settings
Different ways to enter the license when using various environments are covered in the documentation section "How to enter the PVS-Studio license and what's the next move".
If you want deploy PVS-Studio for many computers then you can install license without manual entering. It should place valid 'Settings.xml' file into folder under user's profile.
If many users share one desktop each one should have its own license.
Default settings location is the following:
%USERPROFILE%\AppData\Roaming\PVS-Studio\Settings.xmlIt is user-editable xml file, but it also could be edited by through PVS-Studio IDE plugin on a target machine. Please note that all settings that should be kept as default values could be omitted from 'Setting.xml' file.
Deploying the analyzer without installation
PVS-Studio's functionality highly depends on the development environment where it is used. This means, without pre-configuration, the analyzer cannot be used as a fully portable tool. However, sometimes several machines have the same development environment that is necessary for the analyzer to work correctly. In this case you can copy the analyzers' files from one computer to another one. This allows you to use PVS-Studio on different computers without installing the analyzer on any of them.
You can also upload the analyzer's files to your version control system. This facilitates deploying and updating PVS-Studio on a large number of machines.
Deploying the analyzer for C, C++, and C# on Windows
Step 1. Download the PVS-Studio installer (.exe) from the website and run it.
Step 2. After the installation is complete, enter the license as specified in the documentation.
Step 3. Copy the 'C:\Program Files (x86)\PVS-Studio' folder and the 'Settings.xml' settings file to another computer. By default, the settings file is located here:
%USERPROFILE%\AppData\Roaming\PVS-Studio\Settings.xmlAs a result, you will be able to run 'PVS-Studio_Cmd.exe' from the folder you've copied to the user computer. When starting the analysis, pass the settings file path to the '-s' parameter:
PVS-Studio_Cmd.exe .... -s <pathToSettingsXml> ....Configuring PVS-Studio's portable mode on Windows for Java
Step 1. Download the PVS-Studio installer (.exe) from the website and run it;
Step 2. Create the 'PVS-Studio.lic' file with license data next to the Java analyzer's core. Use this path: 'C:\Program Files (x86)\PVS-Studio-Java'. The license file must contain the user name and the license serial number - on separate lines. For example:
UserName
XXXX-XXXX-XXXX-XXXXAfter this, you can copy the 'C:\Program Files (x86)\PVS-Studio-Java' folder to a different computer that has Java 8 or higher installed. Now you can run the Java analyzer from the folder you copied. To do this, pass the license file path to the '‑‑license-path' argument:
java -jar pvs-studio.jar .... --license-path PVS-Studio.lic ....Speeding up the analysis of C and C++ code through distributed build systems (Incredibuild)
- An example of Incredibuild configuration
- Combined use of distributed analysis and compiler call monitoring system
To speed up the analysis, you can use a distributed build system, for example, Incredibuild. The analysis of C/C++ code in PVS-Studio can be divided into 2 stages: preprocessing and analysis itself. Each of these steps can be executed remotely by the distributed build system. To analyze each C/C++ compiled file, PVS-Studio first launches an external preprocessor, and then the C++ analyzer itself. Each such process can be executed remotely.
Depending on the type of a checked project, the analysis of PVS-Studio is launched either through the PVS-Studio_Cmd.exe (for MSBuild projects) utility, or using the utility for monitoring the calls of the compiler - CLMonitor.exe \ Standalone.exe (for any build system). Further, one of these utilities will first run the preprocessor (cl.exe, clang.exe for Visual C++ projects, for the rest – the same process that was used for compilation) for each checked file, and then - the C++ analyzer PVS-Studio.exe.
Setting the value of 'ThreadCount' option to more than '16' (or more than a number of processor cores, if processor possesses more than 16 cores) is available only in PVS-Studio Enterprise license. You can request the trial Enterprise license here.
These processes run concurrently, depending on the 'PVS-Studio|Options...|Common AnalyzerSettings|ThreadCount' setting. By increasing the number of concurrently scanned files, with the help of this setting, and distributing the execution of these processes to remote machines, you can significantly (several times) reduce the total analysis time.
An example of Incredibuild configuration
Here is an example of speeding up the PVS-Studio analysis by using the Incredibuild distributed system. For this we'll need an IBConsole management utility. We will use the Automatic Interception Interface, which allows remotely executing any process, intercepted by this system. Launching of the IBConsole utility for distributed analysis using PVS-Studio will look as follows:
ibconsole /command=analyze.bat /profile=profile.xmlThe analyze.bat file must contain a launch command for the analyzer, PVS-Studio_Cmd.exe or CLMonitor.exe, with all the necessary parameters for them (more detailed information about this can be found in the relevant sections of analyzer documentation). Profile.xml file contains the configuration for the Automatic Interception Interface. Here is an example of such a configuration for the analysis of the MSBuild project using PVS-Studio_Cmd.exe:
<?xml version="1.0" encoding="UTF-8" standalone="no" ?>
<Profile FormatVersion="1">
<Tools>
<Tool Filename="PVS-Studio_Cmd" AllowIntercept="true" />
<Tool Filename="cl" AllowRemote="true" />
<Tool Filename="clang" AllowRemote="true" />
<Tool Filename="PVS-Studio" AllowRemote="true" />
</Tools>
</Profile>Let's see, what each record in this file means. We can see that the AllowIntercept attribute with the 'true' value is specified for PVS-Studio_Cmd. This means that a process with such a name will not be executed itself in a distributed manner, but the system of automatic interception will track the child processes generated by this process.
For the preprocessor cl and clang processes and the C/C++ analyzer PVS-Studio process, the AllowRemote attribute is specified. This means that processes with such names, after being intercepted from the AllowIntercept processes, will be potentially executed on other (remote) Incredibuild agents.
Before running IBConsole, you must specify the 'PVS-Studio|Options...|Common AnalyzerSettings|ThreadCount' setting, according to the total number of cores available on all of Incredibuild agents. If it's not done, there will be no effect from using Incredibuild!
Note: during the analysis of Visual C++ projects, PVS-Studio uses clang.exe supplied in the PVS-Studio distribution for preprocessing C/C++ files before the analysis, instead of the cl.exe preprocessor. This is done to speed up the preprocessing, as clang is doing it faster than cl. Some older versions of Incredibuild performs a distributed launch of the clang.exe preprocessor not quite correctly, resulting in errors of preprocessing. Therefore, clang should not be specified in the IBConsole configuration file, if your version of Incredibuild handles clang incorrectly.
The used type of preprocessor during the analysis is specified with the 'PVS-Studio|Options...|Common AnalyzerSettings|Preprocessor' setting. If you choose the 'VisualCpp' value for this setting, PVS-Studio will use only cl.exe for preprocessing, which will be executed in a distributed manner, but slower than clang, which cannot be executed in a distributed manner. You should choose this setting depending on the type of the project and the number of agents available to analyze - when having a large numbers of agents, the choice of VisualCpp will be reasonable. With a small numbers of agents, local preprocessing with clang might prove to be faster.
Combined use of distributed analysis and compiler call monitoring system
It's possible to use the compiler monitoring system (CLMonitor.exe and Compiler Monitoring UI) together with Incredibuild during distributed analysis of a project. This combination significantly speeds up the analysis. However, this approach has its own peculiarities. Compiler monitoring systems cannot monitor remote compiler calls. The CLMonitor.exe utility supports tracing only for local builds.
Compiler monitoring analysis started by Incredibuild may be incorrect because compiler monitoring systems do not detect compiler calls on other machines. But you can use the Incredibuild tool to parallelize analysis of a dump obtained by the compiler monitoring systems. For this, you need to get the compiler launch dump.
If you use CLMonitor.exe, follow the steps below to get the compilation monitoring dump:
- launch the compiler monitoring:
- CLMonitor.exe monitor;
- build the project without Incredibuild. As a result, CLMonitor.exe monitors the compiler launch;
- save compilation monitoring dump:
- CLMonitor.exe saveDump -d c:\monitoring.zip
If you use Compiler Monitoring UI, the following procedure will help to save the compilation monitoring dump after the launch of Compiler Monitoring UI:
- launch the compiler monitoring through Tools -> Analyze Your Files...:

- click Start Monitoring;
- tick "Save compilation monitoring dump before analysis" in the monitoring progress box:

- build the project;
- stop monitoring;
- save the dump file:

Similarly to the previous example, use ibconsole for distributed dump analysis:
ibconsole /command=analyze.bat /profile=profile.xmlHowever, this time, in the analyze.bat file, instead of PVS-Studio_Cmd.exe, call CLMonitor.exe in the file dump analysis mode:
CLMonitor.exe analyzeFromDump -l "c:\ptest.plog" -d "c:\monitoring.zip"In the case of Compiler Monitoring UI we must run Standalone.exe instead of PVS-Studio_Cmd.exe:
Standalone.exeIn the settings file, replace PVS-Studio_Cmd with CLMonitor / Standalone and cl. If necessary, replace it with the type of preprocessor that is used during build (gcc, clang). Example:
<?xml version="1.0" encoding="UTF-8" standalone="no" ?>
<Profile FormatVersion="1">
<Tools>
<Tool Filename="CLMonitor" AllowIntercept="true" />
<Tool Filename="gcc" AllowRemote="true" />
<Tool Filename="PVS-Studio" AllowRemote="true" />
</Tools>
</Profile>Also, remember to specify the 'PVS-Studio|Options...|Common AnalyzerSettings|ThreadCount' setting, according to the total number of cores available for all of Incredibuild agents. If you skip this step, there will be no effect from using Incredibuild!
When specifying the ThreadCount settings, remember that the analysis coordinator machine (i.e. the one that runs the PVS-Studio_Cmd/CLMonitor/Standalone) handles the results from all PVS-Studio.exe processes. This job cannot be distributed. Therefore, especially if ThreadCount is set to a very high value (more than 50 processes simultaneously), it is worth thinking about how to "ease" the analysis tasks (i.e. processes of the analyzer and preprocessor) from the coordinator machine. This can be done by using the '/AvoidLocal' IBConsole flag, or in the settings of local Incredibuild agent on the coordinator machine.
If you are using Compiler Monitoring UI, do the following to run the analysis of the compilation monitoring dump file:
- select Tools -> Analyze Your Files...
- specify the path to the dump file before the analysis:

The result of the distributed dump analysis will be either the :\ptest.plog file (if you use CLMonitor.exe) or a report with the analyzer's warnings in the Compiler Monitoring UI table:

You can use the following menu items to save messages from the report in various formats:
- File -> Save PVS-Studio Log;
- File -> Save PVS-Studio Log As...;
- File -> Save Filtered Log As HTML....
During this type of analysis, the Incredibuild tool distributes the PVS-Studio.exe processes among all machines involved and CLMonitor.exe is not parallelized in this case.
This type of analysis is more beneficial for large projects – where contents often changes, and structure stays the same (for example, developers rarely add, delete or rename files in such projects).
Installing and updating PVS-Studio on Linux
PVS-Studio is distributed as Deb/Rpm packages or an archive. Using the installation from the repository, you will be able to receive updates about the release of a new version of the program.
The distribution kit includes the following files:
- pvs-studio - the kernel of the analyzer;
- pvs-studio-analyzer - a utility for checking projects without integration;
- plog-converter - a utility for converting the analyzer report to different formats;
You can install the analyzer using the following methods:
Install from repositories
For debian-based systems:
Until Debian 11 and Ubuntu 22.04:
wget -q -O - https://cdn.pvs-studio.com/etc/pubkey.txt | \
sudo apt-key add -
sudo wget -O /etc/apt/sources.list.d/viva64.list \
https://cdn.pvs-studio.com/etc/viva64.list
sudo apt-get update
sudo apt-get install pvs-studioAfter Debian 11 and Ubuntu 22.04:
wget -qO- https://cdn.pvs-studio.com/etc/pubkey.txt | \
sudo gpg --dearmor -o /etc/apt/trusted.gpg.d/viva64.gpg
sudo wget -O /etc/apt/sources.list.d/viva64.list \
https://cdn.pvs-studio.com/etc/viva64.list
sudo apt-get update
sudo apt-get install pvs-studioFor yum-based systems:
wget -O /etc/yum.repos.d/viva64.repo \
https://cdn.pvs-studio.com/etc/viva64.repo
yum update
yum install pvs-studioFor zypper-based systems:
wget -q -O /tmp/viva64.key https://cdn.pvs-studio.com/etc/pubkey.txt
sudo rpm --import /tmp/viva64.key
sudo zypper ar -f https://cdn.pvs-studio.com/rpm viva64
sudo zypper update
sudo zypper install pvs-studioManual installation
You can download PVS-Studio for Linux here.
You also need to install the strace utility 4.11 or later for compilation tracing mode to work.
Deb package
sudo gdebi pvs-studio-VERSION.debor
sudo dpkg -i pvs-studio-VERSION.deb
sudo apt-get -f installRpm package
$ sudo dnf install pvs-studio-VERSION.rpmor
sudo zypper install pvs-studio-VERSION.rpmor
sudo yum install pvs-studio-VERSION.rpmor
sudo rpm -i pvs-studio-VERSION.rpmArchive
tar -xzf pvs-studio-VERSION.tgz
sudo ./install.shRunning the analyzer
After a successful analyzer installation on your computer, to check a project follow the instructions on this page: "How to run PVS-Studio on Linux".
Installing and updating PVS-Studio on macOS
PVS-Studio is distributed as a graphical installer, archive or via the Homebrew repository. Using installation from a repository, you can get analyzer updates automatically. The distribution kit includes the following files:
- pvs-studio - the kernel of the analyzer;
- pvs-studio-analyzer - a utility for checking projects without integration;
- plog-converter - a utility for converting the analyzer report to different formats;
You can install the analyzer using the following methods:
Installation from Homebrew
Installation:
brew install viva64/pvs-studio/pvs-studioUpdate:
brew upgrade pvs-studioManual installation
Installer:
Run the .pkg file and follow the instructions of the installer:

Archive
Unpack the archive and place the executables in the directory, available in PATH.
tar -xzf pvs-studio-VERSION.tgzRunning the analyzer
After a successful analyzer installation on your computer, to check a project follow the instructions on this page: "How to run PVS-Studio on Linux and macOS".
How to display the analyzer's most interesting warnings
PVS-Studio analyzer allows a user to easily check out the most interesting warnings. This mechanism helps you start working with the report faster and easier. These warnings are based on our most noteworthy and "dangerous" diagnostic rules of the analyzer. The Best Warnings mode is most likely to report real errors.
Mainly, this mechanism helps learn more about the analyzer's features.
The Best Warnings mode does not substitute work with the analyzer full report. The full report may contain messages about potential errors, which also require attention.
How it works
The most interesting warnings are selected according to a number of criteria called weights. Each diagnostic has an initial weight. This weight reflects the probability of the diagnostic to detect a significant (meaningful) error. We assigned the weights to the diagnostics in accordance with our extensive experience with static analysis and statistics we gathered when analyzing various projects. When we adjust these weights, we take into account the following:
- the warning level;
- the file name and directory name. We look for keywords indicating that the analyzer issued a warning for tests;
- how frequent the same diagnostics appear in the project. It helps reduce the number of monotonous warning types;
- the number of warnings issued per line of the same file.
As a result, we get a list of "warning-weight" pairs. From this list, the mechanism filters no more than ten "heavy" warnings.
Visual Studio (C, C++, and C#)
The PVS-Studio plugin for Microsoft Visual Studio is conveniently integrated into the IDE. This plugin allows you to run the analysis of the entire solution, specific projects, or individual files. It also supports incremental analysis.
You can review the most interesting warnings in the Visual Studio's special window that provides analysis results:

This window appears automatically, for example, when you run a project analysis. If you need to display it manually, then use the PVS-Studio extension settings:

The window itself allows you to navigate through the warnings that the analyzer found. It also allows you to navigate to the code that needs to be fixed. The window also provides advanced filtering and sorting capabilities for you to analyze the results most efficiently. Additionally, you can quickly go to the documentation of selected diagnostics.
To display the best warnings, click on the 'Best' button.
As a result, the window shows only the Best Warnings. If you click again, the window shows all the errors that the analyzer found.
IntelliJ IDEA, Rider and CLion
Starting with PVS-Studio 7.22, the Best Warning mechanism is supported by Rider, IntelliJ IDEA, and CLion plugins. To check out the analyzer's most interesting warnings, click on the 'Best' button, as shown in the screenshot below:

After that, the table with the results of the analysis will show maximum of ten of the most critical warnings of the analyzer. If you click again, the window will show all the errors that the analyzer found.
Additional links
If you are new user, we also recommend reading the following articles:
- Suppression of false positive warnings
- Tips on speeding up PVS-Studio
- PVS-Studio: troubleshooting
- Additional diagnostics configuration
- Incremental analysis mode in PVS-Studio
Baselining analysis results (suppressing warnings for existing code)
- Principle of operation
- Windows: Visual Studio (C, C++ and C# analysis)
- Windows: C and C++ Compiler Monitoring UI
- Projects in C and C++ on Linux/macOS
- Java projects under Windows/Linux/macOS
- Suppression of analyzer warnings in Unreal Engine projects
- Suppression of analyzer warnings in the PVS-Studio plugins for CLion and Rider
- Version control system
- Suppression of analyzer warnings in SonarQube
- Shared use of the baselining features for projects in CI instruments and IDEs
- What can I do after suppressing all warnings?
- Additional links
Baselining analysis results can be useful in the following scenarios:
- PVS-Studio is introduced in a project for the first time and issues a large number of warnings for the entire code. The development manager decides to initiate regular usage of the analyzer only for newly written code and to return to warnings on the current code later.
- PVS-Studio is used in the project on a regular basis. During the development process false positives get in the analyzer report, and you want to suppress them without modifying source code files.
In such cases, analyzer warnings can be suppressed in a special way so that they won't get into newly generated reports. This mode doesn't require modification of the project's source files.
The analyzer supports the analysis of source code in C, C++, C# and Java programming languages. The analysis can be performed under Windows, Linux and macOS. In this regard, ways of warning suppression might differ depending on the used platform and projects' type. For this reason, please go to the section that suits you and follow the given instruction.
Principle of operation
Mechanism of warning suppression is based on using special files, which are added next to the project (or in any specified place). These files contain messages, tagged for this project as "unnecessary". We should note that modification of the source file that contains the tagged messages, and, in particular, line shift, will not lead to the re-emergence of these messages. However, the edit of the line containing this analyzer message can lead to its repeated occurrence, since this message has already become "new".
A warning is considered suppressed if the suppress file contains an entry with elements that match the corresponding warning fields in the analyzer report (there are 6 in total):
- the hash code of the previous line;
- the hash code of the current line (indicated by the analyzer warning);
- the hash code of the next line;
- the name of the file (case-sensitive);
- the unique diagnostic code (VXXX or VXXXX, where X is a number character from '0' to '9');
- the message from the analyzer warning.
The warning message is standardized when it is written to the suppress file, i.e:
- the consecutive numeric characters (0 – 9) are replaced by a single underscore character ('_');
- the consecutive space characters are replaced by a single space character.
When calculating hash codes, not the entire line is processed but only characters up to the first false-positive comment (a line comment that matches one of the following patterns: //-VXXXX, //-VXXX, //-vXXXXXX, or //-vXXX, where X is a number from '0' to '9'). Tab and space characters are ignored.
The following changes to the source code cancel warning suppression.
- Changing the line indicated by the analyzer warning and/or the previous/next line (tab and space characters are ignored).
- Changing the name of the file (case-sensitive) that contains the suppressed warning.
- Changing the analyzer message. The analyzer message often shows the code snippet from the line for which the warning has been issued. In this case, if you change the code in the line, the analyzer message changes as well. Note: the analyzer developers can also change the analyzer message. However, this is rarely the case because we try not to change the analyzer warning messages.
- Changing the unique diagnostic ID (VXXX or VXXXX, where X is a number between '0' and '9').
Changes to the source code that do not cancel warning suppression.
- Shifting three adjacent lines (the line to which the analyzer issued a warning, as well as the previous and next lines) to any number of lines up or down.
- Adding (or deleting) any number of tab characters or spaces to the line indicated by the analyzer warning or to its adjacent lines.
- Adding false-positive comments to the end of the line (deleting from the end of the line) indicated by the analyzer warning and/or the previous/next line (a line comment that matches one of the following patterns: //-VXXXX, //-VXXX, //-vXXXXXX, or //-vXXX, where X is a number from '0' to '9'). Several false-positive comments may be added at the end of the line.
Windows: Visual Studio (C, C++ and C# analysis)
For Microsoft Visual Studio, you can use the PVS-Studio plugin, which conveniently integrates in IDE. It allows you to check the entire solution, specific projects or files, and it also supports incremental analysis.
Suppressing analyzer warnings in the plugin for Visual Studio
In PVS-Studio menu, the Suppress Messages section opens a window for working with suppressed analyzer warnings.

In that window, several actions are available:
- Suppress All – suppresses all of the analyzer's warnings;
- Suppress Filtered - suppresses only the warnings that are currently displayed in the PVS-Studio results window, excepting the messages that are filtered out;
- Un-Suppress from Selected - restores suppressed warnings for selected projects;
- Display Suppressed Messages - displays suppressed analyzer warnings in the PVS-Studio Output Window together with the rest of the warnings. In this mode, you can return to fixing previously suppressed warnings. Such messages will be marked in a special way (crossed out) to avoid confusing them with the un-suppressed ones.
A special window can be used to view analysis results in Visual Studio.
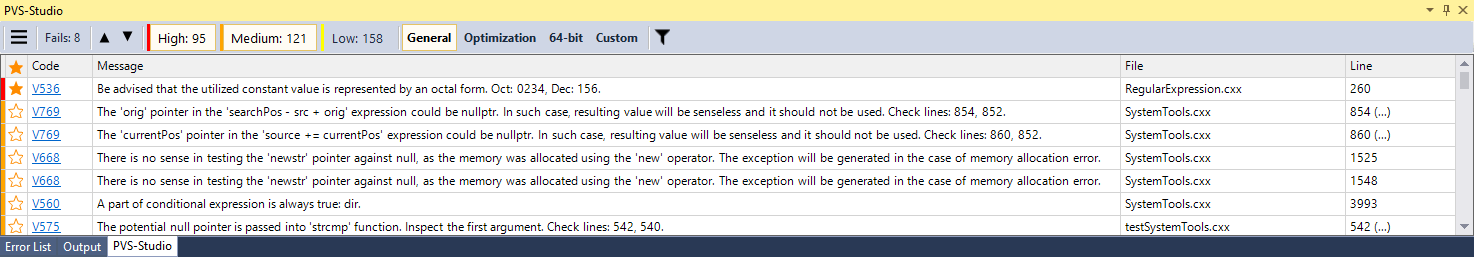
This window allows navigating along analyzer warnings and jump to the code to fix them. The PVS-Studio window provides a wide range of options for filtering and sorting the results. It is also possible to quickly navigate to the documentation of the selected diagnostic.
Additional actions for each message are available in the context menu by clicking the right mouse button on the message.

To add multiple selected messages to all suppress files related to the warnings, use the menu item "Add selected messages to all suppression files". Besides this you can also use the menu item "Add selected messages to primary suppression files". This allows you to suppress multiple selected warnings only to the primary suppress files related to the selected warnings.

'Primary' is a mark for suppress files that allows you to prioritize the files (that have this mark) when suppressing warnings. By default, when using normal suppress files, selected warnings in all suppress files of a project/ solution are suppressed. If you want to suppress new warnings only in a specific suppress file, but you have other suppress files with previously suppressed warnings that you do not want to modify, then mark the suppress file for new warnings as 'Primary'.
The 'Primary' mark helps you to separate the first warnings that were suppressed when PVS-Studio was just introduced into the project from the warnings that were suppressed during further regular use of the analyzer. In this case, the user usually needs to further handle the initially suppressed warnings (as they are usually not carefully examined). The warnings issued as a result of regular use of the analyzer are considered to be have already been viewed by the user.
Primary suppress files in drop-down lists are marked with additional text in parentheses:

Adding a Primary suppress file to a project or solution is the same as adding a normal suppress file via the "New item..." on the project/solution context menu:

It is also possible to mark all suppress files as primary when suppressing all messages ("Suppress All") or only filtered messages ("Suppress Filtered"). To do this, click the check box in the window that appears during the message suppression:

To unsuppress multiple selected messages, use the menu item "Remove selected messages from all suppression files". This item appears in the context menu of the PVS-Studio Output Window if more than one messages is selected and at least one of them is suppressed:

When one message is selected, the context menu allows you to not only suppress/unsuppress, but also to move the message. When you move the message, it is removed from all suppress files and added to the selected suppress files:

Also, when you select one message in the PVS-Studio Output Window, the drop-down lists of suppress files appear when you hover your mouse over menu items related with suppress files:

In these drop-down lists you can select one suppress file, all suppress files or all primary suppress files from the list. The selected suppress files will be used when executing the suppress/unsuppress, move command.
You can scroll through the list of suppress files by using the interface items at the top and bottom of the list with arrows, or by using the "Up" and "Down" arrow keys. You can select an item from the list with the "Enter" key or the left mouse button.
Working with suppressed warnings in the plugin for Visual Studio
You can enable the display of suppressed messages from the submenu of the PVS-Studio Output Window:

It is also possible to enable the display of suppressed messages in the window of the file suppression "Extensions -> PVS-Studio -> Suppress Messages...":

In addition, a list of displayed suppress files appears in the submenu of the PVS-Studio output window when suppressed warnings are displayed. By ticking or unticking the boxes in this list, you can enable or disable the display of suppressed messages from specific suppress files:
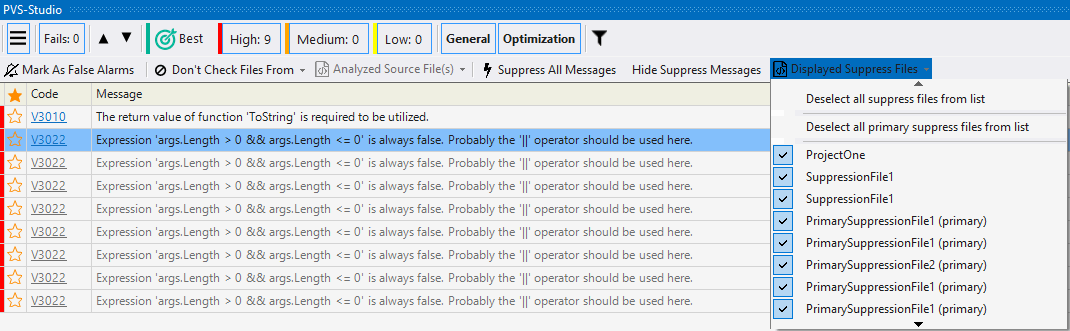
The changes of displaying of suppressed messages from chosen suppress files is applied when the list of displayed suppress closes.
You can scroll through the list of displayed suppress files by using the interface items at the top and bottom of the list with arrows, or by using the "Up" and "Down" arrow keys. You can select an item from the list with the "Enter" key or the left mouse button.
Adding suppress files to MSBuild \ Visual Studio projects
You can add a suppress file to a project as an uncompiled\text file using the 'Add New Item...' or 'Add Existing Item...' menu commands. This enables you to keep suppress files and project files in different directories. You can add multiple suppress files to the project.
Adding suppress files to Visual Studio solution
You can add a suppress file to the solution via the 'Solution Explorer' using the 'Add New Item...' or 'Add Existing Item...' menu command. As with projects, adding multiple suppress files is also supported for solutions.
Suppress file of the solution level allows suppressing warnings in all projects of the corresponding solution. If projects have separate suppress files, the analyzer will take into account both warnings suppressed in a suppress file of the solution, and in a suppress file of a project.
Suppressing of analyzer warnings from a command line
Suppressing all analyzer warnings
Warnings suppression can also be used right from a command line. The command-line PVS-Studio_Cmd.exe utility automatically catches up existing suppress files when running an analysis. It can also be used to suppress previously generated analyzer warnings saved in a plog file. To suppress warnings from an existing plog file, run PVS-Studio_Cmd.exe with the '‑‑suppressAll' flag. For example (in one line):
"C:\Program Files (x86)\PVS-Studio\PVS-Studio_Cmd.exe"
-t "Solution.sln" -o "results.plog" --suppressAll SuppressOnlyExecution of this command will generate suppress files for all of the projects in the Solution.sln for which warnings in results.plog have been generated.
The '‑‑suppressAll' flag supports 5 modes:
- AnalyzeAndSuppress will first perform the analysis, write an output file (.plog, .json), and only after that it will suppress all the warnings from it. In this mode, you'll see only new analyzer warnings on every analysis run thereafter (warnings from previous runs will be suppressed).
- SuppressOnly will suppress all warnings for the given analyzer report without restarting the analysis.
You can also use the -u argument to specify the path to the suppress file. This suppress file will be created if it does not already exist. All analyzer warnings will be added to this suppress file.
Suppressing certain analyzer messages from the command line
PVS-Studio-Cmd.exe has the "suppression" operating mode. It is designed to:
- filter (FilterFromSuppress) warnings from the analyzer's report;
- filter suppressed warnings in suppress files (UpdateSuppressFiles);
- calculate statistics for suppress files (CountSuppressedMessages);
- suppress and unsuppress messages from the analyzer's report.
In this mode, like in the main PVS-Studio-Cmd.exe mode, you can pass paths to suppress files using -u flag. These suppress files will be used on the level with suppress files of projects and solutions.
In the "suppression" mode in PVS-Studio_Cmd.exe, you can specify the operating mode via the -m flag:
- CreateEmptySuppressFiles creates empty suppress files next to project files (.csproj/.vcxproj) by the specified pattern of the file name (‑‑suppressFilePattern flag). If the flag of the pattern is omitted, empty suppress files are created with the project name. This mode takes into account the flag marking suppress files with the primary tag (‑‑markAsPrimary).
- Suppress allows suppression of individual warnings from the analyzer's report file (‑‑analyzerReport). The suppressed warnings from the analyzer report are selected using filters: groups (‑‑groups), diagnostic codes (‑‑errorCodes), paths to source code directories or paths to source code files (you may specify just source code file names). The order in which the filters are applied is: groups, diagnostic codes, paths. If no filter is specified, all warnings from the passed analyzer report (‑‑analyzerReport) are suppressed. If a suppress file name pattern (‑‑suppressFilePattern) is specified, messages are only suppressed into suppress files whose names match the specified suppress file name pattern (suppress file will be created if it does not exist). This mode takes into account the flag marking suppress files with the primary tag (‑‑markAsPrimary).
- UnSuppress mode unsuppresses warnings from the passed analyzer report. UnSuppress is similar to Suppress mode in terms of the flags used, except for the ‑‑markAsPrimary flag. It is not used in this mode;
- FilterFromSuppress filters the messages in the existing report file (.plog, .json, or unparsed output of the C++ core) without running the analysis. This mode filters the messages using suppress files located next to project/solution files. Another option: pass the path to the suppress files using the –useSuppressFile (-u) flag. The file with results is saved next to the report file passed. The file is named with postfix '_filtered'.
- CountSuppressedMessages calculates the number of suppressed warnings in all suppress files. This mode can also calculate the number of relevant warnings in suppress files. If you pass the full report file (via the ‑‑analyzerReport flag), you can see how many warnings in the suppress base are still relevant. You can also learn statistics for each suppress file if you run this mode with the '-r' flag.
- UpdateSuppressFiles updates suppress files and deletes the warnings that are not included in the report file passed. Please note that this mode requires a full report containing suppressed warnings. A full report is created each time the analysis is started if there are suppressed warnings. The full report file is named "*_WithSuppressedMessages.*" and is located next to the main report file. If you run this mode with a report file that doesn't contain suppressed warnings, all suppress files will be cleared.
The CreateEmptySuppressFiles, Suppress, and UnSuppress modes will only use suppress files whose names match the suppress file name pattern (flag -P). This pattern has a variable %projName% which is expanded to the project name.
Marking suppress files as primary (flag -M) only applies to CreateEmptySuppressFiles and Suppress modes.
In Suppress and UnSuppress modes it is possible to specify filters for warnings from the analyzer report via the filter flags:
- ‑‑groups (-g): the filter of warnings from the analyzer report (-R) by diagnostic groups (GA, 64, OP, CS, MISRA, AUTOSAR, OWASP) with warning certainty level (1-High, 2-Medium, 3-Low). Example: GA:1,2,3|OWASP|64:2;
- ‑‑errorCodes (-E): the filter of warnings from the analyzer report (-R) by the analyzer diagnostic codes. Example: V501,V1001,V3001;
- ‑‑files (-f): the filter of warnings from the analyzer report (-R) by absolute/relative paths to directories with source code files, by paths to source code files or by source code file names. Additionally, for each path, it is possible to specify the number of the line to which the message was issued. Example: ‑‑files absolute/path/directory*3,8,11|relative/path/file*1|fileName.
Example of command to run PVS-Studio_Cmd.exe in suppression mode:
"C:\Program Files (x86)\PVS-Studio\PVS-Studio_Cmd.exe" suppression
-t "Solution.sln" -R "results.plog" --mode Suppress
-g GA:1,2,3|OWASP:2|64 -E V501,V1001,V3001
-f filename*11,54|absolute/path/filename*1|relative/path/to/directory
-P Prefix_%projName%_Postifx -MWindows: C and C++ Compiler Monitoring UI
PVS-Studio on Windows can be used not only for MSBuild \ Visual Studio projects. Using compiler monitoring system, you can run static analysis for all types of projects that use one of the compilers supported by PVS-Studio C++.
When running the analysis after build monitoring, using the command
clmonitor.exe analyze --useSuppressFile %PathToSuppressFile%you can pass a path to suppress file that will be used during the analysis, via the additional '‑‑useSuppressFile' (-u) flag.
Besides the command line CLMonitor.exe tool, you can also use compiler monitoring through the C and C++ Compiler Monitoring UI tool. This tool allows you to check code regardless of the used compiler or build system, and then lets you work with the analysis results by providing a user interface similar to the PVS-Studio plugin for Visual Studio.
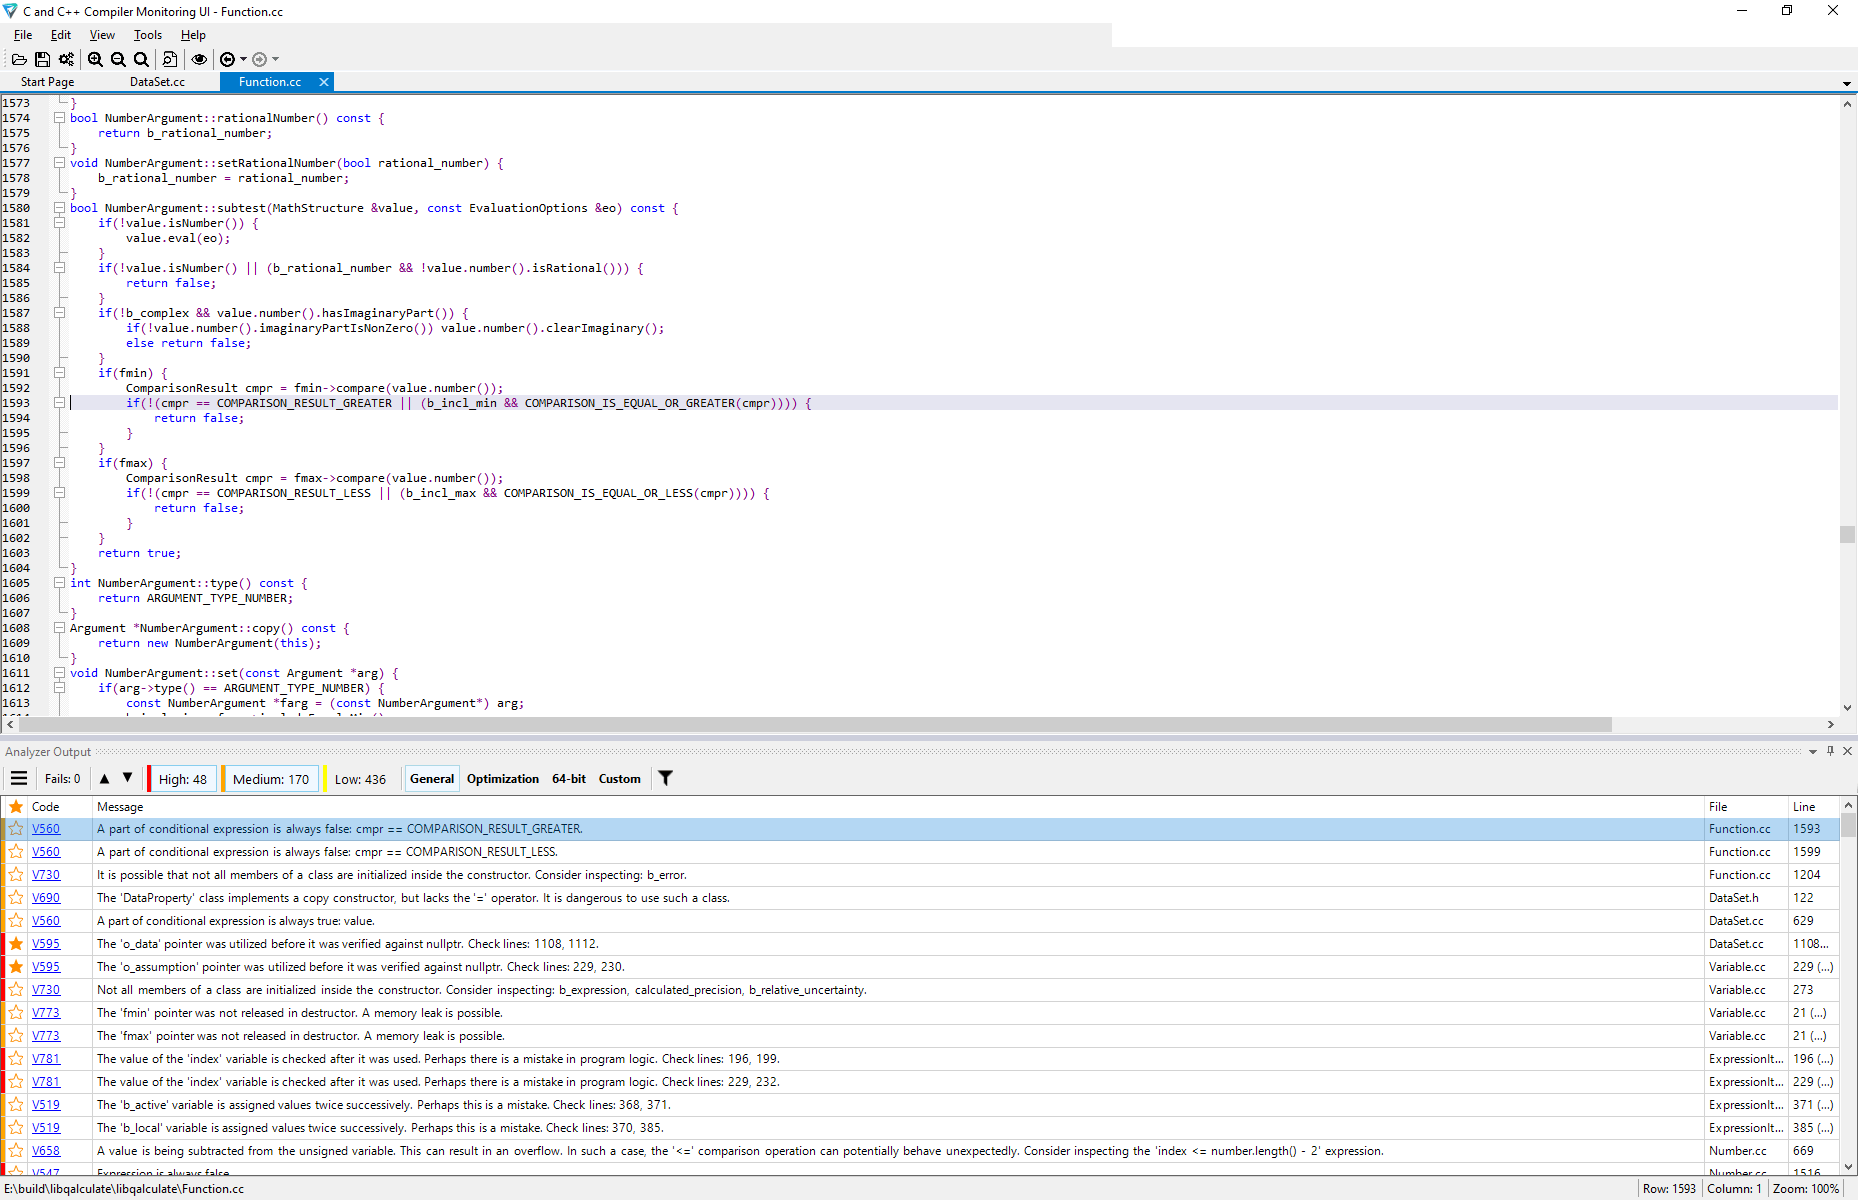
However, if you have a project which can be opened in Visual Studio, we recommend using the PVS-Studio plugin for Visual Studio to view the analysis results. The reason for it is that capabilities of a built-in code editor in Compiler Monitoring UI are far more limited than the code editor of Visual Studio. To open analysis report in Visual Studio, you can save the analyzer report in Compiler Monitoring UI, then reopen it.
The menu for running the analysis and suppressing warnings looks as follows.

After clicking "Analyze Your Files" menu item, you will see the "Compiler Monitoring (C and C++)" window.

To filter analyzer warnings, you need to specify a file with suppressed warnings before starting the analysis. You can create and maintain such file through the "Message Suppression..." menu, which is the same as the one presented in the section about Visual Studio. After the analysis is finished, only new errors will be shown in the PVS-Studio output window. Without specifying the file, the analyzer will show all the results.
Projects in C and C++ on Linux/macOS
Under Linux and macOS, the commands for suppression and filtration of analyzer warnings can only be performed from the command line. If necessary, this process can be automated on a server that performs an automated analyzer launch. There are several ways of using this mechanism, depending on the way of analyzer integration.
Analysis using pvs-studio-analyzer utility
To suppress all of the analyzer's warnings (first time and in subsequent cases), you need to execute the command:
pvs-studio-analyzer suppress /path/to/report.logIf you want to suppress a warning for a specific file, use the ‑‑file(-f) flag:
pvs-studio-analyzer suppress -f test.c /path/to/report.logIn addition to the file itself, you can explicitly specify the line number to suppress:
pvs-studio-analyzer suppress -f test.c:22 /path/to/report.logThis entry suppresses all warnings that are located on line 22 of the 'test.c' file.
This flag can be specified repeatedly, thus suppressing warnings in several files at once.
In addition to explicit file specification, there is a mechanism for suppressing specific diagnostics:
pvs-studio-analyzer suppress -v512 /path/to/report.logThe ‑‑warning(-v) flag can also be specified repeatedly:
pvs-studio-analyzer suppress -v1040 -v512 /path/to/report.logThe above-mentioned ‑‑file and ‑‑warning flags can be combined to suppress warnings more precisely:
pvs-studio-analyzer suppress -f test.c:22 -v512 /path/to/report.logSo the above command will suppress all v512 diagnostic warnings on line 22 of the 'test.c' file.
Analysis of the project can be performed as always. At the same time, the suppressed warnings will be filtered out:
pvs-studio-analyzer analyze ... -o /path/to/report.log
plog-converter ...This way, the suppressed warnings will be saved in the current directory, in a file named suppress_file.suppress.json, which should be stored with the project. New suppressed warnings will be appended to this file. If there is a need to specify a different name or location of the file, then the commands above may be supplemented by specifying the path to the file with suppressed warnings.
Direct integration of the analyzer into the build system
Direct integration of the analyzer might look like this:
.cpp.o:
$(CXX) $(CFLAGS) $(DFLAGS) $(INCLUDES) $< -o $@
pvs-studio --cfg $(CFG_PATH) --source-file $< --language C++
--cl-params $(CFLAGS) $(DFLAGS) $(INCLUDES) $<In this integration mode, the C++ analyzer core is called directly, so the analyzer cannot perform analysis on the source files and filter them at the same time. So, filtration and warnings suppression would require additional commands.
To suppress all the warnings, you must run the command:
pvs-studio-analyzer suppress /path/to/report.logTo filter a new analysis log according to the previously generated suppression file, you will need to use the following commands:
pvs-studio-analyzer filter-suppressed /path/to/report.log
plog-converter ...The default name for the file with the suppressed warnings remains as suppress_file.suppress.json, and can be changed, if necessary.
Java projects under Windows/Linux/macOS
Warnings suppression in IntelliJ IDEA
You can use a special window to view analysis results in IntelliJ IDEA.

This window allows navigating along found warnings and jumping to the source code, to fix these warnings. PVS-Studio window provides a wide range of options for filtering and sorting the results. It is also possible to quickly navigate to the documentation of the selected analyzer rule.
Additional options of working with each warning are available in the context menu by clicking the right button on the warning itself. The command for suppressing a selected warning is also available here.

PVS-Studio plugin for IntelliJ IDEA also allows you to suppress all of the generated messages in one click.

By default, a suppression file is available at {projectPath}/.PVS-Studio/suppress_base.json, but you can change this path in the settings of the plugin.

Whichever suppression method you use, the suppressed warnings will not appear in the subsequent analysis reports.
Suppression of analyzer warnings in Gradle
To suppress all of the warnings, use this command:
./gradlew pvsSuppress "-Ppvsstudio.report=/path/to/report.json"
"-Ppvsstudio.output=/path/to/suppress_base.json"Suppression of analyzer warnings in Maven
To suppress all of the warnings, use this command:
mvn pvsstudio:pvsSuppress "-Dpvsstudio.report=/path/to/report.json"
"-Dpvsstudio.output=/path/to/suppress_base.json"Direct Integration of the Analyzer in the Build System
To suppress all of the warnings, use this command:
java -jar pvs-studio.jar --convert toSuppress
--src-convert "/path/to/report.json"
--dst-convert "/path/to/suppress_base.json"Suppression of analyzer warnings in Unreal Engine projects
You can read more about baselining in Unreal Engine projects in a separate section "Analysis of Unreal Engine projects".
Suppression of analyzer warnings in the PVS-Studio plugins for CLion and Rider
The PVS-Studio plugins for CLion and Rider now can suppress all analyzer warnings. To suppress warnings on the old code, use the 'Suppress All Messages' in the analyzer toolbar:
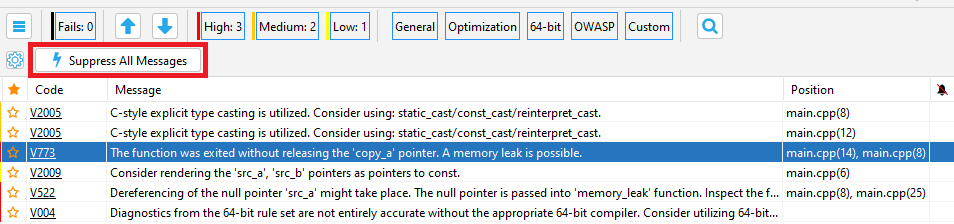
To suppress all warnings in the PVS-Studio plugin for Rider, go 'Tools -> PVS-Studio -> Suppress All Messages':

The suppression mechanism works via* .suppress files. After the analyzer runs the 'Suppress All Messages' command, the suppressed analyzer messages are added to this file. At the next start of the analysis, all messages from the * .suppress file will not be included in the analyzer report. The suppression system with * .suppress files is flexible enough and is able to "track" suppressed messages even if you modify and shift the code fragments that triggered the analyzer.
When you work with Rider, * .suppress files are created at the project level, next to each project file. However, they can be added to any project/solution (for example, use one * .suppress file for several projects or the whole solution). To return suppressed analyzer messages, you need to delete the * .suppress files for the corresponding projects and restart the analysis.
In CLion, suppressed messages are added to the suppress_file.suppress.json file. This file is written to the .PVS-Studio directory, which is located in the root directory of the CLion project. To return all analyzer messages, you must delete this file and restart the analysis.
Version control system
Starting with PVS-Studio 7.27, the inner content of suppress files is sorted. This is required for proper use of files in the version control system and to prevent merge conflicts.
Messages are sorted in the following order: source file name, diagnostic rule code, string hash, diagnostic rule description.
Suppression of analyzer warnings in SonarQube
SonarQube (formerly Sonar) is an open source platform designed for continuous inspection and measurement of code quality. SonarQube combines the results of the analysis to a single dashboard, keeping track of the history of previous analysis runs, which allows you to see the overall trend of software quality during development. An additional advantage is the ability to combine results of different analyzers.
So, after getting the analysis results from one or more analyzers, you should go to the list of warnings and click the "Bulk Change" button, which opens the following menu.

In this window, you can mark up all warnings of the analyzer as "won't fix" and further work only with new errors.
Shared use of the baselining features for projects in CI instruments and IDEs
You can quickly integrate PVS-Studio into a new project, configure its automatic daily check in CI and at the same time gradually deal with suppressed warnings in IDEs.
It looks like this:
- After integrating PVS-Studio into your project, you get the first report from the analyzer.
- Next, suppress all warnings via PVS-Studio_Cmd.exe in the SuppressOnly mode or via the PVS-Studio plugins for IDEs. As a result, you'll get a suppress file which will further be used to filter warnings from the analyzer reports.
- Commit this suppress file to a version control system or save in any way suitable for you.
- Next, configure a task in CI. This task runs the project analysis and filters warnings from the resulting report. The filter uses the previously obtained suppress file. PVS-Studio_Cmd.exe in the FilterFromSuppress mode filters the messages. After the task is completed, you get a report with warnings issued only for new or changed code.
- After that the report is sent to the team members via the BlameNotifier.exe utility;
- Each team member corrects the code based on the received report.
- Your team can also return to the suppressed messages and gradually fix the legacy code. This requires enabling the display of the suppressed warnings in the IDE. After a warning is processed, delete it from the suppress file and commit the change. Thus, this warning won't bother you when you use this suppress file to filter subsequent reports.
- Besides deleting, you can also add new warnings to the suppress file. Access this feature in the interface of the PVS-Studio plugin for Visual Studio or use PVS-Studio_Cmd.exe in SuppressOnly mode. Just specify the path to the previously created suppress file in the '-u' flag. This allows you to set warning processing aside for later (which I do not advise abusing), and configure the report so as to contain only the necessary warnings.
What can I do after suppressing all warnings?
Configure static analysis on the build server and developers' computers. Regularly correct new analyzer warnings and do not let them accumulate. It is also worth planning a review to correct suppressed warnings in the future.
Additional control over code quality can be achieved by sending results via mail. It is possible to send warnings to only those developers who had written erroneous code using BlameNotifier tool, which is included in PVS-Studio distribution.
For some users it may be convenient to view results in Jenkins or TeamCity using the PVS-Studio plugin, and send a link to such a page.
Additional links
This section describes all the possible ways of suppressing analyzer warnings at the moment. The collected material is based on the documentation for the PVS-Studio analyzer, but the details on that topic were considered more than in documentation. General information may not be very informative for new users, so you should check out the documentation below.
- Viewing analysis results with C and C++ Compiler Monitoring UI;
- How to run PVS-Studio on Linux and macOS
- Integrating PVS-Studio into the continuous integration process;
- Integration of PVS-Studio analysis results into SonarQube;
- Managing the analysis results (.plog file).
Handling the diagnostic messages list in Visual Studio
- View the analyzer's most interesting warnings
- Navigation and sorting
- Message filtering
- Quick jumps to individual messages
- Managing the Visual Studio Task List
While handling the large number of messages (and the first-time verification of large-scale projects, when filters have not been set yet and false positives haven't been marked, the number of generated messages can come close to tens of thousands), it is reasonable to use the navigational, searching and filtering mechanisms integrated into PVS-Studio output window.
View the analyzer's most interesting warnings
If you are new to the static analysis tool and would like to know what it can do, you can use the Best Warnings mechanism. This mechanism will show you the most important and reliable warnings.
To check out the analyzer's most interesting warnings, click on the 'Best' button, as shown in the screenshot below:
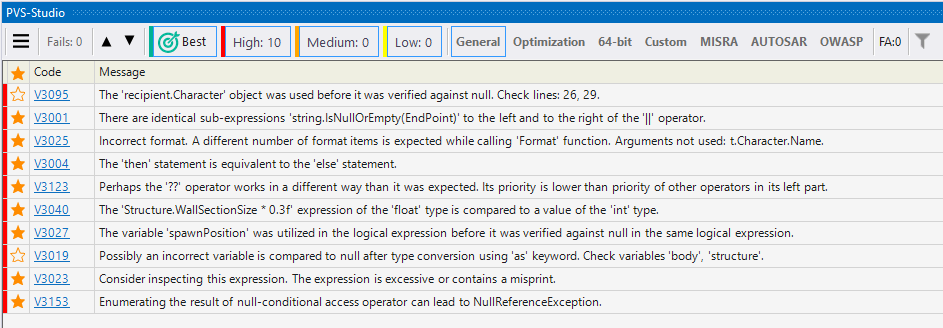
After that, the table with the results of the analysis will show maximum of ten of the most critical warnings of the analyzer.
Navigation and sorting
The main purpose of PVS-Studio output window is to simplify the analyzed project's source code navigation and reviewing of potentially dangerous fragments in it. Double-clicking any of the messages in the list will automatically open the file corresponding to this message in the code editor, will place the cursor on the desired line and highlight it. The quick navigation buttons (see figure 1) allow for an easy review of the potentially dangerous fragments in the source code without the need of constant IDE windows switching.
Figure 1 — Quick navigation buttons
To present the analysis results, PVS-Studio output window utilizes a virtual grid, which is capable of fast rendering and sorting of generated messages even for huge large-scale projects (virtual grid allows you to handle a list containing hundreds of thousands of messages without any considerable hits to performance). The far left grid column can be used to mark messages you deem interesting, for instance the ones you wish to review later. This column allows sorting as well, so it won't be a problem to locate all the messages marked this way. The "Show columns" context menu item can be used to configure the column display in the grid (figure 2):

Figure 2 — Configuring the output window grid
The grid supports multiline selection with standard Ctrl and Shift hotkeys, while the line selection persists even after the grid is resorted on any column. The "Copy selected messages to clipboard" context menu item (or Ctrl+C hotkey) allows you to copy the contents of all selected lines to a system clipboard.
Message filtering
PVS-Studio output window filtering mechanisms make it possible to quickly find and display either a single diagnostic message or the whole groups of these messages. The window's toolstrip contains several toggle buttons which can be used to turn the display of their corresponding message groups on or off (figure 3).
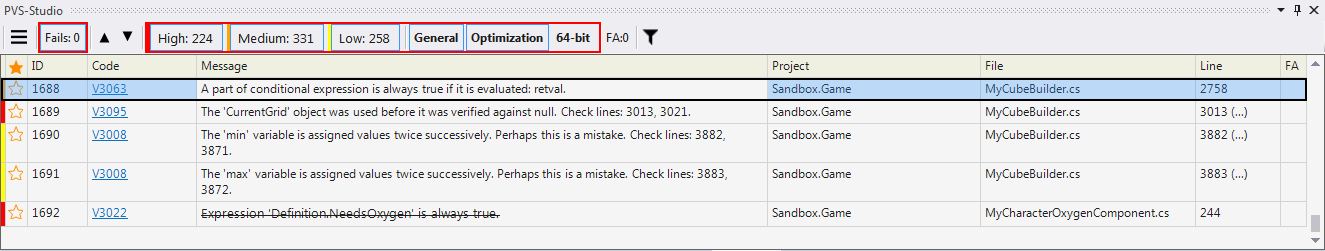
Figure 3 — Message filtration groups
All of these switches could be subdivided into 3 sets: filters corresponding to the message certainty, filters corresponding to type of message diagnostics rule set, and filters corresponding to False Alarm markings within the source code. Turning these filters off will momentarily hide all of their corresponding messages inside the output list.
Detailed description of the levels of certainty and sets of diagnostic rules is given in the documentation section "Getting acquainted with the PVS-Studio static code analyzer".
The quick filtering mechanism (quick filters) allows you to filter the analysis report by the keywords that you can specify. The quick filtering panel could be opened with the "Quick Filters" button on the output window's toolstrip (figure 4).
Figure 4— Quick filtering panel
Quick filtering allows the display of messages according to the filters by 3 keywords: by the message's code, by the message's text and by the file containing this message. For example, it is possible to display all the messages containing the word 'odd' from the 'command.cpp' file. Changes to the output list are applied momentarily after the keyword edit box loses focus. The 'Reset Filters' button will erase all of the currently applied filtering keywords.
All of the filtering mechanisms described above could be combined together, for example filtering the level of displayed messages and the file which should contain them at the same time, while simultaneously excluding all the messages marked as false positives.
Quick jumps to individual messages
In case there is a need to navigate to an individual message in the grid, it is possible to use the quick jumping dialog, which can be accessed through the "Navigate to ID..." context menu item (figure 5):

Figure 5 - evoking of the quick jumping dialog

Figure 6 - Navigate to ID dialog
Each of the messages in PVS-Studio output list possesses a unique identifier — the serial number under which this message was added into the grid, which itself is displayed in the ID column. The quick navigation dialog allows you to select and auto-focus the message with the designated ID, regardless of current grid's selection and sorting. You also may note that the IDs of the messages contained within the grid are not necessarily strictly sequential, as a fraction them could be hidden by the filtering mechanism, so navigation to such messages is impossible.
Managing the Visual Studio Task List
The large-scale projects are often developed by a distributed team, so a single person isn't able to judge every message static analyzer generates for false-positives, and even more so, is unable to correct the corresponding sections of the source code. In this case it makes sense to delegate such messages to a developer who is directly responsible for the code fragment in question.
PVS-Studio allows you to automatically generate the special TODO comment containing all the information required to analyze the code fragment marked by it, and to insert it into the source code. Such comment will immediately appear inside the Visual Studio Task List window (in Visual Studio 2010 the comments' parsing should be enabled in the settings: Tools->Options->Text Editor->C++->Formatting->Enumerate Comment Tasks->true) on condition that the ' Tools->Options->Environment->Task List->Tokens' list does contain the corresponding TODO token (it is present there by default). The comment could be inserted using the 'Add TODO comments for selected messages' command of the context menu (figure 7):

Figure 7 - Inserting the TODO comment
The TODO comment will be inserted into the line which is responsible for generation of analyzer's message and will contain the error's code, analyzer message itself and a link to the online documentation for this type of error. Such a comment could be easily located by anyone possessing an access to the sources thanks to the Visual Studio Task List. And with the help of the comment's text itself the potential issue could be detected and corrected even by the developer who does not have PVS-Studio installed or does not possess the analyzer's report for the full project (figure 8).
Figure 8 —Visual Studio Task List
The Task List Window could be accessed through the View->Other Windows->Task List menu. The TODO comments are displayed in the 'Comments' section of the window.
Suppression of false-positive warnings
- Watch, don't read (YouTube)
- Suppression of individual false positives (Mark as False Alarm)
- Manual false positive suppression
- How to Suppress false positives using the plugin context menu
- Suppressing false positives located within C/C++ macro statements (#define) and for other code fragments
- How to enable and disable certain diagnostics for a block of code
- Suppression of false positives through diagnostic configuration files (.pvsconfig)
- Other means of filtering messages in the PVS-Studio analyzer (Detectable Errors, Don't Check Files, Keyword Message Filtering)
- Mass suppression of analyzer messages (baselining)
- Possible issues
This section describes the analyzer's false positive suppression features. It provides ways to control both the separate analyzer messages under specific source code lines and whole groups of messages related, for example, to the use of C/C++ macros. The described method, by using comments of a special format, allows disabling individual analyzer rules or modifying text of analyzer's messages.
Features described in the following section are applicable to both C/C++ and C# PVS-Studio analyzers, if the contrary is not stated explicitly.
Watch, don't read (YouTube)
Suppression of individual false positives (Mark as False Alarm)
Any code analyzer always produces a lot of the so called "false alarms" besides helpful messages. These are situations when it is absolutely obvious to the programmer that the code does not have an error but it is not obvious to the analyzer. Such messages are called false alarms. Consider a sample of code:
obj.specialFunc(obj);The analyzer finds it suspicious that a method is called from an object, in which as an argument the same object is passed, so it will issue a warning V678 for this code. The programmer can also know that the use of the 'specialFunc' method in this way is conceivable, therefore, in this case the analyzer warning is a false positive. You can notify the analyzer that the warning V678 issued on this code is a false positive.
It can be done either manually or using context menu command. After marking a message as a false alarm, the message will disappear from error list. You may enable the display of messages marked as 'False Alarms' in PVS-Studio error list by changing the value of 'PVS-Studio -> Options... -> Specific Analyzer Settings -> DisplayFalseAlarms' settings option.
We don't recommend marking warning as false positives without preliminary review of corresponding code, because such approach contradicts static analysis ideology. Only a developer can determine if an error message is false or not.
Manual false positive suppression
'#pragma' directives are usually used in compilers to suppress individual warnings. Here's an example of code:
unsigned arraySize = n * sizeof(float);The compiler issues a warning:
warning C4267: 'initializing' : conversion from 'size_t' to 'unsigned int', possible loss of data x64Sample.cpp 151
This message can be suppressed by using the following construction:
#pragma warning (disable:4267)Or rather to suppress this specific warning, write the code as follows:
#pragma warning(push)
#pragma warning (disable:4267)
unsigned arraySize = n * sizeof(float);
#pragma warning(pop)The PVS-Studio analyzer uses special mark-up comments. For the same line of code, suppress the PVS-Studio warning as follows:
unsigned arraySize = n * sizeof(INT_PTR); //-V103The analyzer will now mark the V103 warning issued on this line as false. We chose this approach to increase the clarity of the end code. The point is that PVS-Studio can report problems in the middle of multiline expressions, such as here:
size_t n = 100;
for (unsigned i = 0;
i < n; // <= the analyzer will report the problem here
i++)
{
// ...
}To suppress this message when using a comment, it is enough to write:
size_t n = 100;
for (unsigned i = 0;
i < n; //-V104
i++)
{
// ...
}If you had to add a '#pragma' directive to this expression, the code would look much less clear.
Markup is saved in source code. This helps to modify code and be sure the information about error-ridden lines won't be lost.
If you need to suppress more than one warning on one line, you should add a separate comment for each of them. Here are some examples:
1) the suppression of warnings of different diagnostics:
struct Small { int *pointer; };
struct Big { int *array[20]; };
int Add(const Small &a, Big b) //-V835 //-V813
{
return *a.pointer + *b.array[10];
}2) the suppression of warnings of one diagnostic:
struct Small { int *pointer; };
int Add(const Small &a, const Small &b) //-V835 //-V835
{
return *a.pointer + *b.pointer;
}You can also use a separate base and store the information as follows: error code, file name, line number. This approach is separately implemented in PVS-Studio and called "Mass Suppression".
How to Suppress false positives using the plugin context menu
The user is provided with two commands available from the PVS-Studio's context menu (figure 1).

Figure 1 – Commands to work with the mechanism of false alarm suppression
Let's study the commands concerning False Alarm suppression:
1. Mark selected messages as False Alarms. You may choose one or more false alarms in the list (figure 2) and use this command to mark the corresponding code as safe.
Figure 2 - Choosing warnings before executing the "Mark selected messages as False Alarms" command
2. Remove False Alarm marks from selected messages. This command removes the comment that marks code as safe. This function might be helpful if, for instance, you were in a hurry and marked some code fragment as safe by mistake. Like in the previous case, you must choose the required messages from the list.
Suppressing false positives located within C/C++ macro statements (#define) and for other code fragments
It goes without saying that the analyzer can locate potential problems within macro statements (#define) and produce diagnostic messages accordingly. But at the same time these messages will be produced by analyzer at such positions where the macro is being used, i.e. where placement of macro's body into the code is actually happening. An example:
#define TEST_MACRO \
int a = 0; \
size_t b = 0; \
b = a;
void func1()
{
TEST_MACRO // V1001 here
}
void func2()
{
TEST_MACRO // V1001 here
}To suppress these messages, you can use the "Mark as False Alarm" command. Then the code containing suppression commands will look like this:
#define TEST_MACRO \
int a = 0; \
size_t b = 0; \
b = a;
void func1()
{
TEST_MACRO //-V1001
}
void func2()
{
TEST_MACRO //-V1001
}But in case the macro is being utilized quite frequently, marking it everywhere as False Alarm is quite inconvenient. It is possible to add a special marking to the code manually to make the analyzer mark the diagnostics inside this macro as False Alarms automatically. With this marking the code will look like this:
//-V:TEST_MACRO:1001
#define TEST_MACRO \
int a = 0; \
size_t b = 0; \
b = a;
void func1()
{
TEST_MACRO
}
void func2()
{
TEST_MACRO
}During the verification of such a code the messages concerning issues within macro will be immediately marked as False Alarms. Also, it is possible to select several diagnostics at once, separating them by comma:
//-V:TEST_MACRO:1001, 105, 201Please note that if the macro contains another nested macro inside it then the name of top level macro should be specified for automated marking.
#define NO_ERROR 0
#define VB_NODATA ((long)(77))
size_t stat;
#define CHECK_ERROR_STAT \
if( stat != NO_ERROR && stat != VB_NODATA ) \
return stat;
size_t testFunc()
{
{
CHECK_ERROR_STAT // #1
}
{
CHECK_ERROR_STAT // #2
}
return VB_NODATA; // #3
}In the example mentioned above the V126 diagnostics appears at three positions. To automatically mark it as False Alarm one should add the following code at positions #1 and #2:
//-V:CHECK_ERROR_STAT:126To make it work at #3 you should additionally specify this:
//-V:VB_NODATA:126Unfortunately to simply specify "to mark V126 inside VB_NODATA macro" and not to specify anything for CHECK_ERROR_STAT macro is impossible because of technical specifics of preprocessing mechanism.
Everything that is written in this section about macros is also true for any code fragment. For example, if you want to suppress all the warnings of the V103 diagnostic for the call of the function 'MyFunction', you should add such a string:
//-V:MyFunction:103How to enable and disable certain diagnostics for a block of code
This section is only relevant to C and C++ analyzer.
In some cases, you may need to disable a rule for a certain part of the code, not for the entire project. For example, you need to disable diagnostics for a specific file or part of a file. In doing so, other diagnostics must remain enabled. And the analyzer must continue to issue the suppressed warning for the rest of the code.
To do this, the tool provides the suppression mechanism that uses special 'pragma' directives. This method is similar to the one used in a compiler to manage warnings.
The analyzer uses the following directives:
- #pragma pvs(push) – saves current enable/disable diagnostic warnings;
- #pragma pvs(disable: XXXX, YYYY, ...) – disables diagnostics with numbers from the list;
- #pragma pvs(enable: XXXX, YYYY, ...) – enables diagnostics with numbers from the list;
- #pragma pvs(pop) – restores previously saved settings.
Just as with '#pragma warning', nesting is supported.
Example:
void func(int* p1, int* p2, int* p3)
{
if (!p1 || !p2 || !p3)
return;
#pragma pvs(push)
#pragma pvs(disable: 547)
if (p1) // V547 off
do_something();
#pragma pvs(push)
#pragma pvs(enable: 547)
if (p2) // V547 Expression 'p2' is always true.
do_something_else();
#pragma pvs(pop)
if (p3) // V547 off
do_other();
#pragma pvs(pop)
}Note. Compilers ignore unknown 'pragma' directives. Depending on settings, however, they may issue warnings about such directives. In this case, disable the warning by passing a special parameter to the compiler command line:
- for GCC and Clang: -Wno-unknown-pragmas
- for MSVC: -wd4068
Suppression of false positives through diagnostic configuration files (.pvsconfig)
Analyzer messages can be manipulated and filtered through the comments of as special format. Such comments can be placed either in the special diagnostic configuration files (.pvsconfig) for all analyzers, or directly inside the source code (but only for C/C++ analyzer).
The diagnostic configuration files are plain text files which are added to any Visual Studio project or solution. To add the configuration file, select the project or solution in question in the Solution Explorer window inside Visual Studio IDE, and select a context menu item 'Add New Item...'. In the following window, select the 'PVS-Studio Filters File' template (figure 3):
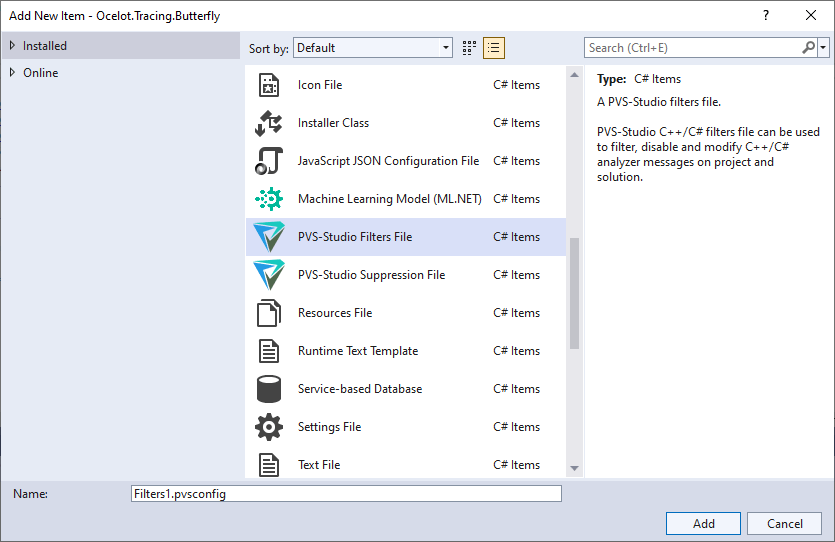
Figure 3 - Adding diagnostic configuration file to a solution.
Because of the specifics of some Visual Studio versions, the 'PVS-Studio Filters File' file template may be absent in some versions and editions of Visual Studio for projects and\or solutions. In such a case, it is possible to use add diagnostic configuration file as a simple text file by specifying the 'pvsconfig' extension manually. Make sure that after the file is added, it is set as non-buildable in its' compilation properties.
When a configuration file is added to a project, it will be valid for all the source files in this project. A solution configuration file will affect all the source files in all of the projects added to that solution.
In addition, .pvsconfig file can be placed in the user data folder (%AppData%\PVS-Studio\) - this file will be automatically used by analyzer, without the need to modify any of your project\solution files.
Note. '%AppData%\PVS-Studio\' may contain several '.pvsconfig' files. The analyzer will use them all. One should also take into account that the configuration from '%AppData%\PVS-Studio\' will be global for the analyzer and will certainly be used at each run.
When using the PVS-Studio_Cmd command-line tool, you can specify the path to the .pvsconfig configuration file using the ‑‑rulesConfig (-C) parameter, for example, as follows:
PVS-Studio_Cmd.exe -t D:\project\project.sln
-C D:\project\rules.pvsconfigThe '.pvsconfig' files utilize quite a simple syntax. Any line starting with the '#' character is considered a comment and ignored. The filters themselves are written as one-line C++/C# comments, i.e. every filter should start with '//' characters.
In case of C/C++ code, the filters can also be specified directly in the source code. Please note, that this is not supported for C# projects!
Next, let's review different variants of diagnostic configurations and filters.
Filtering analyzer messages by a fragment of source code (for example, macro, variable and function names)
Let us assume that the following structure exists:
struct MYRGBA
{
unsigned data;
};Also there are several functions that are utilizing it:
void f1(const struct MYRGBA aaa)
{
}
long int f2(int b, const struct MYRGBA aaa)
{
return int();
}
long int f3(float b, const struct MYRGBA aaa, char c)
{
return int();
}The analyzer produces three V801: "Decreased performance. It is better to redefine the N function argument as a reference" messages concerning these functions. Such a message will be a false one for the source code in question, as the compiler will optimize the code by itself, thus negating the issue. Of course it is possible to mark every single message as a False Alarm using the "Mark As False Alarm" option. But there is a better way. Adding this line into the sources will suffice:
//-V:MYRGBA:801For C/C++ projects, we advise you to add such a line into .h file near the declaration of the structure, but if this is somehow impossible (for example the structure is located within the system file) you could add this line into the stdafx.h as well.
And then, every one of these V801 messages will be automatically marked as false alarm after re-verification.
Note: if you use comments of the //-V:MY_STRING:Vxxx form, PVS-Studio suppresses all Vxxx messages issued for strings that have the MY_STRING substring.
It's not only single words that the described mechanism of warning suppression can be applied. That's why it may be very useful sometimes.
Let's examine a few examples:
//-V:<<:128This comment will suppress the V128 warning in all the lines which contain the << operator.
buf << my_vector.size();If you want the V128 warning to be suppressed only when writing data into the 'log' object, you can use the following comment:
//-V:log<<:128
buf << my_vector.size(); // Warning untouched
log << my_vector.size(); // Warning suppressedNote. Notice that the comment text string must not contain spaces.
Correct: //-V:log<<:128
Incorrect: //-V:log <<:128When searching for the substring, spaces are ignored. But don't worry: a comment like the following one will be treated correctly:
//-V:ABC:501
AB C = x == x; // Warning untouched
AB y = ABC == ABC; // Warning suppressedComplete warning disabling
Our analyzer allows the user to completely disable output of any warning through a special comment. In this case, you should specify the number of the diagnostic you want to turn off, after a double colon. The syntax pattern is as follows:
//-V::(number)For example, if you want to ignore warning V122, you insert the following comment in the beginning of a file:
//-V::122To disable a number of diagnostics, you can list their numbers separating them by commas. The syntax pattern is the following:
//-V::(number1),(number2),...,(numberN)If you want to disable V502, V507, and V525 warnings, then the comment will look like this:
//-V::502,507,525You can disable warnings for certain diagnostics at specific levels. The syntax pattern is the following:
//-V::(number1),(number2),...,(numberN):1,2,3For example, if you need to disable V3161 and V3165 warnings at the 'Medium' and 'Low' levels, the comment will look like this:
//-V::3161,3165:2,3In addition, the analyzer allows the user to filter warnings by their number and substring. The syntax pattern is as follows:
//-V::(number1),(number2),...,(numberN)::{substring}For example, you can disable all V3022 and V3063 warnings that contain the "always true" substring:
//-V::3022,3063::{always true}You can filter warnings by diagnostic number, level and substring simultaneously:
//-V::(number1),(number2),...,(numberN):1,2,3:{substring}For example, you can disable all V5625 warnings at the second level that contain the "Google.Protobuf 3.6.1" substring:
//-V::5625:2:{Google.Protobuf 3.6.1}There is also an option to disable a group of diagnostics. The syntax pattern is the following:
//-V::GA
//-V::X64
//-V::OP
//-V::CS
//-V::MISRATo disable several groups of diagnostics, you can list them separating by commas. The syntax pattern is the following:
//-V::X64,CS,...To turn off all the diagnostics of C++ or C# analyzer use the following form:
//-V::C++
//-V::C#Since the analyzer won't output the warnings you have specified, this might significantly reduce the size of the analysis log when too many false positives are generated for some diagnostic.
Excluding files from the analysis by masks
You can set the exclusion from the analysis of files / directories that correspond to specified masks. It might be convenient, for example, when it's needed to exclude the code of third-party libraries or automatically generated files from the analysis.
Several examples of masks:
//V_EXCLUDE_PATH C:\TheBestProject\thirdParty
//V_EXCLUDE_PATH *\UE4\Engine\*
//V_EXCLUDE_PATH *.autogen.csSyntax of masks is the same as the one for the options 'FileNameMasks' and 'PathMasks', described in the document "Settings: Don't Check Files".
Ignoring global configuration files
Before running the analysis, 'PVS-Studio_Cmd' generates the configuration of diagnostic rules from:
- global files in '%AppData%\PVS-Studio\';
- the file passed through the ‑‑rulesConfig (-C) option;
- files added to the solution;
- files added to the project.
You may have a large number of projects and the configuration for these projects can be generated in various ways. In this case, configuration from global files sometimes may lead to confusion in the resulting configuration. The reason is the following: the configuration from the global files always applies to whatever project you are working on. In other words, settings that are specific only to the X project will also be applied to other projects as well.
So if you need to ignore global configuration files, you need to add a special flag to the corresponding '.pvsconfig' file:
//IGNORE_GLOBAL_PVSCONFIG The flag works as follows:
- if the flag is set in one of the global files, the global configuration will always be ignored.
- if the flag is set at the solution level, the global configuration is ignored for a specific solution;
- if the flag is set at the project level, the global configuration is ignored for a specific project.
The usage of the flag will allow you to flexibly disable the global settings for certain cases.
Other means of filtering messages in the PVS-Studio analyzer (Detectable Errors, Don't Check Files, Keyword Message Filtering)
There may be situations in which a certain type of diagnostics is not relevant for the analyzed project, or one of the diagnostics produces warnings for the source code which, you have no doubt in it, is correct. In this case, you can use the group messages suppression based on the filtering of the gained analysis results. The list of available filtering modes can be accessed through the 'PVS-Studio -> Options' menu item.
The suppression of multiple messages through filters does not require restarting of the analysis, the filtering results will appear in PVS-Studio output window immediately.
First, you may disable diagnosis of some errors by their code. You may do this using the "Settings: Detectable Errors" tab. On the tab of detected errors, you may specify the numbers of errors that must not be shown in the analysis report. Sometimes it is reasonable to remove errors with particular codes from the report. For instance, if you are sure that errors related to explicit type conversion (codes V201, V202, V203) are not relevant for your project, you may hide them. A display of errors of a certain type can be disabled using the context menu command "Hide all Vxxx errors". Accordingly, in case you need to enable a display back, you can configure it on the section "Detectable Errors", mentioned above.
Second, you may disable analysis of some project's parts (some folders or project files). This is the "Settings: Don't Check Files" tab. On this tab, you may insert information about libraries whose files' inclusions (through the #include directive) must not be analyzed. This might be needed to reduce the number of unnecessary diagnostic messages. Suppose your project employs the Boost library. Although the analyzer generates diagnostic messages on some code from this library, you are sure that it is rather safe and well written. So, perhaps there is no need to get warnings concerning its code. In this case, you may disable analysis of the library's files by specifying the path to it on the settings page. Besides, you may add file masks to exclude some files from analysis. The analyzer will not check files meeting the mask conditions. For instance, you may use this method to exclude autogenerated files from analysis.
Path masks for files which are mentioned in the latest generated PVS-Studio report in the output window could be appended to the 'Don't Check Files' list using the "Don't check files and hide all messages from..." context menu command for the currently selected message (figure 4).

Figure 4 - Appending path masks through the context menu
This command allows the appending either of a single selected file or of the whole directory mask containing such a file.
Third, you may suppress separate messages by their text. On the "Settings: Keyword Message Filtering" tab, you may set filtering of errors by their text and not their code. If necessary, you may hide error messages containing particular words or phrases in the report. For instance, if the report contains errors that refer to the names of the functions printf and scanf and you think that there cannot be any errors related to them, you should simply add these two words using the editor of suppressed messages.
Mass suppression of analyzer messages (baselining)
Sometimes, especially on the stage of stage of implementation of static analysis in large projects, you may need to 'suppress' all warnings of code base, since the developers may not have the necessary resources to fix the errors found by the analyzer in the old code. In such a case, it can be useful to 'hide' all warnings issued for existing code to track it only when errors occur again. This can be achieved by using the "mass suppression of analyzer messages" mechanism. The use of the appropriate mechanism in Windows environment is described in the document "Mass suppression of analyzer messages", in Linux environment - in the relevant section of document "How to run PVS-Studio on Linux".
Possible issues
In rare cases markers arranged automatically might sometimes appear in false places. In this case, the analyzer will again produce the same error warnings because it will fail to find the markers. This is the issue of the preprocessor refers to multi-line #pragma-directives of a particular type that also cause confusion with line numbering. To solve this issue, you should mark messages you experience troubles with manually. PVS-Studio always informs about such errors with the message "V002. Some diagnostic messages may contain incorrect line number".
Like in case of any other procedure involving mass processing of files, you must remember about possible access conflicts when marking messages as false alarms. Since some files might be opened in an external editor and modified there during file marking, the result of joint processing of such files cannot be predicted. That is why we recommend you either to have copies of source code or use version control systems.
How to view and convert analyzer's results (SARIF, HTML, and other formats)
- Supported formats
- The PlogConverter utility (Windows)
- The plog-converter utility (Linux, macOS)
- Automatic notifications of the analyzer warnings
PVS-Studio can display reports results as:
- a raw output of the analyzer;
- a Plog report;
- a JSON report.
You can view the file with the analysis results in the PVS-Studio's plugin for an IDE or in C and C++ Compiler Monitoring UI.
These report formats are not suitable for direct viewing in a text editor or in automated emails. That's why the PVS-Studio distribution kit includes a special utility that allows you to convert the analysis results to other formats.
The name of this utility depends on the platform:
- Windows: PlogConverter.exe;
- Linux, macOS: plog-converter.
Supported formats
Below is the list of formats supported by the conversion utility.
|
Format |
Extension |
Tools |
Description |
|---|---|---|---|
|
PVS-Studio Log (Plog) |
.plog |
Visual Studio, SonarQube, Compiler Monitoring UI |
For Visual Studio and SonarQube users on Windows |
|
JSON |
.json |
Visual Studio IntelliJ IDEA Rider CLion |
For users of the PVS-Studio plugins for IDEs |
|
XML |
.xml |
SonarQube |
For SonarQube users on Linux/macOS |
|
SARIF |
.sarif |
Visual Studio, Visual Studio Code, and a visualization in GitHub Actions |
Universal static analyzer report format |
|
SARIF-VSCode |
.sarif |
Visual Studio Code with the installed Sarif Viewer extension |
Extended version of the SARIF format to work with the report in VS Code. |
|
TaskList |
.tasks |
Qt Creator |
To work with a report in Qt Creator |
|
TaskList Verbose |
.tasks |
Qt Creator |
Extended version of TaskList that supports displaying additional items |
|
CSV |
.csv |
Microsoft Excel LibreOffice Calc |
To view warnings in the spreadsheets form |
|
Simple Html |
.html |
Email Client Browser |
For emailing reports |
|
Full Html |
Folder |
Browser |
To view warnings and navigate code in a browser |
|
Error File |
.err |
IDEs, Vim, Emacs, etc |
To view reports in any editor that supports the compiler output format |
|
Error File Verbose |
.err |
IDEs, Vim, Emacs, etc |
Extended version of the Error File format that supports displaying additional items. |
|
TeamCity |
.txt |
TeamCity |
To upload and view warnings in TeamCity |
|
MISRA Compliance |
.html |
Email Client Browser |
To check code for compliance with the MISRA standards |
|
GitLab |
.json |
GitLab |
To view warnings in GitLab Code Quality format |
|
DefectDojo |
.json |
DefectDojo |
To upload and view warnings in DefectDojo |
The PlogConverter utility (Windows)
Description
To convert a PVS-Studio report to one of the listed formats, use the PlogConverter utility from the PVS-Studio distribution kit for Windows. You can find the PlogConverter utility in the PVS-Studio installation directory (by default, the path is C:\Program Files (x86)\PVS-Studio). The source code of the utility is available on GitHub.
Parameters
The "‑‑help" flag displays the main information about the utility:
PlogConverter.exe –-helpTo run the utility in the terminal's command line, execute:
PlogConverter.exe [options] <path to PVS-Studio log>Utility parameters:
- ‑‑renderTypes (or -t): specifies formats to which the report will be converted. A combination of various formats is possible: just list them and separate them with commas. If a format is not specified, the report is converted to all formats.
- JSON: the recommended format to use. Supported by all PVS-Studio plugins and utilities. This format is recommended if you need to combine several reports into one or convert a Plog report into a JSON format.
- Plog: a format to view the report on Windows. However, it is better to use a more universal JSON format. You can choose the Plog format if you need to combine several reports into one or convert a JSON report to the Plog format.
- Html: an html file format. This report is easy to use for automated emails.
- FullHtml: an html file format. If you choose this format, PlogConverter converts the analyzer messages and source files to html files. This allows you to view the analyzer report, sort messages, and navigate through code in a browser. As a result of conversion, you'll get a directory named 'fullhtml' located on the path set via the '-o' flag. If you set the '-n' parameter, the directory will have the specified name and the '.fullhtml' postfix;
- Txt: a report format with the plaintext representation of analyzer messages.
- Csv: a report format with delimiters. It's convenient to use this format in Microsoft Excel.
- Totals: a report format that contains a summary about the number of different warning types (GA, OP, 64, CS, MISRA, ...) and different levels of certainty. You can view a detailed description of the warnings' certainty levels and sets of diagnostic rules in the documentation, section "Getting acquainted with the PVS-Studio static code analyzer on Windows".
- TaskList: a report format for viewing in Qt Creator.
- TeamCity: a report format for uploading and viewing in TeamCity CI.
- Sarif: an open format for data exchanging between static analysis tools. Read more here.
- SarifVSCode: an extended Sarif report format. Suitable for working with the Sarif Viewer plugin for Visual Studio Code.
- MisraCompliance: a report format that contains information about code compliance with the MISRA standard.
- GitLab: a report format compatible with GitLab Code Quality.
- DefectDojo: a report format for uploading and viewing in DefectDojo.
- ‑‑analyzer (or -a): filters warnings by mask. The filter mask has the 'MessageType:MessageLevels' form. 'MessageType' can take one of the following types: GA, OP, 64, CS, MISRA, Fail, OWASP, AUTOSAR. 'MessageLevels' can take values from 1 to 3.
- ‑‑excludedCodes (or -d): Specifies a list of warnings (separated by ",") to exclude from the resulting report.
- ‑‑includePaths (or -i): Include in the report only warnings issued on specified files. You can use this parameter to pass file paths (absolute or relative) or wildcard masks. Separate the paths or masks with the ';' character. Note that you can include paths only for those reports that don't contain the SourceTreeRoot marker.
- ‑‑excludePaths (or -e): excludes from the report all warnings issued in certain files. You can use this parameter to pass file paths (absolute or relative) or wildcard masks. Separate the paths or masks with the ';' character. Note that you can exclude paths only for those reports that don't contain the SourceTreeRoot marker.
- ‑‑settings (or -s): sets the path to the PVS-Studio settings file. This file has various settings for the analyzer. PlogConverter reads the 'DisableDetectableErrors' parameter from the passed file and disables diagnostics specified in the report.
- ‑‑srcRoot (or -r): sets the replacement of the "SourceTreeRoot" marker. If during the check the path to the root directory of the project was replaced with a "SourceTreeRoot" marker (|?|), then this parameter becomes mandatory (otherwise the project files will not be found).
- ‑‑outputDir (or -o): specifies the directory where the converted reports will be saved. If this parameter is not set, the files are written to the startup directory.
- ‑‑outputNameTemplate (or -n): specifies a template file name without an extension. All converted reports will have the same name but different extensions.
- ‑‑errorCodeMapping (or -m): enables the display of CWE ID and/or SAST ID for found warnings: "-m cwe,misra,autosar,owasp". If the 'cwe' value is specified, warnings in the report will have CWE ID. If 'misra', 'autosar' or 'owasp' is specified, then the display of SAST ID will be enabled for the rules of the corresponding standard.
- ‑‑indicateWarnings (or -w): sets the exit code of the PlogConverter utility to '2' if warnings remain after the log is filtered.
- ‑‑pathTransformationMode (or -R): sets the path transformation mode when converting the report. This option requires "‑‑srcRoot". This option works only for those formats that support relative paths: JSON, Plog. Acceptable values:
- toAbsolute — paths are converted to the absolute ones;
- toRelative — paths are converted to the relative ones.
- ‑‑misraDeviations: MISRA rules, violations of which are not taken into account. The rules are separated by ";". If all the MISRA violations found by the analyzer are specified in the ‑‑misraDeviations option, the final report will show that the project complies with the MISRA standard.
- ‑‑grp: path to the Guideline Re-categorization Plan text file. Use this option only when you generate the MISRA Compliance report. Guideline Re-categorization Plan is a file that specifies the category changes for the MISRA rules. You can read more about the MISRA rule category here.
- ‑‑noHelpMessages: exclude links to the documentation for diagnostics from the analyzer's warnings.
- ‑‑keepFalseAlarms(or -f): preserve warnings marked as False Alarms in the report.
- ‑‑countWarnings (or -c): allows to display the number of messages matching the arguments of this command. Command format: -c {Groups or Error Codes}:{Levels};{Other Arguments}... Example commands: -c GA:1,2;OP:1 | -c V003 | -c V502,V504:1 | -c ALL
- ‑‑generateDiffWith (or -D): generates a report with the difference between the report provided by this option and the input report.
Exit codes
The PlogConverter utility has several non-exit codes that don't necessarily indicate some issues with the tool. If the utility didn't return '0', it doesn't mean the utility worked with an error.
Below is the description of the PlogConverter exit codes:
- '0' — the report was successfully converted;
- '1' — an error occurred when one of the output files was generated.
- '2' — an output file has unfiltered or unsuppressed warnings. To make this mode work, pass the ‑‑indicateWarnings (-w) flag to the utility;
- '3' — a general (non-specific) error in the utility's operation, an exception was caught during the work. Usually, it means the PlogConverter code has an error.
- '4' — incorrect command line arguments were passed to the utility, or a file passed as an argument wasn't found.
- '5' — there was an attempt to replace absolute paths with relative ones, but the report format doesn't support this option.
Example of a conversion command
PlogConverter.exe -t Json,Csv -a GA:1,2;OWASP:1 -o D:\Logs -r
D:\projects\projectName -m CWE,OWASP -n PVS-Log PVS-Studio.logHere's what happens:
- 'PVS-Studio.log' is converted to the JSON and CSV formats;
- the resulting report will contain 1st and 2nd level warnings of the General Analysis diagnostic group, and 1st level warnings from the OWASP diagnostic group;
- the '|?|' marker in the paths to files is replaced by 'D:\projects\projectName';
- the analyzer warnings will have CWE_ID and SAST_ID;
- converted reports will be in the 'D:\Logs' folder and will be named as 'PVS-Log.json' and 'PVS-Log.csv'.
The plog-converter utility (Linux, macOS)
Description
To convert a PVS-Studio report to one of the listed formats, use the plog-converter utility, which is available with the PVS-Studio C/C++ packages and archives for Linux and macOS. After installing the package or the PVS-Studio C/C++ archive, you can use the plog-converter utility to convert analyzer reports to different formats (*.xml, *.tasks, etc.). The source code of the utility is available on GitHub.
Parameters
The "‑‑help" flag displays the main information about the utility:
plog-converter --helpTo run the utility in the terminal's command line, execute:
plog-converter [options] <path to PVS-Studio log>All the options can be listed in any order you want.
Available options:
- ‑‑renderTypes (or -t): specifies the possible options for converting the report. This is a mandatory argument for running the utility. A combination of various formats is possible, just type ‑‑renderTypes (-t) before each format or separate them with a comma and pass as the flag arguments:
- json: the recommended format to use. Supported by all PVS-Studio plugins and utilities. This format is recommended to use if you need to combine several reports into one or to convert a Plog report into the JSON format;
- html: an HTML file format. This report is easy to use for automated emails;
- fullhtml: an HTML file format. If you choose this format, PlogConverter converts the analyzer messages and source files to html files. This allows you to view the analyzer, sort messages and navigate through code in a browser. When you pass this value, you must also pass the ‑‑output (-o) argument. As a result of conversion, you'll get a directory located on the path set via the '-o' flag. If you set the '-n' parameter or set two or more report formats, the directory will have the '.fullhtml' postfix;
- errorfile: the GCC and Clang output format;
- errorfile-verbose: the extended 'errorfile' output format that supports displaying additional items (if there are any);
- csv: a report format with delimiters. It's convenient to use in Microsoft Excel.
- tasklist: a report format for viewing in Qt Creator;
- tasklist-verbose: the extended 'tasklist' output format that supports displaying additional items (if there are any);
- teamcity: a report format for uploading and viewing in TeamCity CI.
- sarif: an open format for data exchanging between static analysis tools. You can read more here;
- sarif-vscode: the extended Sarif report format. Suitable for working with the Sarif Viewer plugin for Visual Studio Code;
- totals: a report format that contains a summary about the number of warnings that belong to different groups (GA, OP, 64, CS, MISRA, ...) and different levels of certainty. You can find a detailed description of warning levels and diagnostic groups in our documentation, section "Getting acquainted with the PVS-Studio static code analyzer on Windows";
- misra-compliance: a report format for checking code for compliance with MISRA. When you pass this value, you must also pass the ‑‑output (-o) argument.
- gitlab: a report format compatible with GitLab Code Quality.
- defectdojo : a report format for uploading and viewing in DefectDojo.
- ‑‑analyzer (or -a): filters warnings by mask. The filtering mask has the following form: 'MessageType:MessageLevels'. 'MessageType' can be one of the following types: GA, OP, 64, CS, MISRA, Fail, OWASP. 'MessageLevels' can take values from 1 to 3. A combination of various masks is possible, just separate them with ";" (without spaces). By default, only warnings from General Analysis Level 1 and 2 will remain in the report. Default value: GA:1,2
- ‑‑output (or -o): a path to the output's file/directory. If the flag is not set, the output will be sent to a standard output thread. Besides:
- If you specify two or more report formats, this parameter is interpreted as a path to the resulting directory where all generated reports will be located. During generation, an extension corresponding to the format will be added to each file.
- If you specify one report format, then as a result you'll get either a file or a directory — depending on the format.
- ‑‑stdout: allows you to duplicate the report text into a standard output, if you set the –output flag.
- ‑‑settings (or -s): a path to the configuration file. The file is similar to the PVS-Studio.cfg configuration file. This file provides information about excluded directories (exclude-path).
- ‑‑srcRoot (or -r): sets the replacement for the "SourceTreeRoot" marker. If during the check the path to the root directory of the project was replaced with the "SourceTreeRoot" marker (|?|), then this parameter becomes mandatory (otherwise the project files will not be found).
- ‑‑excludedCodes (or -d): a comma-separated list of excluded diagnostics: "-d V595,V730".
- ‑‑errorCodeMapping (or -m): enable displaying CWE ID and/or SAST ID for found warnings: "-m cwe,misra,autosar,owasp". If the 'cwe' value is specified, warnings in the report will have CWE ID. If 'misra', 'autosar' or 'owasp' is specified, then SAST IDs will be displayed for the rules of the corresponding standard.
- ‑‑includePaths (or -I): include in the report only warnings issued on specified files. You can use this parameter to pass file paths (absolute or relative) or the template (glob). If you need to include several files, pass each path via this parameter. Note that you can include paths only for those reports that don't contain the SourceTreeRoot marker.
- ‑‑excludePaths (or -E): excludes from the report all warnings issued in certain files. You can use this parameter to pass file paths (absolute or relative) or the template (glob). If you need to exclude several files, pass each path via this parameter. Note that you can exclude paths only for those reports that don't contain the SourceTreeRoot marker.
- ‑‑cerr (or -e): use stderr instead of stdout.
- ‑‑grp: path to the Guideline Re-categorization Plan text file. It's only used if a MISRA Compliance report is generated. Guideline Re-categorization Plan is a file that specifies the category changes for the MISRA rules. You can read more about the MISRA rules category here.
- ‑‑indicateWarnings (or -w): sets the plog-converter utility's return code that equals '2' if warnings remain in the filtered output file(s) after the log was filtered.
- ‑‑pathTransformationMode (or -R): sets the path conversion mode when converting a report. This option requires "‑‑srcRoot". This option works only for those formats that support relative paths: json. Available options:
- toAbsolute – the paths are converted to absolute;
- toRelative – the paths are converted to relative.
- ‑‑misraDeviations: specifies MISRA violations. If you list the MISRA rules and separate them with ";", the listed rules won't be taken into account. If all the MISRA violations found by the analyzer are specified in the ‑‑misraDeviations option, the final report will show that the project complies with the MISRA standard.
- ‑‑noHelpMessages: exclude links to the documentation from the analyzer's warnings.
- ‑‑name (or -n): a template name for the resulting reports when generating two or more report formats. The corresponding extension will be added to the template name. By default, when multiple reports are generated, the input report name is used without the extension. If there are several input reports, the name will be 'MergedReport'.
- ‑‑keepFalseAlarms: preserve warnings marked as False Alarms in the report.
Exit codes
Description of the plog-converter exit codes:
- '0' — the report was successfully converted;
- '1' — general (non-specific) error in the utility's work, an exception was caught during the work. Usually it means that the plog-converter code has an error.
- '2' — an output file has unfiltered or unsuppressed warnings. To make this mode work, pass the ‑‑indicate-warnings (-w) flag to the utility;
- '5' — there was an attempt to replace absolute paths with relative ones, but the report format doesn't support this option.
Example of a conversion command
plog-converter -t json -t csv -a 'GA:1,2;OWASP:1' -o /home/user/Logs
-r /home/user/projects/projectName -m cwe -m owasp -n PVS-Log PVS-Studio.logHere's what happens:
- 'PVS-Studio.log' is converted to the JSON and CSV formats;
- the resulting report will contain 1st and 2nd level warnings of the General Analysis diagnostic group, and 1st level warnings from the OWASP diagnostic group;
- the '|?|' in the paths to files is replaced by '/home/user/projects/projectName';
- the analyzer warnings will have CWE_ID and SAST_ID;
- the converted reports are located in the '/home/user/Logs' folder and are named as 'PVS-Log.json' and 'PVS-Log.csv'.
Automatic notifications of the analyzer warnings
The PVS-Studio distribution kit includes the BlameNotifier utility. It helps notify the developers about errors in the code they committed to the repository. It is also possible to set up notifications about all detected warnings for a certain circle of people. This utility can be helpful for managers and team leads.
You can read more about this utility in the following documentations section: "Notifying the developer teams (blame-notifier utility)".
Relative paths in PVS-Studio log files
When generating diagnostic messages, PVS-Studio by default generates absolute, or full, paths to the files where errors have been found. That's why, when saving the report, it's these full paths that get into the resulting file (XML plog file). It may cause some troubles in the future - for example when you need to handle this log file on a different computer. As you know, paths to source files may be different on two computers. This will lead to you being unable to open files and use the integrated mechanism of code navigation in such a log file.
Although this problem can be solved by editing the paths in the XML report manually, it's much more convenient to get the analyzer to generate messages with relative paths right away, i.e. paths specified in relation to some fixed directory (for example, the root directory of the project source files' tree). This way of path generation will allow you to get a log file with correct paths on any other computer - you will only need to change the root in relation to which all the paths in the PVS-Studio log file are expanded. The setting 'SourceTreeRoot' found on the page "PVS-Studio -> Options -> Specific Analyzer Settings" serves to tell PVS-Studio to automatically generate relative paths as described and replace their root with the new one.
Let's have a look at an example of how this mechanism is used. The 'SourceTreeRoot' option's field is empty by default, and the analyzer always generates full paths in its diagnostic messages. Assume that the project being checked is located in the "C:\MyProjects\Project1" directory. We can take the path "C:\MyProjects\" as the root of the project source files' tree and add it into the field 'SourceTreeRoot', and start analysis after that.
Now that analysis is over, PVS-Studio will automatically replace the root directory we've defined with a special marker. It means that in a message for the file "C:\MyProjects\Project1\main.cpp", the path to this file will be defined as "|?|Project1\main.cpp". Messages for the files outside the specified root directory won't be affected. That is, a message for the file "C:\MyCommonLib\lib1.cpp" will contain the absolute path to this file.
In the future, when handling this log file in the IDE PVS-Studio plugin, the marker |?| will be automatically replaced with the value specified in the 'SourceTreeRoot' setting's field - for instance, when using the False Alarm function or message navigation. If you need to handle this log file on another computer, you'll just need to define a new path to the root of the source files' tree (for example, "C:\Users\User\Projects\") in the IDE plugin's settings. The plugin will correctly expand the full paths in automated mode.
This option can also be used in the Independent mode of the analyzer, when it is integrated directly into a build system (make, msbuild, and so on). It will allow you to separate the process of full analysis of source files and further investigation of analysis results, which might be especially helpful when working on a large project. For example, you can perform a one-time complete check of the whole project on the build server, while analysis results will be studied by several developers on their local computers.
You can also use the setting 'UseSolutionDirAsSourceTreeRoot' described on the same page. This setting enables or disables the mode of using the path to the folder, containing the solution file *.sln as a parameter 'SourceTreeRoot'. When this mode is enabled (True), the field 'SourceTreeRoot' will display the value '<Using solution path>'. The actual value of the parameter 'SourceTreeRoot' saved in the settings file does not change. When the setting 'UseSolutionDirAsSourceTreeRoot' is disabled (False), this value (if it was previously set) will be displayed in the field 'SourceTreeRoot' again. Thus, the setting 'UseSolutionDirAsSourceTreeRoot' just changes the mechanism of generating the path to the file, allowing to use 'SourceTreeRoot' as a parameter or a specified value or a path to a folder, containing the solution file.
Starting with PVS-Studio 7.27, you can set the '//V_SOLUTION_DIR_AS_SOURCE_TREE_ROOT' parameter in the diagnostic configuration file (.pvsconfig). This parameter copies the 'UseSolutionDirAsSourceTreeRoot' setting behavior.
The parameter has higher priority than the Settings.xml file.
Viewing analysis results with C and C++ Compiler Monitoring UI
- Introduction
- Analyzing source files with the help of the compiler process monitoring system
- Incremental analysis when using compiler monitoring system
- Working with the list of diagnostic messages
- Navigation and search in the source code
Introduction
PVS-Studio can be used independently from the Visual Studio IDE. The core of the analyzer is a command-line utility allowing analysis of C/C++ files that can be compiled by Visual C++, GCC, or Clang. For this reason, we developed a standalone application implemented as a shell for the command-line utility and simplifying the work with the analyzer-generated message log.
PVS-Studio provides a convenient plug-in for the Visual Studio environment, allowing "one-click" analysis of this IDE's vcproj/vcxproj-projects. There are, however, a few other build systems out there which we also should provide support for. Although PVS-Studio's analyzer core doesn't depend on any particular format used by this or that build system (such as, for example, MSBuild, GNU Make, NMake, CMake, ninja, and so on), the users would have to carry out a few steps on their own to be able to integrate PVS-Studio's static analysis into a build system other than VCBuild/MSBuild projects supported by Visual Studio. These steps are as follows:
- First, the user would need to integrate a call to PVS-Studio.exe directly into the build script (if available) of a particular system. Otherwise, the user will need to modify the build system itself. To learn more about it, read this documentation section. It should be noted right off that this way of using the analyzer is not always convenient or even plausible as the user is not always permitted to modify the build script of the project they are currently working with.
- After PVS-Studio's static analysis has been integrated into the build system, the user needs to somehow view and analyze the analyzer's output. This, in its turn, may require creating a special utility to convert the analyzer's log into a format convenient for the user. Note that when you have Visual Studio installed, you can at any time use the PVS-Studio plug-in for this IDE to view the report generated by the analyzer's core.
- Finally, when the analyzer finds genuine bugs in the code, the user needs a functionality enabling them to fix those bugs in the source files of the project under analysis.
All these issues can be resolved by using the C and C++ Compiler Monitoring UI (Standalone.exe).

Figure 1 - Compiler Monitoring UI
Compiler Monitoring UI enables "seamless" code analysis regardless of the compiler or build system one is using, and then allows you to work with the analysis results through a user interface similar to that implemented in the PVS-Studio plug-in for Visual Studio. The Compiler Monitoring UI also allows the user to work with the analyzer's log obtained through direct integration of the tool into the build system when there is no Visual Studio installed. These features are discussed below.
Analyzing source files with the help of the compiler process monitoring system
Compiler Monitoring UI provides a user interface for a compilation monitoring system. The monitoring system itself (the console utility CLMonitor.exe) can be used independently of the Compiler Monitoring UI - for example when you need to integrate static analysis into an automated build system. To learn more about the use of the compiler monitoring system, see this documentation section.
To start monitoring compiler invocations, open the corresponding dialog: Tools -> Analyze Your Files... (Figure 2):

Figure 2 - Build process monitoring start dialog
Click on "Start Monitoring". After that, CLMonitor.exe will be called while the main window of the tool will be minimized.
Run the build and after it is finished, click on the "Stop Monitoring" button in the window in the bottom right corner of the screen (Figure 3):

Figure 3 - Compiler monitoring dialog
If the monitoring server has successfully tracked the compiler invocations, static analysis will be launched for the source files. When it is finished, you will get a regular PVS-Studio's analysis report (Figure 4):
Figure 4 - Results of the monitoring server's and static analyzer's work
The analysis results can be saved into an XML file (with the plog extension) for further use through the menu command 'File -> Save PVS-Studio Log As...'.
Incremental analysis when using compiler monitoring system
The way of performing incremental analysis is the same as the process of the analyzing the whole project. The key difference is the need to implement not a full, but an incremental build of the project. In such a case compilers runs for modified files will be monitored that will allow to check only them. The rest of the analysis process is completely identical to the described above, in the section "Analyzing source files with the help of the compiler process monitoring system".
Working with the list of diagnostic messages
Once you have got the analysis report with the analyzer-generated warnings, you can start viewing the messages and fixing the code. You can also load a report obtained earlier into the Compiler Monitoring UI. To do this, use the menu command 'File|Open PVS-Studio Log...'.
Various message suppression and filtering mechanisms available in this utility are identical to those employed in the Visual Studio plug-in and are available in the settings window 'Tools|Options...' (Figure 5).

Figure 5 - Analysis settings and message filtering mechanisms
In the Analyzer Output window, you can navigate through the analyzer's warnings, mark messages as false positives, and add filters for messages. The message handling interface in the Compiler Monitoring UI is identical to that of the output window in the Visual Studio plug-in. To see a detailed description of the message output window, see this documentation section.
If you are new to the static analysis tool and would like to know what it can do, you can use the Best Warnings mechanism. This mechanism will show you the most important and reliable warnings.
To check out the analyzer's most interesting warnings, click on the 'Best' button, as shown in the screenshot below:

After that, the table with the results of the analysis will show maximum of ten of the most critical warnings of the analyzer.
Navigation and search in the source code
Although the built-in editor of the Compiler Monitoring UI does not provide a navigation and autocomplete system as powerful and comfortable as Microsoft IntelliSense in the Visual Studio environment or other similar systems, Compiler Monitoring UI still offers several search mechanisms that can simplify your work with the analysis results.
Besides regular text search in a currently opened file (Ctrl + F), Compiler Monitoring UI also offers the Code Search dialog for text search in opened files and folders of the file system. This dialog can be accessed through the menu command 'Edit|Find & Replace|Search in Source Files...' (Figure 6):

Figure 6 - Search dialog of Compiler Monitoring UI
The dialog supports search in the current file, all of the currently opened files, or any folder of the file system. You can at any moment stop the search by clicking on the Cancel button in the modal window that will show up after the search starts. Once the first match is found, the results will start to be output right away into the child window Code Search Results (Figure 7):
Figure 7 - Results of text search in project source files
Of course, regular text search may be inconvenient or long when you need to find some identifier's or macro's declarations and/or uses. In this case, you can use the mechanism of dependency search and navigation through #include macros.
Dependency search in files allows you to search for a character/macro in those particular files that directly participated in compilation, or to be more exact, in the follow-up preprocessing when being checked by the analyzer. To run the dependency search, click on the character whose uses you want to find to open the context menu (Figure 8):
Figure 8 - Dependency search for a character
The search results, just like with the text search, will be output into a separate child window: 'Find Symbol Results'. You can at any moment stop the search by clicking on the Cancel button in the status bar of the Compiler Monitoring UI main window, near the progress indicator.
Navigation through the #include macros allows you to open in the Compiler Monitoring UI code editor files added into the current file through such a macro. To open an include macro, you also need to use the editor's context menu (Figure 9):
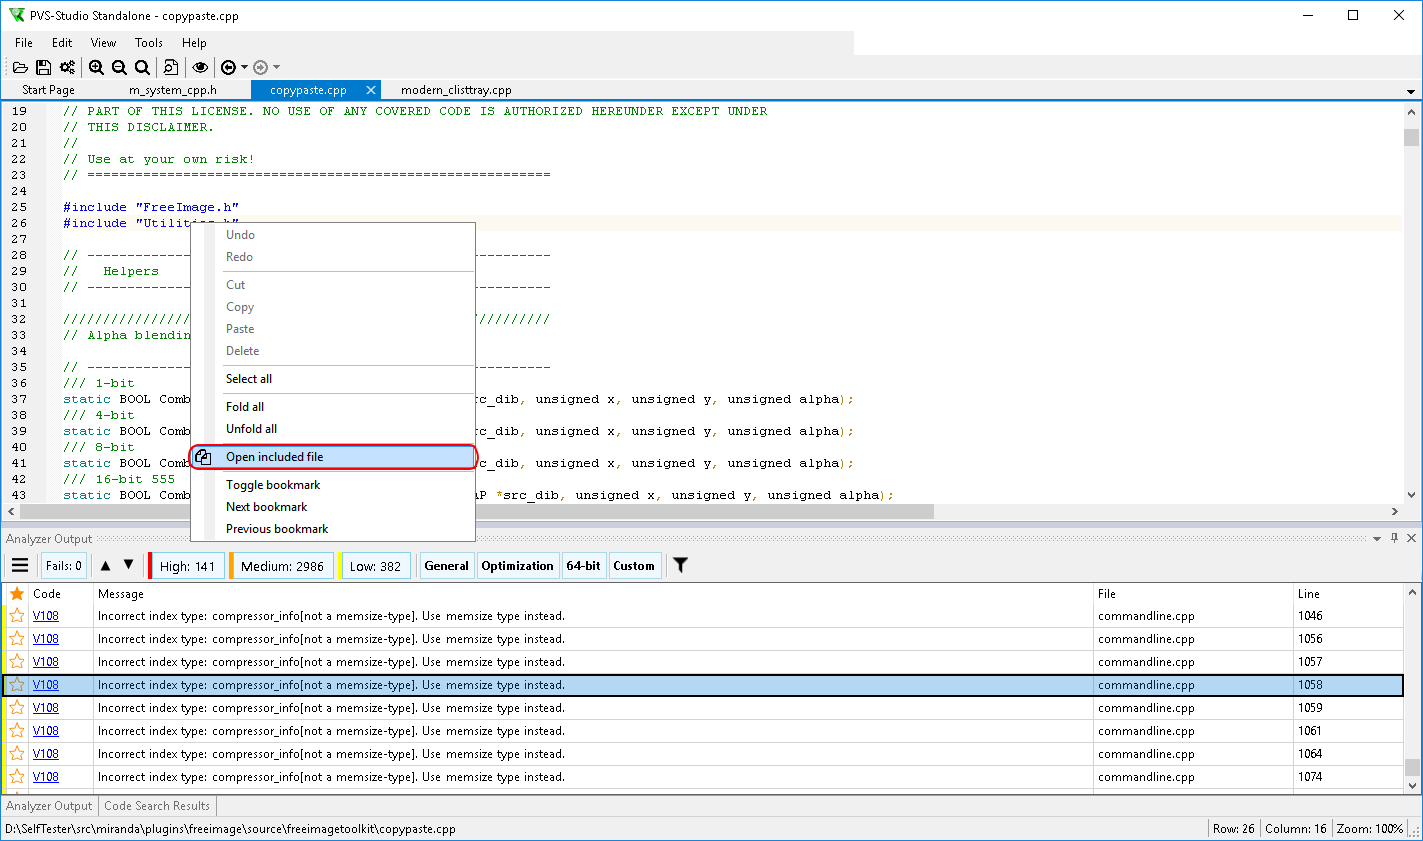
Figure 9 - Navigation through include macros
Keep in mind that information about dependencies is not available for every source file opened in Compiler Monitoring UI. When the dependencies base is not available for the utility, the above mentioned context menu items will be inactive, too.
The dependencies base is created only when analysis is run directly from the Compiler Monitoring UI itself. When opening a random C/C++ source file, the utility won't have this information. Note that when saving the analyzer's output as a plog file, this output having been obtained in the Compiler Monitoring UI itself, a special dpn file, associated with the plog file and containing dependencies of the analyzed files, will be created in the same folder. While present near the plog file, the dpn file enables the dependency search when viewing the plog file in the Compiler Monitoring UI.
Filtering and handling the analyzer output through diagnostic configuration files (.pvsconfig)
- How to add/use configuration files in IDE and other analysis tools
- General functionality of configuration files
- Adding entries to the configuration file
- Filtering the analyzer messages
- Excluding files from the analysis
- Ignoring global configuration files
- Specifying the file analysis timeout for a project/solution/system
- Changing a certainty level of a diagnostic warning
- Changing the text of the analyzer messages
- Manage synchronization of suppress files
- Selecting the PVS-Studio C++ core version for analysis
- Configuration files prioritization
- Executing commands from the CustomBuild task before running the analysis
- Suppressing parsing errors
- Ignoring analysis settings from Settings.xml
- Using the solution directory as the SourceTreeRoot value
- Managing sorting of suppress files
A configuration file is used to display and filter analyzer messages. The configuration file also allows you to set additional parameters for the analysis. You can use configuration files only for projects written in C, C++ or C#.
Plugins for the following IDEs support configuration files:
- Visual Studio;
- Rider.
Utilities that support configuration files:
- PVS-Studio_Cmd.exe;
- CLMonitor.exe (only in analyze or analyzeFromDump mode);
- C and C++ Compiler Monitoring UI (Standalone.exe);
- CompileCommandsAnalyzer.exe (in analyze mode).
How to add/use configuration files in IDE and other analysis tools
.pvsconfig in Visual Studio
To use a configuration file in Visual Studio, add the file at the project or solution level. Choose the necessary project or solution in the Solution Explorer window inside Visual Studio IDE. Select the 'Add New Item...' context menu item. In the window that appears, select the 'PVS-Studio Filters File' file type.

If there is no file template, you can add a simple text file with the ".pvsconfig" extension to the project or solution.
You can add multiple configuration files for each project/solution.
Configuration files added at the project level apply to all files in a given project. Configuration files added at the solution level apply to all files of all projects in a given solution.
.pvsconfig in Rider
There is no special template for adding a configuration file for Rider.
You can add a configuration file for Rider only at the project level. To use the diagnostics configuration file in Rider, add a new file with the '.pvsconfig' extension to the project via Solution Explorer.

.pvsconfig in PVS-Studio_Cmd.exe and pvs-studio-dotnet
When you run analysis through PVS-Studio_Cmd.exe or pvs-studio-dotnet, the configuration files from the project or solution being analyzed are automatically used. You can also specify the path to the additional .pvsconfig file using the ‑‑rulesConfig (-C) parameter:
PVS-Studio_Cmd.exe -t ProjName.sln -C \path\to\.pvsconfig
pvs-studio-dotnet -t ProjName.sln -C /path/to/.pvsconfigIn this case, the settings both from the files in the project/solution and the file passed as an argument are taken into account in the analysis.
.pvsconfig in CLMonitor.exe
You can specify the path to the configuration file as a command-line argument (the -c parameter):
CLMonitor.exe analyzeFromDump -d /path/to/compileDump.gz -c /path/to/.pvsconfig.pvsconfig in CompilerCommandsAnalyzer.exe
If you use the CompilerCommandsAnalyzer.exe utility, you can specify the path to the .pvsconfig file via the -R parameter:
CompilerCommandsAnalyzer.exe analyze ... -R /path/to/.pvsconfig.pvsconfig in Standalone.exe
In Standalone.exe, you can specify the path to the file when you start monitoring.

The use of the global .pvsconfig file
The global diagnostics configuration file is used during all project checks. There can be several global .pvsconfig configuration files and the PVS-Studio tools will use them all.
To add a global configuration file, create a file with the pvsconfig extension in the folder:
- For Windows – '%APPDATA%\PVS-Studio';
- For Linux and macOS – '~/.config/PVS-Studio'.
General functionality of configuration files
Adding entries to the configuration file
To set the settings in the configuration files use special directives that start with the '//' characters. Each directive is written on a new line.
Example:
//-V::122
//-V::123You can add comments — write the '#' character at the beginning of the line.
Example:
# I am a commentFiltering the analyzer messages
Complete warning disabling
To completely disable a certain diagnostic, use the following syntax pattern:
//-V::number'number' is the number of the diagnostic you want to turn off (for example, 3022).
Example:
//-V::3022In this case, the V3022 diagnostic warnings will be ignored.
To disable a number of diagnostics, you can list their numbers separating them by commas:
//-V::number1,number2,...,numberNExample:
//-V::3022,3080This use of this directive will completely disable V3022 and V3080 diagnostics.
Disabling a group of diagnostics
To disable diagnostics of a certain group, use the following directives:
//-V::GA
//-V::X64
//-V::OP
//-V::CS
//-V::MISRA
//-V::OWASPDefinition for each of the group:
- GA (General Analysis) — general analysis rule set. The main set of PVS-Studio diagnostic rules;
- OP (Optimization) — diagnostics of optimization. These are tips to improve the code efficiency;
- X64 (64-bit) — diagnostics that allow you to identify specific errors related to the development of 64-bit applications and migrating the code from a 32-bit platform to a 64-bit one;
- CS (Customers' Specific) — highly specialized diagnostics, developed by user requests. By default, this set of diagnostics is disabled;
- MISRA — the set of diagnostics, developed according to the MISRA standard (Motor Industry Software Reliability Association). By default, this set of diagnostics is disabled;
- OWASP — the set of diagnostics that allow you to find security issues and check code for compliance with OWASP ASVS standard. By default, this set of diagnostics is disabled.
You can disable several groups of diagnostics — list them separating by commas.
For example:
//-V::GA,MISRADisabling all C++ or C# diagnostics
To turn off all diagnostics of C++ or C# analyzer use the following directives:
//-V::C++
//-V::C#Excluding warnings for certain diagnostics at specific levels
If you need to turn off warnings of a certain level, use the following syntax pattern:
//-V::number1,number2,...,numberN:level- 'number1', 'number2', etc. — the numbers of diagnostics that need to be excluded from the analysis results (for example, 3022).
- 'level' — the warning level (1, 2 or 3).
The number 1 corresponds to warnings of 'High' level, the number 2 — to 'Medium' level warnings, the number 3 — to 'Low' level warnings.
You can filter out warnings of several levels at once. To do this, list the levels and separate them by commas.
Example:
//-V::3022,5623:1,3This directive will filter out the warnings of V3022 and V5623 diagnostics of 'High' and 'Low' levels.
Excluding warnings by the substring in a message
The analyzer supports the ability to exclude warnings by the diagnostic number and substring contained in a message.
The syntax pattern is as follows:
//-V::number::{substring}- 'number' is the number of diagnostic which message needs to be suppressed (for example, 3080);
- 'substring' is a substring contained in the analyzer's message.
The syntax pattern to suppress warnings by the substring:
//-V::3022::{always true}In this case, the V3022 warnings with the 'always true' substring in the message will be suppressed.
Excluding warnings by the certainty level and the substring
You can filter warnings by the certainty level and the substring simultaneously. The syntax pattern is the following:
//-V::number1,number2,...,numberN:level:{substring}- 'number1', 'number2', etc. — the numbers of diagnostics that need to be excluded from the analysis results (for example, 3022);
- 'level' — the warning's level (1, 2 or 3);
- 'substring' is a substring contained in the analyzer's message.
The number 1 corresponds to warnings of 'High' level, the number 2 is the 'Medium' level warnings, and the number 3 is the 'Low' level warnings.
You can filter out warnings of several levels at once. To do this, list the levels and separate them by commas.
Example:
//-V::3022,5623:1,3:{always true}This directive will filter out the warnings of V3022 and V5623 diagnostics of 'High' and 'Low' levels with the 'always true' substring in the message.
Excluding warnings from specific groups at different levels
To exclude warnings from specific groups at different levels, use the following command:
//-V::category1,category2,...,categoryN:level- 'category1', 'category2', etc. are the names of the groups you need to exclude (e.g. GA). For a list of groups and their descriptions, consult the "Disabling a group of diagnostics" section of the documentation.
- 'level' is the warning level (1, 2, or 3).
You can combine the group and level filters by separating them with a comma.
Here is the example:
//-V::GA,MISRA:1,3'High' and 'Low' level warnings that fall into the 'GA' and 'MISRA' groups will be excluded.
Enabling individual diagnostics
Note. This setting is only available for C, C++ and C# projects.
To enable a certain diagnostic, use the following syntax pattern:
//+V::number'number' is the number of the diagnostic you want to turn on (for example, 3022).
Example:
//+V::3022In this case, the V3022 diagnostic will be enabled.
To enable a number of diagnostics, you can list their numbers separating them by commas:
//+V::number1,number2,...,numberNExample:
//+V::3022,3080This use of this directive will enable V3022 and V3080 diagnostics.
Enabling a group of diagnostics
Note. This setting is only available for C, C++ and C# projects.
To enable diagnostics of a certain group, use the following directives:
//+V::GA
//+V::X64
//+V::OP
//+V::CS
//+V::MISRA
//+V::OWASPYou can enable several groups of diagnostics — list them separating by commas.
For example:
//+V::GA,MISRAMarking warnings issued for code fragment that includes the specified fragment as False Alarm
You can mark warnings issued for certain string that includes the specified fragment as False Alarm. Use the following directive:
//-V:substring:number- 'substring' is the substring in the string indicated by the analyzer;
- 'number' is the number of diagnostic which message needs to be suppressed (for example, 3080).
Note 1. The substring you are looking for ('substring') must not contain spaces.
Note 2. Messages filtered in this way will still appear in the report. They will be marked as False Alarm (FA).
Example:
public string GetNull()
{
return null;
}
public void Foo()
{
string nullStr = GetNull();
Console.WriteLine(nullStr.Length);
}For this code, the analyzer will issue a warning: "V3080 Possible null dereference. Consider inspecting 'nullStr'.".
Use the following directive in .pvsconfig to add the FA mark for warnings issued on such code:
//-V:Console:3080This directive adds a False Alarm mark to all V3080 warnings issued on the code lines containing 'Console'.
You can also add the False Alarm mark to multiple diagnostic warnings at once. To do this, list their numbers separated by commas:
//-V:substring:number1,number2,...,numberExample:
//-V:str:3080,3022,3175The V3080, V3082, V3175 diagnostic messages will be marked as False Alarm if there is the 'str' substring in the code line indicated by the analyzer.
Appending a hash code to the False Alarm label
With PVS-Studio version 7.28 it is now possible to appending an additional hash code to the False Alarm mark. If the line with this hash code is changes, the warnings issued for this line will not be marked as False Alarms. This is because the hash code of the changed line differs from the hash code of the mark.
This setting helps recognize situations where a string with a False Alarm mark is modified.
To enable this feature, add the following flag to the configuration file:
//V_ENABLE_FALSE_ALARMS_WITH_HASHIn the code, the False Alarm label with hash code looks like this:
//-V817 //-VH "3652460326"Excluding files from the analysis
To exclude a file or a group of files from analysis, use the directive:
//V_EXCLUDE_PATH fileMaskSeveral examples of masks:
//V_EXCLUDE_PATH C:\TheBestProject\thirdParty
//V_EXCLUDE_PATH *\UE4\Engine\*
//V_EXCLUDE_PATH *.autogen.csThe process of how the masks are specified is described in the documentation.
Ignoring global configuration files
Before running the analysis, 'PVS-Studio_Cmd' generates the configuration of diagnostic rules from:
- global configuration files (in the '%AppData%\PVS-Studio\' folder for Windows and in the '~/.config/PVS-Studio' folder for Linux or macOS);
- the file passed through the ‑‑rulesConfig (-C) option;
- files added to the solution;
- files added to the project.
There may be a situation when the global configuration should not be applied during analysis of some projects or solutions. If you need to ignore global configuration files, add the following flag to the corresponding '.pvsconfig' file:
//IGNORE_GLOBAL_PVSCONFIGSpecifying the file analysis timeout for a project/solution/system
If you run the analysis with the plugin interface (Visual Studio, Rider and CLion) or in the C and C++ Compiler Monitoring UI (Standalone.exe) you can specify a timeout after which the file analysis is terminated. If the analysis timeout is exceeded, the V006 warning is added to the analysis results. The warning contains information about the file that exceeded the timeout.
You can specify the file analysis timeout in .pvsconfig. For example, you can set a 10-minute (600-second) timeout with the following line:
//V_ANALYSIS_TIMEOUT 600If the timeout value specified in the .pvsconfig file is 0, the files are analyzed with no time limit.
You can limit file analysis time in certain projects/solutions/systems by specifying a timeout in .pvsconfig files of different levels:
- use the ‑‑rulesConfig (-c) parameter in PVS-Studio_Cmd.exe (to redefine the file analysis timeout for the current solution/project analysis);
- system (%AppData% in Windows, ~/.config in Linux, macOS);
- solution (.sln);
- project level (.csproj, .vcxproj).
Changing a certainty level of a diagnostic warning
The analyzer classifies warnings according to three certainty levels: High, Medium, and Low. Depending on the constructs used in the code, the analyzer evaluates the certainty of warnings and assigns them to the appropriate level in the report.
In some projects, it is important to find specific types of errors without considering the certainty level. However, there is also an opposite case when messages are of little use, but you don't want to turn them off completely. In such cases, you can manually set the High/Medium/Low level for diagnostics. To do so, use the following directives:
- The '//V_LEVEL_1' directive changes the certainty level to 'High';
- The '//V_LEVEL_2' directive changes the certainty level to 'Medium';
- The '//V_LEVEL_3' directive changes the certainty level to 'Low'.
To change the certainty level, use the following directive:
//V_LEVEL_1::numberwhere 'number' is the diagnostic number.
For example, to assign the third certainty level to the V3176 diagnostic, use the following directive:
//V_LEVEL_3::3176Changing the text of the analyzer messages
To change the substring in the analyzer message, use the following syntax:
//+Vnnn:RENAME:{originalString:replacementString}, ...- 'Vnnn' is the name of the diagnostic whose message you want to modify (for example, V624);
- 'originalString' is the original substring;
- 'replacementString' is the string that will replace the original one.
Let's consider an example of how the directive works. Suppose the code contains the number 3.1415 that triggers the V624 diagnostic. As a result, you get the message explaining that you need to replace 3.1415 with 'M_PI' from the '<math.h>' library. However, the project uses a special mathematical library that requires you to use only its mathematical constants. To make it work properly, add the directive to the configuration file.
The directive will look like this:
//+V624:RENAME:{M_PI:OUR_PI},{<math.h>:"math/MMath.h"}Then you will be informed to use the 'OUR_PI' constant from the 'math/MMath.h' header file.
You can also add a line to the message.
Here is the directive that helps you to do this:
//+Vnnn:ADD:{message}- 'Vnnn' is the name of the diagnostic whose message you want to modify (for example, V2003);
- 'message' is a string you need to add;
Let's look at an example. Here is the V2003 diagnostic message: "Explicit conversion from 'float/double' type to signed integer type.".
To add more information to this message, use the following directive:
//+V2003:ADD:{ Consider using boost::numeric_cast instead.}Now the analyzer will output a modified message: "Explicit conversion from 'float/double' type to signed integer type. Consider using boost::numeric_cast instead.".
Manage synchronization of suppress files
If you run the analysis with the plugin for Visual Studio or in the C and C++ Compiler Monitoring UI (Standalone.exe) you can disable the synchronization of suppress files by setting Specific Analyzer Settings\DisableSynchronizationOfSuppressFiles.
You can disable synchronization using '.pvsconfig' file of the solution level. To do this, add the following flag to the corresponding configuration file:
//DISABLE_SUPPRESS_FILE_SYNCTo enable synchronization via .pvsconfig, regardless of the value of the DisableSynchronizationOfSuppressFiles setting, you must use the flag:
//ENFORCE_SUPPRESS_FILE_SYNCThis flag is only enabled at the .pvsconfig level of the solution.
Selecting the PVS-Studio C++ core version for analysis
Starting from version 7.24, PVS-Studio_Cmd.exe utility and the plugin for Visual Studio support the ability to specify the PVS-Studio core version for analyzing C++ projects in case several versions of PVS-Studio are installed on the computer.
For PVS-Studio_Cmd.exe to run the analysis on the required version of the PVS-Studio core, the //PVS_VERSION::Major.Minor flag should be added to the solution-level .pvsconfig file, where
Major - major version number, and Minor - minor number.
Example:
//PVS_VERSION::7.24PVS-Studio_Cmd.exe calculates the path to the core using information from the system registry which is written by the installer when installing PVS-Studio.
The latest installation of PVS-Studio is considered default. This means that if the latest PVS-Studio 7.22 was installed, all the plugins and PVS-Studio_Cmd.exe will be of the same version. Consequently, you will not be able to use the mechanism of selecting the PVS-Studio core versions. Therefore if you want to use old versions of PVS-Studio (7.23 and older), you need to install them first and only then install the latest PVS-Studio 7.24 or newer version.
For all versions older than 7.24 you need to specify in the registry the correlation of the version and the path to the installation directory of this version, so that PVS-Studio_Cmd.exe could find the path to PVS-Studio's core. The information is written into 'Computer\HKEY_LOCAL_MACHINE\SOFTWARE\WOW6432Node\ProgramVerificationSystems\PVS-Studio\Versions'.
Configuration files prioritization
Starting with PVS-Studio 7.25, the PVS-Studio_Cmd.exe utility and the plugin for Visual Studio support the feature of explicitly setting the priority of configuration files on the same level. To do this, use the //CONFIG_PRIORITY::number flag, where number is the priority number.
For example:
//CONFIG_PRIORITY::1The smaller the number, the higher the priority of the configuration file. Files that do not have this flag have minimal priority. Files having the same priority are treated in alphabetical order. For example, among the files Filter1.pvsconfig, Filter2.pvsconfig, and Filter3.pvsconfig, the Filter3.pvsconfig file will be given priority.
The //CONFIG_PRIORITY flag affects only configuration files of the same level. In ascending order of priority, the configuration files are treated as follows:
- Global Configuration file;
- Solution Level configuration files;
- Project Level configuration files;
- File passed to the PVS-Studio_Cmd utility via the ‑‑rulesConfig (-c) argument.
Executing commands from the CustomBuild task before running the analysis
If you want PVS-Studio to execute commands from the CustomBuild task before running the analysis, add the following directive to the .pvsconfig file:
//EXECUTE_CUSTOM_BUILD_COMMANDSThis directive only applies to the .pvsconfig files passed via the command line and located at the global or solution level.
Let's look into the case where the directive might be useful.
Some Visual C++ projects can generate source code at build time using commands from the CustomBuild task. Running the analysis without generating the files can lead to errors. If you only need to generate the files, a complete build is useless (since it may take a long time).
In this case, it would be useful to specify the corresponding directive for PVS-Studio so that the analyzer could first execute the file generation commands and then perform the analysis.
Suppressing parsing errors
Sometimes the analyzer may issue a parsing error warning for a project that compiles perfectly. These errors may not be critical to the quality of the analysis. In this case, you can suppress them.
The parsing error has the following code:
Suppressing the V051 warning (the C# analyzer)
The C# analyzer issues V051 if there is at least one compilation error. To see all errors, run the command-line version of the analyzer with the "‑‑logCompilerErrors" option. The syntax for suppressing the errors looks like this:
//V_EXCLUDE_PARSING_ERROR:V051:{"ProjectName": "MyProject", "ErrorCode": "CS0012", "Message": "Some message"}
In this case, a compilation error that has the CS0012 code and the "Some message" message is suppressed for the (.csproj) MyProject project.
You do not need to combine information for suppression:
- //V_EXCLUDE_PARSING_ERROR:V051:{"ProjectName": "MyProject"} – suppresses errors in the MyProject project
- //V_EXCLUDE_PARSING_ERROR:V051:{"ErrorCode": "CS0012"} – suppresses all errors with the CS0012 code for all projects
- //V_EXCLUDE_PARSING_ERROR:V051:{"Message": "Some message"} – suppresses all errors with the "Some message" message
You can use masks when specifying the message, for example:
//V_EXCLUDE_PARSING_ERROR:V051:{Message: "Some*"}
Note: currently, parsing error suppression is available only for V051 (the C# analyzer).
Ignoring analysis settings from Settings.xml
The global Settings.xml file contains a number of options that affect the analysis result. For example, you can turn off diagnostic groups.
Use the '//V_IGNORE_GLOBAL_SETTINGS ON' flag to ignore the settings from Settings.xml during the analysis. In this case, all diagnostic groups are enabled, and no path filters are applied.
To customize analysis settings, use configuration files (.pvsconfig).
This option is available only in the configuration file of the solution level, and it affects only PVS-Studio_Cmd.exe, and plugins for Visual Studio.
Using the solution directory as the SourceTreeRoot value
You can use the '//V_SOLUTION_DIR_AS_SOURCE_TREE_ROOT' flag to enable the solution directory as the SourceTreeRoot value.
To learn more about the SourceTreeRoot setting, please consult the separate documentation.
The parameter has higher priority than UseSolutionDirAsSourceTreeRoot from the Settings.xml file.
This option is only available for the .pvsconfig level of the solution and affects only PVS-Studio_Cmd.exe and plugins for Visual Studio.
Managing sorting of suppress files
Starting with PVS-Studio 7.27, all suppressed messages are saved in sorted form. To learn more, please consult the documentation.
If you need to save old behavior and disable sorting mode, you can specify the //V_DISABLE_SUPPRESS_FILE_SORTING parameter.
Excluding files and directories from analysis
- Excluding files via IDE settings
- Excluding files via the Settings.xml file
- Excluding files via the diagnostic configuration file (.pvsconfig)
- For CompilerCommandsAnalyzer.exe and pvs-studio-analyzer utilities
When checking your projects that use many third-party libraries, you may need to focus on certain potential problems in your code. For such purposes, PVS-Studio tools provide a mechanism that excludes files from analysis. The mechanism allows you not only to decrease the number of unnecessary warnings, but also to significantly speed up the analysis of your project.
Excluding files via IDE settings
Visual Studio and C and C++ Compiler Monitoring UI
In Visual Studio, open the settings of the plugin Extensions -> PVS-Studio -> Options -> Don't Check Files.
If use the C and C++ Compiler Monitoring UI utility, open Tools -> Option... -> Don't Check Files.
In the window that appears, you can specify the files and directories to be excluded from the analysis. You can also use wildcard masks.

Note that not all masks in the Visual Studio plugin can be applied to filter an existing report. If the mask is not applicable for filtering, you will receive a message stating that you need to restart analysis to apply the mask. Masks with the '*' character at the beginning and/or at the end are immediately applied to filter warnings in the plugin table.
You can read more about excluding files via the plugin settings for Visual Studio here.
You can also exclude files from analysis via the context menu in the analyzer's report. To do this, right click on the warning and select 'Don't check files and hide all messages from...'. In the drop-down menu, you can select the nesting level of directories from which files should be excluded.
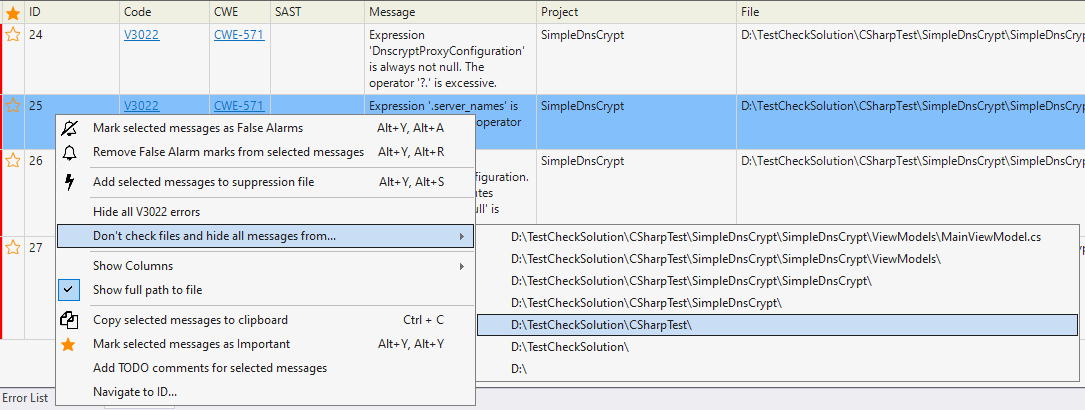
Note that information about excluded directories and files is written to the global Settings.xml file. That information can be used by other PVS-Studio tools if the path for the settings file is not passed to them.
Plugins for CLion and Rider
To exclude files or directories from analysis, open the PVS-Studio plugin settings (Tools -> PVS-Studio -> Settings) and select the Excludes section.

In this section, you can manage the paths and masks of file names that will be excluded from the analysis.
You can also exclude a file or a directory from the analysis directly through the context menu of the PVS-Studio report. To do this, right-click on the message and select 'Exclude From Analysis'. In the drop-down menu, you can select the nesting level of directories from which files should be excluded.

Note that information about excluded directories and files is written to the global Settings.xml file. That information can be used by other PVS-Studio tools if the path for the alternative settings file is not passed to them.
Excluding files via the Settings.xml file
Console tools can use either the global Settings.xml file or a specific one passed as a command line argument. A specific file can be useful if you have specific analysis settings for a project which should not affect the analysis results of other projects. For example, a list of excluded directories.
To create an alternative settings file, copy the Settings.xml file from the '%APPDATA%/PVS-Studio/' (Windows) or '~/.config/PVS-Studio' (Linux) directory to any place (for example, to the directory of the project being checked). Then add the excluded files and directories to the ApplicationSettings/PathMasks node (if it is a directory) or to ApplicationSettings/FileMasks (if it is a file).
For example:
<ApplicationSettings ...>
...
<PathMasks>
...
<string>\EU*\Engine\Source</string>
</PathMasks>
...
</ApplicationSettings>Now, use the ‑‑settings (-s) parameter to pass your custom settings file to PVS-Studio_Cmd.exe or pvs-studio-dotnet (Linux and macOS):
PVS-Studio_Cmd.exe -t ProjName.sln -s /path/to/NonDefaultSettings.xmlTo pass the parameter to CLMonitor.exe use the ‑‑settings (-t) flag in any launch mode:
CLMonitor.exe monitor -t /path/to/NonDefaultSettings.xmlExcluding files via the diagnostic configuration file (.pvsconfig)
You can create a file — .pvsconfig (analyzer diagnostics configuration file). In this file, you can use special comments to describe the files and directories to be excluded from analysis. Read more about the .pvsconfig file here.
To exclude a file or directory from analysis, all you need to do is specify its path or path mask — use the special //V_EXCLUDE_PATH comment.
For example:
//V_EXCLUDE_PATH C:\TheBestProject\ThirdParty
//V_EXCLUDE_PATH *\UE*\Engine\Source\*
//V_EXCLUDE_PATH *.autogen.csNow you can use the .pvsconfig file with PVS-Studio utilities:
For CLMonitor.exe, use the -c (‑‑pvsconfig) flag:
CLMonitor.exe analyze ... -c /path/to/.pvsconfigFor PVS-Studio_Cmd.exe and pvs-studio-dotnet, use the -C (‑‑rulesConfig) flag:
PVS-Studio_Cmd.exe -t target.sln -o PVS-Studio.log -C /path/to/.pvsconfig
pvs-studio-dotnet -t target.csproj -o PVS-Studio.log -C /path/to/.pvsconfigFor CompilerCommandsAnalyzer.exe (Windows) and pvs-studio-analyzer (Linux, macOS), use the -R (‑‑rules-config) flag:
CompilerCommandsAnalyzer analyze --cfg /path/to/PVS-Studio.cfg \
-R /path/to/.pvsconfigIf you use the C and C++ Compiler Monitoring UI utility, you can specify the path to the .pvsconfig file when you start monitoring:

PVS-Studio plugins (for Visual Studio, Rider) can automatically detect the .pvsconfig file if it is added to the Solution or project and has the .pvsconfig extension. Configuration files added to the Solution have a global scope and apply to all projects of this Solution. .pvsconfig files added to the project apply only to the project to which they are added.
For CompilerCommandsAnalyzer.exe and pvs-studio-analyzer utilities
If you use the pvs-studio-analyzer(Linux, macOS) / CompilerCommandsAnalyzer.exe (Windows) cross-platform utility, you can exclude files from analysis in the following ways.
Direct pass of excluded files and directories
You can exclude files from analysis by passing paths to them as launch arguments for pvs-studio-analyzer/CompilerCommandsAnalyzer.exe via the -e (‑‑exclude-path) flag:
pvs-studio-analyzer analyze ... -e /third-party/ \
-e /test/ \
-e /path/to*/exclude-pathWhen specifying a path, you can also use command shell templates (glob).
The *.cfg configuration file
Create a text file (for example, MyProject.cfg). Put a list of excluded directories in the text file via the exclude-path parameter.
Example:
exclude-path=/third-party/
exclude-path=*/test/*
exclude-path=*/lib-*/*Then run the analysis by passing the path to the configuration file via the ‑‑cfg flag:
pvs-studio-analyzer analyze ... --cfg ./MyProject.cfgYou can also add other launch parameters to the configuration file. Check out this page to get more information.
Using PVS-Studio extension for Visual Studio Code
You can view PVS-Studio reports in Visual Studio Code with the help of a special PVS-Studio extension. This documentation explains how to install the extension, start the project analysis, open the PVS-Studio report, and handle it.
Please note that you will first need to download and install the analyzer.
Installing PVS-Studio extension
To install the PVS-Studio extension, open Visual Studio Code and click the 'Extensions' tab. Then, type 'PVS-Studio' in the search box and click 'Install':

When installing the analyzer on Windows, you can select 'Integration with Visual Studio Code' and then the extension will be added to Visual Studio Code automatically.

You can also install the extension on Windows with the help of the pvs-studio-vscode-*.vsix file located in the PVS-Studio directory (%PROGRAMFILES(x86)%\PVS-Studio by default).
To install the plugin from the .vsix file, click the three dots in the upper right corner of the 'Extensions' tab. Then, select 'Install from VSIX...':

Select the .vsix file of the PVS-Studio plugin in the appeared window. After installing the plugin, restart Visual Studio Code.
You can also install the extension or download the .vsix file from the PVS-Studio page in the Visual Studio Marketplace.
After you install the extension, the PVS-Studio window appears as one of the tabs in the Visual Studio Code bottom panel. If the window is hidden, use the 'PVS-Studio: Show window' command in the command palette (Ctrl + Shift + P) to show it again.

Running analysis
You can run the analysis in several ways:
1. Using the 'Analyze project' button in the PVS-Studio window:

In this case, you run the analysis for the entire solution.
2. Using the context menu of the code editor:

In this case, you run the analysis for a single file. Please note: if you don't have this menu item, it indicates that analysis of the current file is not supported.
3. Using the File Explorer context menu:

In this case, you run the analysis for all supported files which have been selected. there is a folder among the selected items, the analyzer will run the analysis for all supported files and subfolders it contains.
4. Using the tab group menu of the editor:

In this case, you run the analysis for all supported files which are opened in the current tab group.
5. Using the 'Run regular analysis' and 'Run intermodular analysis' commands in the command palette (Ctrl+Shift+P):

Both commands are used to run the common analysis of the solution. The difference between them matters only when you analyze C and C++ code. In this mode, the analyzer performs deeper analysis but spends more time.
If the analyzer can't find a suitable target for analysis in the VS Code directory, you will receive the following message:

Otherwise, you may be prompted to set up parameters that are specific to analyze projects that use a particular build system. To learn more about analyzing a specific type of project, please consult the 'Analyzing C, C++ (CMake) projects', 'Analyzing C# (MSBuild) projects', and 'Analyzing Java projects' sections.
If the analysis is running successfully, the PVS-Studio window will look as follows:

The analysis progress is displayed in percentage in the upper-right corner of the window. If you need to stop the analysis, click 'Stop' button. The analyzer displays warnings in the table as they are received.
Analyzing C, C++ (CMake) projects
Install the CMake Tools extension for VSCode before running the analysis.
The plugin is compatible with the following generators:
- Ninja;
- Makefile Generators.
If an unsupported or missing generator is detected, a message prompts you to set this parameter in the CMake-Tools settings:

To open this settings window, click the 'Edit setting' button.

Before starting the analysis, you can select the type of analysis: intermodular analysis or regular analysis. The intermodular analysis takes longer than regular analysis but gives better results. To learn more about this mode, please consult the documentation.
When running the analysis, the analyzer also considers the contents of the '.PVS-Studio' folder in the project's source code directory. If the analyzer the user configuration files (with *.pvsconfig extension) or the suppress files (with *.suppress.json extension) are detected there, it will take them into account for further processing.
Note: at the moment, the PVS-Studio plugin for CMake supports the handling of only one suppress file. A special entry will appear in the report if multiple suppress files are found. It will also indicate which file is being used in the analysis.
Analyzing C# (MSBuild) projects
When analyzing the MSBuild solution for the first time, you will receive a message about creating a file in [workspace folder]/.PVS-Studio/MSBuildAnalyzerConfig.json where you can set some analysis settings that are similar to the console version of the analyzer.

Here are the suggested options:
- Edit opens a newly created file, does not start the analysis;
- Continue runs the analysis with default parameters;
- Cancel cancels the analysis running.
In this file, you can set the files and parameters to be used in the analysis:
- suppress files (with *.suppress.json);
- configuration files (with *.pvsconfig);
- platform and build configuration;
- particular projects (.csproj and .vcxproj) and files (.cs, .cpp, etc.) for analysis;
- other settings (you can find more information about these settings in the file and in the documentation.
Note: if you run the analysis for specific files via the context menu or tab group menu of the editor, PVS-Studio analyzes only files included in the selected solution.
Moreover, if a project file (a file with the .csproj extension) occurs among the analyzed files, PVS-Studio runs the analysis for all supported code files in this project.
Analyzing Java projects
Note: for the extension to recognize your project in an opened directory, install and enable the "Project manager for Java" extension in VS Code.
By default, the extension looks for the analyzer core in one of the following directories:
- "C:\Users\[User]\AppData\Roaming\PVS-Studio-Java (on Windows)";
- "~/.config/PVS-Studio-Java (on Linux and macOS)".
If the core is located in a different folder, specify the path to it in the extension settings (File > Preferences > Settings > PVS-Studio: Java Projects Analyzer)
To run the analyzer core, the JDK version 11-19 is required. By default, it uses the JDK, the path to which is set in the environment variables. If your JDK version is not in the range of supported ones, install a supported JDK and specify the path to it in the VS Code settings (File > Preferences > Settings > PVS-Studio: Java For Running Analyzer).
Before starting the analysis, we recommend using the "Java: Reload Projects" command from the command palette (Ctrl + Shift + P). If a drop-down list of your project modules appears after that, make sure that all the modules that you want to analyze are ticked.

Running analysis
When analyzing a project for the first time, you will receive a notification that a file has been created in "[workspace folder]/.PVS-Studio/JavaAnalyzerConfig.json". In the file, you can configure some analysis settings similar to those in the console version of the analyzer.
The following options are available:
- the Edit button opens the newly created file, no analysis is run;
- the Continue button runs analysis with default parameters;
- the Cancel button cancels the start of analysis (the file will not be created).
In this file, you can specify the parameters that will be included in the analysis, for example:
- The path to a suppress file (with the *.json extension);
- Enable/disable incremental analysis (disabled by default);
- Enable/disable the V6078 diagnostic rule, which detects potential API compatibility issues between the selected Java SE versions (versions are specified as separate parameters).
Handling analysis results
Converting PVS-Studio report to JSON format
Note: the PVS-Studio extension for Visual Studio Code supports reports in JSON format only. Depending on the type of checked project and the method of running the analysis, PVS-Studio can generate a report in several formats. To display the report in the extension, you need to convert it to JSON format.
To convert it, you can use command-line utilities: PlogConverter.exe for Windows and plog-converter for Linux and macOS. These utilities allow not only to convert the PVS-Studio report to different formats but also to additionally process it. For example, to filter warnings. You can read more about this here.
Here's an example of a command used to convert the PVS-Studio report to JSON format with the help of PlogConverter.exe (Windows):
PlogConverter.exe path\to\report.plog -t json ^
-n PVS-StudioHere's an example of a command used to convert the PVS-Studio report to JSON format with the help of plog-converter (Linux and macOS):
plog-converter path/to/report/file.plog -t json \
-o PVS-Studio.jsonViewing converted PVS-Studio report in VS Code
To view the report in Visual Studio Code, click 'Open report' on the PVS-Studio window and select the required file. You can also open the report by selecting 'PVS-Studio: Load Report' in the command palette (Ctrl+Shift+P).

After that, the warnings from the report will be displayed on the table:

For convenient work with the table, attach it to the panel. To do this, right-click the panel header and select "Keep 'PVS-Studio'".

To handle a report containing relative paths, you need to use the 'Source Tree Root' setting. To do this, open the 'Settings' window, select the 'Other' tab, click 'Browse', and select the directory relative to which all paths in the report file will be expanded.

Filtering warnings
PVS-Studio output window filtering mechanisms allow to quickly find and display diagnostic messages. They can be displayed separately and in groups. The window tools include a number of buttons that allow to enable or disable the display of warnings from their corresponding groups.
All buttons can be divided into 3 groups: filters by the warnings' levels of certainty, message filters by diagnostic groups, filters by keywords. You can filter warnings by the message code, by the message text, and by the file containing the analyzer message.
You can find a detailed description of the levels of certainty and groups of diagnostic rules in the following documentation section: "Getting acquainted with the PVS-Studio static code analyzer on Windows".
To switch the visibility of the filtering group, use the 'Column', 'Level', 'Group' buttons.

You can combine all of these warning filtering mechanisms with each other. For example, you can filter messages by the level and groups of displayed warnings, or exclude messages marked as false alarms, etc.
How to suppress warnings
When you run the analyzer for the first time to check a large project, there may be a lot of warnings. We recommend you to note the most interesting ones and hide the rest using the warning suppression mechanism.
To suppress all warnings, click 'Suppress All Messages' at the top right of the window:

When you click it, an additional window will appear asking you which warning messages you would like to suppress:
- Suppress All suppresses all the warnings in the table (even those that are hidden with filters and settings);
- Suppress Filtered suppresses only those warnings that are currently in the table.

To suppress warnings to an existing suppression file, select the preferred option. If the warning suppression file is not found, it will be created in the following directory: '%root_directory_of_a_project's_ source_code%/.PVS-Studio'.
If the suggested option doesn't work for you, you can use targeted warning suppression. To do this, select the necessary rows in the table, open the context menu, and select 'Add message to suppression file'.

Navigation and sorting
The PVS-Studio output window is primarily designed for easier code navigation. It also simplifies jumping to code fragments containing potential errors. Double-clicking on any of the warnings in the list will automatically open the file for which the analyzer issued a message.
To mark interesting warnings, for example, those that you want to view later, you can use the "asterisk" in the corresponding column.
Right-clicking on the table header opens a context menu where you can customize the displayed columns.

Other features
The table supports multiple selection with the help of standard 'Ctrl' and 'Shift' combinations. The context menu of the table of warnings contains several items:

- Mark as Favorite marks selected messages as favorites;
- Mark as False Alarm marks selected messages as false alarms and adds a special comment to the source code;
- Copy message copies the diagnostic number, the warning message, and the file for which the warning is issued to the clipboard;
- Exclude diagnostic excludes the display of all warnings with the same diagnostic number as the highlighted one;
- Exclude paths allows to exclude the path to the selected file or a part of this path. All warnings issued for files containing the selected path will not be shown.

The buttons on the right side of the panel are designed to start the analysis, to suppress warnings, to save the report, to open a new report, to open the extension settings. If a report contains some changes, the save report button will become red, as shown in the screenshot below.

Plugin settings
To open the settings window, click on the rightmost button of the PVS-Studio window, or use 'Ctrl+Shift+P' and type 'PVS-Studio: Show Settings'.
The 'Save settings' button saves the settings in JSON format. To load the saved settings, use the 'Load settings' button.
False alarms
In the 'False Alarms' tab, you can select whether to:
- show False Alarms or not;
- save the source files automatically when the warning is marked as False Alarm;
- add an additional message to false alarm commentary.

Columns
This tab allows you to mark columns that should be displayed in the table of warnings.
Diagnostics
The 'Diagnostics' tab allows to mark the warnings that should be displayed in the table of warnings. All warnings are divided into groups. To search for a specific diagnostic rule, you can use the 'Code and Messages' field. 'Check all/Uncheck all' are designed to enable/disable the display of all diagnostic rules from a certain group. When disabling all diagnostic rules from the corresponding group, the button of this group is removed from the corresponding filtering group in the PVS-Studio window.

Exclude paths
The 'Exclude paths' tab allows to enter paths or path masks in the 'New excluded path' field. Messages issued for files that meet the mask conditions will not be displayed in the table of warnings.
Analysis
The 'Analysis' tab provides the 'Timeout' field where you can enter the time in seconds after which the analysis will be interrupted. In the 'Thread Count' field, you can enter the number of the analyzer core processes running in parallel that will be involved in the analysis.
License
In the 'License' tab, you can enter the name and the key of your license. If you enter the valid data, you will see a message with the license data.

Other
Documentation language. The setting allows to set the language for the built-in documentation of PVS-Studio diagnostic rules available on our website.
This setting does not change the interface language of the PVS-Studio extension or the diagnostic messages issued by the analyzer.
Source Tree Root. To handle the PVS-Studio report containing relative file paths, you need to replace them with absolute ones. The setting allows to set the directory relative to which all paths in the report file are disclosed.
You can find a detailed description of using relative paths in the PVS-Studio report files here.
Tips on speeding up PVS-Studio
- Use a multi-core computer with a large amount of memory
- Use an SSD both for the system and the project to be analyzed
- Configure (or turn off) your antivirus
- In Visual Studio 2010 and 2012, if possible, use Clang as the preprocessor instead of Visual C++ (it can be chosen in the PVS-Studio settings)
- Exclude libraries you don't need from analysis (can be set in the PVS-Studio settings)
- Conclusion
Any static code analyzer works slower than a compiler. It is determined by the fact that the compiler must work very quickly, though to the detriment of analysis depth. Static analyzers have to store the parse tree to be able to gather more information. Storing the parse tree increases memory consumption, while a lot of checks turn the tree traverse operation into a resource-intensive and slow process. Well, actually it all is not so much crucial, since analysis is a rarer operation than compilation and users can wait a bit. However, we always want our tools to work faster. The article contains tips on how to significantly increase PVS-Studio's speed.
At first let's enumerate all the recommendations so that users learn right away how they can make the analyzer work faster:
- Use a multi-core computer with a large amount of memory.
- Use an SSD both for the system and the project to be analyzed.
- Configure (or turn off) your antivirus.
- If possible, use Clang as the preprocessor instead of Visual C++ (it can be chosen in the PVS-Studio settings) in Visual Studio 2010 and 2012.
- Exclude libraries you don't need from analysis (can be set in the PVS-Studio settings).
Let's consider all these recommendations in detail, explaining why they allow the tool to work faster.
Use a multi-core computer with a large amount of memory
PVS-Studio has been supporting multi-thread operation for a long time already (starting with version 3.00 released in 2009). Parallelization is performed at the file level. If analysis is run on four cores, the tool is checking four files at a time. This level of parallelism enables you to get a significant performance boost. Judging by our measurements, there is a marked difference between the four-thread and one-thread analysis modes of test projects. One-thread analysis takes 3 hours and 11 minutes, while four-thread analysis takes 1 hour and 11 minutes (these data were obtained on a four-core computer with 8 Gbytes of memory). That is, the difference is 2.7 times.
It is recommended that you have at least one Gbyte of memory for each analyzer's thread. Otherwise (when there are many threads and little memory), the swap file will be used, which will slow down the analysis process. If necessary, you may restrict the number of the analyzer's threads in the PVS-Studio settings: Options -> Common Analyzer Settings -> Thread Count (documentation). By default, the number of threads launched corresponds to the number of cores available in the system.
We recommend that you use a computer with four cores and eight Gbytes of memory or better.
Use an SSD both for the system and the project to be analyzed
Strange as it may seem, a slow hard disk is a bottleneck for the code analyzer's work. But we must explain the mechanism of its work for you to understand why it is so. To analyze a file, the tool must first preprocess it, i.e. expand all the #define's, include all the #include's and so on. The preprocessed file has an average size of 10 Mbytes and is written on the disk into the project folder. Only then the analyzer reads and parses it. The file's size is growing because of that very inclusion of the contents of the #include-files read from the system folders.
I can't give exact results of measuring the influence of an SSD on the analysis speed because you have to test absolutely identical computers with only hard disks different. But visually the speed-up is great.
Configure (or turn off) your antivirus
Judging by the character of its work, the analyzer is a complex and suspicious program from the viewpoint of an antivirus. Let's specify right away that we don't mean that the analyzer is recognized as a virus - we check this regularly. Besides, we use a code certificate signature. Let's go back to description of the code analyzer's work.
For each file being analyzed a separate analyzer's process is run (the PVS-Studio.exe module). If a project contains 3000 files, the same number of PVS-Studio.exe's instances will be launched. PVS-Studio.exe calls Visual C++ environment variable setting (files vcvars*.bat) for its purposes. It also creates a lot of preprocessed files (*.i) (one for each file being compiled) for the time of its work. Auxiliary command (.cmd) files are being used.
Although all these actions are not a virus activity, it still makes any antivirus spend many resources on meaningless check of the same things.
We recommend that you add the following exceptions in the antivirus's settings:
- Do not scan system folders with Visual Studio:
- C:\Program Files (x86)\Microsoft Visual Studio 11.0
- C:\Program Files (x86)\Microsoft Visual Studio 12.0
- C:\Program Files (x86)\Microsoft Visual Studio 14.0
- etc.
- Do not scan the PVS-Studio folder:
- C:\Program Files (x86)\PVS-Studio
- Do not scan the project folder:
- For example, C:\Users\UserName\Documents\MyProject
- Do not scan Visual Studio .exe files:
- C:\Program Files (x86)\Microsoft Visual Studio 11.0\Common7\IDE\devenv.exe
- C:\Program Files (x86)\Microsoft Visual Studio 12.0\Common7\IDE\devenv.exe
- C:\Program Files (x86)\Microsoft Visual Studio 14.0\Common7\IDE\devenv.exe
- etc.
- Do not scan the cl.exe compiler's .exe files (of different versions):
- C:\Program Files (x86)\Microsoft Visual Studio 11.0\VC\bin\cl.exe
- C:\Program Files (x86)\Microsoft Visual Studio 11.0\VC\bin\x86_amd64\cl.exe
- C:\Program Files (x86)\Microsoft Visual Studio 11.0\VC\bin\amd64\cl.exe
- C:\Program Files (x86)\Microsoft Visual Studio 12.0\VC\bin\cl.exe
- C:\Program Files (x86)\Microsoft Visual Studio 12.0\VC\bin\x86_amd64\cl.exe
- C:\Program Files (x86)\Microsoft Visual Studio 12.0\VC\bin\amd64\cl.exe
- C:\Program Files (x86)\Microsoft Visual Studio 14.0\VC\bin\cl.exe
- C:\Program Files (x86)\Microsoft Visual Studio 14.0\VC\bin\x86_amd64\cl.exe
- C:\Program Files (x86)\Microsoft Visual Studio 14.0\VC\bin\amd64\cl.exe
- etc.
- Do not scan PVS-Studio and Clang .exe files (of different versions):
- C:\Program Files (x86)\PVS-Studio\x86\PVS-Studio.exe
- C:\Program Files (x86)\PVS-Studio\x86\clang.exe
- C:\Program Files (x86)\PVS-Studio\x64\PVS-Studio.exe
- C:\Program Files (x86)\PVS-Studio\x64\clang.exe
Perhaps this list is too excessive but we give it in this complete form so that you know regardless of a particular antivirus what files and processes do not need to be scanned.
Sometimes there can be no antivirus at all (for instance, on a computer intended specially to build code and run a code analyzer). In this case the speed will be the highest. Even if you have specified the above mentioned exceptions in your antivirus, it still will spend some time on scanning them.
Our test measurements show that an aggressive antivirus might slow down the code analyzer's work twice or more.
In Visual Studio 2010 and 2012, if possible, use Clang as the preprocessor instead of Visual C++ (it can be chosen in the PVS-Studio settings)
An external preprocessor is being used to preprocess source files before PVS-Studio analysis. When working from under Visual Studio IDE, the native Microsoft Visual C++ preprocessor, cl.exe, is used by default. In 4.50 version of PVS-Studio, the support for the Clang independent preprocessor had been added, as it lacks some of the Microsoft's preprocessor shortcomings (although it also possesses issues of its own).
In some of the older versions of Visual Studio (namely, 2010 and 2012), the cl.exe preprocessor is significantly slower than clang. Using Clang preprocessor with these IDEs provides an increase of operational performance by 1.5-1.7 times in most cases.
However, there is an aspect that should be considered. The preprocessor to be used can be specified from within the 'PVS-Studio|Options|Common Analyzer Settings|Preprocessor' field (documentation). The available options are: VisualCPP, Clang and VisualCPPAfterClang. The first two of these are self-evident. The third one indicates that Clang will be used at first, and if preprocessing errors are encountered, the same file will be preprocessed by the Visual C++ preprocessor instead.
If your project is analyzed with Clang without any problems, you may use the default option VisualCPPAfterClang or Clang - it doesn't matter. But if your project can be checked only with Visual C++, you'd better specify this option so that the analyzer doesn't launch Clang in vain trying to preprocess your files.
Exclude libraries you don't need from analysis (can be set in the PVS-Studio settings)
Any large software project uses a lot of third-party libraries such as zlib, libjpeg, Boost, etc. Sometimes these libraries are built separately, and in this case the main project has access only to the header and library (lib) files. And sometimes libraries are integrated very firmly into a project and virtually become part of it. In this case the main project is compiled together with the code files of these libraries.
The PVS-Studio analyzer can be set to not check code of third-party libraries: even if there are some errors there, you most likely won't fix them. But if you exclude such folders from analysis, you can significantly enhance the analysis speed in general.
It is also reasonable to exclude code that surely will not be changed for a long time from analysis.
To exclude some folders or separate files from analysis use the PVS-Studio settings -> Don't Check Files (documentation).
To exclude folders you can specify in the folder list either one common folder like c:\external-libs, or list some of the folders: c:\external-libs\zlib, c:\external-libs\libjpeg, etc. You can specify a full path, a relative path or a mask. For example, you can just specify zlib and libjpeg in the folder list - this will be automatically considered as a folder with mask *zlib* and *libjpeg*. To learn more, please see the documentation.
Conclusion
Let's once again list the methods of speeding up PVS-Studio:
- Use a multi-core computer with a large amount of memory.
- Use an SSD both for the system and the project to be analyzed (Update: for PVS-Studio versions 5.22 and above, deploying the project itself on SSD does not improve the overall analysis time).
- Configure (or turn off) your antivirus.
- If possible, use Clang as the preprocessor instead of Visual C++ (it can be chosen in the PVS-Studio settings) in Visual Studio 2010 and 2012.
- Exclude libraries you don't need from analysis (can be set in the PVS-Studio settings).
The greatest effect can be achieved when applying a maximum number of these recommendations simultaneously.
PVS-Studio: troubleshooting
- The basic PVS-Studio's operation principles you should know
- I can't check a file/project with the IDE PVS-Studio plugin
- Source files are preprocessed incorrectly when running analysis from the IDE plugin. Error V008
- IDE plugin crashes and generates the 'PVS-Studio internal error' message
- Unhandled IDE crash when utilizing PVS-Studio
- PVS-Studio.exe crash
- The V001/V003 errors
- The analyzer cannot locate errors in an incorrect code or generates too many false positives
- Issues with handling PVS-Studio analysis report from within the IDE plugin
- Code analysis running from the IDE plugin is slow. Not all the logical processors are being utilized
- I get the message "Files with C or C++ source code for analysis not found." when checking a group of projects or one C/C++ project
- Errors of the "Cannot open include file", "use the /MD switch for _AFXDLL builds" kinds on projects that could be successfully compiled in Visual Studio. Insertion of incorrect precompiled headers during preprocessing
- 'PVS-Studio is unable to continue due to IDE being busy' message under Windows 8. 'Library not registered' errors
- Cannot check a Unity project due to an error: The solution file has two projects named "UnityEngine.UI"
- Incorrect path to the imported file causes an emergency shutdown of PVS-Studio_Cmd.exe
- "GC overhead limit exceeded" occurs or analysis aborts by timeout
- Unable to start the analysis (V06X errors occur)
The basic PVS-Studio's operation principles you should know
PVS-Studio is composed of 2 basic components: the command-line analyzer (PVS-Studio.exe) and an IDE plugin through which the former is integrated into one of the supported development environments (Microsoft Visual Studio). The way command-line analyzer operates is quite similar to that of a compiler, that is, each file being analyzed is assigned to a separate analyzer instance that, in turn, is called with parameters which, in particular, include the original compilation arguments of the source file itself. Afterwards, the analyzer invokes a required preprocessor (also in accordance with the one that is used to compile the file being analyzed) and then analyzes the resulting temporary preprocessed file, i.e. the file in which all of the include and define directives were expanded.
Thus, the command-line analyzer - just like a compiler (for example Visual C++ cl.exe compiler) - is not designed to be used directly by the end user. To continue with the analogy, compilers in most cases are employed indirectly, through a special build system. Such a build system prepares launch parameters for each of the file to be built and also usually optimizes the building process by parallelizing it among all the available logic processors. The IDE PVS-Studio plugin operates in a similar fashion.
However, IDE plug-in is not the only method for the employment of PVS-Studio.exe command line analyzer. As mentioned above, the command-line analyzer is very similar to a compiler regarding its usage principles. Therefore, it can be directly integrated, if necessary, into a build system along with a compiler. This way of using the tool may be convenient when dealing with a build scenario which is not supported by PVS-Studio - for example, when utilizing a custom-made build system or an IDE other than Visual Studio. Note that PVS-Studio.exe supports analysis of source files intended to be compiled with gcc, clang, and cl compilers (including the support for specific keywords and constructs).
For instance, if you build your project in the Eclipse IDE with gcc, you can integrate PVS-Studio into your makefile build scripts. The only restriction is that PVS-Studio.exe can only operate under Windows NT operating systems family.
Besides IDE plugins, our distribution kit also includes a plugin for the Microsoft MSBuild build system which is utilized by Visual C++ projects in the Visual Studio IDE starting with version 2010. Don't confuse it with the plugin for the Visual Studio IDE itself!
Thus, you can analyze projects in Visual Studio (version 2010 or higher) in two different ways: either directly through our IDE plugin, or by integrating the analysis process into the build system (through the plugin for MSBuild). Of course, nothing prevents you, if the need arises, from creating your own static analysis plugin, be it for MSBuild or any other build system, or even integrating PVS-Studio.exe's call directly, if possible, into build scripts like in the case of makefile-based ones.
I can't check a file/project with the IDE PVS-Studio plugin
If PVS-Studio plug-in generates the message "C/C++ source code was not found" for your file, make sure that the file you are trying to analyze is included into the project for the build (PVS-Studio ignores files excluded from the build). If you get this message on the whole project, make sure that the type of your C/C++ project is supported by the analyzer. In Visual Studio, PVS-Studio supports only Visual C++ projects for versions 2005 and higher, as well as their corresponding MSBuild Platform Toolsets. Project extensions using other compilers (for example projects for the C++ compiler by Intel) or build parameters (Windows DDK drivers) are not supported. Despite the fact that the command-line analyzer PVS-Studio.exe in itself supports analysis of the source code intended for the gcc/clang compilers, IDE project extensions utilizing these compilers are not supported.
If your case is not covered by the ones described above, please contact our support service. If it is possible, please send us the temporary configuration files for the files you are having troubles with. You can get them by setting the option 'PVS-Studio -> Options -> Common Analyzer Settings -> Remove Intermediate Files' to 'False'. After that, the files with the name pattern %SourceFilename.cpp%.PVS-Studio.cfg will appear in the same directory where your project file (.vcxproj) is located. If possible, create an empty test project reproducing your issue and send it to us as well.
Source files are preprocessed incorrectly when running analysis from the IDE plugin. Error V008
If, having checked your file/project, PVS-Studio generates the V008 message and/or a preprocessor error message (by clang/cl preprocessors) in the results window, make sure that the file(s) you are trying to analyze can be compiled without errors. PVS-Studio requires compilable C/C++ source files to be able to operate properly, while linking errors do not matter.
The V008 error means that preprocessor returned a non-zero exit code after finishing its work. The V008 message is usually accompanied by a message generated by a preprocessor itself describing the reason for the error (for example, it failed to find an include file). Note that, for the purpose of optimization, our Visual Studio IDE plugin utilizes a special dual-preprocessing mode: it will first try to preprocess the file with the faster clang preprocessor and then, in case of a failure (clang doesn't support certain Visual C++ specific constructs), launches the standard cl.exe preprocessor. If you get clang's preprocessing errors, try setting the plugin to use only the cl.exe preprocessor (PVS-Studio -> Options -> Common Analyzer Settings -> Preprocessor).
Sometimes the analyzer issues V008 warnings when paths to source code files are very long. If you are using Windows, try to increase the maximum path length. To see how to do this, click here.
If you are sure that your files can be correctly built by the IDE/build system, perhaps the reason for the issue is that some compilation parameters are incorrectly passed into the PVS-Studio.exe analyzer. In this case, please contact our support service and send us the temporary configuration files for these files. You can get them by setting the option 'PVS-Studio -> Options -> Common Analyzer Settings -> Remove Intermediate Files' to 'False'. After that, files with the name pattern %SourceFilename.cpp%.PVS-Studio.cfg will appear in the same directory where your project file is located. If possible, create an empty test project reproducing your issue and send it to us as well.
IDE plugin crashes and generates the 'PVS-Studio internal error' message
If plugin crashes and generates the dialog box entitled 'PVS-Studio Internal Error', please contact our support service and send us the analyzer's crash stack (you can obtain it from the crash dialog box).
If the issue occurs regularly, then please send us the plugin's trace log together with the crash stack. You can obtain the trace log by enabling the tracing mode through the 'PVS-Studio -> Options -> Specific Analyzer Settings -> TraceMode (Verbose mode)' setting. The trace log will be saved into the default user directory Application Data\Roaming\PVS-Studio under the name PVSTracexxxx_yyy.log, where xxxx is PID of the process devenv.exe / bds.exe, while yyy is the log number for this process.
Unhandled IDE crash when utilizing PVS-Studio
If you encounter regular crashes of your IDE which are presumably caused by PVS-Studio's operation, please check the Windows system event logs (in the Event Viewer) and contact our support service to provide us with the crash signature and stack (if available) for the application devenv.exe \ bds.exe (the 'Error' message level) which can be found in the Windows Logs -> Application list.
PVS-Studio.exe crash
If you encounter regular unhandled crashes of the PVS-Studio.exe analyzer, please repeat the steps described in the section "IDE crashes when PVS-Studio is running", but for the PVS-Studio.exe process.
The V001/V003 errors
The error V003 actually means that PVS-Studio.exe has failed to check the file because of a handled internal exception. If you discover V003 error messages in the analyzer log, please send us an intermediate file (an i-file containing all the expanded include and define directives) generated by the preprocessor for the file that triggers the v003 error (you can find its name in the file field). You can get this file by setting the 'PVS-Studio -> Options -> Common Analyzer Settings -> Remove Intermediate Files' option to 'False'. Intermediate files with the name pattern SourceFileName.i will appear, after restarting the analysis, in the directory of the project that you are checking (i.e. in the same directory where the vcproj/vcxproj/cbproj files are located).
The analyzer may sometimes fail to perform a complete analysis of a source file. It is not always the analyzer's fault - see the documentation section on the V001 error to learn more about this issue. No matter what was the cause of a V001 message, it is usually not critical. Incomplete file parsing is insignificant from the analysis viewpoint. PVS-Studio simply skips a function/class with an error and continues with the analysis. It's only a very small portion of code which is left unchecked. If this portion contains fragments you consider relevant, you may send us an i-file for this source file as well.
The analyzer cannot locate errors in an incorrect code or generates too many false positives
If it seems to you that the analyzer fails to find errors in a code fragment that surely contains them or, on the contrary, generates false positives for a code fragment which you believe to be correct, please send us the preprocessor's temporary file. You can get it by setting the 'PVS-Studio -> Options -> Common Analyzer Settings -> Remove Intermediate Files' option to 'False'. Intermediate files with the name pattern SourceFileName.i will appear, after you restart the analysis, in the directory of the project you are checking (i.e. in the same directory where ycproj/vcxproj/cbproj files are located). Please attach the source file's code fragment that you have issues with as well.
We will consider adding a diagnostic rule for your sample or revise the current diagnostics to reduce the number of false positives in your code.
Issues with handling PVS-Studio analysis report from within the IDE plugin
If you encounter any issues when handling the analyzer-generated log file within the window of our IDE plugin, namely: navigation on the analyzed source files is performed incorrectly and/or these files are not available for navigation at all; false positive markers or comments are added in wrong places of your code, and the like - please contact our support service to provide us with the plugin's trace log. You can get it by enabling the tracing mode through the 'PVS-Studio -> Options -> Specific Analyzer Settings -> TraceMode' option (Verbose mode). The trace log will be saved into the default user directory Application Data\Roaming\PVS-Studio under the name PVSTracexxxx_yyy.log, where xxxx is PID of the devenv.exe / bds.exe process, while yyy is the log number for this process.
Also, if it is possible, create an empty test project reproducing your trouble and attach it to the letter too.
Code analysis running from the IDE plugin is slow. Not all the logical processors are being utilized
The PVS-Studio plugin can parallelize code analysis at the level of source files, that is, you can have analysis for any files you need to check (even within one project) running in parallel. The plugin by default sets the number of threads into which the analysis process is parallelized according to the number of processors in your system. You may change this number through the option PVS-Studio -> Options -> Common Analyzer Settings -> ThreadCount.
If it seems to you that not all of the available logical processors in your system are being utilized, you can increase the number of threads used for parallel analysis. But keep in mind that static analysis, unlike compilation, requires a large amount of memory: each analyzer instance needs about 1.5 Gbytes.
If your system, even though possessing a multi-core processor, doesn't meet these requirements, you may encounter a sharp performance degradation caused by the analyzer having to rely on a swap file. In this case, we recommend you to reduce the number of parallel threads of the analyzer to meet the requirement of 1.5 Gbytes per thread, even if this number is smaller than the number of processor cores in your system.
Keep in mind that when you have many concurrent threads, your HDD, which stores temporary preprocessed *.i files, may become a bottleneck itself, as these files may grow in size quite quickly. One of the methods to significantly reduce the analysis time is to utilize SSD disks or a RAID array.
A performance loss may also be caused by poorly configured antivirus software. Because the PVS-Studio plugin launches quite a large number of analyzer and the cmd.exe instances, your antivirus may find this behavior suspicious. To optimize the analysis time, we recommend you to add PVS-Studio.exe, as well as all of the related directories, to the exceptions list of your antivirus or disable real-time protection while the analysis is running.
If you happen to utilize the Security Essentials antivirus (which has become a part of Windows Defender starting with Windows 8), you may face a sharp performance degradation on certain projects/configurations. Please refer to this article on our blog for details concerning this issue.
I get the message "Files with C or C++ source code for analysis not found." when checking a group of projects or one C/C++ project
Projects excluded from the general build in the Configuration Manager window of the Visual Studio environment are not analyzed.
For the PVS-Studio analyzer to analyze C/C++ projects correctly, they must be compilable in Visual C++ and buildable without errors. That's why when checking a group of projects or an individual project, PVS-Studio will check only those projects which are included into the general build.

Projects excluded from the build won't be analyzed. If none of the projects is included into the build or you try to analyze one project that was not included into the build, the message "Files with C or C++ source code for analysis not found" will be generated, and analysis won't start. Use the Configuration Manager for the current Visual Studio solution to see which projects are included and which are excluded from the general build.
Errors of the "Cannot open include file", "use the /MD switch for _AFXDLL builds" kinds on projects that could be successfully compiled in Visual Studio. Insertion of incorrect precompiled headers during preprocessing
If you are encountering errors with missing includes, incorrect compiler switches (for example, the /MD switch) or macros while running static analysis on a project which can be compiled in Visual Studio IDE without such errors, then it is possible that this behavior is a manifestation of an incorrect precompiled header files being inserted during the preprocessing.
This issue arises because of the divergent behavior of Visual C++ compiler (cl.exe) in its' compiler and preprocessor modes. During a normal build, the compiler operates in the "regular" mode (i.e. the compilation results in the object, binary files). However, to perform static analysis, PVS-Studio invokes the compiler in the preprocessor mode. In this mode the compiler performs the expansion of macros and include directives.
But, when the compiled file utilizes a precompiled header, the compiler will use a header itself when it encounters the #include directive. It will use the previously generated pch file instead. However, in the preprocessing mode, the compiler will ignore the precompiled pch entirely and will try expanding such #include in a "regular way", i.e. by inserting the contents of the header file in question.
It is a common practice to use precompiled headers with the same name in multiple projects (the most common one being stdafx.h). This, because of the disparities in the compiler behavior described earlier, often leads to the header from an incorrect project being included into the source file. There are several reasons why this can happen. For example, a correct pch is specified for a file, but the Includes contain several paths containing several different stdafx.h files, and the incorrect one possesses a higher priority for being included (that is, its' include path occurs earlier on the compiler's command line). Another possible scenario is the one in which several projects include the same C++ source file. This file could be built with different options in different projects, and it uses the different pch files as well. But since this is just a single file in your file system, one of the stdafx.h files from one of the projects it is included into could be located in the same directory as the source file itself. And if the stdafx.h is included into this source file by the #include directive using the quotes, then the preprocessor will always use the header file from the same directory as this file, regardless of the includes passed through the command line.
Insertion of the incorrect precompiled header file will not always lead to the preprocessing errors. However, if one of the projects, for example, utilized MFC, and the other one is not, ore the projects possess a different set of Includes, the precompiled headers will be incompatible, and one of the preprocessing errors described in the title of this section will occur. As a result, you will not be able to perform static analysis on such a file.
Unfortunately, it is impossible to bypass this issue on the analyzer's side, as it concerns the external preprocessor, that is, the cl.exe. If you are encountering it on one of your projects, then it is possible to solve it by one of the methods described below, depending on the causes that lead to it.
In case the precompiled header was incorrectly inserted because of the position of its' include path on the compiler's command line, you can simply move a path for the correct header file to the first position on the command line.
If the incorrect header file was inserted because of its' location in the same directory as the source file into which it is included, then you can use the #include directive with pointy brackets, for example:
#include <stdafx.h>While using this form, the compiler will ignore the files form the current directory when it performs the insertion.
'PVS-Studio is unable to continue due to IDE being busy' message under Windows 8. 'Library not registered' errors
When checking large (more than 1000 source files) projects with PVS-Studio under Windows 8, while using Visual Studio 2010 or newer versions, sometimes the errors of the 'Library not registered' kind can appear or analyzer can even halt the analysis process altogether with 'PVS-Studio is unable to continue due to IDE being busy' message.
Such errors can be caused by several factors: incorrect installation of Visual Studio and compatibility conflicts between different versions of IDE present within a system. Even if your system currently possesses a single IDE installation, but a different version was present in the past, it is possible that this previous version was uninstalled incorrectly or incompletely. In particular, the compatibility conflict can arise from simultaneously having installations of one of Visual Studio 2010\2012\2013\2015\2017\2019\2022 and Visual Studio 2005 and\or 2008 on your system.
Unfortunately, PVS-Studio is unable to 'work around' these issues by itself, as they are caused by conflicts in COM interfaces, which are utilized by Visual Studio API. If you are one of such issues, then you have several different ways of dealing with it. Using PVS-Studio under a system with a 'clean' Visual Studio installation should resolve the issue. However, if it not an option, you can try analyzing your project in several go's, part by part. It is also worth noting that the issue at hand most often arises in the situation when PVS-Studio performs analysis simultaneously with some other IDE background operation (for example, when IntelliSense performs #include parsing). If you wait for this background operation to finish, then it will possibly allow you to analyze your whole project.
Another option is to use alternative methods of running the analyzer to check your files. You can check any project by using the compiler monitoring mode from C and C++ Compiler Monitoring UI (Standalone.exe).
After installing Visual Studio IDE on a machine with a previously installed PVS-Studio analyzer, the newly installed Visual Studio version lacks the 'PVS-Studio' menu item
Unfortunately, the specifics of Visual Studio extensibility implementation prevents PVS-Studio from automatically 'picking up' newly installed Visual Studio in case it happened after the installation of PVS-Studio itself.
Here is an example of such a situation. Let's assume that before the installation of PVS-Studio, the machine have only Visual Studio 2013 installed on it. After installing the analyzer, Visual Studio 2013 menu will contain the 'PVS-Studio' item (if the corresponding option was selected during the installation), which allows you to check your projects in this IDE. Now, if Visual Studio 2015 is installed on this machine next (after PVS-Studio was already installed), the menu of this IDE version will not contain 'PVS-Studio' item.
In order to add analyzer IDE integration to the newly installed Visual Studio, it is necessary to re-launch PVS-Studio installer (PVS-Studio_Setup.exe file). If you do not have this file already, you can download it from our site. The checkbox besides the required IDE version on the Visual Studio selection installer page will be enabled after the corresponding Visual Studio version is installed.
Cannot check a Unity project due to an error: The solution file has two projects named "UnityEngine.UI"
For details on what caused the problem and how to fix it, see this article.
Incorrect path to the imported file causes an emergency shutdown of PVS-Studio_Cmd.exe
Sometimes PVS-Studio can incorrectly calculate the Visual Studio version needed for the analysis. This can lead to the analyzer's emergency shutdown with various errors.
Here's an example:
Can't reevaluate project MyProj.vcxproj with parameters: Project ToolsVersion 'Current'; PlatformToolset 'v142'. Previous evaluation error: 'The imported project "C:\Program Files (x86)\Microsoft Visual Studio\2019\Community\MSBuild\Microsoft\VC\v170\Microsoft.Cpp.Default.props" was not found.
As you can see from the message, PVS-Studio incorrectly formed the path to Microsoft.Cpp.Default.props. An incorrect fragment is in bold. v170 is used for Visual Studio 2022. Here we need Visual Studio 2019, and the correct fragment would be v160.
This problem may appear for a variety of reasons. Here's some of them:
- incorrect value of the VisualStudioVersion environment variable;
- some Visual Studio files left when it was incorrectly deleted;
- the project is not built by the required Visual Studio version.
Setting the correct value of the VisualStudioVersion environment variable can help with solving problems. For example, Visual Studio 2019 corresponds to 16.0, and Visual Studio 2022 – 17.0.
If you use the plugin for Visual Studio, the error is unlikely to occur. When you run the analysis from the IDE, the desired value is written to VisualStudioVersion automatically.
"GC overhead limit exceeded" occurs or analysis aborts by timeout
The insufficient memory problem can be solved by increasing the available amount of memory and stack.
Plugin for Maven:
<jvmArguments>-Xmx4096m, -Xss256m</jvmArguments>
Plugin for Gradle:
jvmArguments = ["-Xmx4096m", "-Xss256m"]
Plugin for IntelliJ IDEA:
1) Tools -> PVS-Studio -> Settings
2) Environment tab -> JVM arguments
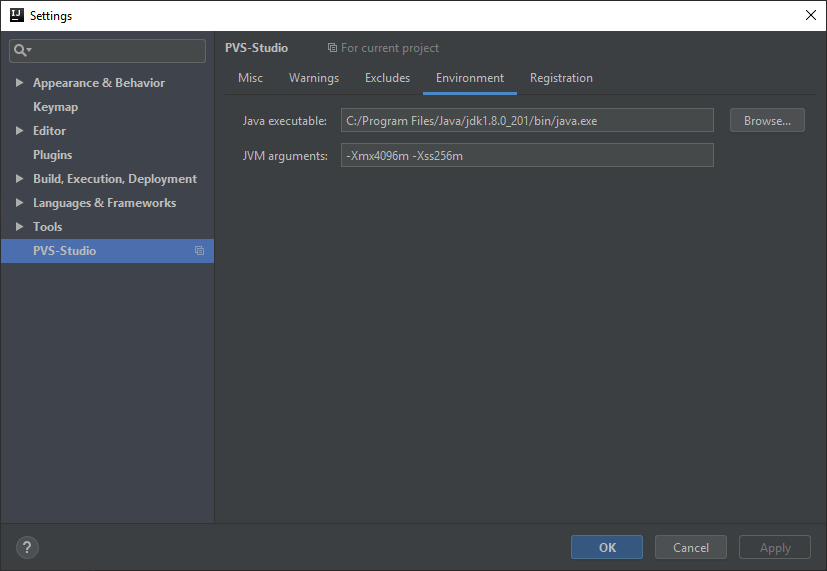
Typically, the default amount of memory may be insufficient when analyzing some generated code with a large number of nested constructs.
It's probably better to exclude that code from analysis (using exclude), to speed it up.
Unable to start the analysis (V06X errors occur)
If you are unable to run the analysis, please contact our support and attach *.json files from the .PVS-Studio directory (located in the project directory).
Additional configuration of C and C++ diagnostic rules
- Enforcing diagnostic rules on Unreal Engine projects
- A function can/cannot return null pointer
- Configuration of the assert() macro handling
- An alias for a system function
- Custom formatted IO function
User annotations are special comments that can be specified in the source code for additional diagnostic rules configuration. An annotation can be found at one of the following locations:
- In the analyzed file (*.c, *.cpp, *.cxx, ....). The annotation will be applied only within the context of this file.
- In the header file (*.h, *.hxx, ....). The annotation will be applied to all analyzed files that include this header file.
- In the diagnostic rules configuration file (.pvsconfig). The annotation will be applied to all analyzed files of a project/solution.
User annotations that change the behavior of diagnostic rules are listed below. This functionality is available only for the C and C++ analyzer. User annotations given in this section are omitted when analyzing projects written in other programming languages.
Note. By default, user annotations are not applied to virtual functions. Here you can learn how to enable it.
Enforcing diagnostic rules on Unreal Engine projects
When you check the project based on Unreal Engine, the analyzer applies diagnostic rules (for example, V1100 and V1102) that detect errors typical for UE projects. PVS-Studio applies the diagnostic rules only when it detects header files from the directory containing UE source code.
If a project contains compilable files that do not have such header files, the diagnostic rules are not applied, even if they are enabled. This way, the analyzer avoids generating irrelevant warnings for projects that do not use UE.
If you want to enforce a set of diagnostic rules on an arbitrary compilable file or a group of files, add the following comment:
//V_TREAT_AS_UNREAL_ENGINE_FILEA function can/cannot return null pointer
There are many system functions that can return a null pointer under certain conditions. Functions like 'malloc', 'realloc', and 'calloc' are good examples. These functions return 'NULL' when they fail to allocate a buffer of the specified size.
Sometimes you may want to change the analyzer's behavior and make it think, for example, that 'malloc' cannot return a null pointer. For example, this might be handy if the user employs system libraries that handle out-of-memory errors in a specific way.
An opposite scenario is also possible. The user may help the analyzer and specify that a certain system or user-declared function can return a null pointer.
With user annotations, you can specify whether a function can or cannot return a null pointer.
- V_RET_NULL— the function can return a null pointer
- V_RET_NOT_NULL — the function cannot return a null pointer
Annotation format:
//V_RET_[NOT]_NULL, function: [namespace::][class::]functionName- The 'function' key — after ':', insert the full name of the function. It consists of the namespace name, the class name, and the function name. Namespace and/or class are optional.
For example, the user wants to specify to the analyzer that the 'Foo' function of the 'Bar' class within the 'Space' namespace cannot return a null pointer. Then the annotation looks like this:
//V_RET_NOT_NULL, function: Space::Bar::FooUser annotations support nested namespaces and nested classes. Suppose the 'Space2' namespace is within the 'Space1' namespace. The 'Bar1' class is within the 'Space2' namespace. The 'Bar2' class is within the 'Bar1' class. The 'Bar2' class has the 'Foo' member function, which can't return a null pointer. Then you can annotate this function the following way:
//V_RET_NOT_NULL, function: Space1::Space2::Bar1::Bar2::FooFor system functions, the annotation can be located at the global header file (for example, at the precompiled header), or at the diagnostic rules configuration file.
For clarity, let's look at two examples of system function annotations.
The function does not return a null pointer:
//V_RET_NOT_NULL, function:mallocNow the analyzer thinks that the 'malloc' function cannot return a null pointer and, therefore, will not issue the V522 warning for the following code:
int *p = (int *)malloc(sizeof(int) * 100);
p[0] = 12345; // okThe function returns a pointer that can be null:
//V_RET_NULL, function: Memory::QuickAllocWith this comment, the analyzer starts issuing a warning for the following code:
char *p = Memory::QuickAlloc(strlen(src) + 1);
strcpy(p, src); // Warning!In projects with special quality requirements, you may need to find all functions that return a pointer. For this purpose, use the following comment:
//V_RET_NULL_ALLWe don't recommend using this annotation as it causes too many warnings to be issued. However, if you require this for your project, you can add the return pointer check for all such functions in your code using this specific comment.
Configuration of the assert() macro handling
By default, the analyzer equally checks the code where the 'assert' macro is present regardless of the project's configuration (Debug, Release, ...). So, the analyzer does not take into account that code execution is interrupted if there is a false condition.
To set another analyzer behavior, use the following comment:
//V_ASSERT_CONTRACTPlease note that in this mode, the analysis results may differ depending on the way the macro is expanded in the project configuration being checked.
Let's look at this example to make it clear:
MyClass *p = dynamic_cast<MyClass *>(x);
assert(p);
p->foo();The 'dynamic_cast' operator can return the 'nullptr' value. Thus, in the standard mode, the analyzer issues a warning on the possible null pointer dereference when calling the 'foo' function.
But if you add the '//V_ASSERT_CONTRACT' comment, the warning will be gone.
You can also specify the name of the macro which the analyzer will handle in the same way it handles 'assert'. To do this, use the following annotation:
//V_ASSERT_CONTRACT, assertMacro:[MACRO_NAME]The 'assetMacro' key is the name of the macro that the analyzer handles similarly to 'assert'. Instead of '[MACRO_NAME]', insert the name of the annotated macro.
Example:
//V_ASSERT_CONTRACT, assertMacro:MY_CUSTOM_MACRO_NAMENow the analyzer processes the 'MY_CUSTOM_MACRO_NAME' macro as 'assert'.
If you need to specify multiple macro names, add the separate '//V_ASSERT_CONTRACT' directive for each of them.
An alias for a system function
Some projects use custom implementations of various system functions, such as 'memcpy', 'malloc', and so on. In this case, the analyzer is unaware that such functions behave similarly to their standard implementations. You can specify which custom functions correspond to system functions.
Annotation format:
//V_FUNC_ALIAS, implementation:imp, function:f, namespace:n, class:c- The 'implementation' key — a name of a system function for which an alias is specified.
- The 'function' key – an alias name. The function specified in this option must have exactly the same signature as the one specified in the 'implementation' option.
- The 'class' key – a class name. Optional.
- The 'namespace' key – a namespace name. Optional.
Usage example:
//V_FUNC_ALIAS, implementation:memcpy, function:MyMemCpyNow, the analyzer will process calls to the 'MyMemCpy' function in the same way it processes calls to 'memcpy'.
Custom formatted IO function
You can specify the names of your own functions that should be format validated. It's assumed that the principle of string formatting corresponds to the 'printf' function.
You will need the user annotation for this. Here is the usage example:
//V_FORMATTED_IO_FUNC,function:Log,format_arg:1,ellipsis_arg:2
void Log(const char *fmt, ...);
Log("%f", time(NULL)); // <= V576Annotation format:
- The 'function' key specifies the full name of the function, which consists of the namespace, the class name, and the function name. Nested namespaces and nested classes are supported.
- The 'format_arg' key specifies the number of the function argument that contains the format string. Numbers start at 1 and should not exceed 14. This argument is required.
- The 'ellipsis_arg' key specifies the number of the function argument with the ellipsis (three dots). The number also starts at 1 and should not exceed 14. Moreover, the 'ellipsis_arg' number should be greater than the 'format_arg' number (because ellipsis can only be the last argument). This argument is also required.
The most complete usage example:
namespace A
{
class B
{
void C(int, const char *fmt, ...);
};
}
//V_FORMATTED_IO_FUNC, function:A::B::C, format_arg:2, ellipsis_arg:3Annotating functions and types in JSON format
- Quick start
- Ways to register the annotation file
- Structure of the annotation file
- Type annotations
- Function annotations
- JSON Schema
- Examples
The user annotation mechanism is a way of marking up types and functions in JSON format in order to provide the analyzer with additional information. Due to this information, the analyzer can find more errors in code.
Quick start
Let's say that the project requires that we forbid calling a function because it's unwanted:
void DeprecatedFunction(); // should not be used
void foo()
{
DeprecatedFunction(); // unwanted call site
}In order for the analyzer to issue the V2016 warning in the place where this function is called, we should create a special JSON file with the following contents:
{
"version": 1,
"annotations": [
{
"type": "function",
"name": "DeprecatedFunction",
"attributes": [ "dangerous" ]
}
]
}After that, we only need to register the file (another methods are listed below):
//V_PVS_ANNOTATIONS /path/to/project/annotations.json
void DeprecatedFunction();
void foo()
{
DeprecatedFunction(); // <= V2016 will be issued here
}Ways to register the annotation file
We can register JSON annotation files in the following ways:
Way N1. Write a special comment in the source code or in the diagnostic rules configuration file (.pvsconfig):
//V_PVS_ANNOTATIONS /path/to/annotations.jsonIf a relative path is specified, it's normalized relative to the directory where the file with comment is.
Way N2. Pass the ‑‑annotation-file (-A) flag to the pvs-studio-analyzer utility:
pvs-studio-analyzer --annotation-file=/path/to/annotations.jsonNote. Multiple annotation files can be registered. Each file requires a separate flag or comment.
Structure of the annotation file
The file content is a JSON object consisting of two mandatory fields: version and annotations.
The version field takes an integer-type value and specifies the version of the mechanism. Depending on the value, the markup file can be processed differently. Currently, only one value is supported — 1.
The annotations field is an array of "annotation" objects:
{
"version": 1,
"annotations":
[
{
...
},
{
...
}
]
}Annotations can be of two types:
- type annotations;
- function annotations;
If an annotation is declared directly in the annotations array, it's a top-level annotation. Otherwise, it is a nested annotation.
Type annotations
The type annotation object consists of the following fields.
The "type" field
The mandatory field. It takes a string with one of the values: "record," "class," "struct," or "union". The last three options are aliases for "record" and have been added for convenience.
The "name" field
The mandatory field. It takes a string with the fully qualified name of an entity. The analyzer searches for this entity starting from the global scope. If the entity is in the global scope, the "::" character at the beginning of the name can be omitted.
The "members" field
The optional field. An array of nested annotation objects.
The "attributes" field
The optional field. An array of strings that specifies the properties of an entity. Attributes available for type annotations are as follows:
Smart pointers
- "unique_ptr" — the type has the std::unique_ptr interface;
- "shared_ptr" — the type has the std::shared_ptr interface;
- "auto_ptr" — the type has the std::auto_ptr interface;
Containers
- "string" — the type has the std::basic_string interface;
- "string_view" — the type has the std::basic_string_view interface;
- "array" — the type has the std::array interface;
- "vector" — the type has the std::vector interface;
- "map" — the type has the std::map interface;
- "set" — the type has the std::set interface;
- "list" — the type has the std::list interface;
- "unordered" — in combination with "set" or "map" sets the type interface to std::unordered_set or std::unordered_map, respectively.
- "multi" — in combination with "set" or "map" sets the type interface to std::multiset or std::multimap, respectively. If "unordered" is included, the type is given the std::unordered_multiset or std::unordered_multimap semantics.
Other types
- "nullable" — the type has the semantics of a nullable type. Objects of these types can have one of two states: "valid" or "invalid". Accessing an object in the "invalid" state results in an error. Pointers and std::optional are examples of such types.
Semantics
- "cheap_to_copy" — an object of the type can be passed to a function by copy with zero overhead;
- "expensive_to_copy" — an object of the type should be passed to a function only by pointer/reference;
- "copy_on_write" — the type has the copy-on-write semantics.
Function annotations
The function annotation object consists of the following fields:
The "type" field
The mandatory field. It takes a string with the function value. Also, the ctor value is available for nested function annotations (in the members field of type annotations). It indicates that a custom-type constructor is being annotated.
The "name" field
It takes a string with a function name. The field is mandatory if type has the "function" value, otherwise it should be omitted. The analyzer searches for the annotated entity by this name, starting from the global scope.
For top-level annotations, the fully qualified name is specified. For nested annotations, the unqualified name is specified.
If the function is in the global scope, the scope resolution operator ("::") at the beginning of the name can be omitted.
The "params" field
The optional field. An array of objects that describes formal parameters. Along with name, this field specifies the signature of the function by which the analyzer compares the annotation with its declaration in the program code. In the case of member functions, the analyzer also considers the qualifiers field.
Each object contains the following fields:
- "type" (mandatory) — a type of a formal parameter as a string. For example, the first formal parameter of the memset function has the void * type. That's what should be written in the string. It's possible to omit unnecessary parameters and annotate several function overloads with a single annotation. For this purpose, use a wildcard character:
- The "*" character means that 0 or more parameters of any type can take its place. It should be the last in the list of parameters.
- The "?" character denotes that a parameter of any type can take its place.
- "attributes" (optional) — an array of strings that specifies the properties of a parameter. Possible parameter attributes are described below.
If the annotation is to be applied to all overloads regardless of the parameters, the field can be omitted:
// Code
void foo(); // dangerous
void foo(int); // dangerous
void foo(float); // dangerous
// Annotation
{
....
"type": "function",
"name": "foo",
"attributes": [ "dangerous" ]
....
}If an overload that takes no parameters is needed, specify an empty array explicitly:
// Code
void foo(); // dangerous
void foo(int); // ok
void foo(float); // ok
// Annotation
{
....
"type": "function",
"name": "foo",
"attributes": [ "dangerous" ],
"params": []
....
}Possible parameter attribute values
|
# |
Attribute name |
Attribute description |
|---|---|---|
|
1 |
immutable |
It indicates to the analyzer that the passed argument has not been modified after the function call. For example, the printf function has side effects (printing to stdout) but does not modify passed arguments. |
|
2 |
not_null |
It is valid only for nullable-type parameters. An argument in the "valid" state should be passed to the function. |
|
3 |
unique_arg |
The arguments passed should be different. For example, it doesn't make sense to pass two identical arguments to std::swap. |
|
4 |
format_arg |
The parameter denotes a format string. The analyzer checks the arguments according to the printf format specification. |
|
5 |
pointer_to_free |
A pointer by which memory is released in the function by using free. The pointer can be null. |
|
6 |
pointer_to_gfree |
A pointer by which memory is released in the function by using g_free. The pointer can be null. |
|
7 |
pointer_to_delete |
A pointer by which memory is released in the function by using 'operator delete'. The pointer can be null. |
|
8 |
pointer_to_delete[] |
A pointer by which memory is released in the function by using 'operator delete[]'. The pointer can be null. |
|
9 |
pointer_to_unmap |
A pointer by which memory is released in the function by using 'munmap'. The pointer can be null. |
The "returns" field
The optional field. An object in which only the attributes field (an array of strings) can be used to specify the attributes of the return value.
Possible attribute values of the returned result
|
# |
Attribute name |
Attribute description |
|---|---|---|
|
1 |
not_null |
The function always returns an object of a nullable-type in the "valid" state. |
|
2 |
maybe_null |
The function may return an object of a nullable-type in the "invalid" state. An object should be checked before dereferencing. |
The "template_params" field
The optional field. An array of strings that enables specifying the template parameters of the function. The field is required when template parameters are used in a function signature:
// Code
template <typename T1, class T2>
void MySwap(T1 &lhs, T2 &rhs);
// Annotation
{
....
"template_params": [ "typename T1", "class T2" ],
"name": "MySwap",
"params": [
{ "type": "T1 &", attributes: [ "unique_arg" ] },
{ "type": "T2 &", attributes: [ "unique_arg" ] }
]
....
}The "qualifiers" field
The optional field. It enables us to apply the annotation only to a member function with a specific set of cvref qualifiers. It's available only for nested annotations that have the type field set to "function". Along with name and params, the field specifies the signature of the non-static member function by which the analyzer compares the annotation with its declaration in the program code. The field takes an array of strings with the following possible values: "const", "volatile", "&", or "&&".
Example:
// Code
struct Foo
{
void Bar(); // don't need to annotate this overload
void Bar() const; // want to annotate this overload
void Bar() const volatile; // and this one
};
// Annotation
{
....
"type": "record",
"name": "Foo",
"members": [
{
"type": "function",
"name": "Bar",
"qualifiers": [ "const" ]
},
{
"type": "function",
"name": "Bar",
"qualifiers": [ "const", "volatile" ]
}
]
....
}If the annotation is to be applied to all qualified and unqualified versions, the field should be omitted:
// Code
struct Foo
{
void Bar(); // want to annotate this overload
void Bar() const; // and this one
};
// Annotation
{
....
"type": "record",
"name": "Foo",
"members": [
{
"type": "function",
"name": "Bar",
}
]
....
}If the annotation is to be applied only to the unqualified version, the field value should be an empty array:
// Code
struct Foo
{
void Bar(); // want to annotate this overload
void Bar() const; // but NOT this one
};
// Annotation
{
....
"type": "record",
"name": "Foo",
"members": [
{
"type": "function",
"name": "Bar",
"qualifiers": []
}
]
....
}The "attributes" field
The optional field. It's an array of strings that sets the properties of an entity.
Possible function and constructor attributes
|
# |
Attribute name |
Attribute description |
Note |
|---|---|---|---|
|
1 |
pure |
The function is pure. |
A function is pure when it has no side effects, does not modify the passed arguments, and the result of the function is the same when it's called with the same set of arguments. |
|
2 |
noreturn |
The function does not return control to the caller function. |
|
|
3 |
nodiscard |
The result of the function should be used. |
|
|
4 |
nullable_uninitialized |
A custom nullable-type constructor initializes an object in the "invalid" state. |
|
|
5 |
nullable_initialized |
The custom nullable-type constructor initializes the object in the "valid" state. |
|
|
6 |
nullable_checker |
The function checks the state of the user nullable type. If the function returns true, the object is considered to be in a "valid" state; if not, it is "invalid". The result of the function is to be implicitly converted to the bool type. |
|
|
7 |
nullable_getter |
The function performs access to internal data of the user nullable type. The object must be in the "valid" state. |
|
|
8 |
dangerous |
The function is marked as dangerous, and the program code must not contain its call. |
It can also be used to mark a function as deprecated. |
An applicability table of different attributes with function annotations is below:
|
# |
Attribute |
Free function |
Constructor |
Member function |
|---|---|---|---|---|
|
1 |
pure |
✓ |
✕ |
✓ |
|
2 |
noreturn |
✓ |
✕ |
✓ |
|
3 |
nodiscard |
✓ |
✓ |
✓ |
|
4 |
nullable_uninitialized |
✕ |
✓ |
✓ |
|
5 |
nullable_initialized |
✕ |
✓ |
✓ |
|
6 |
nullable_checker |
✕ |
✕ |
✓ |
|
7 |
nullable_getter |
✕ |
✕ |
✓ |
|
8 |
dangerous |
✓ |
✓ |
✓ |
JSON Schema
JSON Schema comes bundled with the distribution or is available at the link.
Examples
How to annotate user nullable type
Let's say there is a user nullable type as follows:
constexpr struct MyNullopt { /* .... */ } my_nullopt;
template <typename T>
class MyOptional
{
public:
MyOptional();
MyOptional(MyNullopt);
template <typename U>
MyOptional(U &&val);
public:
bool HasValue() const;
T& Value();
const T& Value() const;
private:
/* implementation */
};Code notes:
- The default constructor and the constructor of the MyNullopt type initialize the object in the "invalid" state.
- The constructor template that takes a parameter of the U&& type initializes the object in the "valid" state.
- The HasValue member function checks the state of a nullable-type object. If the object is in the "valid" state, true is returned; otherwise, false. The function does not change the state of a nullable-type object.
- Overloads of Value member functions return the underlying object. Functions do not change the state of a nullable-type object.
Then the annotation of the class and its member functions looks as follows:
{
"version": 1,
"annotations": [
{
"type": "class",
"name": "MyOptional",
"attributes": [ "nullable" ],
"members": [
{
"type": "ctor",
"attributes": [ "nullable_uninitialized" ]
},
{
"type": "ctor",
"attributes": [ "nullable_uninitialized" ],
"params": [
{
"type": "MyNullopt"
}
]
},
{
"type": "ctor",
"template_params": [ "typename U" ],
"attributes": [ "nullable_initialized" ],
"params": [
{
"type": "U &&val"
}
]
},
{
"type": "function",
"name": "HasValue",
"attributes": [ "nullable_checker", "pure", "nodiscard" ]
},
{
"type": "function",
"name": "Value",
"attributes": [ "nullable_getter", "nodiscard" ]
}
]
}
]
}How to add an "always valid" contract for the nullable-type function parameter
Suppose the following code:
namespace Foo
{
template <typaname CharT>
size_t my_strlen(const CharT *ptr);
}The Foo::my_strlen function has the following properties:
- The first parameter must always be non-zero, i.e., in the "valid" state.
- The function is pure and does not modify anything.
Then the function annotation looks as follows:
{
"version": 1,
"annotations":
[
{
"type": "function",
"name": "Foo::my_strlen",
"attributes": [ "pure" ],
"template_params": [ "typename CharT" ],
"params": [
{
"type": "const CharT *",
"attributes": [ "not_null" ]
}
]
}
]
}How to mark up a user-formatted I/O function
Let's say there is the Foo::LogAtError function:
namespace Foo
{
void LogAtError(const char *, ...);
}It's known that:
- It takes a format string as its first parameter according to the printf specification. The argument must not be null.
- The arguments matching the format string, starting with the second one, are passed.
- The function does not modify the passed arguments.
- The function does not return control after it is called.
The analyzer can check if the passed arguments match the format string. Also, it can determine that the code is unreachable after calling the function. To do this, we need to mark up the function as follows:
{
"version": 1,
"annotations": [
{
"type": "function",
"name": "Foo::LogAtError",
"attributes": [ "noreturn" ],
"params": [
{
"type": "const char *",
"attributes" : [ "format_arg", "not_null", "immutable" ]
},
{
"type": "...",
"attributes": [ "immutable" ]
}
]
}
]
}How to use a wildcard character to annotate multiple overloads
Suppose that, in the previous example, a programmer added some overloads to the Foo::LogAtExit function:
namespace Foo
{
void LogAtExit(const char *fmt, ...);
void LogAtExit(const char8_t *fmt, ...);
void LogAtExit(const wchar_t *fmt, ...);
void LogAtExit(const char16_t *fmt, ...);
void LogAtExit(const char32_t *fmt, ...);
}In this case, it's not necessary to write annotations for all overloads. One, using the wildcard character, is enough:
{
"version": 1,
"annotations": [
{
"type": "function",
"name": "Foo::LogAtExit",
"attributes": [ "noreturn" ],
"params": [
{
"type": "?",
"attributes" : [ "format_arg", "not_null", "immutable" ]
},
{
"type": "...",
"attributes": [ "immutable" ]
}
]
}
]
}How to mark a function as dangerous (or deprecated)
Suppose there are two overloads of the Foo::Bar function:
namespace Foo
{
void Bar(int i);
void Bar(double d);
}We need to forbid the first overload. To do this, mark up the function as follows:
{
"version": 1,
"annotations": [
{
"type": "function",
"name": "Foo::Bar",
"attributes": [ "dangerous" ],
"params": [
{
"type": "int"
}
]
}
]
}Predefined PVS_STUDIO macro
Among the numerous filtration and message suppression methods of PVS-Studio analyzer is the PVS_STUDIO predefined macro.
The first case when it might come in handy is when one wants to prevent some code from getting in the analyzer for a check. For example, the analyzer generates a diagnostic message for the following code:
int rawArray[5];
rawArray[-1] = 0;However, if you will 'wrap' it using this macro the message will not be generated.
int rawArray[5];
#ifndef PVS_STUDIO
rawArray[-1] = 0;
#endifThe PVS_STUDIO macro is automatically inserted while checking the code from the IDE. But if you are using PVS-Studio from the command line, the macro will not be passed by default to the analyzer and this should be done manually.
The second case is the override of the default and custom macros. For example, for the following code a warning will be generated about dereference of a potentially null pointer:
char *st = (char*)malloc(10);
TEST_MACRO(st != NULL);
st[0] = '\0'; //V522To tell the analyzer that the execution of the program gets interrupted with certain conditions, you can override the macro in the following way:
#ifdef PVS_STUDIO
#undef TEST_MACRO
#define TEST_MACRO(expr) if (!(expr)) throw "PVS-Studio";
#endif
char *st = (char*)malloc(10);
TEST_MACRO(st != NULL);
st[0] = '\0';This method allows to remove the analyzer warnings on the code checked using different libraries, as well as on any other macros that are used for debugging and testing.
See the discussion "Mark variable as not NULL after BOOST_REQUIRE in PVS-Studio" on StackOverflow.com site.
PVS_STUDIO macro will be automatically substituted when checking code from IDE. If you use the code check from the command line, macro is not passed to the analyzer by default, and it should be done manually.
Analysis configuration file (Settings.xml)
Global configuration file
Many PVS-Studio's tools use an XML file to store the configuration.
Such a file can be used either implicitly (the global Settings.xml file located in a special folder) or passed explicitly to PVS-Studio tools via a special flag.
By default, PVS-Studio's tools use the global Settings.xml configuration file located:
- on Windows: '%APPDATA%\PVS-Studio\Settings.xml'
- on Linux, macOS: '~/.config/PVS-Studio/Settings.xml'
The global configuration file is used by almost all PVS-Studio's tools, unless an alternative file is passed to them. The following tools do not use the global configuration file:
- pvs-studio-analyzer\CompileCommandsAnalyzer.exe on Linux, macOS and Windows;
- plog-converter for Linux and macOS.
Note: PVS-Studio plugins for Visual Studio, Rider, and CLion, as well as the C and C++ Compiler Monitoring UI utility use only the global Settings.xml file.
Custom configuration file
You can specify the analysis settings for a project in a special XML file. After that, you can pass this file to the PVS-Studio CLI tools via a special flag.
Note: to avoid mistakes when writing the configuration file, we recommend copying the global Settings.xml file and modifying it.
Below are examples of how to run utilities with the special CustomSettings.xml configuration file (name the file as you like).
For the PVS-Studio_Cmd.exe utility:
PVS-Studio_Cmd.exe -t "path\to\Solution.sln" ... \
--settings "path\to\CustomSettings.xml"For the CLMonitor.exe utility:
CLMonitor.exe [analyze|monitor|analyzeFromDump|trace] ... \
--settings "\path\to\CustomSettings.xml"For the BlameNotifier.exe utility:
BlameNotifier.exe "path\to\PVS-Studio.plog" \
--VCS Git \
--recipientsList "path\to\recipients.txt" \
--server ... --sender ... \
--login ... --password ... \
--settings "path\to\CustomSettings.xml"For the PlogConverter.exe utility (only Windows):
PlogConverter.exe -t json ... --settings "path\to\CustomSettings.xml" \
"path\to\PVS-Studio.plog"About the file format and individual settings
File format
The configuration file has the XML format with the following structure:
<?xml version="1.0" encoding="utf-8"?>
<ApplicationSettings>
...
<Tag>Value</Tag>
...
</ApplicationSettings>Instead of Tag write the option identifier (e.g. FileMasks). Instead of Value write the option's value. A description of available options and their values is given below.
Values of the options can be of the following types:
- ListString — tags of this type take a list of strings as a value. Each value of the list is defined by the string tag;
- string — tags of this type take a string as a value;
- bool — tags of this type take true or false value;
- Int — tags of this type take an integer as a value;
- Enum — tags of this type take as values constants. The constants are defined by the type of the corresponding setting.
Description of tags of individual settings
The following documentation section describes the key configuration file options and their application.
FileMasks (ListString)
It is used in: PVS-Studio_Cmd, CLMonitor, IDE plugins for Visual Studio, Rider, and CLion.
The tag describes a list of file masks that are applied to exclude files from analysis. Masks of this type are used to filter messages by names of the files only and not by these files' directories. You can specify both the full file name and the mask with the help of wildcard characters: the "*" character (any number of characters) and the "?" character (any single character).
The FileMasks tag accepts a list of the <string> tags, each containing a file mask.
For example, the following fragment shows how to exclude all SourceTest.cpp and C*Test.cpp files from the analysis:
<FileMasks>
<string>SourceTest.cpp</string>
<string>C*Test.cpp</string>
</FileMasks>PathMasks (ListString)
It is used in: PVS-Studio_Cmd, CLMonitor, IDE plugins for Visual Studio, Rider, and CLion.
The tag describes a list of Path masks used to exclude directories from analysis. Masks of this type allow you to exclude files from analysis based on their location.
The PathMasks tag accepts a list of the <string> tags, each containing a path mask.
For example, the following fragment shows how to exclude all cpp and hpp files located in the ThirdParty and Tests directories:
<PathMasks>
<string>*/ThirdParty/*.?pp</string>
<string>*/Tests/*.?pp</string>
</PathMasks>DisableSynchronizeSuppressFiles (bool)
It is used in: PVS-Studio_Cmd, CLMonitor, IDE plugins for Visual Studio.
This option disables the synchronization of supress files between projects of the same solution. This can be useful if you want a message that is suppressed in one project to not be suppressed in others.
The DisableSynchronizeSuppressFiles tag can take one of two values: true, false. If the value is set to true, automatic synchronisation of suppress files is disabled. By default, the value is set to false.
Example:
<DisableSynchronizeSuppressFiles>true</DisableSynchronizeSuppressFiles>DisableDetectableErrors (string)
It is used in: PlogConverter.exe (Windows), BlameNotifier, IDE plugins for Visual Studio and Rider.
The tag specifies a list of diagnostic rules that should be hidden in the report when you view it in IDE via the PVS-Studio plugin.
The DisableDetectableErrors tag takes a list of diagnostic rules separated by spaces. Note that a space must also be specified after the last code piece.
This option is also used by the PlogConverter.exe (Windows) and BlameNotifier utilities to exclude warnings from the resulting report.
For example, when converting a report using PlogConverter.exe, you can use the following line to exclude diagnostic rules you are not interested in:
<DisableDetectableErrors>V126 V203 V2001 V2006 </DisableDetectableErrors>This way you can pass the *.xml file to PlogConverter.exe through the ‑‑setting flag and get a report without V126, V203, V2001, V2006 warnings.
UserName (string)
It is used in: PVS-Studio_Cmd, CLMonitor, BlameNotifier, IDE plugins for Visual Studio, Rider, and CLion.
The tag specifies the name required to check the validity of the license.
Note: you can ignore this tag in the special settings file, if you have already performed activation. PVS-Studio will then search for the license in the global Settings.xml file.
Example:
<UserName>Name</UserName>SerialNumber (string)
It is used in: PVS-Studio_Cmd, CLMonitor, BlameNotifier, IDE plugins for Visual Studio, Rider, and CLion.
The tag specifies the license key to verify the validity of the license.
Note: you can ignore this tag in the special settings file, if you have already performed activation. PVS-Studio will then search for the license in the global Settings.xml file.
Example:
<SerialNumber>XXXX-XXXX-XXXX-XXXX</SerialNumber>RemoveIntermediateFiles (bool)
It is used in: PVS-Studio_Cmd, CLMonitor, IDE plugins for Visual Studio, Rider, and CLion.
This tag enables/disables automatic deletion of intermediate analyzer files, such as the core configuration files of the analyzer and the preprocessed files.
The RemoveIntermediateFiles tag takes the true or false value. If the value is true, all temporary files will be deleted.
By default, the value is true. It may be useful to save intermediate files to further investigate problems with the analyzer.
Example:
<RemoveIntermediateFiles>false</RemoveIntermediateFiles>ReportDisabledRules (bool)
It is used in: PVS-Studio_Cmd, IDE plugins for Visual Studio.
The tag allows you to enable the option that displays the sources of the warning suppression. The option helps to see which mechanisms disable the diagnostic rules.
The ReportDisabledRules tag takes the true or false value. If the value is true, the report will contain messages with the V012 code. It will also contain the information about the sources that disabled the diagnostic rules.
By default, the value is set to false.
Example:
<ReportDisabledRules>true</ReportDisabledRules>Disable64BitAnalysis (bool)
It is used in: PVS-Studio_Cmd, CLMonitor, IDE plugins for Visual Studio, and CLion.
The tag disables a group of 64-bit diagnostic rules. Diagnostic rules from the disabled group will not be applied.
If the value is set to true, all diagnostic rules of this group are disabled.
Example:
<Disable64BitAnalysis>true</Disable64BitAnalysis>DisableGAAnalysis (bool)
It is used in: PVS-Studio_Cmd, CLMonitor, IDE plugins for Visual Studio, and CLion.
The tag disables the general-purpose diagnostic group for C and C++ (General Analysis).
If the value is set to true, all diagnostic rules of this group are disabled.
Example:
<DisableGAAnalysis>true</DisableGAAnalysis>DisableOPAnalysis (bool)
It is used in: PVS-Studio_Cmd, CLMonitor, IDE plugins for Visual Studio, Rider, and CLion.
The tag disables the micro-optimization diagnostic group for C and C++.
If the value is set to true, all diagnostic rules of this group are disabled.
Example:
<DisableOPAnalysis>true</DisableOPAnalysis>DisableCSAnalysis (bool)
It is used in: PVS-Studio_Cmd, CLMonitor, IDE plugins for Visual Studio, Rider, and CLion.
The tag disables a group of specific diagnostic rules added at the request of our users (Customer Specific) for C and C++.
If the value is set to true, all diagnostic rules of this group are disabled.
Example:
<DisableCSAnalysis>true</DisableCSAnalysis>DisableMISRAAnalysis (bool)
It is used in: PVS-Studio_Cmd, CLMonitor, IDE plugins for Visual Studio, and CLion.
The tag disables a group of diagnostic rules that check the C and C++ code for compliance with MISRA standards.
If the value is set to true, all diagnostic rules of this group are disabled.
Example:
<DisableMISRAAnalysis>true</DisableMISRAAnalysis>DisableAUTOSARAnalysis (bool)
It is used in: PVS-Studio_Cmd, CLMonitor, IDE plugins for Visual Studio, and CLion.
The tag disables a group of diagnostic rules that check the C++ code for compliance with AUTOSAR standards.
If the value is set to true, all diagnostic rules of this group are disabled.
Example:
<DisableAUTOSARAnalysis>true</DisableAUTOSARAnalysis>DisableOWASPAnalysis (bool)
It is used in: PVS-Studio_Cmd, CLMonitor, IDE plugins for Visual Studio, and CLion.
The tag disables a group of diagnostic rules that check the C and C++ code for compliance with OWASP ASVS.
If the value is set to true, all diagnostic rules of this group are disabled.
Example:
<DisableOWASPAnalysis>true</DisableOWASPAnalysis>DisableOWASPAnalysisCs (bool)
It is used in: PVS-Studio_Cmd, CLMonitor, IDE plugins for Visual Studio, and Rider.
The tag disables a group of diagnostic rules that check the C# code for compliance with the OWASP ASVS.
If the value is set to true, all diagnostic rules of this group are disabled.
Example:
<DisableOWASPAnalysisCs>true</DisableOWASPAnalysisCs>DisableGAAnalysisCs (bool)
It is used in: PVS-Studio_Cmd, CLMonitor, IDE plugins for Visual Studio, and Rider.
The tag disables the general-purpose diagnostic group for C# (General Analysis).
If the value is set to true, all diagnostic rules of this group are disabled.
Example:
<DisableGAAnalysisCs>true</DisableGAAnalysisCs>PerformPreBuildStep (bool)
It is used in: PVS-Studio_Cmd and IDE plugins for Visual Studio.
If you enable this setting, you can perform actions recorded in the Custom Build Step section of the Visual Studio project file (vcproj/vcxproj) before starting the analysis. Note that the analyzer needs compiled code to work correctly. For example, if Custom Build Step is used to generate the *.h files before compilation, Custom Build Step needs to be executed (by enabling this setting) before analyzing the project as well.
The PerformPreBuildStep tag takes the true/false value.
If the value is true, the setting is enabled.
Example:
<PerformPreBuildStep>true</PerformPreBuildStep>AutoSettingsImport (bool)
It is used in: PVS-Studio_Cmd, CLMonitor, BlameNotifier, and IDE plugins for Visual Studio.
The tag enables automatic import of settings (xml files) from the '%APPDATA%\PVS-Studio\SettingsImports' directory. When importing, the settings-flags (true\false), as well as settings that store a single value (for example, a string) are replaced with settings from 'SettingsImports'. Settings that have multiple values (for example, excluded directories) are combined.
If there are several xml files in the 'SettingsImports' folder, these files will be applied to the current settings sequentially in order, according to their names.
The AutoSettingsImport tag takes the true/false value.
If the value is true, automatic import is enabled.
Example:
<AutoSettingsImport>true</AutoSettingsImport>NoNoise (bool)
It is used in: PVS-Studio_Cmd and IDE plugins for Visual Studio.
The tag disables the generation of warnings of the Low level of certainty.
If the value is set to true, messages of the 3rd certainty level will not be included in the report.
Example:
<NoNoise>false</NoNoise>ThreadCount (int)
It is used in: PVS-Studio_Cmd, CLMonitor, IDE plugins for Visual Studio, Rider, and CLion.
The tag sets the number of parallel running analyzer's core processes that will be involved in the analysis. By default, the value is set to the number of processor cores.
Note that it is not recommended to set this setting to a value greater than the number of processor cores. Also note that there is a limit of 16 cores for non-Enterprise licenses.
Example:
<ThreadCount>8</ThreadCount>SourceTreeRoot (string)
It is used in: PVS-Studio_Cmd, CLMonitor, IDE plugins for Visual Studio, Rider, and CLion.
This option allows you to specify the root part of the path to the source files in the analyzer report. When generating the report, the root part will be replaced with a special marker |?|. By default, this option is empty and the analyzer always generates a report with absolute paths to files. The setting allows to get an analyzer report with relative paths. The report can then be used on machines with different locations of the source files being checked.
Example:
<SourceTreeRoot>D:\ProjectRoot\</SourceTreeRoot>Learn more about this in the documentation section: "Using relative paths in PVS-Studio report files".
UseSolutionDirAsSourceTreeRoot (bool)
It is used in: PVS-Studio_Cmd, CLMonitor, IDE plugins for Visual Studio, Rider, and CLion.
The tag allows you to enable the use of the solution directory as the SourceTreeRoot value.
If the value is true, the part of the path containing the path to the solution directory will be replaced with a special marker. The SourceTreeRoot parameter will be ignored.
Example:
<UseSolutionDirAsSourceTreeRoot>false</UseSolutionDirAsSourceTreeRoot>AnalysisTimeout (Enum)
It is used in: PVS-Studio_Cmd, CLMonitor, IDE plugins for Visual Studio, Rider, and CLion.
The tag specifies the time after which the analysis of the file will be interrupted. The parameter can take the following values:
- After_10_minutes — limits the file's analysis time to 10 minutes;
- After_30_minutes — limits the file's analysis time to 30 minutes;
- After_60_minutes — limits the file's analysis time to an hour;
- No_timeout — removes the time limits of file's analysis.
Please note that removing the time limit may cause the analysis to hang.
Example:
<AnalysisTimeout>After_10_minutes</AnalysisTimeout>IncrementalAnalysisTimeout (Enum)
It is used in: PVS-Studio_Cmd, CLMonitor, IDE plugins for Visual Studio, Rider, and CLion.
The tag sets a time limit for incremental analysis. Possible values:
- After_1_minute — limits the incremental analysis to 1 minute;
- After_2_minutes — limits the incremental analysis to 2 minutes;
- After_5_minutes — limits the incremental analysis to 5 minutes;
- After_10_minutes — limits the incremental analysis to 10 minutes;
- No_timeout — removes the time limit.
Please note that removing the time limit may cause the analysis to hang.
Example:
<IncrementalAnalysisTimeout>After_2_minutes</IncrementalAnalysisTimeout>Settings: general
When developing PVS-Studio we assigned primary importance to the simplicity of use. We took into account our experience of working with traditional lint-like code analyzers. And that is why one of the main advantages of PVS-Studio over other code analyzers is that you can start using it immediately. Besides, PVS-Studio has been designed in such a way that the developer using the analyzer would not have to set it up at all. We managed to solve this task: a developer has a powerful code analyzer which you need not to set up at the first launch.
But you should understand that the code analyzer is a powerful tool which needs competent use. It is this competent use of the analyzer (thanks to the settings system) that allows you to achieve significant results. Operation of the code analyzer implies that there should be a tool (a program) which performs routine work of searching potentially unsafe constructions in code and a master (a developer) who can make decisions on the basis of what he knows about the project being verified. Thus, for example, the developer can inform the analyzer that:
- some error types are not important for analysis and do not need to be shown (with the help of settings of Settings: Detectable Errors);
- the project does not contain incorrect type conversions (by disabling the corresponding diagnostic messages, Settings: Detectable Errors);
Correct setting of these parameters can greatly reduce the number of diagnostic messages produced by the code analyzer. It means that if the developer helps the analyzer and gives it some additional information by using the settings, the analyzer will in its turn reduce the number of places in the code which the developer must pay attention to when examining the analysis results.
PVS-Studio setting can be accessed through the PVS-Studio -> Options command in the IDE main menu. When selecting this command you will see the dialogue of PVS-Studio options.
Each settings page is extensively described in PVS-Studio documentation.
Settings: Common Analyzer Settings
The tab of the analyzer's general settings displays the settings which do not depend on the particular analysis unit being used.
Check For New Versions
The analyzer can automatically check for updates on pvs-studio.com site. It uses our update module.
If the CheckForNewVersions option is set to True, a special text file is downloaded from pvs-studio.com site when you launch code checking (the commands Check Current File, Check Current Project, Check Solution in PVS-Studio menu). This file contains the number of the latest PVS-Studio version available on the site. If the version on the site is newer than the version installed on the user computer, the user will be asked for a permission to update the program. If the user agrees, a special separate application PVS-Studio-Updater will be launched that will automatically download and install the new PVS-Studio distribution kit. If the option CheckForNewVersions is set to False, it will not check for the updates.
Thread Count
Analysis of files is performed faster on multi-core computers. Thus, on a 4-core computer the analyzer can use all the four cores for its operation. But, if for some reason, you need to limit the number of cores being used, you can do this by selecting the required number. The number of processor cores will be used as a default value.
Setting the value of 'ThreadCount' option to more than '16' (or more than a number of processor cores, if processor possesses more than 16 cores) is available only under the PVS-Studio Enterprise license. You can request the trial Enterprise license here.
When running analysis on a single system, we do not advise setting the value of this option greater, than the number of processor cores available. Setting the value larger than the number of cores could degrade the overall analyzer performance. If you wish to run more analysis tasks concurrently, you can use a distributed build system, for example, Incredibuild. More detailed description of this mode of using PVS-Studio is described in the relevant section of documentation.
Remove Intermediate Files
The analyzer creates a lot of temporary command files for its operation to launch the analysis unit itself, to perform preprocessing and to manage the whole process of analysis. Such files are created for each project file being analyzed. Usually they are not of interest for a user and are removed after the analysis process. But in some cases it can be useful to look through these files. So you can indicate to the analyzer not to remove them. In this case you can launch the analyzer outside the IDE from the command line.
Settings: Detectable Errors
This settings page allows you to manage the displaying of various types of PVS-Studio messages in the analysis results list.
All the diagnostic messages output by the analyzer are split into several groups. The display (show/hide) of each message type can be handled individually, while the following actions are available for a whole message group:
- Disabled – to completely disable an entire message group. Errors from this group will not be displayed in the analysis results list (PVS-Studio output window). Enabling the group again will require to re-run an analysis;
- Show All – to show all the messages of a group in the analysis results list;
- Hide All – to hide all the messages of a group in the analysis results list.
It may be sometimes useful to hide errors with certain codes in the list. For instance, if you know for sure that errors with the codes V505 and V506 are irrelevant for your project, you can hide them in the list by unticking the corresponding checkboxes.
Please mind that you don't need to relaunch the analysis when using the options "Show All" and "Hide All"! The analyzer always generates all the message types found in the project, while whether they should be shown or hidden in the list is defined by the settings on this page. When enabling/disabling error displaying, they will be shown/hidden in the analysis results list right away, without you having to re-analyze the whole project.
Complete disabling of message groups can be used to enhance the analyzer's performance and get the analysis reports (plog-files) of smaller sizes.
Settings: Don't Check Files
You may specify file masks to exclude some of the files or folders from analysis on the tab "Don't Check Files". The analyzer will not check those files that meet the masks' conditions.
Using this technique, you may, for instance, exclude autogenerated files from the analysis. Besides, you may define the files to be excluded from analysis by the name of the folder they are located in.
A mask is defined with the help of wildcard match types: the "*" character (expands to any number of arbitrary characters) and the "?" character (expands to a single arbitrary character).
The case of a character is irrelevant. The "*" character could be inserted in any part of the mask. After masks of the '*\mask\*' type were specified, the messages from files corresponding to these masks will disappear from PVS-Studio Output window, and the next time the analysis is started these files will be excluded from it. Thereby the total time of the entire project's analysis could be substantially decreased by excluding files and directories with these masks.
Note: masks of the 'a*b' type are applied only after restarting the analysis.
2 types of masks could be specified: the Path masks and the File name masks. The masks specified from within the FileNameMasks list are used to filter messages by the names of the corresponding files only and ignoring these files' location. The masks from the PathMasks list, on the other hand, are used to filter messages by taking into account their location within the filesystem on the disk and could be used to suppress diagnostics either from the single file or even from the whole directories and subdirectories. To filter the messages from one specific file, the full path to it should be added to the PathMasks list, but to filter files sharing the same name (or with the names complying to the wildcard mask), such names or masks should be inserted into the FileNameMask list.
Valid masks examples for the FileNameMask property:
- *ex.c — all files with the names ending with "ex" characters and "c" extension will be excluded;
- *.cpp — all files possessing the "cpp" extension will be excluded;
- stdafx.cpp — every file possessing such name will be excluded from analysis regardless of its location within the filesystem.
- *.?pp - all files with the 'pp' extension will be excluded.
Valid masks examples for the PathMasks property:
- c:\Libs\ — all files located in this directory and its subdirectories will be excluded;
- \Libs\ or *\Libs\* — all files located in the directories with path containing the Libs subdirectory will be excluded;
- Libs or *Libs* — the files possessing within their paths the subdirectory with the 'Libs' chars in its name will be excluded. Also the files with names containing the 'libs' characters will be excluded as well, for example 'c:\project\mylibs.cpp.' To avoid confusion we advise you always to specify folders with slash separators;
- c:\proj\includes.cpp — a single file located in the c:\proj\ folder with the specified name will be excluded from the analysis.
Note. If the "*" characters are not indicated in the PathMasks, they still will be added automatically.
Settings: Keyword Message Filtering
In the keyword filtering tab you can filter analyzer messages by the text they contain.
When it's necessary you may hide from analyzer's report the diagnosed errors containing particular words or phrases. For example, if the report contains errors in which names of printf and scanf functions are indicated and you consider that there can be no errors relating to them just add these two words using the message suppression editor.
Please note! When changing the list of the hidden messages you don't need to restart analysis of the project. The analyzer always generates all the diagnostic messages and the display of various messages is managed with the help of this settings tab. When modifying message filters the changes will immediately appear in the report and you won't need to launch analysis of the whole project again.
Settings: Registration
Open PVS-Studio settings page. (PVS-Studio Menu -> Options...).
In the registration tab the licensing information is entered.
After purchasing the analyzer you receive registration information: the name and the serial number. These data must be entered in this tab. In the LicenseType field the licensing mode will be indicated.
Information on the licensing conditions is located in the ordering page on site.
Settings: Specific Analyzer Settings
- Analysis Timeout
- Incremental Analysis Timeout
- No Noise
- Intermodular Analysis Cpp
- Perform Custom Build Step
- Perform TFVC Checkout
- Save File After False Alarm Mark
- Display False Alarms
- Enable False Alarms With Hash
- Disable Synchronization Of Suppress Files
- Integrated Help Language
- Use Offline Help
- Show Best Warnings Button
- Show Tray Icon
- Incremental Results Display Depth
- Trace Mode
- Automatic Settings Import
- Use Solution Folder As Initial
- Save Modified Log
- Source Tree Root
- Use Solution Dir As Source Tree Root
- Autoload Unreal Engine Log
The "Specific Analyzer Settings" tab contains additional advanced settings.
Analysis Timeout
This setting allows you to set the time limit, by reaching which the analysis of individual files will be aborted with V006. File cannot be processed. Analysis aborted by timeout error, or to completely disable analysis termination by timeout. We strongly advise you to consult the description of the error cited above before modifying this setting. The timeout is often caused by the shortage of RAM. In such a case it is reasonable not to increase the time but to decrease the number of parallel threads being utilized. This can lead to a substantial increase in performance in case the processor possesses numerous cores but RAM capacity is insufficient.
Incremental Analysis Timeout
This setting allows setting a time limit, after which the incremental analysis files will be aborted. All the warnings, detected at the moment of the analysis stoppage, will be output in the PVS-Studio window. Additionally, there will be issued a warning that the analyzer didn't have time to process all the modified files and the information about the total and analyzed number of files.
This option is relevant only for working in Visual Studio IDE.
No Noise
When working on a large code base, the analyzer inevitably generates a large number of warning messages. Besides, it is often impossible to fix all the warnings straight out. Therefore, to concentrate on fixing the most important warnings first, the analysis can be made less "noisy" by using this option. It allows completely disabling the generation of Low Certainty (level 3) warnings. After restarting the analysis, the messages from this level will disappear from the analyzer's output.
When circumstances will allow it, and all of the more important messages are fixed, the 'No Noise' mode can be switched off – all of the messages that disappeared before will be available again.
Intermodular Analysis Cpp
Enabling this setting allows the analyzer to consider information not only from the analyzed file, but also from files that relate to the analyzed file. This allows for deeper and more qualitative analysis. However, it takes extra time to collect the necessary information, which will affect the time you analyze your project.
This mode is relevant to C and C++ projects. C# projects provide cross-modular analysis by default.
Perform Custom Build Step
Setting this option to 'true' enables the execution of actions specified in the 'Custom Build Step' section of Visual Studio project file (vcproj/vcxproj). It should be noted that the analyzer requires a fully-compilable code for its correct operation. So, if, for example, the 'Custom Build Section' contains actions used to auto-generate some header files, these actions should be executed (by enabling this setting) before starting the project's analysis. However, in case this step performs some actions concerning the linking process, for instance, then such actions will be irrelevant to code analysis. The 'Custom Build Step' actions are specified at the level of the project and will be executed by PVS-Studio during initial scanning of the project file tree. If this setting is enabled and its execution results in a non-zero exit code, the analysis of the corresponding project file will not be started.
Perform TFVC Checkout
Enabling of this option allows to automatically perform a checkout using the Team Foundation Version Control Tool when editing files, containing the suppressed analyzer warnings (.suppress files). Enabling of this option will not affect the work with projects, not managed by the TF versions control system, or not added in the Visual Studio workspace.
Additional information, in case if it is available (including the information about errors), will be shown in the PVS-Studio window.
This option is relevant only when working from the Visual Studio IDE.
Save File After False Alarm Mark
Marking the message as False alarm requires the modification of source code files. By default the analyzer will save each source code file after making every such mark. However, if such frequent savings of files are undesirable (for example if the files are being stored on different machine in LAN), they can be disabled using this setting.
Exercise caution while modifying this setting because the not saving the files after marking them with false alarms can lead to a loss of work in case of IDE being closed.
Display False Alarms
Allows enabling the display of messages marked as 'False Alarms' in the PVS-Studio output window. This option will take effect immediately, without the need to re-run the analysis. When this option is set to 'true', an 'FA' indicator containing the number of false alarms on the output window panel will become visible.
Enable False Alarms With Hash
This setting enables appending additional hash code to the False Alarm mark. The hash code is calculated based on the line of code contents. If the code line changes, warnings issued for this line will no longer be considered as False Alarms under the same hash.
Disable Synchronization Of Suppress Files
This setting disables automatic synchronization of suppress files between projects within the same solution.
By default, the synchronization of suppress files is enabled. If the source code file is used in several projects and warnings from that file are added to the suppress file of at least one project, these warnings will automatically be added to the suppress files of the analyzed projects when analyzing other projects.
Integrated Help Language
The setting allows you to select a language to be used for integrated help on the diagnostic messages (a click to the message error code in PVS-Studio output window) and online documentation (the PVS-Studio -> Help -> Open PVS-Studio Documentation (html, online) menu command), which are also available at our site.
This setting will not change the language of IDE plug-in's interface and messages produced by the analyzer.
Use Offline Help
The setting allows you to use an offline help on the diagnostic messages (a click to the message error code in PVS-Studio output window).
Show Best Warnings Button
This option manages the display of the 'Best' button in the PVS-Studio interface. By default, the option is enabled. You can find the 'Best' button in the window with the analyzer warnings. Click the button to view 10 most interesting warnings of the analyzer. To hide this button, set this parameter as 'False'.
Show Tray Icon
This setting allows you to control the notifications of PVS-Studio analyzer operations. In case PVS-Studio output window contains error messages after performing the analysis (the messages potentially can be concealed by various filters as false alarms, by the names of files being verified and so on; such messages will not be present in PVS-Studio window), the analyzer will inform you about their presence with popup message in the Windows notification area (System tray). Single mouse click on this message or PVS-Studio tray icon will open the output window containing the messages which were found by the analyzer.
Incremental Results Display Depth
This setting defines the mode of message display level in PVS-Studio Output window for the results of incremental analysis. Setting the display level depth here (correspondingly, Level 1 only; Levels 1 and 2; Levels 1, 2 and 3) will enable automatic activation of these display levels on each incremental analysis procedure. The "Preserve_Current_Levels" on the other hand will preserve the existing display setting.
This setting could be handful for periodic combined use of incremental and regular analysis modes, as the accidental disabling of, for example, level 1 diagnostics during the review of a large analysis log will also result in the concealment of portion of incremental analysis log afterwards. As the incremental analysis operates in the background, such situation could potentially lead to the loss of positives on existing issues within the project source code.
Trace Mode
The setting allows you to select the tracing mode (logging of a program's execution path) for PVS-Studio IDE extension packages (the plug-ins for Visual Studio IDEs). There are several verbosity levels of the tracing (The Verbose mode is the most detailed one). When tracing is enabled PVS-Studio will automatically create a log file with the 'log' extension which will be located in the AppData\PVS-Studio directory (for example c:\Users\admin\AppData\Roaming\PVS-Studio\PVSTrace2168_000.log). Similarly, each of the running IDE processes will use a separate file to store its' logging results.
Automatic Settings Import
This option allows you to enable the automatic import of settings (xml files) from %AppData%\PVS-Studio\SettingsImports\' directory. The settings will be imported on each update from stored settings, i.e. when Visual Studio or PVS-Studio command line is started, when the settings are rest, etc. When importing settings, flag-style options (true\false) and all options containing a single value (a string, for example), will be overwritten by the settings from SettingsImports. The options containing several valued (for example, the excluded directories), will be merged.
If the SettingsImports folder contains several xml files, these files will be applied to the current settings in a sequential manner, according to their names.
Use Solution Folder As Initial
By default PVS-Studio offers saving report file (.plog) inside the same folder as the current solution file.
Modifying this setting allows you to restore the usual behavior of Windows file dialogs, i.e. the dialog will remember the last folder that was opened in it and will use this folder as initial.
Save Modified Log
This setting specifies whether the 'Save log' confirmation prompt should be displayed before starting the analysis or loading another log file, in case output window already contains new, unsaved or modified analysis results. Setting the option to 'Yes' will enable automatic saving of analysis results to the current log file (after it was selected once in the 'Save File' dialog). Setting the option to 'No' will force IDE plug-in to discard any of the analysis results. The choice of the value 'Ask_Always' (used by default) will display the prompt to save the report each time, allowing the user to make the choice himself.
Source Tree Root
By default, PVS-Studio will produce diagnostic messages containing absolute paths to the files being verified. This setting could be utilized for specifying the 'root' section of the path, which will be replaced by a special marker in case the path to the file within the analyzer's diagnostic message also starts from this 'root'. For example, the absolute path to the C:\Projects\Project1\main.cpp file will be replaced to a relative path |?|Project1\main.cpp, if the 'C:\Projects\' was specified as a 'root'.
When handling PVS-Studio log containing messages with paths in such relative format, IDE plug-in will automatically replace the |?| with this setting's value. Thereby, utilizing this setting allows you to handle PVS-Studio report on any local machine with the access to the verified sources, regardless of the sources' location in the file system structure.
A detailed description of the mode is available here.
Use Solution Dir As Source Tree Root
This setting enables or disables the mode of using the path to the folder, containing the solution file *.sln as a parameter 'SourceTreeRoot'.
Autoload Unreal Engine Log
Enabling this option allows to automatically load analyzer report that was generated as a result of the Unreal Engine project analysis, into the PVS-Studio output window.
This option is relevant only for working in Visual Studio IDE.
PVS-Studio C# installation on Linux and macOS
- PVS-Studio C# dependencies
- Installing the analyzer on Linux operating systems
- Analyzer installation on macOS
- License entering
- Projects analysis
Note. To install the analyzer on Windows operating systems, you can use the installer available on the analyzer download page. Windows installer supports installation in both graphical and unattended (command-line installation) modes.
PVS-Studio C# dependencies
The PVS-Studio C# analyzer requires a number of additional packages. Depending on how PVS-Studio C# is installed these dependency packages will be installed automatically by the package manager, or they will need to be installed manually.
.NET SDK
The analyzer requires .NET SDK 8.0 installed on a machine. Instructions for adding the .NET repository to various Linux distributions can be found here.
The .NET SDK for macOS can be downloaded from this page.
Note. When installing pvs-studio-dotnet via the package manager on Linux, the version of the .NET SDK required for the analyzer will be installed automatically, but the .NET repository must first be added manually.
pvs-studio
The PVS-Studio C# analyzer requires the presence of the PVS-Studio C++ analyzer (pvs-studio) to work.
Note. When installing the PVS-Studio C# analyzer package (pvs-studio-dotnet) via the package manager, the C++ analyzer package (pvs-studio) will be installed automatically and you can skip this step.
When installing the C# analyzer via unpacking the archive, you must also install the C++ analyzer (pvs-studio). The C++ analyzer must be installed in the following directories:
- Linux: any directory whose path is written in the 'PATH' environment variable;
- macOS: /usr/local/bin/pvs-studio
Instructions for installing pvs-studio are available in the corresponding sections of the documentation: Linux, macOS.
Installing the analyzer on Linux operating systems
Installation from repositories
Installing from the repository is the recommended method that allows you to automatically install the necessary dependencies and get updates.
For debian-based systems
wget -q -O - https://cdn.pvs-studio.com/etc/pubkey.txt | \
sudo apt-key add -
sudo wget -O /etc/apt/sources.list.d/viva64.list \
https://cdn.pvs-studio.com/etc/viva64.list
sudo apt-get update
sudo apt-get install pvs-studio-dotnetFor yum-based systems
wget -O /etc/yum.repos.d/viva64.repo \
https://cdn.pvs-studio.com/etc/viva64.repo
yum update
yum install pvs-studio-dotnetFor zypper-based systems
wget -q -O /tmp/viva64.key https://cdn.pvs-studio.com/etc/pubkey.txt
sudo rpm --import /tmp/viva64.key
sudo zypper ar -f https://cdn.pvs-studio.com/rpm viva64
sudo zypper update
sudo zypper install pvs-studio-dotnetManual installation
Direct links to download packages / archives are available on the download page. The installation / unpacking commands are given below.
Deb package
sudo gdebi pvs-studio-dotnet-VERSION.debor
sudo apt-get -f install pvs-studio-dotnet-VERSION.debRpm package
sudo dnf install pvs-studio-dotnet-VERSION.rpmor
sudo zypper install pvs-studio-dotnet-VERSION.rpmor
sudo yum install pvs-studio-dotnet-VERSION.rpmor
sudo rpm -i pvs-studio-dotnet-VERSION.rpmArchive
tar -xzf pvs-studio-dotnet-VERSION.tar.gz
sudo ./install.shAnalyzer installation on macOS
Installation from Homebrew
Installation commands:
brew install viva64/pvs-studio/pvs-studio
brew install viva64/pvs-studio/pvs-studio-dotnetUpdate commands:
brew upgrade pvs-studio
brew upgrade pvs-studio-dotnetManual installation
The command to unpack the archive:
tar -xzf pvs-studio-dotnet-VERSION.tar.gz
sudo sh install.shLicense entering
Before using the PVS-Studio analyzer, make sure that the license is entered. You can find more information about entering the license here.
Projects analysis
Analyzer usage is described in the corresponding section of the documentation.
Using PVS-Studio with JetBrains Rider and CLion
- Watch, don't read (YouTube)
- Installing the plugin from the official JetBrains repository
- Installing the plugin from the PVS-Studio repository
- Installing the PVS-Studio analyzer
- Entering a license
- Plugin settings
- Checking code with PVS-Studio from Rider
- Checking code with PVS-Studio from Rider
- Checking code from CLion with PVS-Studio
- Managing analysis results
PVS-Studio analyzer can be used with JetBrains Rider IDE and CLion IDE as a plugin providing a convenient GUI for analyzing projects and individual files as well as managing diagnostic messages.
PVS-Studio plugins for Rider and CLion can be installed from the official JetBrains plugin repository or from the repository on our website. Another way to install it is by using the PVS-Studio installer for Windows, which is available on our download page.
Watch, don't read (YouTube)
Installing the plugin from the official JetBrains repository
To install PVS-Studio plugin from the official JetBrains repository, open the settings window by clicking 'File -> Settings -> Plugins', choose the Marketplace tab, and enter 'PVS-Studio' in the search bar. The PVS-Studio plugin will appear in the search results:
Installing the plugin in Rider:
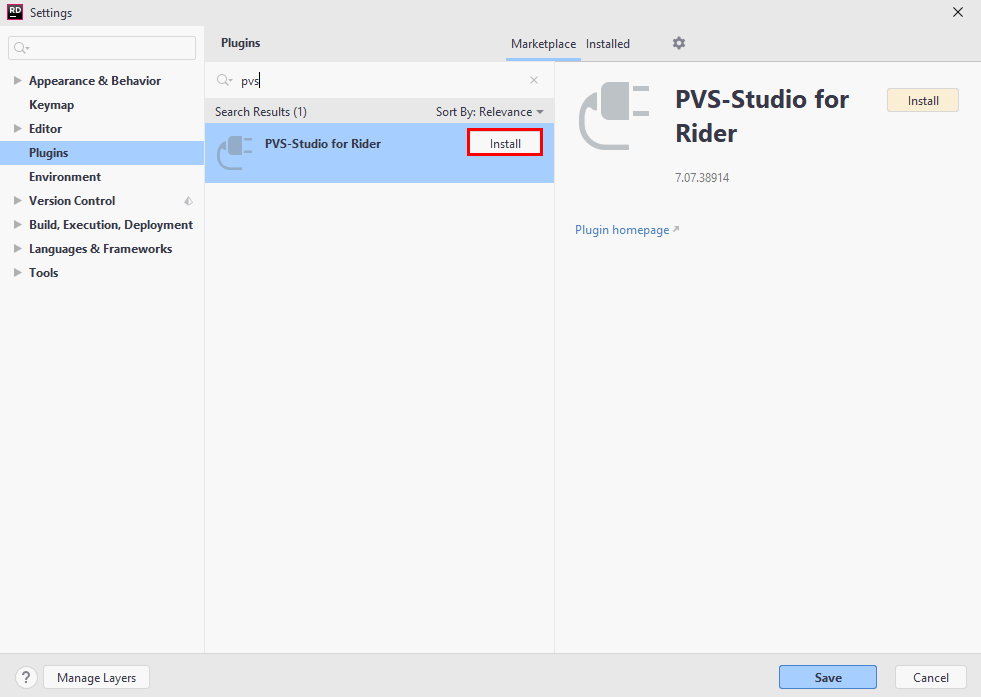
Installing the plugin in CLion:
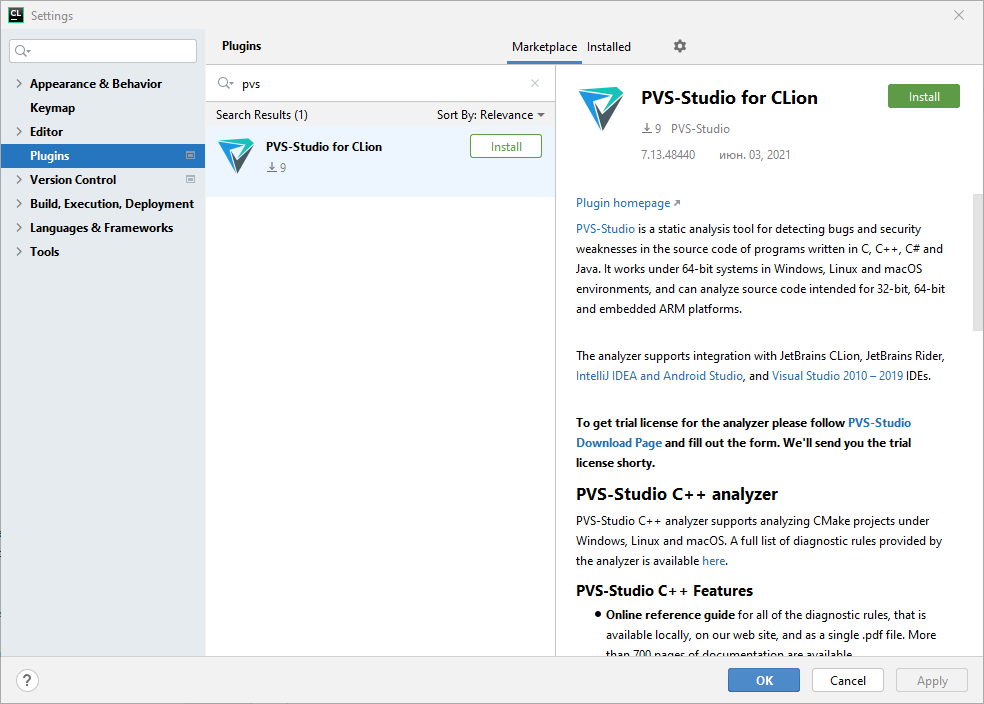
Click 'Install' next to the plugin name. Once the installation is finished, click Restart IDE.
In Rider:
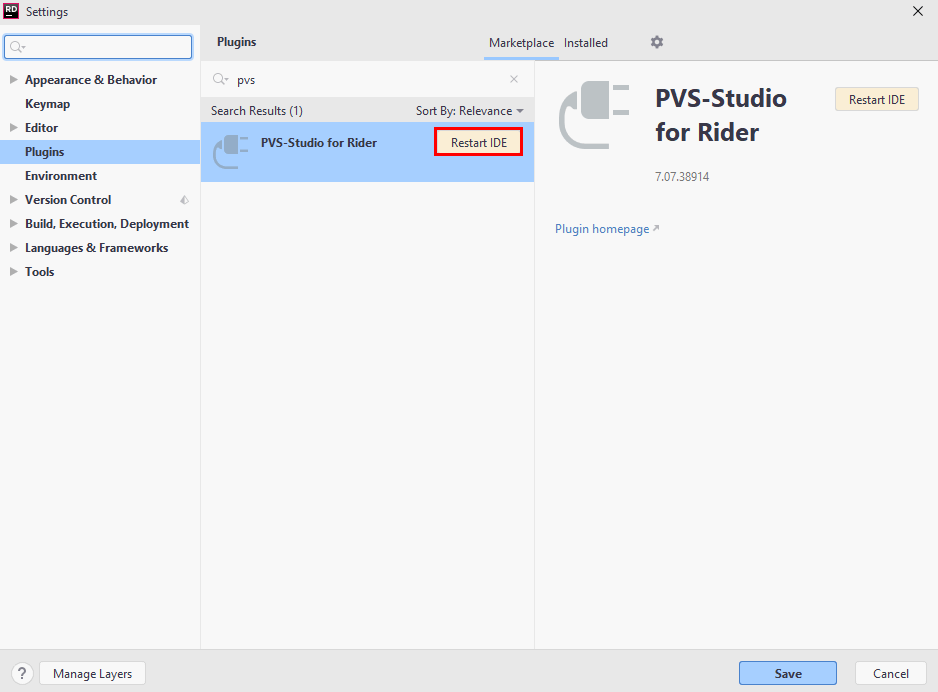
In CLion:

After restarting the IDE, you can use PVS-Studio plugin to analyze your code. The next step is to install the PVS-Studio analyzer.
Installing the plugin from the PVS-Studio repository
In addition to the official JetBrains repository, PVS-Studio plugin is also available from PVS-Studio's own repository. To install the plug-in from there, you first need to add this repository to IDE. To do this, click on the 'File -> Settings -> Plugins' command to open the plugin installation window.
For Rider:

For CLion:
In that window, click the gear icon in the top-right corner and select 'Manage Plugin Repositories' in the drop-down menu.
For Rider:

For CLion:
In the opened window, add:
- the http://files.pvs-studio.com/java/pvsstudio-rider-plugins/updatePlugins.xml path for Rider;
- the http://files.pvs-studio.com/java/pvsstudio-clion-plugins/updatePlugins.xml for CLion,
and click OK.
Rider:

CLion:

The final installation step is the same as in the previous scenario of installing the plugin from the official repository: open the Marketplace tab and enter "PVS-Studio" in the search box. Select the plugin 'PVS-Studio for Rider' or 'PVS-Studio for CLion' in the search results, click 'Install', and restart the IDE.
Installing the PVS-Studio analyzer
To be able to use PVS-Studio in the Rider IDE and CLion IDE, you will also need to install the kernel of the analyzer and its dependencies in addition to the plugin itself.
If you have installed the plugin using the PVS-Studio installer for Windows, then all the required components have been already installed on your system, so you can skip this step.
If you have installed the plugin separately (by adding the repository or from the official JetBrains repository), you fist need to download and install the PVS-Studio C++ or C# analyzer core for the relevant platform from here.
Entering a license
You need to enter the license after installation. See the documentation for more information about entering the license in Rider/CLion.
Plugin settings
The Settings window of the PVS-Studio plugin comprises several tabs. Let's discuss each in detail.
Settings – settings of the PVS-Studio analyzer core. Hover the mouse pointer over the option name to see a pop-up tooltip for that option.
For Rider:
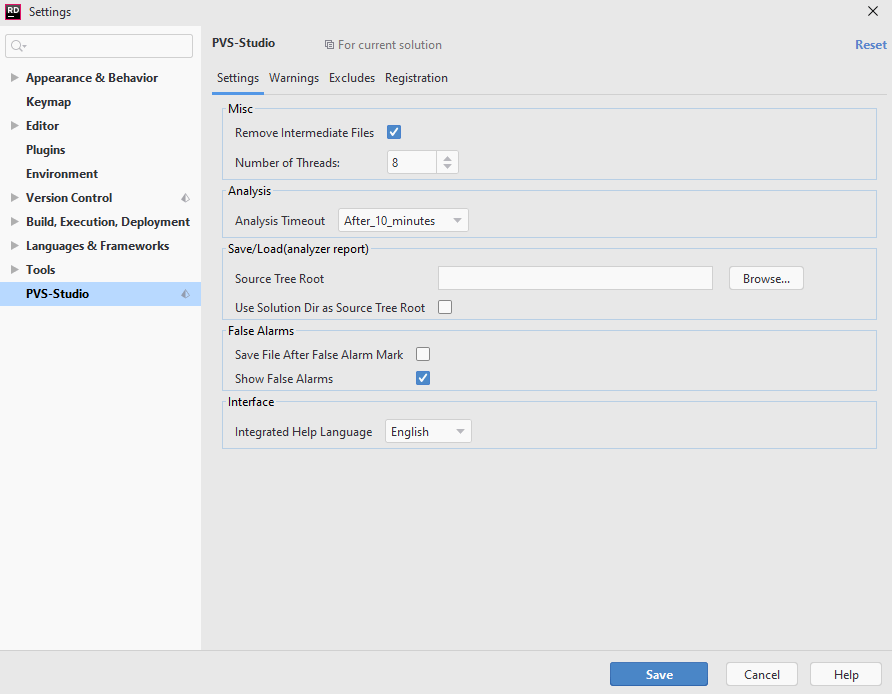
For CLion:
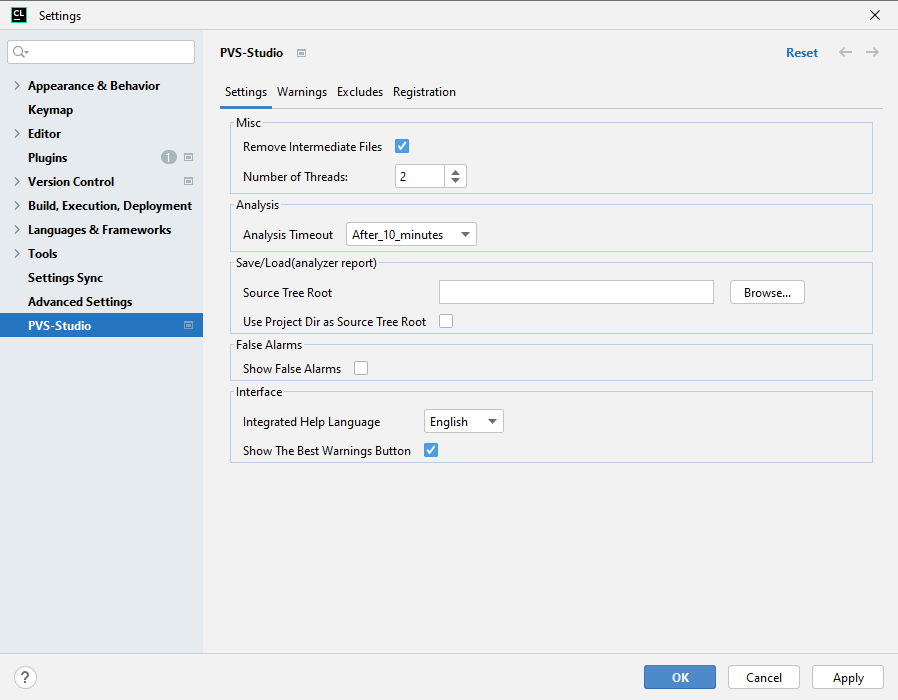
Warnings – a list of all the diagnostic rules supported by the analyzer. Unchecking a diagnostic rule prevents all warnings associated with it from being displayed in the analyzer's output window.

Excludes – contains masks for filenames and paths to be excluded from analysis.
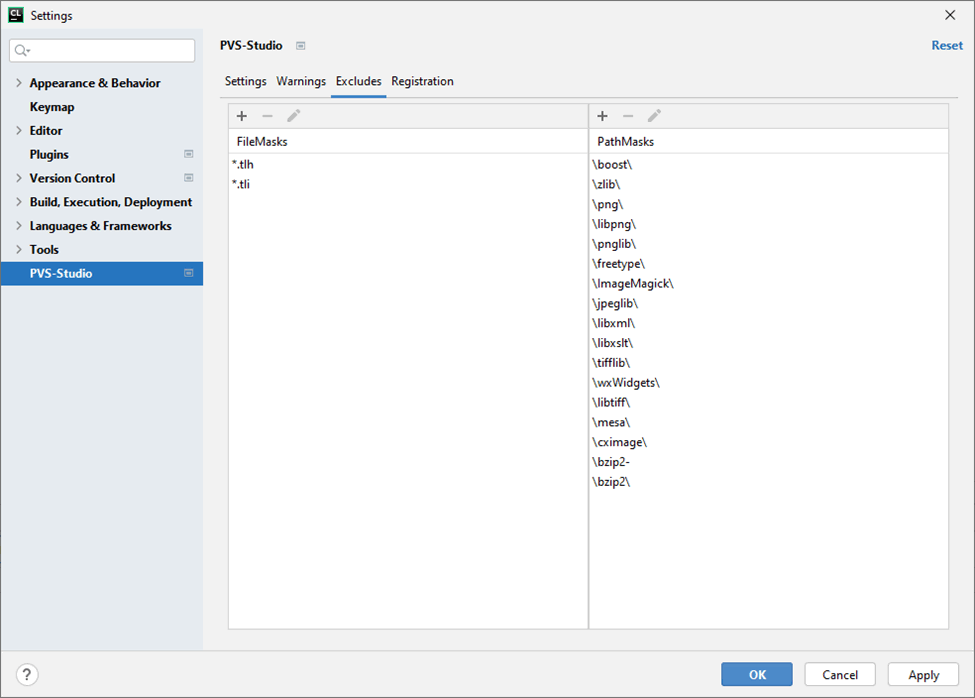
Registration – contains information about the current license.

Checking code with PVS-Studio from Rider
JetBrains Rider can open projects in two modes: the project itself, or the project's source folder. When opening a project, Rider can open both individual 'csproj' files, and a solution file containing one or more project files.
With a project or solution opened, you can choose to check:
- The current project/solution.
- The current project/solution in the intermodular mode.
- Items selected in the 'Explorer' window.
- File currently opened in the code editor.
To analyze the current project or solution, you can use the Tools -> PVS-Studio -> Check Current Solution/Project menu item. There is also a menu item to run the intermodular analysis. In the intermodular mode, the analyzer performs a deeper analysis of the C and C++ code by increasing the analysis time (the C# analyzer provides intermodular analysis by default):

To analyze a file opened for editing, you can use:
- the Tools -> PVS-Studio -> Check Open File menu item;
- the context menu item of the file;
- the context menu item of the file header in the file editor.
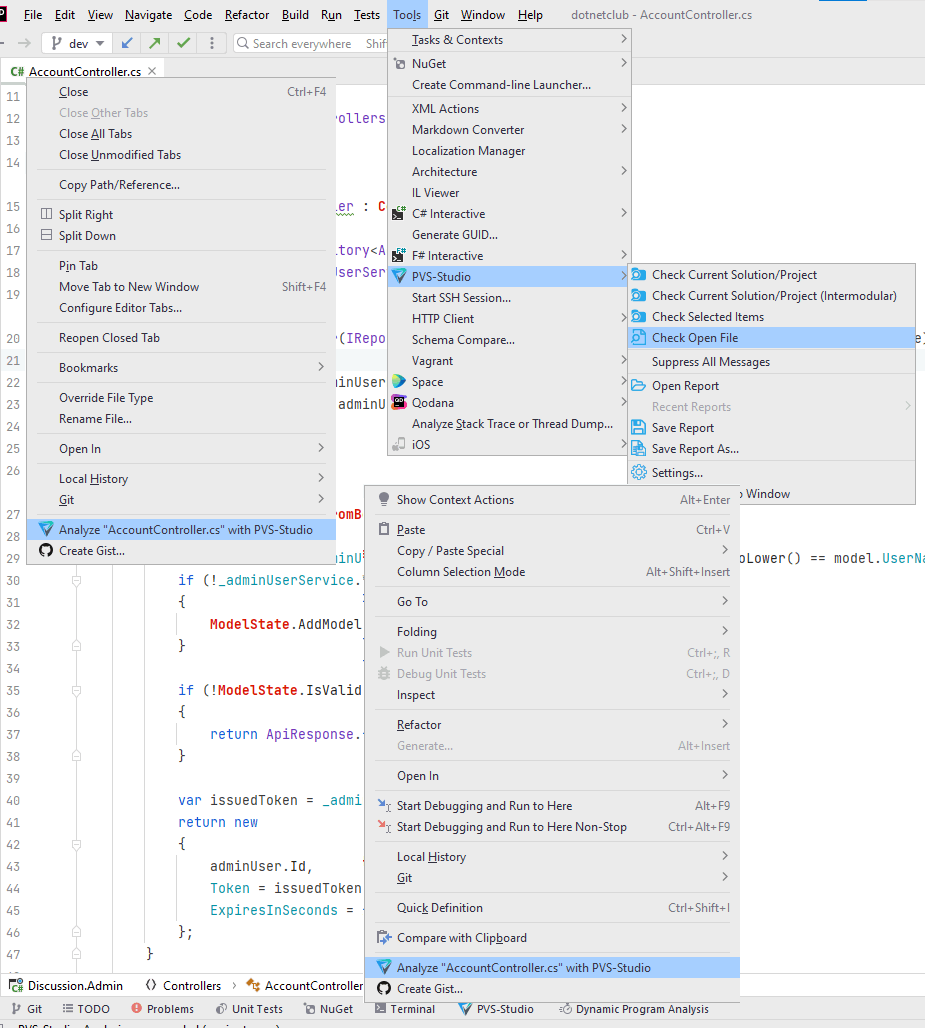
You can also select several items in the 'Explorer' window using the CTRL/SHIFT + mouse Left Click and then choose 'Tools -> PVS-Studio -> Check Selected Items' command:
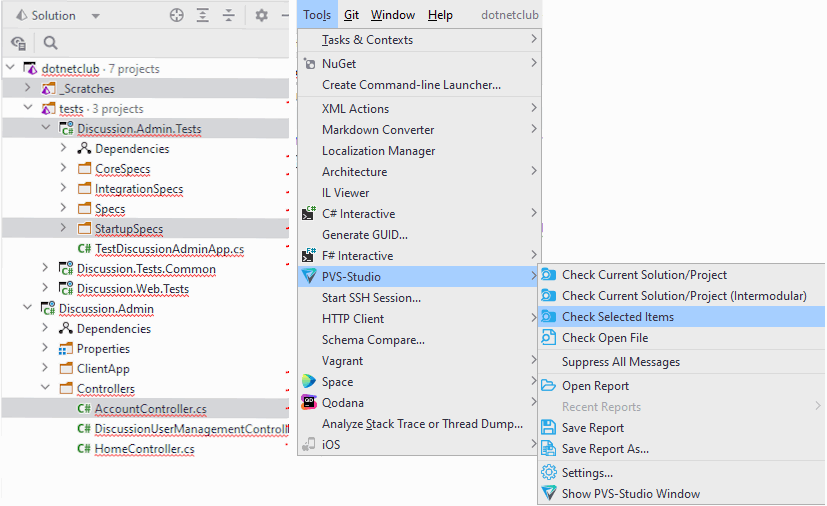
Another way to do this is to open the drop-down menu by right-clicking in the 'Explorer' window and selecting 'Check Selected Items' menu item:

In the examples above, all of the *.cs and *.csproj files from the folders Core and Controllers, as well as the Startup.cs file will be analyzed.
When a project folder is opened in Rider, PVS-Studio doesn't know which project, file, or solution exactly should be analyzed, so the 'Check Current Solution/Project' and 'Check Open File' menu items are inactive. The only available option is to check the solution through the 'Tools -> PVS-Studio -> Check Selected Items' command:
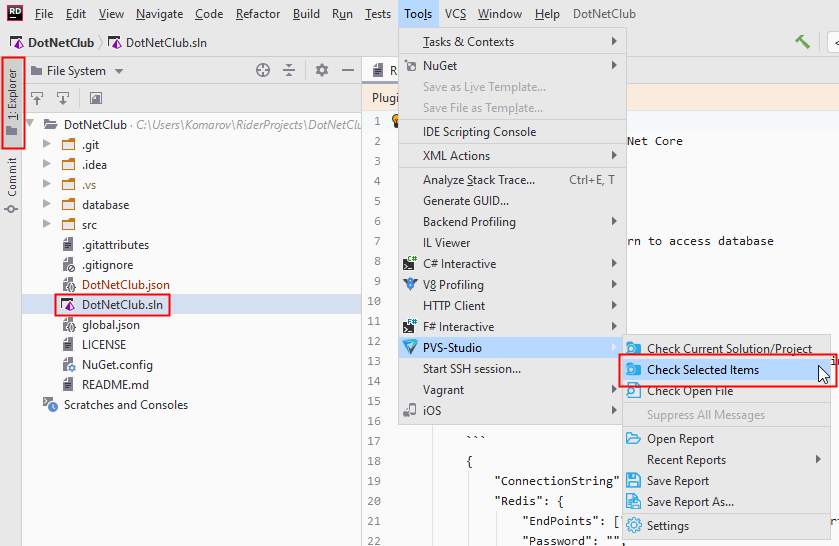
Another way to achieve this is to open the drop-down menu by right-clicking in the 'Explorer' window and selecting 'Check Selected Items' menu item.

Checking code with PVS-Studio from Rider
Rider supports Unreal Engine projects. Standard scenario of analysis diverges from the one described hereto. Find the details in the following documentation.
Checking code from CLion with PVS-Studio
JetBrains CLion allows to open CMake projects.
You can check:
- The current project.
- The current project in the intermodular mode.
- Items selected in the 'Explorer' window.
- The file currently opened in the code editor.
To analyze the current project, you can use the Tools -> PVS-Studio -> Check Project menu item. There is also a menu item to start intermodular analysis. In the intermodular mode, the analyzer performs a deeper code analysis by increasing the analysis time:

To analyze a file opened for editing, you can use:
- the Tools -> PVS-Studio -> Check Current File menu item;
- the context menu item of the file;
- the context menu item of the file header in the file editor.
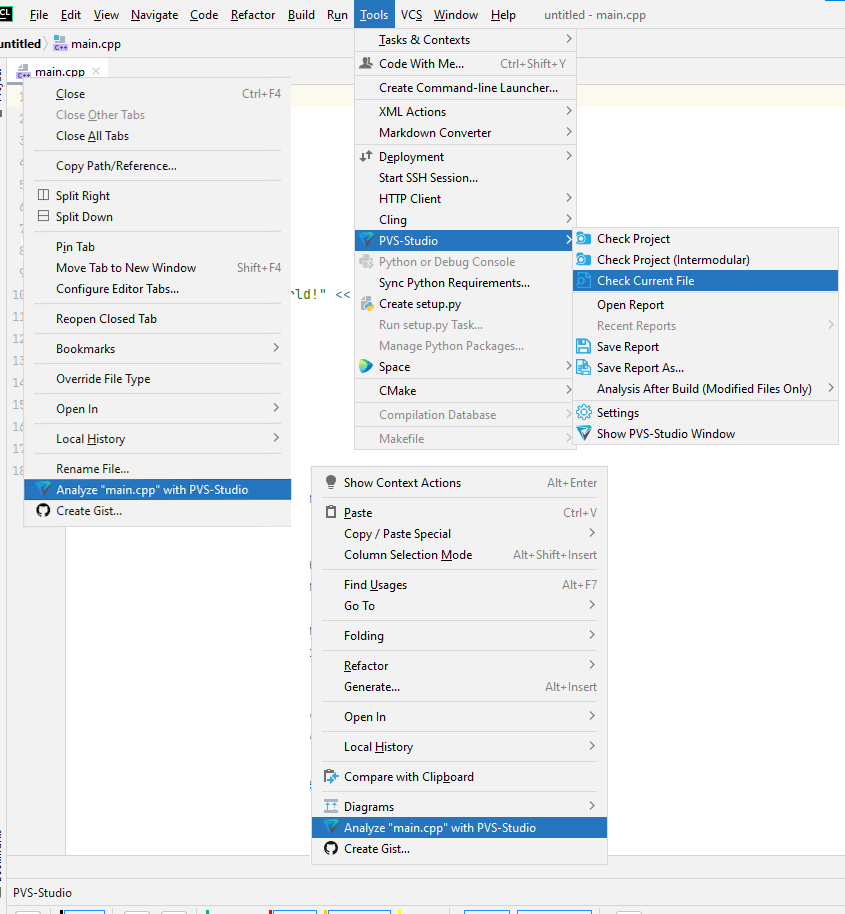
You can also select several items in the 'Explorer' window using the CTRL/SHIFT + mouse Left Click and then by right-clicking choose -> Analyze with PVS-Studio:

In the examples above, all the *.cpp files from '3rdparty', 'parallel' folders, as well as the samples.cpp file will be analyzed.
Managing analysis results
The analysis results produced by PVS-Studio analyzer will appear in the table inside the 'PVS-Studio' window, for Rider:
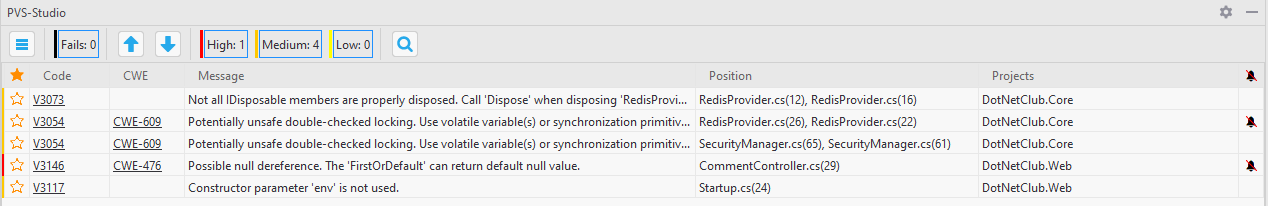
For CLion:
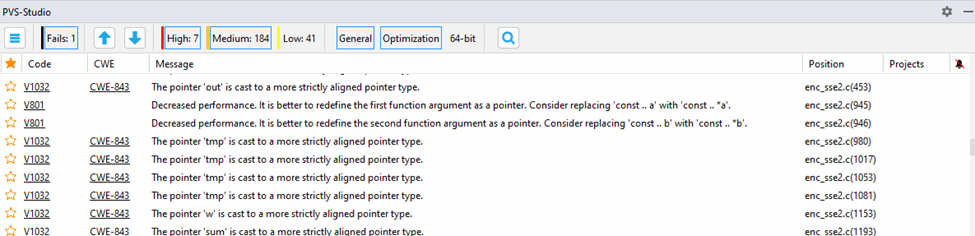
The table is made up of 8 columns (from left to right: Favorite, Code, CWE, SAST, Message, Position, Projects, False Alarms). The analyzer messages can be sorted by any column. To change the sorting order, click on the column heading. The leftmost column (Favorite) can be used to bookmark warnings for quick search among marked messages by sorting the messages by the Favorite column.

When clicking on a warning code in the Code / CWE columns, a webpage will open in your browser providing a detailed description of the warning or potential vulnerability. The Message column provides brief descriptions of the warnings. The Position column contains a list of files the warning refers to. The Projects column is a list of projects containing the file the warning refers to. The rightmost column, False Alarms, contains warnings marked as false positives. Managing false positives will be described in detail further, in the corresponding section.
Double clicking on a table row opens a file at the line the warning was triggered at:
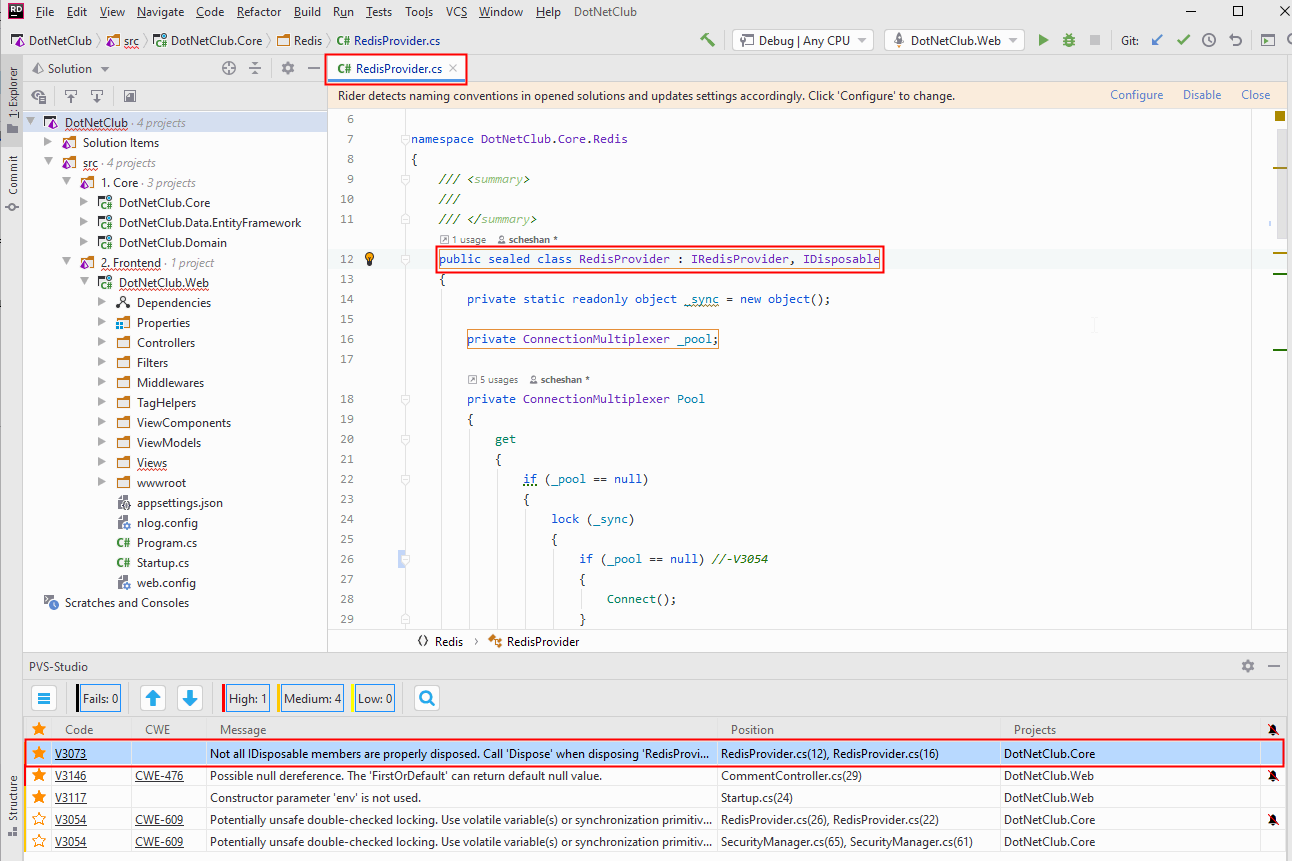
There are also two arrow buttons above the table – these can be used to move between the warnings and open the associated files in the source code editor. To the right of the arrow buttons, a number of filter buttons are available, which allow you to sort the warnings by severity level: High, Medium, Low, and Fails (failures of the analyzer itself).
When clicking the search icon, an additional panel opens with text fields for searching across the Code, CWE, Message, and Position columns. Each field is a string filter allowing you to filter the messages by the text you have entered.
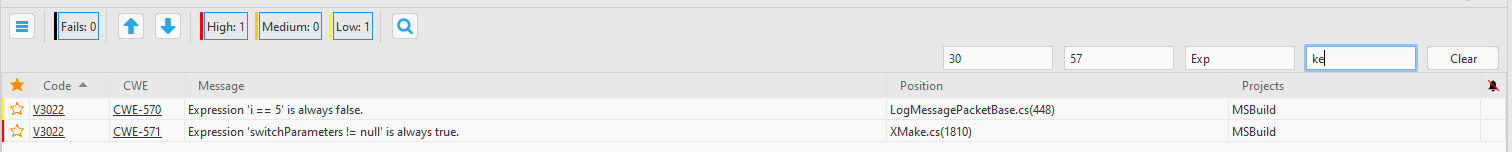
The button with three horizontal lines across it can be found in the top-left corner above the table. Clicking it opens an additional settings panel:

Clicking the gear icon opens the plugin's settings main window, which is also available at 'Tools -> PVS-Studio -> Settings'.
View the analyzer's most interesting warnings
If you are new to the static analysis tool and would like to know what it can do, you can use the Best Warnings mechanism. This mechanism will show you the most important and reliable warnings.
To check out the analyzer's most interesting warnings, click on the 'Best' button, as shown in the screenshot below:
After that, the table with the results of the analysis will show maximum of ten of the most critical warnings of the analyzer.
Managing false positives
Sometimes you may get a warning pointing out some spot in your code, but you know that there is no error in that spot. Such a warning is called a false positive.
PVS-Studio plugin allows you to mark the analyzer's messages as false positives to prevent them from appearing in future checks.
To mark false positives, select one or more warnings in the 'PVS-Studio' table, right-click on any row to open the drop-down menu, and select the 'Mark selected messages as False Alarms' command:
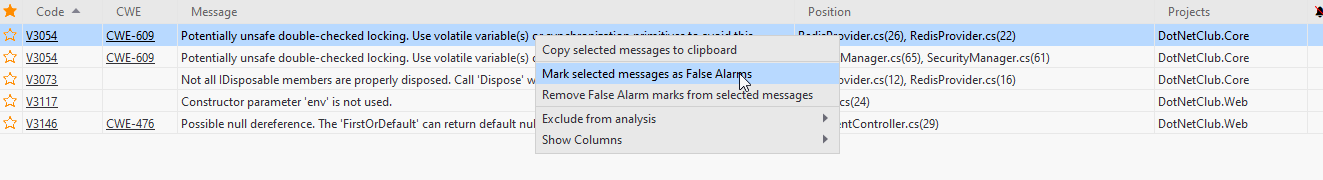
The analyzer will add a special comment of the '\\-Vxxx' pattern to the line the warning has been triggered by, where xxx is the PVS-Studio's diagnostic number. You can also add such comments manually.
To have previously marked false warnings displayed in the table, enable the 'Show False Alarms' option at 'Tools -> PVS-Studio -> Settings', for Rider:
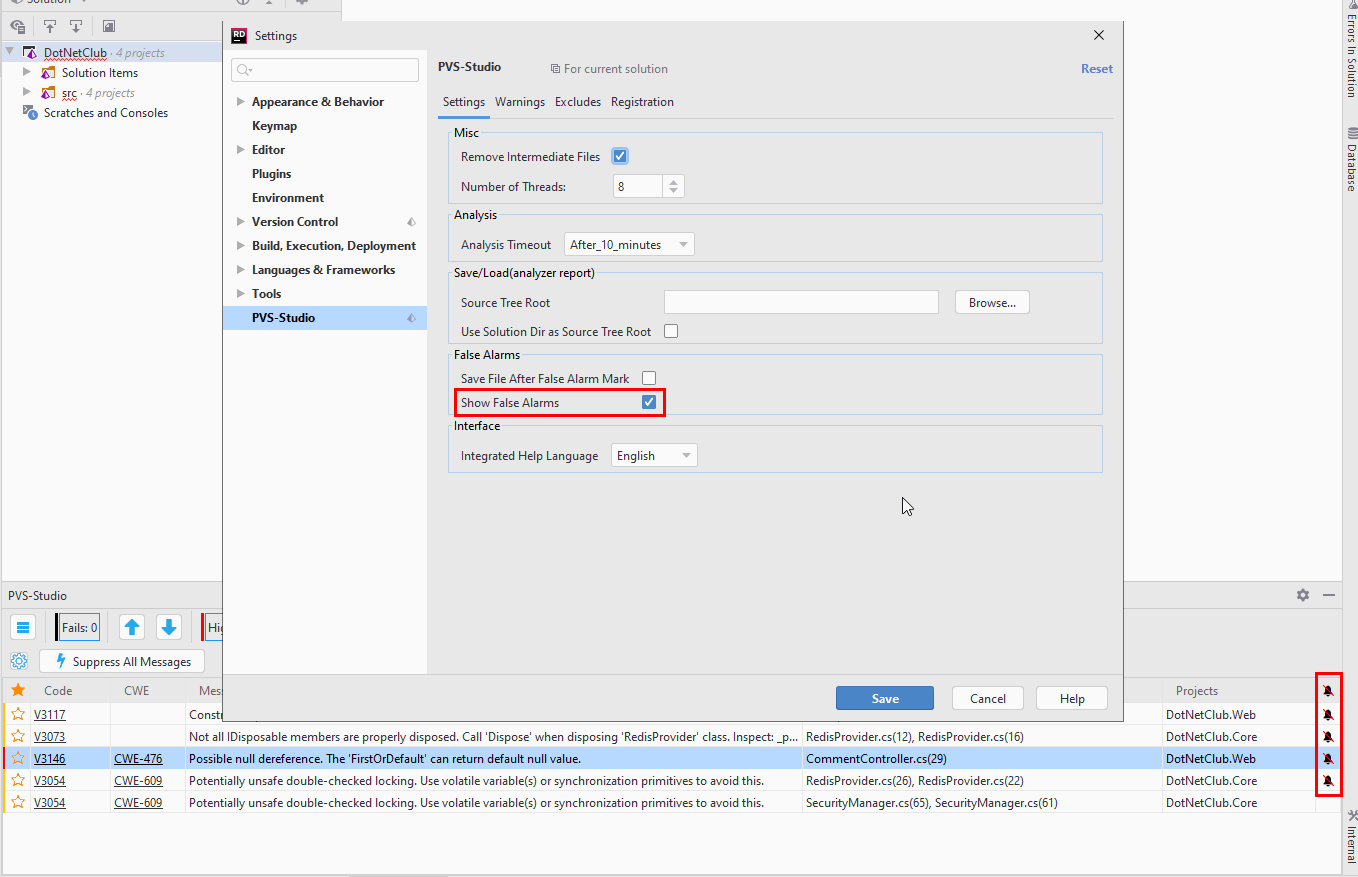
For CLion:
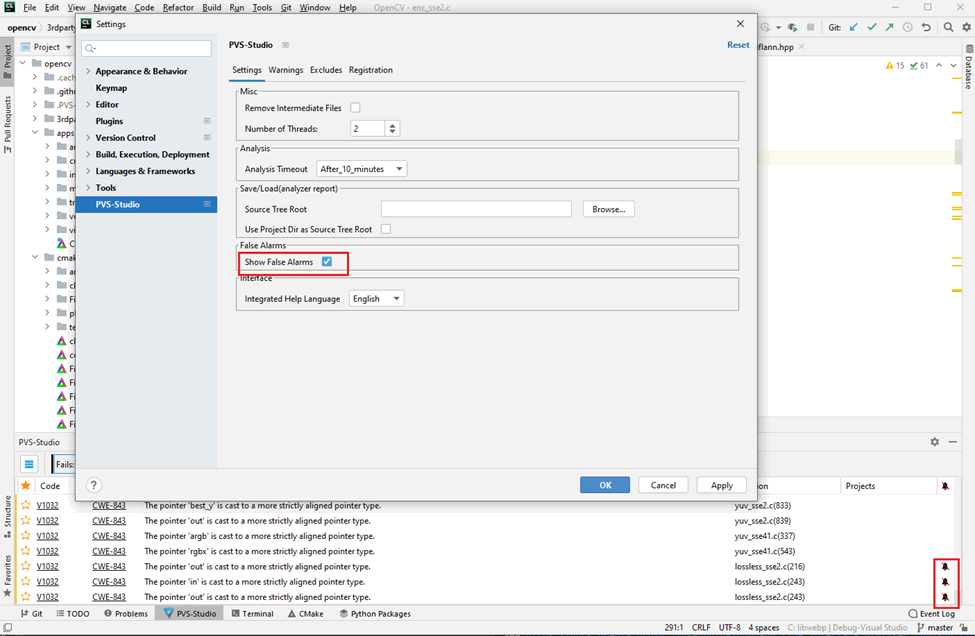
Use the 'Remove False Alarm marks from selected messages' drop-down menu item to unmark selected warnings as false positives.
To learn more about suppressing warnings generated by the analyzer and other ways of suppressing warnings with configuration files (.pvsconfig) added to the project, see the Suppression of False Alarms documentation section.
Suppressing analyzer warnings in legacy code
Getting started with static analysis and using it regularly may be difficult due to multiple warnings triggered by legacy code. Such code is typically well tested and stable, so fixing every warning in it isn't necessary – all the more so because if the code base is large, fixing it may take a long time. What's more, warnings issued on legacy code prevent you from focusing on warnings issued on newly written code still in development.
To solve this problem and start using static analysis regularly without delay, PVS-Studio allows you to "turn off" warnings in the legacy code. To do that, select 'Tools -> PVS-Studio -> Suppress All Messages' command or click the 'Suppress All Messages' button on the PVS-Studio window toolbar. After that, all messages will be added to special *.suppress files, which is what the suppression mechanism is based on. The next time you run the analysis, the warnings added to these *.suppress files will be excluded from the analyzer's report. This suppression mechanism is quite flexible and is able to "track" suppressed messages even after you modify or move the involved code fragments.
In Rider the *.suppress files are created at the project level, in the same location where the project file is stored, but you can also add them to any project or solution (for example, if you want to use one suppress file for several projects or an entire solution). To get those warnings back in the report, delete the suppress files associated with the affected projects and restart the analysis.
In CLion suppressed messages are added in the suppress_file.suppress.json file, which is written in the .PVS-Studio directory, in the root directory of project opened in CLion. To get those warnings back in the analyzer report, delete this file and run the analysis again.
To learn more about warning suppression and to see the guide on handling *.suppress files, see the Mass suppression of analyzer warnings documentation section.
You can also read the "How to introduce a static code analyzer in a legacy project and not to discourage the team" article.
Dropdown menu of the warnings table
Right-clicking on a warning in the PVS-Studio window table opens a drop-down menu, which contains additional items for managing selected warnings.
Clicking the 'Mark selected messages as False Alarms / Remove false alarm masks' item marks selected warnings as false positives by adding a special comment to the lines of code they refer to (see the section above on managing false positives).
The 'Exclude from analysis' item is used to add the full or partial pathname of the file containing a warning to the list of folders excluded from analysis. Every file whose pathname matches the filter will be excluded from the analysis.
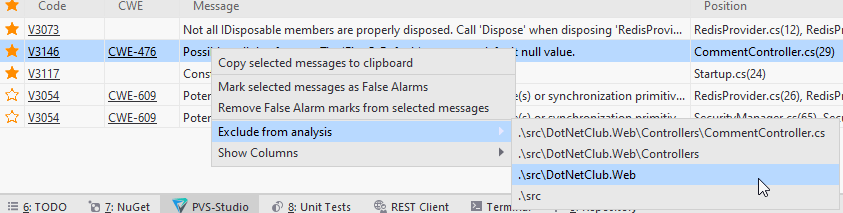
Saving and loading analysis results
Analysis results can be saved or loaded using the items of the 'Tools -> PVS-Studio' submenu:
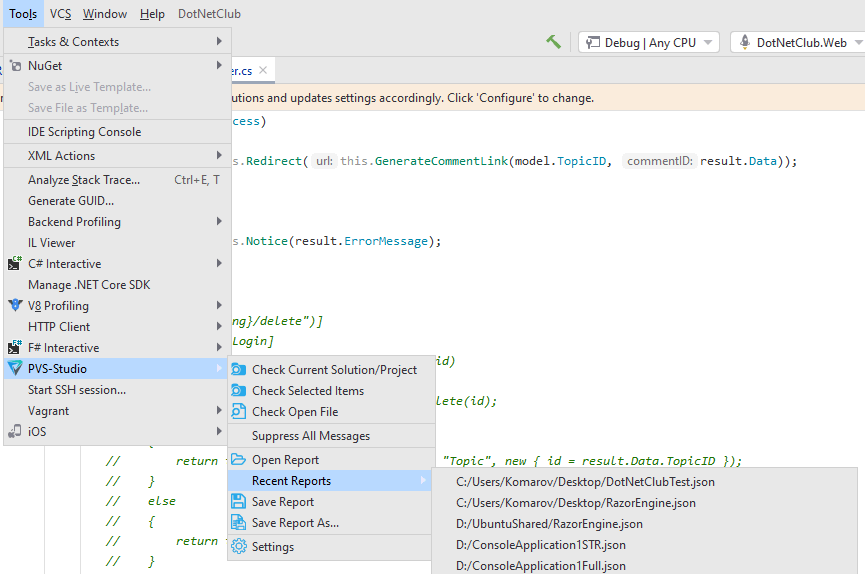
The 'Open Report' command opens the .json report file and loads its contents into the table in the 'PVS-Studio' output window.
The 'Recent Reports' submenu contains a list of recently opened reports. Clicking an item on this list opens that file (given that it still exists at that location) and loads its contents into the table in the 'PVS-Studio' window.
Selecting the 'Save Report' item saves all the messages from the table (even the filtered ones) to a .json report file. If the current list of messages has never been saved before, you will be prompted for a name and location to store the report file to.
Similarly, the 'Save Report As' item is used to save all the warnings from the table (even the filtered ones) to a .json file and always prompts you to specify the location to store the report file to.
Keyboard shortcuts in the PVS-Studio plugins for Rider and CLion
The PVS-Studio plugins for Rider and CLion have the analysis result window. This window has a dropdown menu that appears when you right-click on the analysis result window:

Some of these actions have keyboard shortcuts. Thus, you can perform them without using a mouse.
The arrow keys for navigating the analyzer's warnings also have shortcuts:
- move to the next message: Alt + [;
- move to the previous message: Alt + ].
Using shortcuts is helpful, since they speed up the analysis result processing. You can set and customize the shortcuts in settings: File -> Settings -> Keymap. To find shortcuts faster, enter 'PVS-Studio' in the search field of the Keymap window.
V001. A code fragment from 'file' cannot be analyzed.
The analyzer sometimes fails to diagnose a file with source code completely.
There may be three reasons for that:
1) An error in code
There is a template class or template function with an error. If this function is not instantiated, the compiler fails to detect some errors in it. In other words, such an error does not hamper compilation. PVS-Studio tries to find potential errors even in classes and functions that are not used anywhere. If the analyzer cannot parse some code, it will generate the V001 warning. Consider a code sample:
template <class T>
class A
{
public:
void Foo()
{
//forget ;
int x
}
};Visual C++ will compile this code if the A class is not used anywhere. But it contains an error, which hampers PVS-Studio's work.
2) An error in the Visual C++'s preprocessor
The analyzer uses the Visual C++'s preprocessor while working. From time to time this preprocessor makes errors when generating preprocessed "*.i" files. As a result, the analyzer receives incorrect data. Here is a sample:
hWnd = CreateWindow (
wndclass.lpszClassName, // window class name
__T("NcFTPBatch"), // window caption
WS_OVERLAPPED | WS_CAPTION | WS_SYSMENU | WS_MINIMIZEBOX,
// window style
100, // initial x position
100, // initial y position
450, // initial x size
100, // initial y size
NULL, // parent window handle
NULL, // window menu handle
hInstance, // program instance handle
NULL); // creation parameters
if (hWnd == NULL) {
...Visual C++'s preprocessor turned this code fragment into:
hWnd = // window class name// window caption// window style//
initial x position// initial y position// initial x size//
initial y size// parent window handle// window menu handle//
program instance handleCreateWindowExA(0L,
wndclass.lpszClassName, "NcFTPBatch", 0x00000000L | 0x00C00000L |
0x00080000L | 0x00020000L, 100, 100,450, 100, ((void *)0),
((void *)0), hInstance, ((void *)0)); // creation parameters
if (hWnd == NULL) {
...It turns out that we have the following code:
hWnd = // a long comment
if (hWnd == NULL) {
...This code is incorrect and PVS-Studio will inform you about it. Of course it is a defect of PVS-Studio, so we will eliminate it in time.
It is necessary to note that Visual C++ successfully compiles this code because the algorithms it uses for compilation purposes and generation of preprocessed "*.i" files are different.
3) Defects inside PVS-Studio
On rare occasions PVS-Studio fails to parse complex template code.
Whatever the reason for generating the V001 warning, it is not crucial. Usually incomplete parse of a file is not very significant from the viewpoint of analysis. PVS-Studio simply skips a function/class with an error and continues analyzing the file. Only a small code fragment is left unanalyzed.
V002. Some diagnostic messages may contain incorrect line number.
The analyzer can sometimes issue an error "Some diagnostic messages may contain incorrect line number". This occurs when it encounters multiline #pragma directives, on all supported versions of Microsoft Visual Studio.
Any code analyzer works only with preprocessed files, i.e. with those files in which all (#define) macros are expanded and all included files are substituted (#include). Also in the pre-processed file there is information about the substituted files and their positions. That means, in the preprocessed files there is information about line numbers.
Preprocessing is carried out in any case. For the user this procedure looks quite transparent. Sometimes the preprocessor is a part of the code analyzer and sometimes (like in the case with PVS-Studio) external preprocessor is used. In PVS-Studio we use the preprocessor by Microsoft Visual Studio or Clang. The analyzer starts the command line compiler cl.exe/clang.exe for each C/C++ file being processed and generates a preprocessed file with "i" extension.
Here is one the situation where the message "Some diagnostic messages may contain incorrect line number" is issued and a failure in positioning diagnostic messages occurs. It happens because of multiline directives #pragma of a special type. Here is an example of correct code:
#pragma warning(push)
void test()
{
int a;
if (a == 1) // PVS-Studio will inform about the error here
return;
}If #pragma directive is written in two lines, PVS-Studio will point to an error in an incorrect fragment (there will be shift by one line):
#pragma \
warning(push)
void test()
{
int a; // PVS-Studio will show the error here,
if (a == 1) // actually, however, the error should be here.
return;
}However, in another case there will be no error caused by the multiline #pragma directive:
#pragma warning \
(push)
void test()
{
int a;
if (a == 1) // PVS-Studio will inform about the error in this line
return;
}Our recommendation here is either not to use the multiline #pragma directives at all, or to use them in such a way that they can be correctly processed.
The code analyzer tries to detect a failure in lines numbering in the processed file. This mechanism is a heuristic one and it cannot guarantee correct determination of diagnostic messages positioning in the program code. However, if it is possible to find out that a particular file contains multiline pragmas, and there exists a positioning error, then the message "Some diagnostic messages may contain incorrect line number" is issued.
This mechanism works in the following way.
The analyzer opens the source C/C++ file and searches for the very last token. It selects only those tokens that are not shorter than three symbols in order to ignore closing parentheses, etc. E.g., for the following code the "return" operator will be considered as the last token:
01 #include "stdafx.h"
02
03 int foo(int a)
04 {
05 assert(a >= 0 &&
06 a <= 1000);
07 int b = a + 1;
08 return b;
09 }Having found the last token, the analyzer will determine the number of the line which contains it. In this very case it is line 8. Further on, the analyzer searches for the last token in the file which has already been preprocessed. If the last tokens do not coincide, then most likely the macro in the end of file was not expanded; the analyzer is unable to understand whether the lines are arranged correctly, and ignores the given situation. However, such situations occur very rarely and last tokens almost always coincide in the source and preprocessed files. If it is so, the line number is determined, in which the token in the preprocessed file is situated.
Thus, we have the line numbers in which the last token is located in the source file and in the preprocessed file. If these line numbers do not coincide, then there has been a failure in lines numbering. In this case, the analyzer will notify the user about it with the message "Some diagnostic messages may contain incorrect line number".
Please consider that if a multiline #pragma-directive is situated in the file after all the dangerous code areas are found, then all the line numbers for the found errors will be correct. Even though the analyzer issues the message "Some diagnostic messages may contain incorrect line number for file", this will not prevent you from analyzing the diagnostic messages issued by it.
Please pay attention that this error may lead to incorrect work of the code analyzer, although it is not an error of PVS-Studio itself.
V003. Unrecognized error found...
The V003 warning in the report means that a critical error has occurred within the analyzer. Most likely, no other warnings will be issued to the analyzed file in this case.
Troubleshooting
Even though the V003 warning is quite rare, we would appreciate it if you could help us fix the issue that triggers the warning. To do this, please send us the files described below via the feedback form.
The stack trace file
When receiving a warning of the following type:
V003 Unrecognized error found: stacktrace was written to the file
source.cpp.PVS-Studio.stacktrace.txt 1You can go to a text file that looks like this:
PVS-Studio version: 7.XX.XXXXX.XXXX
#NN Object "[0xffffffffffffffff]", at 0xffffffffffffffff, in
....
#1 Object "[0xb39b7e]", at 0xb39b7e, in
#0 Object "[0xcfac19]", at 0xcfac19, inSince the PVS-Studio is shipped without debugging information, the file contains only function addresses. However, we can decode this file on our end and determine the source of the error.
Note. The stack trace file does not contain any source code information.
Intermediate files to run the analysis
The analysis of C and C++ source code is based on the preprocessed ('*.PVS-Studio.i') and configuration ('*.PVS-Studio.cfg') files. The preprocessor expands macros and '#include' directives to create the preprocessed file from the source file (e.g., 'file.cpp'). The configuration file contains the settings required to correctly perform the analysis on the file. A set of these files allows to localize the issue in the C and C++ analyzer core.
Below is a description of how various product components generate these files.
Plugins for IDEs. On the 'Common Analyzer Settings' tab of the PVS-Studio settings, set the 'RemoveIntermediateFiles' option to 'False'. Then, analyze again the files where the crash occurs.
PVS-Studio_Cmd / pvs-studio-dotnet. In the analysis configuration file ('Settings.xml'), set the 'RemoveIntermediateFiles' option to 'False' and analyze again the files where the crash occurs.
CompilerCommandsAnalyzer / pvs-studio-analyzer. Add the '--dump-files' flag to the analysis start line:
pvs-studio-analyzer analyze .... --dump-filesThen, find the corresponding i-file (for example, 'file.PVS-Studio.i') and 'file.PVS-Studio.cfg' corresponding to it in the project folder.
Note. Preprocessed files contain part of the project source code. We understand that company policy may prohibit the distribution of source code snippets. Thus, we are willing to sign an NDA if necessary. Transferring preprocessed and configuration files can greatly simplify and speed up debugging of the analyzer.
V004. Diagnostics from the 64-bit rule set are not entirely accurate without the appropriate 64-bit compiler. Consider utilizing 64-bit compiler if possible.
When detecting issues of 64-bit code, it is 64-bit configuration of a project that the analyzer must always test. For it is 64-bit configuration where data types are correctly expanded and branches like "#ifdef WIN64" are selected, and so on. It is incorrect to try to detect issues of 64-bit code in a 32-bit configuration.
But sometimes it may be helpful to test the 32-bit configuration of a project. You can do it in case when there is no 64-bit configuration yet but you need to estimate the scope of work on porting the code to a 64-bit platform. In this case you can test a project in 32-bit mode. Testing the 32-bit configuration instead of the 64-bit one will show how many diagnostic warnings the analyzer will generate when testing the 64-bit configuration. Our experiments show that of course far not all the diagnostic warnings are generated when testing the 32-bit configuration. But about 95% of them in the 32-bit mode coincide with those in the 64-bit mode. It allows you to estimate the necessary scope of work.
Pay attention! Even if you correct all the errors detected when testing the 32-bit configuration of a project, you cannot consider the code fully compatible with 64-bit systems. You need to perform the final testing of the project in its 64-bit configuration.
The V004 message is generated only once for each project checked in the 32-bit configuration. The warning refers to the file which will be the first to be analyzed when checking the project. It is done for the purpose to avoid displaying a lot of similar warnings in the report.
V005. Cannot determine active configuration for project. Please check projects and solution configurations.
This issue with PVS-Studio is caused by the mismatch of selected project's platform configurations declared in the solution file (Vault.sln) and platform configurations declared in the project file itself.
For example, the solution file may contain lines of this particular kind for concerned project:
{F56ECFEC-45F9-4485-8A1B-6269E0D27E49}.Release|x64.ActiveCfg = Release|x64
However, the project file itself may lack the declaration of Release|x64 configuration. Therefore trying to check this particular project, PVS-Studio is unable to locate the 'Release|x64' configuration. The following line is expected to be automatically generated by IDE in the solution file for such a case:
{F56ECFEC-45F9-4485-8A1B-6269E0D27E49}.Release|x64.ActiveCfg = Release|Win32
In automatically generated solution file the solution's active platform configuration (Release|x64.ActiveCfg) is set equal to one of project's existing configurations (I.e. in this particular case Release|Win32). Such a situation is expected and can be handled by PVS-Studio correctly.
V006. File cannot be processed. Analysis aborted by timeout.
Message V006 is generated when an analyzer cannot process a file for a particular time period and aborts. Such situation might happen in two cases.
The first reason - an error inside the analyzer that does not allow it to parse some code fragment. It happens rather seldom, yet it is possible. Although message V006 appears rather seldom, we would appreciate if you help us eliminate the issue which causes the message to appear. If you have worked with projects in C/C++, please send your preprocessed i-file where this issue occurs and its corresponding configuration launch files (*.PVS-Studio.cfg and *.PVS-Studio.cmd) to the address support@viva64.com.
Note. A preprocessed i-file is generated from a source file (for example, file.cpp) when the preprocessor finishes its work. To get this file you should set the option RemoveIntermediateFiles to False on the tab "Common Analyzer Settings" in PVS-Studio settings and restart the analysis of this one file. After that you can find the corresponding i-file in the project folder (for example, file.i and its corresponding file.PVS-Studio.cfg and file.PVS-Studio.cmd).
The second possible reason is the following: although the analyzer could process the file correctly, it does not have enough time to do that because it gets too few system resources due to high processor load. By default, the number of threads spawned for analysis is equal to the number of processor cores. For example, if we have four cores in our machine, the tool will start analysis of four files at once. Each instance of an analyzer's process requires about 1.5 Gbytes of memory. If your computer does not have enough memory, the tool will start using the swap file and analysis will run slowly and fail to fit into the required time period. Besides, you may encounter this problem when you have other "heavy" applications running on your computer simultaneously with the analyzer.
To solve this issue, you may directly restrict the number of cores to be used for analysis in the PVS-Studio settings (ThreadCount option on the "Common Analyzer Settings" tab).
V007. Deprecated CLR switch was detected. Incorrect diagnostics are possible.
The V007 message appears when the projects utilizing the C++/Common Language Infrastructure Microsoft specification, containing one of the deprecated /clr compiler switches, are selected for analysis. Although you may continue analyzing such a project, PVS-Studio does not officially support these compiler flags. It is possible that some analyzer errors will be incorrect.
V008. Unable to start the analysis on this file.
PVS-Studio was unable to start the analysis of the designated file. This message indicates that an external C++ preprocessor, started by the analyzer to create a preprocessed source code file, exited with a non-zero error code. Moreover, std error can also contain detailed description of this error, which can be viewed in PVS-Studio Output Window for this file.
There could be several reasons for the V008 error:
1) The source code is not compilable
If the C++ sources code is not compilable for some reason (a missing header file for example), then the preprocessor will exit with non-zero error code and the "fatal compilation error" type message will be outputted into std error. PVS-Studio is unable to initiate the analysis in case C++ file hadn't been successfully preprocessed. To resolve this error you should ensure the compilability of the file being analyzed.
2) The preprocessor's executable file had been damaged\locked
Such a situation is possible when the preprocessor's executable file had been damaged or locked by system antiviral software. In this case the PVS-Studio Output window could also contain the error messages of this kind: "The system cannot execute the specified program". To resolve it you should verify the integrity of the utilized preprocessor's executable and lower the security policies' level of system's antiviral software.
3) One of PVS-Studio auxiliary command files had been locked.
PVS-Studio analyzer is not launching the C++ preprocessor directly, but with the help of its own pre-generated command files. In case of strict system security policies, antiviral software could potentially block the correct initialization of C++ preprocessor. This could be also resolved by easing the system security policies toward the analyzer.
4) There are non-latin characters in the used file paths. These characters may not properly show for the current console code page.
PVS-Studio uses 'preprocessing.cmd' batch file (located in the PVS-Studio installation directory) to start preprocessing. In this batch file, you can set the correct code page (using chcp).
V009. To use free version of PVS-Studio, source code files are required to start with a special comment.
You entered a free license key allowing you to use the analyzer in free mode. To be able to run the tool with this key, you need to add special comments to your source files with the following extensions: .c, .cc, .cpp, .cp, .cxx, .c++, .cs, .java. Header files do not need to be modified.
You can insert the comments manually or by using a special open-source utility available at GitHub: how-to-use-pvs-studio-free.
Types of comments:
Comments for students (academic license):
// This is a personal academic project. Dear PVS-Studio, please check it.
// PVS-Studio Static Code Analyzer for C, C++, C#, and Java: https://pvs-studio.com
Comments for open-source non-commercial projects:
// This is an open source non-commercial project. Dear PVS-Studio, please check it.
// PVS-Studio Static Code Analyzer for C, C++, C#, and Java: https://pvs-studio.com
Comments for individual developers:
// This is an independent project of an individual developer. Dear PVS-Studio, please check it.
// PVS-Studio Static Code Analyzer for C, C++, C#, and Java: https://pvs-studio.com
Some developers might not want additional commented lines not related to the project in their files. It is their right, and they can simply choose not to use the analyzer. Another option is to purchase a commercial license and use the tool without any limitations. We consider your adding these comments as your way to say thank you to us for the granted license and help us promote our product.
If you have any questions, please contact our support.
V010. Analysis of 'Makefile/Utility' type projects is not supported in this tool. Use direct analyzer integration or compiler monitoring instead.
The warning V010 appears upon the attempt to check .vcxproj - projects, having the configuration type 'makefile' or 'utility'. PVS-Studio doesn't support such projects, using the plugin or a command line version of the analyzer. This is due to the fact that in the makefile/utility projects, the information necessary to the analyzer (the compilation parameters, in particular) about the build details is not available.
In case if the analysis of such projects is needed, please use a compiler monitoring system or direct integration of the analyzer. You can also disable this warning on the settings page of PVS-Studio (Detectable errors (C++), Fails list).
V011. Presence of #line directives may cause some diagnostic messages to have incorrect file name and line number.
A #line directive is generated by the preprocessor and specifies the filename and line number that a particular line in the preprocessed file refers to.
This is demonstrated by the following example.
#line 20 "a.h"
void X(); // Function X is declared at line 20 in file a.h
void Y(); // Function Y is declared at line 21 in file a.h
void Z(); // Function Z is declared at line 22 in file a.h
#line 5 "a.cpp"
int foo; // Variable foo is declared at line 5 in file a.cpp
int X() { // Definition of function X starts at line 6 in file a.cpp
return 0; // Line 7
} // Line 8#line directives are used by various tools, including the PVS-Studio analyzer, to navigate the file.
Sometimes source files (*.c; *.cpp; *.h, etc.) happen to include #line directives as well. This may happen, for example, when the file is generated automatically by some code-generating software (example).
When preprocessing such a file, those #line directives will be added to the resulting *.i file. Suppose, for example, that we have a file named A.cpp:
int a;
#line 30 "My.y"
int b = 10 / 0;After the preprocessing, we get the file A.i with the following contents:
#line 1 "A.cpp"
int a;
#line 30 "My.y"
int b = 10 / 0;This makes correct navigation impossible. On detecting a division by zero, the analyzer will report this error as occurring at line 30 in the My.y file. Technically speaking, the analyzer is correct, as the error is indeed a result of the incorrect code in the My.y file. However, with the navigation broken, you will not be able to view the My.y file since the project may simply have no such file. In addition, you will never know that currently, the division-by-zero error actually occurs at line 3 in the A.cpp file.
To fix this issue, we recommend deleting all #line directives in the source files of your project. These directives typically get there by accident and only hinder the work of various tools, such as code analyzers, rather than help.
V011 diagnostic was developed to detect such unwanted #line directives in the source code. The analyzer reports the first 10 #line's in a file. Reporting more makes no sense since you can easily find and delete the remaining #line directives using the search option of your editor.
This is the fixed code:
int a;
int b = 10 / 0;After the preprocessing, you get the following *.i file:
#line 1 "A.cpp"
int a;
int b = 10 / 0;The navigation is fixed, and the analyzer will correctly report that the division by zero occurs at line 2 in the A.cpp file.
V012. Some warnings could have been disabled.
Some of the false positive suppression methods allow complete disabling of diagnostics. As a result, such warnings will not be merely marked as false positives in the analysis report but may never appear there in the first place.
To find out which mechanisms exactly were used to disable diagnostics, you can turn on special messages to be included in the log.
- When using the analyzer in Visual Studio, open the plugin settings and enable the ReportDisabledRules option in 'Specific Analyzer Settings'

- When using the analyzer on Linux or macOS, add the 'report-disabled-rules=yes' option to the .cfg file.
pvs-studio-analyzer analyze ... --cfg source.cpp.PVS-Studio.cfgWith this option enabled, the analyzer will include V012 messages in its output to provide information about the exact spots where diagnostics were turned off. PVS-Studio's IDE plugins support navigation by those spots in the source files and rule configuration files (.pvsconfig). The paths to configuration files storing ignore rules will also be added to the log as V012 messages.
V013. Intermodular analysis may be incomplete, as it is not run on all source files.
Intermodular analysis on a limited list of project files leads to the loss of interprocedural information. This warning is only relevant for C and C++ projects.
Intermodular analysis is performed in 3 stages:
- Interprocedural facts for each translation unit are collected in the corresponding '.dfo' file.
- Interprocedural facts from each '.dfo' file are merged into a single file.
- The project analysis with interprocedural facts happens.
To ensure the greatest efficiency of intermodular analysis, it is better to run the analysis on the entire project. In this case, the amount of collected interprocedural facts is maximum. Therefore, the quality of analysis is improved, and the analyzer, hypothetically, can find more messages.
V014. The version of your suppress file is outdated. Appending new suppressed messages to it is not possible. Consider re-generating your suppress file to continue updating it.
Your suppress file is outdated. You can still use it to suppress warnings, however, you will have to re-generate the file to add new warnings.
To create a new suppress file, follow the steps below:
- Delete your outdated suppress file.
- Run the analysis without it. Please note — if you use the suppress file in several projects, you will have to analyze them all. This will ensure that no warnings are lost.
- Add warnings from the received report to a new suppress file.
You can read more about suppress files in the documentation.
V015. All analyzer messages were filtered out or marked as false positive. Use filter buttons or 'Don't Check Files' settings to enable message display.
The V015 warning indicates that you have analyzer warnings, but they're not displayed in the PVS-Studio window. This may happen either because of the filtering settings in the PVS-Studio's window, or because of the analyzer's global settings.
To display all the "hidden" warnings, you need to make sure that the configured filters don't hide anything. Below is a more detailed description of the filters.
Filtering in the PVS-Studio window
The first thing you need to check is the active filters for viewing warnings. Often these filters hide the warnings from you.

The PVS-Studio window provides the following filters:
- By the certainty levels (High, Medium, Low) and the analyzer's errors (Fails);
- By warning groups (General, Optimization, 64-bit, MISRA, AUTOSAR, OWASP);
- By custom filters (by code, message, file, CWE and SAST identifiers).
Make sure that all the filters mentioned above don't hide the analyzer's warnings. To do this, click on the filter buttons to activate them, and reset all the custom warning filters by clicking on 'Clear'.
Settings in the 'Don't Check Files' tab
Also, the display of warnings may be affected by the settings in the 'PVS-Studio > Options ... > Don't Check Files' tab. This tab contains file masks to exclude some files or folders from the analysis. Make sure that there are no file masks that exclude warnings for the files/paths you're interested in.
Displaying FA warnings
If V015 still doesn't disappear, check warnings marked as false alarm (FA). By default, these warnings aren't displayed in the PVS-Studio's window. To make them displayed, activate the corresponding setting: 'PVS-Studio > Options ... > Specific Analyzer Settings > False Alarms > DisplayFalseAlarms > True'. After that the PVS-Studio's window would display warnings from the FA group, if you had any.
V016. User annotation was not applied to a virtual function. To force the annotation, use the 'enable_on_virtual' flag.
The user annotation mechanism can help you additionally configure the diagnostic rules of the analyzer. One of the options for user annotations are function annotations.
Here is an example of such an annotation:
//V_FORMATTED_IO_FUNC, function:Log, format_arg:1, ellipsis_arg:2
void Log(const char *fmt, ...);However, annotations are not applied to virtual functions by default. The V016 diagnostic warning informs a user that their annotation has not been applied to a virtual function. To fix that, you need to append the following flags to the annotation:
- 'enable_on_virtual' – applies a user annotation on a virtual function.
- 'propagate_on_virtual' – extends annotation effects to virtual function overrides in derived classes. In addition, it implicitly applies the 'enable_on_virtual' flag.
For example, the annotation for the 'Log' virtual function of the 'Base' class will look like this:
// The comment should be placed on the same line
//V_FORMATTED_IO_FUNC, function:Base::Log,
format_arg:1, ellipsis_arg:2,
enable_on_virtual
struct Base
{
virtual void Log(const char *fmt, ...);
}The 'propagate_on_virtual' flag can be written instead of 'enable_on_virtual'. Then the annotation will be applied to function overrides in derived classes as well:
// The comment should be located on the same line
//V_FORMATTED_IO_FUNC, function: Base::Log,
format_arg:1, ellipsis_arg:2,
propagate_on_virtual
struct Base
{
virtual void Log(const char *fmt, ...);
}
struct Derived
{
// The annotation will also apply to this function
virtual void Log(const char *fmt, ...) override;
}V017. The analyzer terminated abnormally due to lack of memory.
The V017 warning in the report means that the analysis was urgently stopped due to a lack of free RAM required to run the analyzer. This usually happens when the analysis is running with a large number of threads in relation to a small amount of free RAM.
Possible solutions
At least 2 GB of memory per analysis thread is required for the C and C++ analyzer core to run stable. There are several ways to resolve this issue:
- reduce the number of analysis threads;
- increase the size of the swap file.
Note. Attempting to fix the error by simply increasing the size of the swap file may issue the V006 warning.
The following describes how to reduce the number of analysis threads in the various product components.
Plugins for IDEs. In the PVS-Studio plugin settings, set the 'ThreadCount' option to a lower value.
PVS-Studio_Cmd / pvs-studio-dotnet. In the analysis configuration file ('Settings.xml'), set the 'ThreadCount' option to a lower value.
CompilerCommandsAnalyzer / pvs-studio-analyzer. Lower the number passed to the '-j' / '--threads' parameter.
Integration with Unreal Build Tool. Use the 'BuildConfiguration.xml' file with the following configuration:
<?xml version="1.0" encoding="utf-8" ?>
<Configuration xmlns="https://www.unrealengine.com/BuildConfiguration">
<ParallelExecutor>
<MaxProcessorCount>1</MaxProcessorCount>
</ParallelExecutor>
</Configuration>If the V017 warning appears in the report after applying all the tips, we would appreciate it if you send us the files described here via the feedback form.
V018. False Alarm marks without hash codes were ignored because the 'V_HASH_ONLY' option is enabled.
The V018 warning indicates that the source code of the analyzed program contains lines with False Alarm marks without hash codes, even though the V_HASH_ONLY option is enabled in the analyzer settings.
//V_HASH_ONLY ENABLEIf you enable the setting, the False Alarm mark on the first line of the next fragment will not be applied:
int b = a; //-V614
int* c = nullptr;
b = *c; //-V522 //-VH"1949"To learn more about the setting, please consult the documentation.
Possible ways to fix the error
To fix this warning, you can add hashes to those False Alarm marks that do not have them. In this case, warnings are issued only if the line containing the False Alarm mark with a hash code has been changed since the hash code was added. To learn more about the mode, please consult this and this documentation.
In addition, you can remove False Alarm marks without hashes.
If the above ways do not work, delete the setting:
//V_HASH_ONLY ENABLEYou can also disable it using the following directive:
//V_HASH_ONLY DISABLEDisabling the directive in this way can be useful if you need to apply the setting to a specific block of code.
V019. Error occurred while working with the user annotation mechanism.
The V019 warning indicates that an error occurred while working with user annotations.
The analyzer can issue a warning in the following cases:
- The annotation file does not exist. In such a case, check the path to the annotation file again or make sure that the file exists in that path.
- An error has occurred while reading the annotation file. This can happen if a system call to the OS has failed with an error, for example. Make sure the file is valid and the analyzer has read access to the file.
- The annotation has been missed due to an error in it. The message includes the reason why the annotation cannot be used. For example, a mandatory field may be missing, or an invalid value may have been written to a field.
- The annotation has been missed due to a critical error. We would appreciate your help in fixing the issue that triggered this warning. To do this, please send us the following files via the feedback form:
- the annotation file in the JSON format;
- the preprocessed ('*.PVS-Studio.i') file;
- the configuration ('*.PVS-Studio.cfg') file.
V020. Error occurred while working with rules configuration files.
If you see the V020 warning in the report, it means that an error has occurred while working with the diagnostic rule configuration files (.pvsconfig). The specific cause of the error is displayed with the diagnostic rule message.
In case you cannot solve the issue, we are glad to help you. Please contact us via the feedback form and list the directives (or their combination) that caused the error. To make it easier for us to spot the issue, please also attach the configuration file that issued the warning.
V051. Some of the references in project are missing or incorrect. The analysis results could be incomplete. Consider making the project fully compilable and building it before analysis.
A V051 message indicates that the C# project, loaded in the analyzer, contains compilation errors. These usually include unknown data types, namespaces, and assemblies (dll files), and generally occur when you try to analyze a project that has dependent assemblies of nuget packages absent on the local machine, or third-party libraries absent among the projects of the current solution.
Despite this error, the analyzer will try to scan the part of the code that doesn't contain unknown types, but results of such analysis may be incomplete, as some of the messages may be lost. The reason is that most diagnostics can work properly only when the analyzer has complete information about all the data types contained in the source files to be analyzed, including the types implemented in third-party assemblies.
Even if rebuilding of dependency files is provided for in the build scenario of the project, the analyzer won't automatically rebuild the entire project. That's why we recommend that, before scanning it, you ensure that the project is fully compilable, including making sure that all the dependency assemblies (dll files) are present.
Sometimes the analyzer may mistakenly generate this message on a fully compilable project, with all the dependencies present. It may happen, for example, when the project uses a non-standard MSBuild scenario - say, csproj files are importing some additional props and target files. In this case, you can ignore the V051 message or turn it off in the analyzer settings.
If you wish to learn which compiler errors are causing the V051 error, start the analysis of your projects with the analyzer's cmd version, and add the '--logCompilerErrors' flag to its arguments (in a single line):
PVS-Studio_Cmd.exe –t MyProject.sln –p "Any CPU" –c "Debug"
--logCompilerErrorsYou can use the .pvsconfig file to suppress errors that cause V051. To learn how to do this, please consult the documentation.
V052. A critical error had occurred.
The appearance of V052 message means that a critical error had occurred inside the analyzer. It is most likely that several source files will not be analyzed.
You can get additional information about this error from two sources: the analyzer report file (plog) and standard output stream of error messages stderr (when you use the command line version).
If you are using the IDE Visual Studio or Standalone application the error stack is displayed in PVS-Studio window. The stack will be recorded in the very beginning of the plog file. At the same time the stack is divided into substrings, and each of them is recorded and displayed as a separate error without number.
If you are working from the command line, you can analyze the return code of the command line version to understand that the exception occurred, and then examine the plog, without opening it in the IDE Visual Studio or Standalone application. For this purpose, the report can be converted, for example, to a text file using the PlogConverter utility. Return codes of the command line version are described in the section "Analyzing Visual C++ (.vcxproj) and Visual C # project (.csproj) projects from the command line", used utilities - PlogConverter - "Managing the Analysis Results (plog file)".
Although the V052 message is quite rare, we will appreciate if you can help us fixing the issue that had cause it. To accomplish this, please send the exception stack from PVS-Studio output window (or the message from stderr in case the command line version was utilized) to support@viva64.com.
V061. An error has occurred.
A V061 message indicates that an error related to the analyzer's functioning has occurred.
It could be an unexpected exception in the analyzer, failure to build a semantic model of the program, and so on.
In this case, please email us and attach the text files from the .PVS-Studio directory (you can find them in the project directory) so that we could fix the bug as soon as possible.
In addition, you can use the 'verbose' parameter to tell the analyzer to save additional information to the .PVS-Studio directory while running. That information could also be helpful.
Maven plugin:
<verbose>true</verbose>Gradle plugin:
verbose = trueIntelliJ IDEA plugin:
1) Analyze -> PVS-Studio -> Settings
2) Tab Misc -> uncheck 'Remove intermediate files'
V062. Failed to run analyzer core. Make sure the correct 64-bit Java 11 or higher executable is used, or specify it manually.
A V062 message means that the plugin has failed to run the analyzer core. This message typically appears when attempting to launch the core with an incorrect Java version. The core can work correctly only with the 64-bit Java version 11 or higher. The analyzer retrieves the path to the Java interpreter from the PATH environment variable by default.
You can also specify the path to the required Java interpreter manually.
Maven plugin:
<javaPath>C:/Program Files/Java/jdk11.0.17/bin/java.exe</javaPath>Gradle plugin:
javaPath = "C:/Program Files/Java/jdk11.0.17/bin/java.exe"IntelliJ IDEA plugin:
1) Analyze -> PVS-Studio -> Settings
2) Tab Environment -> Java executable
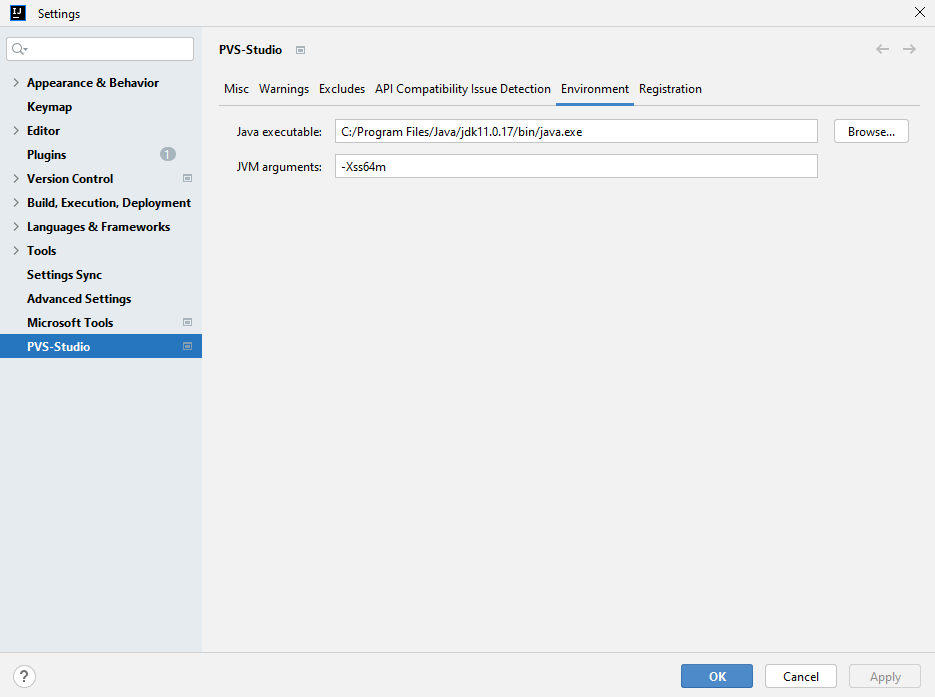
If you still cannot launch the analyzer, please email us and attach the text files from the .PVS-Studio directory (you can find it in the project directory). We will try to find a solution as soon as possible.
V063. Analysis aborted by timeout.
A V063 message means that the analyzer has failed to check a file in the given time frame (10 minutes by default). Such messages are often accompanied by "GC overhead limit exceeded" messages.
In some cases, this problem can be solved by simply increasing the amount of memory and stack available to the analyzer.
Maven plugin:
<jvmArguments>-Xmx4096m, -Xss256m</jvmArguments>Gradle plugin:
jvmArguments = ["-Xmx4096m", "-Xss256m"]IntelliJ IDEA plugin:
1) Analyze -> PVS-Studio -> Settings
2) Tab Environment -> JVM arguments
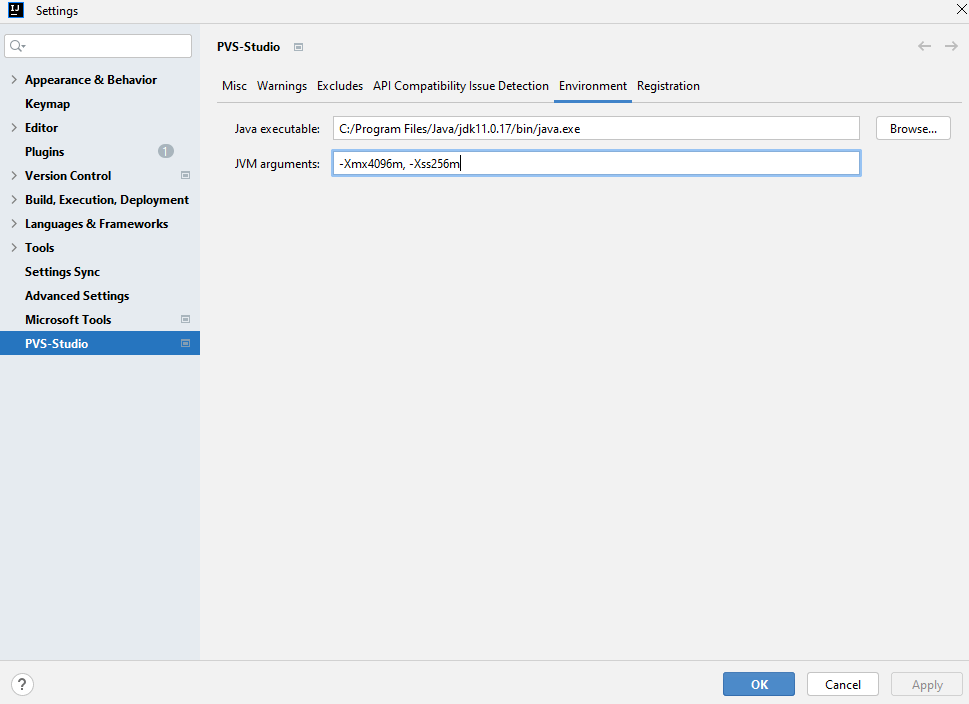
The amount of memory available by default could be insufficient when analyzing generated code with numerous nested constructs.
You may want to exclude such code from analysis (using the 'exclude' option) so that the analyzer does not waste time checking it.
A V063 message can also appear when the analyzer does not get enough system resources because of high CPU load. It could process the file correctly if given enough time, but the default time frame is too small.
If you are still getting this message, it may be a sign of a bug in the analyzer. In this case, please email us and attach the text files from the .PVS-Studio directory (you can find it in the project directory) together with the code that seems to trigger this error so that we could fix the bug as soon as possible.
V101. Implicit assignment type conversion to memsize type.
The analyzer detected a potential error relating to implicit type conversion while executing the assignment operator "=". The error may consist in incorrect calculating of the value of the expression to the right of the assignment operator "=".
An example of the code causing the warning message:
size_t a;
unsigned b;
...
a = b; // V101The operation of converting a 32-bit type to memsize-type is safe in itself as there is no data loss. For example, you can always save the value of unsigned-type variable into a variable of size_t type. But the presence of this type conversion may indicate a hidden error made before.
The first cause of the error occurrence on a 64-bit system may be the change of the expression calculation process. Let's consider an example:
unsigned a = 10;
int b = -11;
ptrdiff_t c = a + b; //V101
cout << c << endl;On a 32-bit system this code will display the value -1, while on a 64-bit system it will be 4294967295. This behaviour fully meets the rules of type converion in C++ but most likely it will cause an error in a real code.
Let's explain the example. According to C++ rules a+b expression has unsigned type and contains the value 0xFFFFFFFFu. On a 32-bit system ptrdiff_t type is a sign 32-bit type. After 0xFFFFFFFFu value is assigned to the 32-bit sign variable it will contain the value -1. On a 64-bit system ptrdiff_t type is a sign 64-bit type. It means 0xFFFFFFFFu value will be represented as it is. That is, the value of the variable after assignment will be 4294967295.
The error may be corrected by excluding mixed use of memsize and non-memsize-types in one expression. An example of code correction:
size_t a = 10;
ptrdiff_t b = -11;
ptrdiff_t c = a + b;
cout << c << endl;A more proper way of correction is to refuse using sign and non-sign data types together.
The second cause of the error may be an overflow occurring in 32-bit data types. In this case the error may stand before the assignment operator but you can detect it only indirectly. Such errors occur in code allocating large memory sizes. Let's consider an example:
unsigned Width = 1800;
unsigned Height = 1800;
unsigned Depth = 1800;
// Real error is here
unsigned CellCount = Width * Height * Depth;
// Here we get a diagnostic message V101
size_t ArraySize = CellCount * sizeof(char);
cout << ArraySize << endl;
void *Array = malloc(ArraySize);Suppose that we decided to process data arrays of more than 4 Gb on a 64-bit system. In this case the given code will cause allocation of a wrong memory size. The programmer is planning to allocate 5832000000 memory bytes but he gets only 1537032704 instead. It happens because of an overflow occurring while calculating Width * Height * Depth expression. Unfortunately, we cannot diagnose the error in the line containing this expression but we can indirectly indicate the presence of the error detecting type conversion in the line:
size_t ArraySize = CellCount * sizeof(char); //V101To correct the error you should use types allowing you to store the necessary range of values. Mind that correction of the following kind is not appropriate:
size_t CellCount = Width * Height * Depth;We still have the overflow here. Let's consider two examples of proper code correction:
// 1)
unsigned Width = 1800;
unsigned Height = 1800;
unsigned Depth = 1800;
size_t CellCount =
static_cast<size_t>(Width) *
static_cast<size_t>(Height) *
static_cast<size_t>(Depth);
// 2)
size_t Width = 1800;
size_t Height = 1800;
size_t Depth = 1800;
size_t CellCount = Width * Height * Depth;You should keep in mind that the error can be situated not only higher but even in another module. Let's give a corresponding example. Here the error consists in incorrect index calculation when the array's size exceeds 4 Gb.
Suppose that the application uses a large one-dimensional array and CalcIndex function allows you to address this array as a two-dimensional one.
extern unsigned ArrayWidth;
unsigned CalcIndex(unsigned x, unsigned y) {
return x + y * ArrayWidth;
}
...
const size_t index = CalcIndex(x, y); //V101The analyzer will warn about the problem in the line: const size_t index = CalcIndex(x, y). But the error is in incorrect implementation of CalcIndex function. If we take CalcIndex separately it is absolutely correct. The output and input values have unsigned type. Calculations are also performed only with unsigned types participating. There are no explicit or implicit type conversions and the analyzer has no opportunity to detect a logic problem relating to CalcIndex function. The error consists in that the result returned by the function and possibly the result of the input values was chosen incorrectly. The function's result must have memsize type.
Fortunately, the analyzer managed to detect implicit conversion of CalcIndex function's result to size_t type. It allows you to analyze the situation and bring necessary changes into the program. Correction of the error may be, for example, the following:
extern size_t ArrayWidth;
size_t CalcIndex(size_t x, size_t y) {
return x + y * ArrayWidth;
}
...
const size_t index = CalcIndex(x, y);If you are sure that the code is correct and the array's size will never reach 4 Gb you can suppress the analyzer's warning message by explicit type conversion:
extern unsigned ArrayWidth;
unsigned CalcIndex(unsigned x, unsigned y) {
return x + y * ArrayWidth;
}
...
const size_t index = static_cast<size_t>(CalcIndex(x, y));In some cases the analyzer can understand itself that an overflow is impossible and the message won't be displayed.
Let's consider the last example related to incorrect shift operations
ptrdiff_t SetBitN(ptrdiff_t value, unsigned bitNum) {
ptrdiff_t mask = 1 << bitNum; //V101
return value | mask;
}The expression " mask = 1 << bitNum " is unsafe because this code cannot set the high-order bits of the 64-bit variable mask into ones. If you try to use SetBitN function for setting, for example, the 33rd bit, an overflow will occur when performing the shift operation and you will not get the result you've expected.
Additional materials on this topic:
- 64-bit Lessons. Lesson 11. Pattern 3. Shift operations.
- 64-bit Lessons. Lesson 17. Pattern 9. Mixed arithmetic.
V102. Usage of non memsize type for pointer arithmetic.
The analyzer found a possible error in pointer arithmetic. The error may be caused by an overflow during the determination of the expression.
Let's take up the first example.
short a16, b16, c16;
char *pointer;
...
pointer += a16 * b16 * c16;The given example works correctly with pointers if the value of the expression "a16 * b16 * c16" does not excess 'INT_MAX' (2Gb). This code could always work correctly on the 32-bit platform because the program never allocated large-sized arrays. On the 64-bit platform the programmer using the previous code while working with an array of a large size would be disappointed. Suppose, we would like to shift the pointer value in 3000000000 bytes, and the variables 'a16', 'b16' and 'c16' have values 3000, 1000 and 1000 correspondingly. During the determination of the expression "a16 * b16 * c16" all the variables, according to the C++ rules, will be converted to type int, and only then the multiplication will take place. While multiplying an overflow will occur, and the result of this would be the number -1294967296. The incorrect expression result will be extended to type 'ptrdiff_t' and pointer determination will be launched. As a result, we'll face an abnormal program termination while trying to use the incorrect pointer.
To prevent such errors one should use memsize types. In our case it will be correct to change the types of the variables 'a16', 'b16', 'c16' or to use the explicit type conversion to type 'ptrdiff_t' as follows:
short a16, b16, c16;
char *pointer;
...
pointer += static_cast<ptrdiff_t>(a16) *
static_cast<ptrdiff_t>(b16) *
static_cast<ptrdiff_t>(c16)It's worth mentioning that it is not always incorrect not to use memsize type in pointer arithmetic. Let's examine the following situation:
char ch;
short a16;
int *pointer;
...
int *decodePtr = pointer + ch * a16;The analyzer does not show a message on it because it is correct. There are no determinations which may cause an overflow and the result of this expression will be always correct on the 32-bit platform as well as on the 64-bit platform.
Additional materials on this topic:
- 64-bit Lessons. Lesson 13. Pattern 5. Address arithmetic.
V103. Implicit type conversion from memsize type to 32-bit type.
The analyzer found a possible error related to the implicit memsize-type conversion to 32-bit type. The error consists in the loss of high bits in 64-bit type which causes the loss of the value.
The compiler also diagnoses such type conversions and shows warnings. Unfortunately, such warnings are often switched off, especially when the project contains a great deal of the previous legacy code or old libraries are used. In order not to make a programmer look through hundreds and thousands of such warnings, showed by the compiler, the analyzer informs only about those which may be the cause of the incorrect work of the code on the 64-bit platform.
The first example.
Our application works with videos and we want to calculate what file-size we'll need in order to store all the shots kept in memory into a file.
size_t Width, Height, FrameCount;
...
unsigned BufferSizeForWrite = Width * Height * FrameCount *
sizeof(RGBStruct);Earlier the general size of the shots in memory could never excess 4 Gb (practically 2-3 Gb depending on the kind of OS Windows). On the 64-bit platform we have an opportunity to store much more shots in memory, and let's suppose that their general size is 10 Gb. After putting the result of the expression "Width * Height * FrameCount * sizeof(RGBStruct)" into the variable 'BufferSizeForWrite', we'll truncate high bits and will deal with the incorrect value.
The correct solution will be to change the type of the variable 'BufferSizeForWrite' into type 'size_t'.
size_t Width, Height, FrameCount;
...
size_t BufferSizeForWrite = Width * Height * FrameCount *
sizeof(RGBStruct);The second example.
Saving of the result of pointers subtraction.
char *ptr_1, *ptr_2;
...
int diff = ptr_2 - ptr_1;If pointers differ more than in one 'INT_MAX' byte (2 Gb) a value cutoff during the assignment will occur. As a result the variable 'diff' will have an incorrect value. For the storing of the given value we should use type 'ptrdiff_t' or another memsize type.
char *ptr_1, *ptr_2;
...
ptrdiff_t diff = ptr_2 - ptr_1;When you are sure about the correctness of the code and the implicit type conversion does not cause errors while changing over to the 64-bit platform, you may use the explicit type conversion in order to avoid error messages showed in this line. For example:
unsigned BitCount = static_cast<unsigned>(sizeof(RGBStruct) * 8);If you suspect that the code contains incorrect explicit conversions of memsize types to 32-bit types about which the analyzer does not warn, you can use the V202.
As was said before analyzer informs only about those type conversions which can cause incorrect code work on a 64-bit platform. The code given below won't be considered incorrect though there occurs conversion of memsize type to int type:
int size = sizeof(float);Additional materials on this topic:
- 64-bit Lessons. Lesson 17. Pattern 9. Mixed arithmetic.
V104. Implicit type conversion to memsize type in an arithmetic expression.
The analyzer found a possible error inside an arithmetic expression and this error is related to the implicit type conversion to memsize type. The error of an overflow may be caused by the changing of the permissible interval of the values of the variables included into the expression.
The first example.
The incorrect comparison expression. Let's examine the code:
size_t n;
unsigned i;
// Infinite loop (n > UINT_MAX).
for (i = 0; i != n; ++i) { ... }In this example the error are shown which are related to the implicit conversion of type 'unsigned' to type 'size_t' while performing the comparison operation.
On the 64-bit platform you may have an opportunity to process a larger data size and the value of the variable 'n' may excess the number 'UINT_MAX' (4 Gb). As a result, the condition "i != n" will be always true and that will cause an eternal cycle.
An example of the corrected code:
size_t n;
size_t i;
for (i = 0; i != n; ++i) { ... }The second example.
char *begin, *end;
int bufLen, bufCount;
...
ptrdiff_t diff = begin - end + bufLen * bufCount;The implicit conversion of type 'int' to type 'ptrdiff_t' often indicates an error. One should pay attention that the conversion takes place not while performing operator "=" (for the expression "begin - end + bufLen * bufCount" has type 'ptrdiff_t'), but inside this expression. The subexpression "begin - end" according to C++ rules has type 'ptrdiff_t', and the right "bufLen * bufCount" type 'int'. While changing over to 64-bit platform the program may begin to process a larger data size which may result in an overflow while determining the subexpression "bufLen * bufCount".
You should change the type of the variables 'bufLen' and 'bufCount' into memsize type or use the explicit type conversion, as follows:
char *begin, *end;
int bufLen, bufCount;
...
ptrdiff_t diff = begin - end +
ptrdiff_t(bufLen) * ptrdiff_t(bufCount);Let's notice that the implicit conversion to memsize type inside the expressions is not always incorrect. Let's examine the following situation:
size_t value;
char c1, c2;
size_t result = value + c1 * c2;The analyzer does not show error message although the conversion of type 'int' to 'size_t' occurs in this case, for there can be no overflow while determining the subexpression "c1 * c2".
If you suspect that the program may contain errors related to the incorrect explicit type conversion in expressions, you may use the V201. Here is an example when the explicit type conversion to type 'size_t' hides an error:
int i;
size_t st;
...
st = size_t(i * i * i) * st;Additional materials on this topic:
- 64-bit Lessons. Lesson 17. Pattern 9. Mixed arithmetic.
V105. N operand of '?:' operation: implicit type conversion to memsize type.
The analyzer found a possible error inside an arithmetic expression related to the implicit type conversion to memsize type. An overflow error may be caused by the changing of the permissible interval of the values of the variables included into the expression. This warning is almost equivalent to warning V104 with the exception that the implicit type conversion occurs due to the use of '?:' operation.
Let's give an example of the implicit type conversion while using operation:
int i32;
float f = b != 1 ? sizeof(int) : i32;In the arithmetic expression the ternary operation '?:' is used which has three operands:
- b != 1 - the first operand;
- sizeof(int) - the second operand;
- i32 - the third operand.
The result of the expression "b != 1 ? sizeof(int) : i32" is the value of type 'size_t' which is then converted into type 'float' value. Thus, the implicit type conversion realized for the 3rd operand of '?:' operation.
Let's examine an example of the incorrect code:
bool useDefaultVolume;
size_t defaultVolume;
unsigned width, height, depth;
...
size_t volume = useDefaultVolume ?
defaultVolume :
width * height * depth;Let's suppose, we're developing an application of computational modeling which requires three-dimensional calculation area. The number of calculating elements which are used is determined according to the variable 'useDefaultSize' value and is assigned on default or by multiplication of length, height and depth of the calculating area. On the 32-bit platform the size of memory which was already allocated, cannot excess 2-3 Gb (depending on the kind of OS Windows) and as consequence the result of the expression "width * height * depth" will be always correct. On the 64-bit platform, using the opportunity to deal with a larger memory size, the number of calculating elements may excess the value 'UINT_MAX' (4 Gb). In this case an overflow will occur while determining the expression "width * height * depth" because the result of this expression had type 'unsigned'.
Correction of the code may consist in the changing of the type of the variables 'width', 'height' and 'depth' to memsize type as follows:
...
size_t width, height, depth;
...
size_t volume = useDefaultVolume ?
defaultVolume :
width * height * depth;Or in use of the explicit type conversion:
unsigned width, height, depth;
...
size_t volume = useDefaultVolume ?
defaultVolume :
size_t(width) * size_t(height) * size_t(depth);In addition, we advise to read the description of a similar warning V104, where one can learn about other effects of the implicit type conversion to memsize type.
Additional materials on this topic:
- 64-bit Lessons. Lesson 17. Pattern 9. Mixed arithmetic.
V106. Implicit type conversion N argument of function 'foo' to memsize type.
The analyzer found a possible error related to the implicit actual function argument conversion to memsize type.
The first example.
The program deals with large arrays using container 'CArray' from library MFC. On the 64-bit platform the number of array items may excess the value 'INT_MAX' (2Gb), which will make the work of the following code impossible:
CArray<int, int> myArray;
...
int invalidIndex = 0;
INT_PTR validIndex = 0;
while (validIndex != myArray.GetSize()) {
myArray.SetAt(invalidIndex, 123);
++invalidIndex;
++validIndex;
}The given code fills all the array 'myArray' items with value 123. It seems to be absolutely correct and the compiler won't show any warnings in spite of its impossibility to work on the 64-bit platform. The error consists in the use of type int as an index of the variable 'invalidIndex'. When the value of the variable 'invalidIndex' excesses 'INT_MAX' an overflow will occur and it will receive value "-1". The analyzer diagnoses this error and warns that the implicit conversion of the first argument of the function 'SetAt' to memsize type (here it is type 'INT_PTR') occurs. When seeing such a warning you may correct the error replacing 'int' type with a more appropriate one.
The given example is significant because it is rather unfair to blame a programmer for the ineffective code. The reason is that 'GetAt' function in class 'CArray' in the previous MFC library version was declared as follows:
void SetAt(int nIndex, ARG_TYPE newElement);And in the new version:
void SetAt(INT_PTR nIndex, ARG_TYPE newElement);Even the Microsoft developers creating MFC could not take into account all the possible consequences of the use of 'int' type for indexing in the array and we can forgive the common developer who has written this code.
Here is the correct variant:
...
INT_PTR invalidIndex = 0;
INT_PTR validIndex = 0;
while (validIndex != myArray.GetSize()) {
myArray.SetAt(invalidIndex, 123);
++invalidIndex;
++validIndex;
}The second example.
The program determines the necessary data array size and then allocated it using function 'malloc' as follows:
unsigned GetArraySize();
...
unsigned size = GetArraySize();
void *p = malloc(size);The analyzer will warn about the line "void *p = malloc(size);". Looking through the definition of function 'malloc' we will see that its formal argument assigning the size of the allocated memory is represented by type 'size_t'. But in the program the variable 'size' of 'unsigned' type is used as the actual argument. If your program on the 64-bit platform needs an array more than 'UINT_MAX' bytes (4Gb), we can be sure that the given code is incorrect for type 'unsigned' cannot keep a value more than 'UINT_MAX'. The program correction consists in changing the types of the variables and functions used in the determination of the data array size. In the given example we should replace 'unsigned' type with one of memsize types, and also if it is necessary modify the function 'GetArraySize' code.
...
size_t GetArraySize();
...
size_t size = GetArraySize();
void *p = malloc(size);The analyzer show warnings on the implicit type conversion only if it may cause an error during program port on the 64-bit platform. Here it is the code which contains the implicit type conversion but does not cause errors:
void MyFoo(SSIZE_T index);
...
char c = 'z';
MyFoo(0);
MyFoo(c);If you are sure that the implicit type conversion of the actual function argument is absolutely correct you may use the explicit type conversion to suppress the analyzer's warnings as follows:
typedef size_t TYear;
void MyFoo(TYear year);
int year;
...
MyFoo(static_cast<TYear>(year));Sometimes the explicit type conversion may hide an error. In this case you may use the V201.
Additional materials on this topic:
- 64-bit Lessons. Lesson 17. Pattern 9. Mixed arithmetic.
V107. Implicit type conversion N argument of function 'foo' to 32-bit type.
The analyzer found a possible error related to the implicit conversion of the actual function argument which has memsize type to 32-bit type.
Let's examine an example of the code which contains the function for searching for the max array item:
float FindMaxItem(float *array, int arraySize) {
float max = -FLT_MAX;
for (int i = 0; i != arraySize; ++i) {
float item = *array++;
if (max < item)
max = item;
}
return max;
}
...
float *beginArray;
float *endArray;
float maxValue = FindMaxItem(beginArray, endArray - beginArray);This code may work successfully on the 32-bit platform but it won't be able to process arrays containing more than 'INT_MAX' (2Gb) items on the 64-bit architecture. This limitation is caused by the use of int type for the argument 'arraySize'. Pay attention that the function code looks absolutely correct not only from the compiler's point of view but also from that of the analyzer. There is no type conversion in this function and one cannot find the possible problem.
The analyzer will warn about the implicit conversion of memsize type to a 32-bit type during the invocation of 'FindMaxItem' function. Let's try to find out why it happens so. According to C++ rules the result of the subtraction of two pointers has type 'ptrdiff_t'. When invocating 'FindMaxItem' function the implicit conversion of 'ptrdiff_t' type to 'int' type occurs which will cause the loss of the high bits. This may be the reason for the incorrect program behavior while processing a large data size.
The correct solution will be to replace 'int' type with 'ptrdiff_t' type for it will allow to keep the whole range of values. The corrected code:
float FindMaxItem(float *array, ptrdiff_t arraySize) {
float max = -FLT_MAX;
for (ptrdiff_t i = 0; i != arraySize; ++i) {
float item = *array++;
if (max < item)
max = item;
}
return max;
}Analyzer tries as far as possible to recognize safe type conversions and keep from displaying warning messages on them. For example, the analyzer won't give a warning message on 'FindMaxItem' function's call in the following code:
float Arr[1000];
float maxValue =
FindMaxItem(Arr, sizeof(Arr)/sizeof(float));When you are sure that the code is correct and the implicit type conversion of the actual function argument does not cause errors you may use the explicit type conversion so that to avoid showing warning messages. An example:
extern int nPenStyle
extern size_t nWidth;
extern COLORREF crColor;
...
// Call constructor CPen::CPen(int, int, COLORREF)
CPen myPen(nPenStyle, static_cast<int>(nWidth), crColor);In that case if you suspect that the code contains incorrect explicit conversions of memsize types to 32-bit types about which the analyzer does not warn, you may use the V202.
Additional materials on this topic:
- 64-bit Lessons. Lesson 17. Pattern 9. Mixed arithmetic.
V108. Incorrect index type: 'foo[not a memsize-type]'. Use memsize type instead.
The analyzer found a possible error of indexing large arrays. The error may consist in the incorrect index determination.
The first example.
extern char *longString;
extern bool *isAlnum;
...
unsigned i = 0;
while (*longString) {
isAlnum[i] = isalnum(*longString++);
++i;
}The given code is absolutely correct for the 32-bit platform where it is actually impossible to process arrays more than 'UINT_MAX' bytes (4Gb). On the 64-bit platform it is possible to process an array with the size more than 4 Gb that is sometimes very convenient. The error consists in the use of the variable of 'unsigned' type for indexing the array 'isAlnum'. When we fill the first 'UINT_MAX' of the items the variable 'i' overflow will occur and it will equal zero. As the result we'll begin to rewrite the array 'isAlnum' items which are situated in the beginning and some items will be left unassigned.
The correction is to replace the variable 'i' type with memsize type:
...
size_t i = 0;
while (*longString)
isAlnum[i++] = isalnum(*longString++);The second example.
class Region {
float *array;
int Width, Height, Depth;
float Region::GetCell(int x, int y, int z) const;
...
};
float Region::GetCell(int x, int y, int z) const {
return array[x + y * Width + z * Width * Height];
}For computational modeling programs the main memory size is an important source, and the possibility to use more than 4 Gb of memory on the 64-bit architecture increases calculating possibilities greatly. In such programs one-dimensional arrays are often used which are then dealt with as three-dimensional ones. There are functions for that which similar to 'GetCell' that provides access to the necessary items of the calculation area. But the given code may deal correctly with arrays containing not more than 'INT_MAX' (2Gb) items. The reason is in the use of 32-bit 'int' types which participate in calculating the item index. If the number of items in the array 'array' excesses 'INT_MAX' (2 Gb) an overflow will occur and the index value will be determined incorrectly. Programmers often make a mistake trying to correct the code in the following way:
float Region::GetCell(int x, int y, int z) const {
return array[static_cast<ptrdiff_t>(x) + y * Width +
z * Width * Height];
}They know that according to C++ rules the expression for calculating the index will have 'ptrdiff_t' type and because of it hope to avoid the overflow. Unfortunately, the overflow may occur inside the subexpression "y * Width or z * Width * Height" for to determine them 'int' type is still used.
If you want to correct the code without changing the types of the variables included into the expression you should convert each variable explicitly to memsize type:
float Region::GetCell(int x, int y, int z) const {
return array[ptrdiff_t(x) +
ptrdiff_t(y) * ptrdiff_t(Width) +
ptrdiff_t(z) * ptrdiff_t(Width) *
ptrdiff_t(Height)];
}Another decision is to replace the variables types with memsize type:
class Region {
float *array;
ptrdiff_t Width, Height, Depth;
float
Region::GetCell(ptrdiff_t x, ptrdiff_t y, ptrdiff_t z) const;
...
};
float Region::GetCell(ptrdiff_t x, ptrdiff_t y, ptrdiff_t z) const
{
return array[x + y * Width + z * Width * Height];
}If you use expressions which type is different from memsize type for indexing but are sure about the code correctness, you may use the explicit type conversion to suppress the analyzer's warning messages as follows:
bool *Seconds;
int min, sec;
...
bool flag = Seconds[static_cast<size_t>(min * 60 + sec)];If you suspect that the program may contain errors related to the incorrect explicit type conversion in expressions you may use the V201.
The analyzer tries as far as possible to understand when using non-memsize-type as the array's index is safe and keep from displaying warnings in such cases. As the result the analyzer's behaviour can sometimes seem strange. In such situations we ask you not to hurry and try to analyze the situation. Let's consider the following code:
char Arr[] = { '0', '1', '2', '3', '4' };
char *p = Arr + 2;
cout << p[0u + 1] << endl;
cout << p[0u - 1] << endl; //V108This code works correctly in 32-bit mode and displays numbers 3 and 1. While testing this code we'll get a warning message only on one line with the expression "p[0u - 1]". And it's absolutely right. If you compile and launch this example in 64-bit mode you'll see that the value 3 will be displayed and after that a program crash will occur.
The error relates to that indexing of "p[0u - 1]" is incorrect on a 64-bit system and this is what analyzer warns about. According to C++ rules "0u - 1" expression will have unsigned type and equal 0xFFFFFFFFu. On a 32-bit architecture addition of an index with this number will be the same as substraction of 1. And on a 64-bit system 0xFFFFFFFFu value will be justly added to the index and memory will be addressed outside the array.
Of course indexing to arrays with the use of such types as int and unsigned is often safe. In this case analyzer's warnings may seem inappropriate. But you should keep in mind that such code still may be unsafe in case of its modernization for processing a different data set. The code with int and unsigned types can appear to be less efficient than it is possible on a 64-bit architecture.
If you are sure that indexation is correct you use "Suppression of false alarms" or use filters. You can use explicit type conversion in the code:
for (int i = 0; i != n; ++i)
Array[static_cast<ptrdiff_t>(i)] = 0;Additional materials on this topic:
- 64-bit Lessons. Lesson 13. Pattern 5. Address arithmetic.
V109. Implicit type conversion of return value to memsize type.
The analyzer found a possible error related to the implicit conversion of the return value type. The error may consist in the incorrect determination of the return value.
Let's examine an example.
extern int Width, Height, Depth;
size_t GetIndex(int x, int y, int z) {
return x + y * Width + z * Width * Height;
}
...
array[GetIndex(x, y, z)] = 0.0f;If the code deals with large arrays (more than 'INT_MAX' items) it will behave incorrectly and we will address not those items of the array 'array' that we want. But the analyzer won't show a warning message on the line "array[GetIndex(x, y, z)] = 0.0f;" for it is absolutely correct. The analyzer informs about a possible error inside the function and is right for the error is located exactly there and is related to the arithmetic overflow. In spite of the facte that we return the type 'size_t' value the expression "x + y * Width + z * Width * Height" is determined with the use of type 'int'.
To correct the error we should use the explicit conversion of all the variables included into the expression to memsize types.
extern int Width, Height, Depth;
size_t GetIndex(int x, int y, int z) {
return (size_t)(x) +
(size_t)(y) * (size_t)(Width) +
(size_t)(z) * (size_t)(Width) * (size_t)(Height);
}Another variant of correction is the use of other types for the variables included into the expression.
extern size_t Width, Height, Depth;
size_t GetIndex(size_t x, size_t y, size_t z) {
return x + y * Width + z * Width * Height;
}When you are sure that the code is correct and the implicit type conversion does not cause errors while porting to the 64-bit architecture you may use the explicit type conversion so that to avoid showing of the warning messages in this line. For example:
DWORD_PTR Calc(unsigned a) {
return (DWORD_PTR)(10 * a);
}In case you suspect that the code contains incorrect explicit type conversions to memsize types about which the analyzer does not show warnings you may use the V201.
Additional materials on this topic:
- 64-bit Lessons. Lesson 17. Pattern 9. Mixed arithmetic.
V110. Implicit type conversion of return value from memsize type to 32-bit type.
The analyzer found a possible error related to the implicit conversion of the return value. The error consists in dropping of the high bits in the 64-bit type which causes the loss of value.
Let's examine an example.
extern char *begin, *end;
unsigned GetSize() {
return end - begin;
}The result of the "end - begin" expression has type 'ptrdiff_t'. But as the function returns type 'unsigned' the implicit type conversion occurs which causes the loss of the result high bits. Thus, if the pointers 'begin' and 'end' refer to the beginning and the end of the array according to a larger 'UINT_MAX' (4Gb), the function will return the incorrect value.
The correction consists in modifying the program in such a way so that the arrays sizes are kept and transported in memsize types. In this case the correct code of the 'GetSize' function should look as follows:
extern char *begin, *end;
size_t GetSize() {
return end - begin;
}In some cases the analyzer won't display a warning message on type conversion if it is obviously correct. For example, the analyzer won't display a warning message on the following code where despite the fact that sizeof() operator's result is size_t type it can be safely placed into unsigned type:
unsigned GetSize() {
return sizeof(double);
}When you are sure that the code is correct and the implicit type conversion does not cause errors while porting to the 64-bit architecture you may use the explicit type conversion so that to avoid showing of the warning messages. For example:
unsigned GetBitCount() {
return static_cast<unsigned>(sizeof(TypeRGBA) * 8);
}If you suspect that the code contains incorrect explicit conversions of the return values types about which the analyzer does not warn you may use the V202.
Additional materials on this topic:
- 64-bit Lessons. Lesson 17. Pattern 9. Mixed arithmetic.
V111. Call of function 'foo' with variable number of arguments. N argument has memsize type.
The analyzer found a possible error related to the transfer of the actual argument of memsize type into the function with variable number of arguments. The possible error may consist in the change of demands made to the function on the 64-bit system.
Let's examine an example.
const char *invalidFormat = "%u";
size_t value = SIZE_MAX;
printf(invalidFormat, value);The given code does not take into account that 'size_t' type does not coincide with 'unsigned' type on the 64-bit platform. It will cause the printing of the incorrect result in case if "value > UINT_MAX". The analyzer warns you that memsize type is used as an actual argument. It means that you should check the line 'invalidFormat' assigning the printing format. The correct variant may look as follows:
const char *validFormat = "%Iu";
size_t value = SIZE_MAX;
printf(validFormat, value);In the code of a real application, this error can occur in the following form, e.g.:
wsprintf(szDebugMessage,
_T("%s location %08x caused an access violation.\r\n"),
readwrite,
Exception->m_pAddr);The second example.
char buf[9];
sprintf(buf, "%p", pointer);The author of this inaccurate code did not take into account that the pointer size may excess 32 bits later. As a result, this code will cause buffer overflow on the 64-bit architecture. After checking the code on which the V111 warning message is shown you may choose one of the two ways: to increase the buffer size or rewrite the code using safe constructions.
char buf[sizeof(pointer) * 2 + 1];
sprintf(buf, "%p", pointer);
// --- or ---
std::stringstream s;
s << pointer;The third example.
char buf[9];
sprintf_s(buf, sizeof(buf), "%p", pointer);While examining the second example you could rightly notice that in order to prevent the overflow you should use functions with security enhancements. In this case the buffer overflow won't occur but unfortunately the correct result won't be shown as well.
If the arguments types did not change their digit capacity the code is considered to be correct and warning messages won't be shown. The example:
printf("%d", 10*5);
CString str;
size_t n = sizeof(float);
str.Format(StrFormat, static_cast<int>(n));Unfortunately, we often cannot distinguish the correct code from the incorrect one while diagnosing the described type of errors. This warning message will be shown on many of calls of the functions with variable items number even when the call is absolutely correct. It is related to the principal danger of using such C++ constructions. Most frequent problems are the problems with the use of variants of the following functions: 'printf', 'scanf', 'CString::Format'. The generally accepted practice is to refuse them and to use safe programming methods. For example, you may replace 'printf' with 'cout' and 'sprintf' with 'boost::format' or 'std::stringstream'.
Note. Eliminating false positives when working with formatted output functions
The V111 diagnostic is very simple. When the analyzer has no information about a variadic function, it warns you about every case when variable of memsize-type is passed to that function. When it does have the information, the more accurate diagnostic V576 joins in and V111 diagnostic will not issue a warning. When V576 is disabled, V111 will work in any case.
Therefore, you can reduce the number of false positives by providing the analyzer with information about the format functions. The analyzer is already familiar with such typical functions as 'printf', 'sprintf', etc., so it is user-implemented functions that you want to annotate. See the description of the V576 diagnostic for details about annotating functions.
Consider the following example. You may ask, "Why does not the analyzer output a V111 warning in case N1, but does that in case N2?"
void OurLoggerFn(wchar_t const* const _Format, ...)
{
....
}
void Foo(size_t length)
{
wprintf( L"%Iu", length ); // N1
OurLoggerFn( L"%Iu", length ); // N2
}The reason is that the analyzer knows how standard function 'wprintf' works, while it knows nothing about 'OurLoggerFn', so it prefers to be overcautious and issues a warning about passing a memsize-type variable ('size_t' in this case) as an actual argument to a variadic function.
To eliminate the V111 warning, annotate the 'OurLoggerFn' function as follows:
//+V576, function:OurLoggerFn, format_arg:1, ellipsis_arg:2
void OurLoggerFn(wchar_t const* const _Format, ...)
.....Additional materials on this topic:
- 64-bit Lessons. Lesson 10. Pattern 2. Functions with variable number of arguments.
V112. Dangerous magic number N used.
The analyzer found the use of a dangerous magic number. The possible error may consist in the use of numeric literal as special values or size of memsize type.
Note. This diagnostic rule is intended for a highly specialized task: to find magic numbers when porting code to a 64-bit system. It's better to review all the code fragments where potentially dangerous constants are used at once and then turn off the diagnostics. There is no point getting distracted all the time by warnings telling you that a constant 32, for example, is used in code. Regular review of such messages is tiresome and useless.
Let's examine the first example.
size_t ArraySize = N * 4;
size_t *Array = (size_t *)malloc(ArraySize);A programmer while writing the program relied on that the size 'size_t' will be always equal 4 and wrote the calculation of the array size "N * 4". This code does not take into account that 'size_t' on the 64-bit system will have 8 bytes and will allocate less memory than it is necessary. The correction of the code consists in the use of 'sizeof' operator instead of a constant 4.
size_t ArraySize = N * sizeof(size_t);
size_t *Array = (size_t *)malloc(ArraySize);The second example.
size_t n = static_cast<size_t>(-1);
if (n == 0xffffffffu) { ... }Sometimes as an error code or other special marker the value "-1" is used which is written as "0xffffffff". On the 64-bit platform the written expression is incorrect and one should evidently use the value "-1".
size_t n = static_cast<size_t>(-1);
if (n == static_cast<size_t>(-1)) { ... }Let's list magic numbers which may influence the efficiency of an application while porting it on the 64-bit system and due to this are diagnosed by analyzer.

You should study the code thoroughly in order to see if there are magic constants and replace them with safe constants and expressions. For this purpose you may use 'sizeof()' operator, special value from <limits.h>, <inttypes.h> etc.
In some cases magic constants are not considered unsafe. For example, there will be no warning on this code:
float Color[4];Additional materials on this topic:
- 64-bit Lessons. Lesson 9. Pattern 1. Magic numbers.
V113. Implicit type conversion from memsize to double type or vice versa.
The analyzer found a possible error related to the implicit conversion of memsize type to 'double' type of vice versa. The possible error may consist in the impossibility of storing the whole value range of memsize type in variables of 'double' type.
Let's study an example.
SIZE_T size = SIZE_MAX;
double tmp = size;
size = tmp; // x86: size == SIZE_MAX
// x64: size != SIZE_MAX'double' type has size 64 bits and is compatible IEEE-754 standard on 32-bit and 64-bit systems. Some programmers use 'double' type to store and work with integer types.
The given example may be justified on a 32-bit system for 'double' type has 52 significant bits and is capable to store a 32-bit integer value without a loss. But while trying to store an integer number in a variable of 'double' type the exact value can be lost (see picture).

If an approximate value can be used for the work algorithm in your program no corrections are needed. But we would like to warn you about the results of the change of behavior of a code like this on 64-bit systems. In any case it is not recommended to mix integer arithmetic with floating point arithmetic.
Additional materials on this topic:
- 64-bit Lessons. Lesson 18. Pattern 10. Storage of integer values in double.
V114. Dangerous explicit type pointer conversion.
The analyzer found a possible error related to the dangerous explicit type conversion of a pointer of one type to a pointer of another. The error may consist in the incorrect work with the objects to which the analyzer refers.
Let's examine an example. It contains the explicit type conversion of a 'int' pointer to a 'size_t' pointer.
int array[4] = { 1, 2, 3, 4 };
size_t *sizetPtr = (size_t *)(array);
cout << sizetPtr[1] << endl;As you can see the result of the program output is different in 32-bit and 64-bit variants. On the 32-bit system the access to the array items is correct for the sizes of 'size_t' and 'int' types coincide and we see the output "2". On the 64-bit system we got "17179869187" in output for it is this value 17179869187 which stays in the first item of array 'sizetPtr'.
The correction of the situation described consists in refusing dangerous type conversions with the help of the program modernization. Another variant is to create a new array and to copy into it the values from the original array.
Of course not all the explicit conversions of pointer types are dangerous. In the following example the work result does not depend on the system capacity for 'enum' type and 'int' type have the same size on the 32-bit system and the 64-bit system as well. So the analyzer won't show any warning messages on this code.
int array[4] = { 1, 2, 3, 4 };
enum ENumbers { ZERO, ONE, TWO, THREE, FOUR };
ENumbers *enumPtr = (ENumbers *)(array);
cout << enumPtr[1] << endl;Additional materials on this topic:
- 64-bit Lessons. Lesson 14. Pattern 6. Changing an array's type.
- 64-bit Lessons. Lesson 15. Pattern 7. Pointer packing.
V115. Memsize type is used for throw.
The analyzer found a possible error related to the use of memsize type for throwing an exception. The error may consist in the incorrect exception handling.
Let's examine an example of the code which contains 'throw' and 'catch' operators.
char *ptr1, *ptr2;
...
try {
throw ptr2 - ptr1;
}
catch(int) {
Foo();
}On 64-bit system the exception handler will not work and the function 'Foo()' will not be called. This results from the fact that expression "ptr2 - ptr1" has type 'ptrdiff_t' which on 64-bit system does not equivalent with type 'int'.
The correction of the situation described consists in use of correct type for catch of exception. In this case is necessary use of 'ptrdiff_t' type, as noted below.
try {
throw ptr2 - ptr1;
}
catch(ptrdiff_t) {
Foo();
}More right correction will consist in refusal of similar practice of programming. We recommend to use special classes for sending information about the error.
Additional materials on this topic:
- 64-bit Lessons. Lesson 20. Pattern 12. Exceptions.
V116. Memsize type is used for catch.
The analyzer found a possible error related to the use of memsize type for catching exception. The error may consist in the incorrect exception handling.
Let's examine an example of the code which contains 'throw' and 'catch' operators.
try {
try {
throw UINT64(-1);
}
catch(size_t) {
cout << "x64 portability issues" << endl;
}
}
catch(UINT64) {
cout << "OK" << endl;
}The work result on the 32-bit system: OKThe work result on the 64-bit system: x64 portability issues
This behavior change is connected with what on 64-bit system the 'size_t' type is equivalent to 'UINT64'.
Correction of the described situation consists in change of a code for achievement of necessary logic of work.
More right correction will consist in refusal of similar practice of programming. We recommend using special classes for sending information about the error.
Additional materials on this topic:
- 64-bit Lessons. Lesson 20. Pattern 12. Exceptions.
V117. Memsize type is used in the union.
The analyzer found a possible error related to the use of memsize inside a union. The error may occur while working with such unions without taking into account the size changes of memsize types on the 64-bit system.
One should be attentive to the unions which contain pointers and other members of memsize type.
The first example.
Sometimes one needs to work with a pointer as with an integer. The code in the example is convenient because the explicit type conversions are not used for work with the pointer number form.
union PtrNumUnion {
char *m_p;
unsigned m_n;
} u;
...
u.m_p = str;
u.m_n += delta;This code is correct on 32-bit systems and is incorrect on 64-bit ones. Changing the 'm_n' member on the 64-bit system we work only with a part of the 'm_p' pointer. One should use that type which would conform with the pointer size as follows.
union PtrNumUnion {
char *m_p;
size_t m_n; //type fixed
} u;The second example.
Another frequent case of use of a union is the representation of one member as a set of smaller ones. For example, we may need to split the 'size_t' type value into bytes for realization of the table algorithm of counting zero bits in a byte.
union SizetToBytesUnion {
size_t value;
struct {
unsigned char b0, b1, b2, b3;
} bytes;
} u;
SizetToBytesUnion u;
u.value = value;
size_t zeroBitsN = TranslateTable[u.bytes.b0] +
TranslateTable[u.bytes.b1] +
TranslateTable[u.bytes.b2] +
TranslateTable[u.bytes.b3];A fundamental algorithmic error is made here which is based on the supposition that the 'size_t' type consists of 4 bytes. The automatic search of algorithmic errors is not possible on the current stage of development of static analyzers but Viva64 provides search of all the unions which contain memsize types. Looking through the list of such potentially dangerous unions a user can find logical errors. On finding the union given in the example a user can detect an algorithmic error and rewrite the code in the following way.
union SizetToBytesUnion {
size_t value;
unsigned char bytes[sizeof(value)];
} u;
SizetToBytesUnion u;
u.value = value;
size_t zeroBitsN = 0;
for (size_t i = 0; i != sizeof(u.bytes); ++i)
zeroBitsN += TranslateTable[u.bytes[i]];This warning message is similar to the warning V122.
Additional materials on this topic:
- 64-bit Lessons. Lesson 16. Pattern 8. Memsize-types in unions.
V118. malloc() function accepts a dangerous expression in the capacity of an argument.
The analyzer detected a potential error relating to using a dangerous expression serving as an actual argument for malloc function. The error may lie in incorrect suggestions about types' sizes defined as numerical constants.
The analyzer considers suspicious those expressions which contain constant literals multiple of four but which lack sizeof() operator.
Example 1.
An incorrect code of memory allocation for a matrix 3x3 of items of size_t type may look as follows:
size_t *pMatrix = (size_t *)malloc(36); // V118Although this code could work very well in a 32-bit system, using number 36 is incorrect. When compiling a 64-bit version 72 bytes must be allocated. You may use sizeof () operator to correct this error:
size_t *pMatrix = (size_t *)malloc(9 * sizeof(size_t));Example 2.
The following code based on the suggestion that the size of Item structure is 12 bytes is also incorrect for a 64-bit system:
struct Item {
int m_a;
int m_b;
Item *m_pParent;
};
Item *items = (Item *)malloc(GetArraySize() * 12); // V118Correction of this error also consists in using sizeof() operator to correctly calculate the size of the structure:
Item *items = (Item *)malloc(GetArraySize() * sizeof(Item));These errors are simple and easy to correct. But they are nevertheless dangerous and difficult to find in case of large applications. That's why diagnosis of such errors is implemented as a separate rule.
Presence of a constant in an expression which is a parameter for malloc() function does not necessarily means that V118 warning will be always shown on it. If sizeof() operator participates in the expression this construction is safe. Here is an example of a code which the analyzer considers safe:
int *items = (int *)malloc(sizeof(int) * 12);Additional materials on this topic:
- 64-bit Lessons. Lesson 9. Pattern 1. Magic numbers.
V119. More than one sizeof() operator is used in one expression.
The analyzer detected an unsafe arithmetic expression containing several sizeof() operators. Such expressions can potentially contain errors relating to incorrect calculations of the structures' sizes without taking into account field alignment.
Example:
struct MyBigStruct {
unsigned m_numberOfPointers;
void *m_Pointers[1];
};
size_t n2 = 1000;
void *p;
p = malloc(sizeof(unsigned) + n2 * sizeof(void *));To calculate the size of the structure which will contain 1000 pointers, an arithmetic expression is used which is correct at first sight. The sizes of the base types are defined by sizeof() operators. It is good but not sufficient for correct calculation of the necessary memory size. You should also take into account field alignment.
This example is correct for a 32-bit mode for the sizes of the pointers and unsigned type coincide. They are both 4 bytes. The pointers and unsigned type are aligned also at the boundary of four bytes. So the necessary memory size will be calculated correctly.
In a 64-bit code the size of the pointer is 8 bytes. Pointers are aligned at the boundary of 8 bytes as well. It leads to that after m_numberOfPointers variable 4 additional bytes will be situated at the boundary of 8 bytes to align the pointers.
To calculate the correct size you should use offsetof function:
p = malloc(offsetof(MyBigStruct, m_Pointers) +
n * sizeof(void *));In many cases using several sizeof() operators in one expression is correct and the analyzer ignores such constructions. Here is an example of safe expressions with several sizeof operators:
int MyArray[] = { 1, 2, 3 };
size_t MyArraySize =
sizeof(MyArray) / sizeof(MyArray[0]);
assert(sizeof(unsigned) < sizeof(size_t));
size_t strLen = sizeof(String) - sizeof(TCHAR);Additional materials on this topic:
- 64-bit Lessons. Lesson 21. Pattern 13. Data alignment.
V120. Member operator[] of object 'foo' is declared with 32-bit type argument, but is called with memsize type argument.
The analyzer detected a potential error of working with classes that contain operator[].
Classes with an overloaded operator[] are usually a kind of an array where the index of the item being called is operator[] argument. If operator[] has a 32-bit type formal argument but memsize-type is used as an actual argument, it might indicate an error. Let us consider an example leading to the warning V120:
class MyArray {
int m_arr[10];
public:
int &operator;[](unsigned i) { return m_arr[i]; }
} Object;
size_t k = 1;
Object[k] = 44; //V120This example does not contain an error but might indicate an architecture shortcoming. You should either work with MyArray using 32-bit indexes or modify operator[] so that it takes an argument of size_t type. The latter is preferable because memsize-types not only serve to make a program safer but sometimes allow the compiler to build a more efficient code.
The related diagnostic warnings are V108 and V302.
V121. Implicit conversion of the type of 'new' operator's argument to size_t type.
The analyzer detected a potential error related to calling the operator new. A value of a non-memsize type is passed to the operator "new" as an argument. The operator new takes values of the type size_t, and passing a 32-bit actual argument may signal a potential overflow that may occur when calculating the memory amount being allocated.
Here is an example:
unsigned a = 5;
unsigned b = 1024;
unsigned c = 1024;
unsigned d = 1024;
char *ptr = new char[a*b*c*d]; //V121Here you may see an overflow occurring when calculating the expression "a*b*c*d". As a result, the program allocates less memory than it should. To correct the code, use the type size_t:
size_t a = 5;
size_t b = 1024;
size_t c = 1024;
size_t d = 1024;
char *ptr = new char[a*b*c*d]; //OkThe error will not be diagnosed if the value of the argument is defined as a safe 32-bit constant value. Here is an example of safe code:
char *ptr = new char[100];
const int size = 3*3;
char *p2 = new char[size];This warning message is similar to the warning V106.
Additional materials on this topic:
- 64-bit Lessons. Lesson 17. Pattern 9. Mixed arithmetic.
V122. Memsize type is used in the struct/class.
Sometimes you might need to find all the fields in the structures that have a memsize-type. You can find such fields using the V122 diagnostic rule.
The necessity to view all the memsize-fields might appear when you port a program that has structure serialization, for example, into a file. Consider an example:
struct Header
{
unsigned m_version;
size_t m_bodyLen;
};
...
size_t size = fwrite(&header, 1, sizeof(header), file);
...This code writes a different number of bytes into the file depending on the mode it is compiled in - either Win32 or Win64. This might violate compatibility of files' formats or cause other errors.
The task of automating the detection of such errors is almost impossible to solve. However, if there are some reasons to suppose that the code might contain such errors, developers can once check all the structures that participate in serialization. It is for this purpose that you may need a check with the V122 rule. By default it is disabled since it generates false warnings in more than 99% of cases.
In the example above, the V122 message will be produced on the line "size_t m_bodyLen;". To correct this code, you may use types of fixed size:
struct Header
{
My_UInt32 m_version;
My_UInt32 m_bodyLen;
};
...
size_t size = fwrite(&header, 1, sizeof(header), file);
...Let's consider other examples where the V122 message will be generated:
class X
{
int i;
DWORD_PTR a; //V122
DWORD_PTR b[3]; //V122
float c[3][4];
float *ptr; //V122
};V117 is a related diagnostic message.
Note. If you are sure that structures containing pointers will never serialize, you may use this comment:
//-V122_NOPTRIt will suppress all warnings related to pointers.
This comment should be added into the header file included into all the other files. For example, such is the "stdafx.h" file. If you add this comment into a "*.cpp" file, it will affect only this particular file.
V123. Allocation of memory by the pattern "(X*)malloc(sizeof(Y))" where the sizes of X and Y types are not equal.
The analyzer found a potential error related to the operation of memory allocation. When calculating the amount of memory to be allocated, the sizeof(X) operator is used. The result returned by the memory allocation function is converted to a different type, "(Y *)", instead of "(X *)". It may indicate allocation of insufficient or excessive amount of memory.
Consider the first example:
int **ArrayOfPointers = (int **)malloc(n * sizeof(int));The misprint in the 64-bit program here will cause allocation of memory twice less than necessary. In the 32-bit program, the sizes of the "int" type and "pointer to int" coincide and the program works correctly despite the misprint.
This is the correct version of the code:
int **ArrayOfPointers = (int **)malloc(n * sizeof(int *));Consider another example where more memory is allocated than needed:
unsigned *p = (unsigned *)malloc(len * sizeof(size_t));A program with such code will most probably work correctly both in the 32-bit and 64-bit versions. But in the 64-bit version, it will allocate more memory than it needs. This is the correct code:
unsigned *p = (unsigned *)malloc(len * sizeof(unsigned));In some cases the analyzer does not generate a warning although the types X and Y do not coincide. Here is an example of such correct code:
BYTE *simpleBuf = (BYTE *)malloc(n * sizeof(float));V124. Function 'Foo' writes/reads 'N' bytes. The alignment rules and type sizes have been changed. Consider reviewing this value.
The analyzer detected a potential error: the size of data being written or read is defined by a constant.
When the code is compiled in the 64-bit mode, the sizes of some data and their alignment boundaries will change. The sizes of base types and their alignment boundaries are shown in the picture:

The analyzer examines code fragments where the size of data being written or read is defined explicitly. The programmer must review these fragments. Here is a code sample:
size_t n = fread(buf, 1, 40, f_in);Constant 40 may be an incorrect value from the viewpoint of the 64-bit system. Perhaps you should write it so:
size_t n = fread(buf, 1, 10 * sizeof(size_t), f_in);V125. It is not advised to declare type 'T' as 32-bit type.
The analyzer detected a potential error: 64-bit code contains definitions of reserved types, the latter being defined as 32-bit ones.
For example:
typedef unsigned size_t;
typedef __int32 INT_PTR;Such type definitions may cause various errors since these types have different sizes in different parts of the program and libraries. For instance, the size_t type is defined in the stddef.h header file for the C language and in the cstddef file for the C++ language.
References:
- Knowledge Base. Is there a way to make the type size_t 32-bit in a 64-bit program? http://www.viva64.com/en/k/0021/
- Knowledge Base. Is size_t a standard type in C++? And in C? http://www.viva64.com/en/k/0022/
V126. Be advised that the size of the type 'long' varies between LLP64/LP64 data models.
This diagnostic message lets you find all the 'long' types used in a program.
Of course, presence of the 'long' type in a program is not an error in itself. But you may need to review all the fragments of the program text where this type is used when you create portable 64-bit code that must work well in Windows and Linux.
Windows and Linux use different data models for the 64-bit architecture. A data model means correlations of sizes of base data types such as int, float, pointer, etc. Windows uses the LLP64 data model while Linux uses the LP64 data model. In these models, the sizes of the 'long' type are different.
In Windows (LLP64), the size of the 'long' type is 4 bytes.
In Linux (LP64), the size of the 'long' type is 8 bytes.
The difference of the 'long' type's sizes may make files' formats incompatible or cause errors when developing code executed in Linux and Windows. So if you want, you may use PVS-Studio to review all the code fragments where the 'long' type is used.
References:
- Terminology. Data model. http://www.viva64.com/en/t/0012/
V127. An overflow of the 32-bit variable is possible inside a long cycle which utilizes a memsize-type loop counter.
The analyzer detected a potential error: a 32-bit variable might overflow in a long loop.
Of course, the analyzer will not be able to find all the possible cases when variable overflows in loops occur.
But it will help you find some incorrect type constructs.
For example:
int count = 0;
for (size_t i = 0; i != N; i++)
{
if ((A[i] & MASK) != 0)
count++;
}This code works well in a 32-bit program. The variable of the 'int' type is enough to count the number of some items in the array. But in a 64-bit program the number of these items may exceed INT_MAX and an overflow of the 'count' variable will occur. This is what the analyzer warns you about by generating the V127 message. This is the correct code:
size_t count = 0;
for (size_t i = 0; i != N; i++)
{
if ((A[i] & MASK) != 0)
count++;
}The analyzer also contains several additional checks to make false reports fewer. For instance, the V127 warning will not be generated when we deal with a short loop. Here you are a sample of code the analyzer considers safe:
int count = 0;
for (size_t i = 0; i < 100; i++)
{
if ((A[i] & MASK) != 0)
count++;
}V128. A variable of the memsize type is read from a stream. Consider verifying the compatibility of 32 and 64 bit versions of the application in the context of a stored data.
The analyzer has detected a potential error related to data incompatibility between the 32-bit and 64-bit versions of an application, when memsize-variables are being written to or read from the stream. The error is this: data written to the binary file in the 32-bit program version will be read incorrectly by the 64-bit one.
For example:
std::vector<int> v;
....
ofstream os("myproject.dat", ios::binary);
....
os << v.size();The 'size()' function returns a value of the size_t type whose size is different in 32-bit and 64-bit applications. Consequently, different numbers of bytes will be written to the file.
There exist many ways to avoid the data incompatibility issue. The simplest and crudest one is to strictly define the size of types being written and read. For example:
std::vector<int> v;
....
ofstream os("myproject.dat", ios::binary);
....
os << static_cast<__int64>(v.size());A strictly defined cast to 64-bit types cannot be called a nice solution, of course. The reason is that this method won't let the program read data written by the old 32-bit program version. On the other hand, if data are defined to be read and written as 32-bit values, we face another problem: the 64-bit program version won't be able to write information about arrays consisting of more than 2^32 items. This may be a disappointing limitation, as 64-bit software is usually created to handle huge data arrays.
A way out can be found through introducing a notion of the version of saved data. For example, 32-bit applications can open files created by the 32-bit version of your program, while 64-bit applications can handle data generated both by the 32-bit and 64-bit versions.
One more way to solve the compatibility problem is to store data in the text format or the XML format.
Note that this compatibility issue is irrelevant in many programs. If your application doesn't create projects and other files to be opened on other computers, you may turn off the V128 diagnostic.
You also shouldn't worry if the stream is used to print values on the screen. PVS-Studio tries to detect these situations and avoid generating the message. False positives are, however, still possible. If you get them, use one of the false positive suppression mechanisms described in the documentation.
Additional features
According to users demand, we added a possibility to manually point out functions, which saves or loads data. When somewhere in code a memsize-type is passed to one of these functions, this code considered dangerous.
Addition format is as follows: just above function prototype (or near its realization, or in standard header file) user should add a special comment. Let us start with the usage example:
//+V128, function:write, non_memsize:2
void write(string name, char);
void write(string name, int32);
void write(string name, int64);
foo()
{
write("zz", array.size()); // warning V128
}Format:
- "function" key represents name of the function to be checked by analyzer. This key is necessary – without this key addition, of course, would not work.
- "class" key – non-necessary key that allows to enter class name to which this function belongs (i.e. class method). Without specifying it analyzer will check any function with given name, with specifying – only ones that belongs to the particular class.
- "namespace" key – non-necessary key that allows to enter namespace name to which function belongs. Again, without specifying it analyzer will check any function with given name, with specifying – only ones that belongs to the particular namespace. Key will correctly work with the "class" key – analyzer then will check any class method with given name that belongs to particular namespace.
- "non_memsize" key allows specifying number of argument that should not allow type, which size changes depending on architecture. Number counts from one, not from zero. There is a technical restriction – this number should not exceed 14. There may be multiple "non-memsize" keys if there is a need to check multiple function arguments.
Warning level in case of user functions is always first.
At last, here is full usage example:
// Warns when in method C of class B
// from A namespace memsize-type value
// is put as a second or third argument.
//+V128,namespace:A,class:B,function:C,non_memsize:3,non_memsize:2V201. Explicit conversion from 32-bit integer type to memsize type.
It informs about the presence of the explicit type conversion from 32-bit integer type to memsize type which may hide one of the following errors: V101, V102, V104, V105, V106, V108, V109. You may address to the given warnings list to find out the cause of showing the diagnosis message V201.
The V201 warning applied to conversions of 32-bit integer types to pointers before. Such conversions are rather dangerous, so we singled them out into a separate diagnostic rule V204.
Keep in mind that most of the warnings of this type will be likely shown on the correct code. Here are some examples of the correct and incorrect code on which this warning will be shown.
The examples of the incorrect code.
int i;
ptrdiff_t n;
...
for (i = 0; (ptrdiff_t)(i) != n; ++i) { //V201
...
}
unsigned width, height, depth;
...
size_t arraySize = size_t(width * height * depth); //V201The examples of the correct code.
const size_t seconds = static_cast<size_t>(60 * 60); //V201
unsigned *array;
...
size_t sum = 0;
for (size_t i = 0; i != n; i++) {
sum += static_cast<size_t>(array[i] / 4); //V201
}
unsigned width, height, depth;
...
size_t arraySize =
size_t(width) * size_t(height) * size_t(depth); //V201V202. Explicit conversion from memsize type to 32-bit integer type.
It informs about the presence of the explicit integer memsize type conversion to 32-bit type which may hide one of the following errors: V103, V107, V110. You may see the given warnings list to find out the cause of showing the warning message V202.
The V202 warning applied to conversions of pointers to 32-bit integer types before. Such conversions are rather dangerous, so we singled them out into a separate rule V205.
Keep in mind that most of the warnings of this type will be likely shown on the correct code. Here are some examples of the correct and incorrect code on which this warning will be shown.
The examples of the incorrect code.
size_t n;
...
for (unsigned i = 0; i != (unsigned)n; ++i) { //V202
...
}
UINT_PTR width, height, depth;
...
UINT arraySize = UINT(width * height * depth); //V202The examples of the correct code.
const unsigned bits =
unsigned(sizeof(object) * 8); //V202
extern size_t nPane;
extern HICON hIcon;
BOOL result =
SetIcon(static_cast<int>(nPane), hIcon); //V202Additional materials on this topic:
- 64-bit Lessons. Lesson 15. Pattern 7. Pointer packing.
V203. Explicit type conversion from memsize to double type or vice versa.
The analyzer found a possible error related to the explicit conversion of memsize type into 'double' type and vice versa. The possible error may consist in the impossibility to save the whole range of values of memsize type in variables of 'double' type.
This error is completely similar to error V113. The difference is in that the explicit type conversion is used as in a further example:
SIZE_T size = SIZE_MAX;
double tmp = static_cast<double>(size);
size = static_cast<SIZE_T>(tmp); // x86: size == SIZE_T
// x64: size != SIZE_TTo study this kind of errors see the description of error V113.
Additional materials on this topic:
- 64-bit Lessons. Lesson 18. Pattern 10. Storage of integer values in double.
V204. Explicit conversion from 32-bit integer type to pointer type.
This warning informs you about an explicit conversion of a 32-bit integer type to a pointer type. We used the V201 diagnostic rule before to diagnose this situation. But explicit conversion of the 'int' type to pointer is much more dangerous than conversion of 'int' to 'intptr_t'. That is why we created a separate rule to search for explicit type conversions when handling pointers.
Here is a sample of incorrect code.
int n;
float *ptr;
...
ptr = (float *)(n);The 'int' type's size is 4 bytes in a 64-bit program, so it cannot store a pointer whose size is 8 bytes. Type conversion like in the sample above usually signals an error.
What is very unpleasant about such errors is that they can hide for a long time before you reveal them. A program might store pointers in 32-bit variables and work correctly for some time as long as all the objects created in the program are located in low-order addresses of memory.
If you need to store a pointer in an integer variable for some reason, you'd better use memsize-types. For instance: size_t, ptrdiff_t, intptr_t, uintptr_t.
This is the correct code:
intptr_t n;
float *ptr;
...
ptr = (float *)(n);However, there is a specific case when you may store a pointer in 32-bit types. I am speaking about handles which are used in Windows to work with various system objects. Here are examples of such types: HANDLE, HWND, HMENU, HPALETTE, HBITMAP, etc. Actually these types are pointers. For instance, HANDLE is defined in header files as "typedef void *HANDLE;".
Although handles are 64-bit pointers, only the less significant 32 bits are employed in them for the purpose of better compatibility (for example, to enable 32-bit and 64-bit processes interact with each other). For details, see "Microsoft Interface Definition Language (MIDL): 64-Bit Porting Guide" (USER and GDI handles are sign extended 32b values).
Such pointers can be stored in 32-bit data types (for instance, int, DWORD). To cast such pointers to 32-bit types and vice versa special functions are used:
void * Handle64ToHandle( const void * POINTER_64 h )
void * POINTER_64 HandleToHandle64( const void *h )
long HandleToLong ( const void *h )
unsigned long HandleToUlong ( const void *h )
void * IntToPtr ( const int i )
void * LongToHandle ( const long h )
void * LongToPtr ( const long l )
void * Ptr64ToPtr ( const void * POINTER_64 p )
int PtrToInt ( const void *p )
long PtrToLong ( const void *p )
void * POINTER_64 PtrToPtr64 ( const void *p )
short PtrToShort ( const void *p )
unsigned int PtrToUint ( const void *p )
unsigned long PtrToUlong ( const void *p )
unsigned short PtrToUshort ( const void *p )
void * UIntToPtr ( const unsigned int ui )
void * ULongToPtr ( const unsigned long ul )Additional materials on this topic:
- Knowledge Base. "How to correctly cast a pointer to int in a 64-bit application?"
V205. Explicit conversion of pointer type to 32-bit integer type.
This warning informs you about an explicit conversion of a pointer type to a 32-bit integer type. We used the V202 diagnostic rule before to diagnose this situation. But explicit conversion of a pointer to the 'int' type is much more dangerous than conversion of 'intptr_t' to 'int'. That is why we created a separate rule to search for explicit type conversions when handling pointers.
Here is a sample of incorrect code.
int n;
float *ptr;
...
n = (int)ptr;The 'int' type's size is 4 bytes in a 64-bit program, so it cannot store a pointer whose size is 8 bytes. Type conversion like in the sample above usually signals an error.
What is very unpleasant about such errors is that they can hide for a long time before you reveal them. A program might store pointers in 32-bit variables and work correctly for some time as long as all the objects created in the program are located in low-order addresses of memory.
If you need to store a pointer in an integer variable for some reason, you'd better use memsize-types. For instance: size_t, ptrdiff_t, intptr_t, uintptr_t.
This is the correct code:
intptr_t n;
float *ptr;
...
n = (intptr_t)ptr;However, there is a specific case when you may store a pointer in 32-bit types. I am speaking about handles which are used in Windows to work with various system objects. Here are examples of such types: HANDLE, HWND, HMENU, HPALETTE, HBITMAP, etc. Actually these types are pointers. For instance, HANDLE is defined in header files as "typedef void *HANDLE;".
Although handles are 64-bit pointers, only the less significant 32 bits are employed in them for the purpose of better compatibility (for example, to enable 32-bit and 64-bit processes interact with each other). For details, see "Microsoft Interface Definition Language (MIDL): 64-Bit Porting Guide" (USER and GDI handles are sign extended 32b values).
Such pointers can be stored in 32-bit data types (for instance, int, DWORD). To cast such pointers to 32-bit types and vice versa special functions are used:
void * Handle64ToHandle( const void * POINTER_64 h )
void * POINTER_64 HandleToHandle64( const void *h )
long HandleToLong ( const void *h )
unsigned long HandleToUlong ( const void *h )
void * IntToPtr ( const int i )
void * LongToHandle ( const long h )
void * LongToPtr ( const long l )
void * Ptr64ToPtr ( const void * POINTER_64 p )
int PtrToInt ( const void *p )
long PtrToLong ( const void *p )
void * POINTER_64 PtrToPtr64 ( const void *p )
short PtrToShort ( const void *p )
unsigned int PtrToUint ( const void *p )
unsigned long PtrToUlong ( const void *p )
unsigned short PtrToUshort ( const void *p )
void * UIntToPtr ( const unsigned int ui )
void * ULongToPtr ( const unsigned long ul )Let's take a look at the following example:
HANDLE h = Get();
UINT uId = (UINT)h;The analyzer does not generate the message here, though HANDLE is nothing but a pointer. Values of this pointer always fit into 32 bits. Just make sure you take care when working with them in future. Keep in mind that non-valid handles are declared in the following way:
#define INVALID_HANDLE_VALUE ((HANDLE)(LONG_PTR)-1)That's why it would be incorrect to write the next line like this:
if (HANDLE(uID) == INVALID_HANDLE_VALUE)Since the 'uID' variable is unsigned, the pointer's value will equal 0x00000000FFFFFFFF, not 0xFFFFFFFFFFFFFFFF.
The analyzer will generate the V204 warning for a suspicious check when unsigned turns into a pointer.
Additional materials on this topic:
- Knowledge Base. "How to correctly cast a pointer to int in a 64-bit application?"
V206. Explicit conversion from 'void *' to 'int *'.
This warning informs you about an explicit conversion of the 'void *' or 'byte *' pointer to a function pointer or 32/64-bit integer pointer. Or vice versa.
Of course, the type conversion like that is not in itself an error. Let's figure out what for we have implemented this diagnostic.
It is a pretty frequent situation when a pointer to some memory buffer is passed into another part of the program through a void * or byte * pointer. There may be different reasons for doing so; it usually indicates a poor code design, but this question is out of the scope of this paper. Function pointers are often stored as void * pointers, too.
So, assume we have an array/function pointer saved as void * in some part of the program while it is cast back in another part. When porting such a code, you may get unpleasant errors: a type may change in one place but stay unchanged in some other place.
For example:
size_t array[20];
void *v = array;
....
unsigned* sizes = (unsigned*)(v);This code works well in the 32-bit mode as the sizes of the 'unsigned' and 'size_t' types coincide. In the 64-bit mode, however, their sizes are different and the program will behave unexpectedly. See also pattern 6, changing an array type.
The analyzer will point out the line with the explicit type conversion where you will discover an error if study it carefully. The fixed code may look like this:
unsigned array[20];
void *v = array;
....
unsigned* sizes = (unsigned*)(v);or like this:
size_t array[20];
void *v = array;
....
size_t* sizes = (size_t*)(v);A similar error may occur when working with function pointers.
void Do(void *ptr, unsigned a)
{
typedef void (*PtrFoo)(DWORD);
PtrFoo f = (PtrFoo)(ptr);
f(a);
}
void Foo(DWORD_PTR a) { /*... */ }
void Call()
{
Do(Foo, 1);
}The fixed code:
typedef void (*PtrFoo)(DWORD_PTR);Note. The analyzer knows about the plenty of cases when explicit type conversion is safe. For instance, it doesn't worry about explicit type conversion of a void * pointer returned by the malloc() function:
int *p = (int *)malloc(sizeof(int) * N);As said in the beginning, explicit type conversion is not in itself an error. That's why, despite numbers of exceptions to this rule, the analyzer still generates quite a lot of false V206 warnings. It doesn't know if there are any other fragments in the program where these pointers are used incorrectly, so it has to generate warnings on every potentially dangerous type conversion.
For instance, I've cited two examples of incorrect code and ways to fix them above. Even after they are fixed, the analyzer will keep generating false positives on the already correct code.
You can use the following approach to handle this warning: carefully study all the V206 messages once and then disable this diagnostic in the settings. If there are few false positives, use one of the false positive suppression methods.
V207. A 32-bit variable is utilized as a reference to a pointer. A write outside the bounds of this variable may occur.
This warning informs you about an explicit conversion of a 32-bit integer variable to the reference to pointer type.
Let's start with a simple synthetic example:
int A;
(int *&)A = pointer;Suppose we need for some reason to write a pointer into an integer variable. To do this, we can cast the integer 'A' variable to the 'int *&' type (reference to pointer).
This code can work well in a 32-bit system as the 'int' type and the pointer have the same sizes. But in a 64-bit system, writing outside the 'A' variable's memory bounds will occur, which will in its turn lead to undefined behavior.
To fix the bug, we need to use one of the memsize-types - for example intptr_t:
intptr_t A;
(intptr_t *&)A = pointer;Now let's discuss a more complicated example, based on code taken from a real-life application:
enum MyEnum { VAL1, VAL2 };
void Get(void*& data) {
static int value;
data = &value;
}
void M() {
MyEnum e;
Get((void*&)e);
....
}There is a function which returns values of the pointer type. One of the returned values is written into a variable of the 'enum' type. We won't discuss now the reason for doing so; we are rather interested in the fact that this code used to work right in the 32-bit mode while its 64-bit version doesn't - the Get() function changes not only the 'e' variable but the nearby memory as well.
V220. Suspicious sequence of types castings: memsize -> 32-bit integer -> memsize.
The warning informs you about a strange sequence of type conversions. A memsize-type is explicitly cast to a 32-bit integer type and then is again cast to a memsize-type either explicitly or implicitly. Such a sequence of conversions leads to a loss of high-order bits. Usually it signals a crucial error.
Consider this sample:
char *p1;
char *p2;
ptrdiff_t n;
...
n = int(p1 - p2);We have an unnecessary conversion to the 'int' type here. It must not be here and even might cause a failure if p1 and p2 pointers are more than INT_MAX items away from each other in a 64-bit program.
This is the correct code:
char *p1;
char *p2;
ptrdiff_t n;
...
n = p1 - p2;Let's consider another sample:
BOOL SetItemData(int nItem, DWORD_PTR dwData);
...
CItemData *pData = new CItemData;
...
CListCtrl::SetItemData(nItem, (DWORD)pData);This code will cause an error if the CltemData object is created beyond the four low-order Gbytes of memory. This is the correct code:
BOOL SetItemData(int nItem, DWORD_PTR dwData);
...
CItemData *pData = new CItemData;
...
CListCtrl::SetItemData(nItem, (DWORD_PTR)pData);One should keep in mind that the analyzer does not generate the warning when conversion is done over such data types as HANDLE, HWND, HCURSOR, and so on. Although these types are in fact pointers (void *), their values always fit into the least significant 32 bits. It is done on purpose so that these handles could be passed between 32-bit and 64-bit processes. For details see How to correctly cast a pointer to int in a 64-bit application?
Have a look at the following example:
typedef void * HANDLE;
HANDLE GetHandle(DWORD nStdHandle);
int _open_osfhandle(intptr_t _OSFileHandle, int _Flags);
....
int fh = _open_osfhandle((int)GetHandle(sh), 0);We are dealing with a conversion of the following kind:
HANDLE -> int -> intptr_t
That is, the pointer is first cast to the 32-bit 'int' type and then is extended to 'intptr_t'. It doesn't look nice. The programmer should rather have written it like "(intptr_t)GetHandle(STD_OUTPUT_HANDLE)". But there is still no error here as values of the HANDLE type fit into 'int'. That's why the analyzer keeps silent.
If it were written like this:
int fh = _open_osfhandle((unsigned)GetHandle(sh), 0);the analyzer would generate the message. Mixing signed and unsigned types together spoils it all. Suppose GetHandle() returns INVALID_HANDLE_VALUE. This value is defined in the system headers in the following way:
#define INVALID_HANDLE_VALUE ((HANDLE)(LONG_PTR)-1)Now, what we get after the conversion (intptr_t)(unsigned)((HANDLE)(LONG_PTR)-1) is:
-1 -> 0xffffffffffffffff -> HANDLE -> 0xffffffffu -> 0x00000000fffffffff
The value -1 has turned into 4294967295. The programmer may fail to notice and take this into account and the program will keep running incorrectly if the GetHandle() function returns INVALID_HANDLE_VALUE. Because of that, the analyzer will generate the warning in the second case.
V221. Suspicious sequence of types castings: pointer -> memsize -> 32-bit integer.
This warning informs the programmer about the presence of a strange sequence of type conversions. A pointer is explicitly cast to a memsize-type and then again, explicitly or implicitly, to the 32-bit integer type. This sequence of conversions causes a loss of the most significant bits. It usually indicates a serious error in the code.
Take a look at the following example:
int *p = Foo();
unsigned a, b;
a = size_t(p);
b = unsigned(size_t(p));In both cases, the pointer is cast to the 'unsigned' type, causing its most significant part to be truncated. If you then cast the variable 'a' or 'b' to a pointer again, the resulting pointer is likely to be incorrect.
The difference between the variables 'a' and 'b' is only in that the second case is harder to diagnose. In the first case, the compiler will warn you about the loss of the most significant bits, but keep silent in the second case as what is used there is an explicit type conversion.
To fix the error, we should store pointers in memsize-types only, for example in variables of the size_t type:
int *p = Foo();
size_t a, b;
a = size_t(p);
b = size_t(p);There may be difficulties with understanding why the analyzer generates the warning on the following code pattern:
BOOL Foo(void *ptr)
{
return (INT_PTR)ptr;
}You see, the BOOL type is nothing but a 32-bit 'int' type. So we are dealing with a sequence of type conversions:
pointer -> INT_PTR -> int.
You may think there's actually no error here because what matters to us is only whether or not the pointer is equal to zero. But the error is real. It's just that programmers sometimes confuse the ways the types BOOL and bool behave.
Assume we have a 64-bit variable whose value equals 0x000012300000000. Casting it to bool and BOOL will have different results:
int64_t v = 0x000012300000000ll;
bool b = (bool)(v); // true
BOOL B = (BOOL)(v); // FALSE
In the case of 'BOOL', the most significant bits will be simply truncated and the non-zero value will turn to 0 (FALSE).
It's just the same with the pointer. When explicitly cast to BOOL, its most significant bits will get truncated and the non-zero pointer will turn to the integer 0 (FALSE). Although low, there is still some probability of this event. Therefore, code like that is incorrect.
To fix it, we can go two ways. The first one is to use the 'bool' type:
bool Foo(void *ptr)
{
return (INT_PTR)ptr;
}But of course it's better and easier to do it like this:
bool Foo(void *ptr)
{
return ptr != nullptr;
}The method shown above is not always applicable. For instance, there is no 'bool' type in the C language. So here's the second way to fix the error:
BOOL Foo(void *ptr)
{
return ptr != NULL;
}Keep in mind that the analyzer does not generate the warning when conversion is done over such data types as HANDLE, HWND, HCURSOR, and so on. Although these are in fact pointers (void *), their values always fit into the least significant 32 bits. It is done on purpose so that these handles could be passed between 32-bit and 64-bit processes. For details, see: How to correctly cast a pointer to int in a 64-bit application?
V301. Unexpected function overloading behavior. See N argument of function 'foo' in derived class 'derived' and base class 'base'.
The analyzer found a possible error related to the changes in the overriding virtual functions behavior.
The example of the change in the virtual function behavior.
class CWinApp {
...
virtual void WinHelp(DWORD_PTR dwData, UINT nCmd);
...
};
class CSampleApp : public CWinApp {
...
virtual void WinHelp(DWORD dwData, UINT nCmd);
...
};It is the common example which the developer may face while porting his application to the 64-bit architecture. Let's follow the life-cycle of the developing of some application. Suppose it was being developed for Visual Studio 6.0. at first when the function 'WinHelp' in class 'CWinApp' had the following prototype:
virtual void WinHelp(DWORD dwData, UINT nCmd = HELP_CONTEXT);It would be absolutely correct to implement the overlap of the virtual function in class 'CSampleApp', as it is shown in the example. Then the project was placed into Visual Studio 2005 where the prototype of the function in class 'CWinApp' underwent changes that consist in replacing 'DWORD' type with 'DWORD_PTR' type. On the 32-bit platform this program will continue to work properly for here 'DWORD' and 'DWORD_PTR' types coincide. Troubles will occur while compiling this code for the 64-bit platform. We get two functions with the same names but with different parameters the result of which is that the user's code won't be called.
The analyzer allows to find such errors the correction of which is not difficult. It is enough to change the function prototype in the successor class as follows:
class CSampleApp : public CWinApp {
...
virtual void WinHelp(DWORD_PTR dwData, UINT nCmd);
...
};Additional materials on this topic:
- 64-bit Lessons. Lesson 12. Pattern 4. Virtual functions.
V302. Member operator[] of 'foo' class has a 32-bit type argument. Use memsize-type here.
The analyzer detected a potential error of working with classes that contain operator[]. Classes with an overloaded operator[] are usually a kind of an array where the index of the item being called is operator[] argument. If operator[] has a 32-bit type argument it might indicate an error.
Let us consider an example leading to the warning V302:
class MyArray {
std::vector<float> m_arr;
...
float &operator[](int i) //V302
{
DoSomething();
return m_arr[i];
}
} A;
...
int x = 2000;
int y = 2000;
int z = 2000;
A[x * y * z] = 33;If the class is designed to work with many arguments, implementing operator[] like this is incorrect because it does not allow addressing the items whose numbers are more than UINT_MAX. To diagnose the error in the example above you should point to the potentially incorrect operator[]. The expression "x * y * z" does not look suspicious because there is no implicit type conversion. When we correct operator[] in the following way:
float &operator[](ptrdiff_t i);PVS-Studio analyzer warns about a potential error in the line "A[x * y * z] = 33;" and now we can make the code absolutely correct. Here is an example of the corrected code:
class MyArray {
std::vector<float> m_arr;
...
float &operator[](ptrdiff_t i) //V302
{
DoSomething();
return m_arr[i];
}
} A;
...
ptrdiff_t x = 2000;
ptrdiff_t y = 2000;
ptrdiff_t z = 2000;
A[x * y * z] = 33;The related diagnostic warnings are V108 and V120.
V303. The function is deprecated in the Win64 system. It is safer to use the 'foo' function.
You should replace some functions with their new versions when porting an application to 64-bit systems. Otherwise, the 64-bit application might work incorrectly. The analyzer warns about the use of deprecated functions in code and offers versions to replace them.
Let's consider several examples of deprecated functions:
EnumProcessModules
Extract from MSDN: To control whether a 64-bit application enumerates 32-bit modules, 64-bit modules, or both types of modules, use the EnumProcessModulesEx function.
SetWindowLong
Extract from MSDN: This function has been superseded by the SetWindowLongPtr function. To write code that is compatible with both 32-bit and 64-bit versions of Windows, use the SetWindowLongPtr function.
GetFileSize
Extract from MSDN: When lpFileSizeHigh is NULL, the results returned for large files are ambiguous, and you will not be able to determine the actual size of the file. It is recommended that you use GetFileSizeEx instead.
Note
Be careful, if you want to replace the 'lstrlen' function with 'strlen'. The 'lstrlen' function cannot correctly evaluate the length of the string if this string contains of more than 'INT_MAX' characters. However, in practice the possibility to see such long strings is really low. But as opposed to the 'strlen' function, the 'Istrlen' function correctly processes the situation when is is passed a null pointer: "If lpString is NULL, the function returns 0".
If we just replace 'lstrlen' with 'strlen', then the program can start working incorrectly. That's why usually it's not recommended to replace 'Istrlen' with some other function call.
V501. Identical sub-expressions to the left and to the right of 'foo' operator.
The analyzer found a code fragment that most probably has a logic error. There is an operator (<, >, <=, >=, ==, !=, &&, ||, -, /) in the program text to the left and to the right of which there are identical subexpressions.
Consider an example:
if (a.x != 0 && a.x != 0)In this case, the '&&' operator is surrounded by identical subexpressions "a.x != 0" and it allows us to detect an error made through inattention. The correct code that will not look suspicious to the analyzer looks in the following way:
if (a.x != 0 && a.y != 0)Consider another example of an error detected by the analyzer in the code of a real application:
class Foo {
int iChilds[2];
...
bool hasChilds() const { return(iChilds > 0 || iChilds > 0); }
...
}In this case, the code is senseless though it is compiled successfully and without any warnings. Correct code must look as follows:
bool hasChilds() const { return(iChilds[0] > 0 || iChilds[1] > 0);}The analyzer does not generate the warning in all the cases when there are identical subexpressions to the left and to the right of the operator.
The first exception refers to those constructs where the increment operator ++, the decrement operator - or += and -= operator are used. Here is an example taken from a real application:
do {
} while (*++scan == *++match && *++scan == *++match &&
*++scan == *++match && *++scan == *++match &&
*++scan == *++match && *++scan == *++match &&
*++scan == *++match && *++scan == *++match &&
scan < strend);The analyzer considers this code safe.
The second exception refers to comparison of two equal numbers. Programmers often employ this method to disable some program branches. Here is an example:
#if defined(_OPENMP)
#include <omp.h>
#else
#define omp_get_thread_num() 0
...
#endif
...
if (0 == omp_get_thread_num()) {The last exception refers to comparison that uses macros:
#define _WINVER_NT4_ 0x0004
#define _WINVER_95_ 0x0004
...
UINT winver = g_App.m_pPrefs->GetWindowsVersion();
if(winver == _WINVER_95_ || winver == _WINVER_NT4_)You should keep in mind that the analyzer might generate a warning on a correct construct in some cases. For instance, the analyzer does not consider side effects when calling functions:
if (wr.takeChar() == '\0' && wr.takeChar() == '\0')Another example of a false alarm was noticed during unit-tests of some project - in the part of it where the correctness of the overloaded operator '==' was checked:
CHECK(VDStringA() == VDStringA(), true);
CHECK(VDStringA("abc") == VDStringA("abc"), true);The diagnostic message isn't generated if two identical expressions of 'float' or 'double' types are being compared. Such a comparison allows to identify the value as NaN. The example of code implementing the verification of this kind:
bool isnan(double X) { return X != X; }This diagnostic is classified as:
You can look at examples of errors detected by the V501 diagnostic. |
V502. The '?:' operator may not work as expected. The '?:' operator has a lower priority than the 'foo' operator.
The analyzer found a code fragment that most probably has a logic error. The program text has an expression that contains the ternary operator '?:' and might be calculated in a different way than the programmer expects.
The '?:' operator has a lower priority than operators ||, &&, |, ^, &, !=, ==, >=, <=, >, <, >>, <<, -, +, %, /, *. One might forget about it and write an incorrect code like the following one:
bool bAdd = ...;
size_t rightLen = ...;
size_t newTypeLen = rightLen + bAdd ? 1 : 0;Having forgotten that the '+' operator has a higher priority than the '?:' operator, the programmer expects that the code is equivalent to "rightLen + (bAdd ? 1 : 0)". But actually the code is equivalent to the expression "(rightLen + bAdd) ? 1 : 0".
The analyzer diagnoses the probable error by checking:
1) If there is a variable or subexpression of the bool type to the left of the '?:' operator.
2) If this subexpression is compared to / added to / multiplied by... the variable whose type is other than bool.
If these conditions hold, it is highly probable that there is an error in this code and the analyzer will generate the warning message we are discussing.
Here are some other examples of incorrect code:
bool b;
int x, y, z, h;
...
x = y < b ? z : h;
x = y + (z != h) ? 1 : 2;The programmer most likely wanted to have the following correct code:
bool b;
int x, y, z, h;
...
x = y < (b ? z : h);
x = y + ((z != h) ? 1 : 2);If there is a type other than bool to the left of the '?:' operator, the analyzer thinks that the code is written in the C style (where there is no bool) or that it is written using class objects and therefore the analyzer cannot find out if this code is dangerous or not.
Here is an example of correct code in the C style that the analyzer considers correct too:
int conditions1;
int conditions2;
int conditions3;
...
char x = conditions1 + conditions2 + conditions3 ? 'a' : 'b';This diagnostic is classified as:
|
You can look at examples of errors detected by the V502 diagnostic. |
V503. Nonsensical comparison: pointer < 0.
The analyzer found a code fragment that has a nonsensical comparison. It is most probable that this code has a logic error.
Here is an example:
class MyClass {
public:
CObj *Find(const char *name);
...
} Storage;
if (Storage.Find("foo") < 0)
ObjectNotFound();It seems almost incredible that such a code can exist in a program. However, the reason for its appearance might be quite simple. Suppose we have the following code in our program:
class MyClass {
public:
// If the object is not found, the function
// Find() returns -1.
ptrdiff_t Find(const char *name);
CObj *Get(ptrdiff_t index);
...
} Storage;
...
ptrdiff_t index = Storage.Find("ZZ");
if (index >= 0)
Foo(Storage.Get(index));
...
if (Storage.Find("foo") < 0)
ObjectNotFound();This is correct yet not very smart code. During the refactoring process, the MyClass class may be rewritten in the following way:
class MyClass {
public:
CObj *Find(const char *name);
...
} Storage;After this modernization of the class, you should fix all the places in the program which use the Find() function. You cannot miss the first code fragment since it will not be compiled, so it will be certainly fixed:
CObj *obj = Storage.Find("ZZ");
if (obj != nullptr)
Foo(obj);The second code fragment is compiled well and you might miss it easily and therefore make the error we are discussing:
if (Storage.Find("foo") < 0)
ObjectNotFound();This diagnostic is classified as:
|
You can look at examples of errors detected by the V503 diagnostic. |
V504. Semicolon ';' is probably missing after the 'return' keyword.
The analyzer found a code fragment where the semicolon ';' is probably missing.
Here is an example of code that causes generating the V504 diagnostic message:
void Foo();
void Foo2(int *ptr)
{
if (ptr == NULL)
return
Foo();
...
}The programmer intended to terminate the function's operation if the pointer ptr == NULL. But the programmer forgot to write the semicolon ';' after the return operator which causes the call of the Foo() function. The functions Foo() and Foo2() do not return anything and therefore the code is compiled without errors and warnings.
Most probably, the programmer intended to write:
void Foo();
void Foo2(int *ptr)
{
if (ptr == NULL)
return;
Foo();
...
}But if the initial code is still correct, it is better to rewrite it in the following way:
void Foo2(int *ptr)
{
if (ptr == NULL)
{
Foo();
return;
}
...
}The analyzer considers the code safe if the "if" operator is absent or the function call is located in the same line with the "return" operator. You might quite often see such code in programs. Here are examples of safe code:
void CPagerCtrl::RecalcSize()
{
return
(void)::SendMessageW((m_hWnd), (0x1400 + 2), 0, 0);
}
void Trace(unsigned int n, std::string const &s)
{ if (n) return TraceImpl(n, s); Trace0(s); }This diagnostic is classified as:
You can look at examples of errors detected by the V504 diagnostic. |
V505. The 'alloca' function is used inside the loop. This can quickly overflow stack.
The analyzer detected that the 'alloca' function is used inside the loop.
The 'alloca' function allocates memory for a specified buffer inside the frame of the caller function. This memory area is cleared only together with the elimination of this frame at the time of the area's termination.
Here is an example:
void foo ()
{
char *buffer = nullptr;
buffer = (char *) alloca(256); // <= (1)
// using buffer
....
} // <= (2)The example is synthetic, but it clearly demonstrates how the 'alloca' function works. On the line labeled (1), a 256-byte memory block is allocated on the stack frame of the 'foo' function, the stack frame is created when the function is called. The stack frame is destroyed on the line (2) when it returns the control flow to the caller. This releases all the memory allocated for it on the stack and help avoid memory leaks.
However, careless use of this function can lead to a problem. The stack memory of the executable program is restricted, and its overflow must be monitored.
Let's take a look at the example:
void bar(int n)
{
for (size_t i = 0; i < n; ++i)
{
char *buffer = nullptr;
if (buffer = (char*) alloca(256)) // <=
{
// using buffer
....
}
}
}The 'alloca' function is called in a loop. The problem is that the allocated memory is not released between the loop's iterations. At the same time, if the number of 'n' iterations is large enough, the run-time stack may overflow.
In this case, it's quite easy to fix the incorrect code. You can do this by calling the 'alloca' function outside the loop and using 'buffer' repeatedly at every iteration:
void bar(int n)
{
char *buffer = (char*)alloca(256);
for (size_t i = 0; i < n; ++i)
{
// using buffer
....
}
}Here is another example of dangerous code:
// A2W defined in ATL using alloca
#define A2W(lpa) ....
void AtlExample()
{
....
size_t n = ....;
wchar_t** strings = { '\0' };
LPCSTR* pszSrc = { '\0' };
for (size_t i = 0; i < n; ++i)
{
if (wcscmp(strings[i], A2W(pszSrc[i])) == 0) // <=
{
....
}
}
}The 'A2W' macro is defined in the 'ATL' library version 3.0. The 'alloca' function is used in the macro. Whether this code leads to errors or not depends on the length of the processed strings, their number and the size of the available stack. You can fix the dangerous code by using the 'CA2W' class defined in the 'ATL' library version 7.0. Unlike a macro, this class allocates memory on the stack only for small strings – for long ones, memory is allocated via 'malloc'. Moreover, the memory allocated on the stack is released when leaving the scope of the variable declaration. Therefore, the memory is released after the comparison with 'strings[i]'.
The corrected example:
// using ATL 7.0
....
for (size_t i = 0; i < n; ++i)
{
if (wcscmp(strings[i], CA2W(pszSrc[i])) == 0) // <=
{
....
}
}You can read more about the functions of the ATL library in the documentation.
This diagnostic is classified as:
|
You can look at examples of errors detected by the V505 diagnostic. |
V506. Pointer to local variable 'X' is stored outside the scope of this variable. Such a pointer will become invalid.
The analyzer found a potential error related to storing a pointer of a local variable. The warning is generated if the lifetime of an object is less than that of the pointer referring to it.
The first example:
class MyClass
{
size_t *m_p;
void Foo() {
size_t localVar;
...
m_p = &localVar;
}
};In this case, the address of the local variable is saved inside the class into the m_p variable and can be then used by mistake in a different function when the localVar variable is destructed.
The second example:
void Get(float **x)
{
float f;
...
*x = &f;
}The Get() function will return the pointer to the local variable that will not exist by the moment.
This message is similar to V507 message.
This diagnostic is classified as:
|
You can look at examples of errors detected by the V506 diagnostic. |
V507. Pointer to local array 'X' is stored outside the scope of this array. Such a pointer will become invalid.
The analyzer found a potential error related to storing a pointer of a local array. The warning is generated if the lifetime of an array is less than that of the pointer referring to it.
The first example:
class MyClass1
{
int *m_p;
void Foo()
{
int localArray[33];
...
m_p = localArray;
}
};The localArray array is created in the stack and the localArray array will no longer exist after the Foo() function terminates. However, the pointer to this array will be saved in the m_p variable and can be used by mistake, which will cause an error.
The second example:
struct CVariable {
...
char name[64];
};
void CRendererContext::RiGeometryV(int n, char *tokens[])
{
for (i=0;i<n;i++)
{
CVariable var;
if (parseVariable(&var, NULL, tokens[i])) {
tokens[i] = var.name;
}
}In this example, the pointer to the array situated in a variable of the CVariable type is saved in an external array. As a result, the "tokens" array will contain pointers to non-existing objects after the function RiGeometryV terminates.
The V507 warning does not always indicate an error. Below is an abridged code fragment that the analyzer considers dangerous although this code is correct:
png_infop info_ptr = png_create_info_struct(png_ptr);
...
BYTE trans[256];
info_ptr->trans = trans;
...
png_destroy_write_struct(&png_ptr, &info_ptr);In this code, the lifetime of the info_ptr object coincides with the lifetime of trans. The object is created inside png_create_info_struct () and destroyed inside png_destroy_write_struct(). The analyzer cannot make out this case and supposes that the png_ptr object comes from outside. Here is an example where the analyzer could be right:
void Foo()
{
png_infop info_ptr;
info_ptr = GetExternInfoPng();
BYTE trans[256];
info_ptr->trans = trans;
}This message is similar to V506 message.
This diagnostic is classified as:
|
You can look at examples of errors detected by the V507 diagnostic. |
V508. The 'new type(n)' pattern was detected. Probably meant: 'new type[n]'.
The analyzer found code that might contain a misprint and therefore lead to an error. There is only one object of integer type that is dynamically created and initialized. It is highly probable that round brackets are used instead of square brackets by misprint.
Here is an example:
int n;
...
int *P1 = new int(n);Memory is allocated for one object of the int type. It is rather strange. Perhaps the correct code should look like this:
int n;
...
int *P1 = new int[n];The analyzer generates the warning only if memory is allocated for simple types. The argument in the brackets must be of integer type in this case. As a result, the analyzer will not generate the warning on the following correct code:
float f = 1.0f;
float *f2 = new float(f);
MyClass *p = new MyClass(33);This diagnostic is classified as:
V509. Exceptions raised inside noexcept functions must be wrapped in a try..catch block.
In case an exception is thrown in a C++ program stack unwinding begins which causes objects to be destroyed by calling their destructors. If a destructor invoked during stack unwinding throws another exception and that exception propagates outside the destructor the C++ runtime immediately terminates the program by calling terminate() function. Therefore destructors should never let exceptions propagate - each exception thrown within a destructor should be handled in that destructor.
The analyzer found a destructor containing the throw operator outside the try..catch block. Here is an example:
LocalStorage::~LocalStorage()
{
...
if (!FooFree(m_index))
throw Err("FooFree", GetLastError());
...
}This code must be rewritten so that the programmer is informed about the error that has occurred in the destructor without using the exception mechanism. If the error is not crucial, it can be ignored:
LocalStorage::~LocalStorage()
{
try {
...
if (!FooFree(m_index))
throw Err("FooFree", GetLastError());
...
}
catch (...)
{
assert(false);
}
}Exceptions may be thrown when calling the 'new' operator as well. If memory cannot be allocated, the 'bad_alloc' exception will be thrown. For example:
A::~A()
{
...
int *localPointer = new int[MAX_SIZE];
...
}An exception may be thrown when using dynamic_cast<Type> while handling references. If types cannot be cast, the 'bad_cast' exception will be thrown. For example:
B::~B()
{
...
UserType &type = dynamic_cast<UserType&>(baseType);
...
}To fix these errors you should rewrite the code so that 'new' or 'dynamic_cast' are put into the 'try{...}' block.
Also, since C++11, functions can be marked as 'noexcept'. Throwing exceptions from such functions will lead to program termination. The analyzer detects cases where potentially throwing operations are performed in 'noexcept' functions. Here's an example:
int noexceptWithNew() noexcept
{
return *(new int{42});
}The analyzer will issue a warning in this case, since the 'new' operator can potentially raise an exception. The call to 'new' should be wrapped in a 'try..catch' block.
In addition to that, the analyzer detects calls for functions not marked as 'noexcept' from destructors and 'noexcept' functions. This is a potentially dangerous operation, since such functions can throw exceptions. Consider this example:
int allocate_memory()
{
return *(new int{ 42 });
}
int noexceptFunc() noexcept
{
return allocate_memory();
}Here, the analyzer will issue a warning at the line with the 'allocate_memory' function call.
Note that even if a function is not explicitly marked as 'noexcept', but the analyzer doesn't detect any throwing operations in it, the warning will not be issued.
Additional materials on this topic:
- Bjarne Stroustrup's C++ Style and Technique FAQ. Can I throw an exception from a constructor? From a destructor? http://www.stroustrup.com/bs_faq2.html
- Throwing destructors. http://www.kolpackov.net/projects/c++/eh/dtor-1.xhtml
This diagnostic is classified as:
You can look at examples of errors detected by the V509 diagnostic. |
V510. The 'Foo' function receives class-type variable as Nth actual argument. This is unexpected behavior.
A variadic function (a function that uses an ellipsis as the last formal parameter) takes an object of a class type as an actual argument. The argument is a part of an ellipsis, which may indicate a logical error. Only POD types can serve as actual parameters for ellipsis.
POD stands for "Plain Old Data". Starting from C++11, POD types include:
- Scalar types: arithmetic types (integral and floating-point), pointers, pointers to non-static data members or class functions, enumerations ('enum') or 'std::nullptr_t' (can be 'const' / 'volatile'- qualified);
- Class types ('class', 'struct', or 'union') that meet the following requirements:
- Copy/move constructors are trivial (generated by the compiler or noted as '= default');
- Copy/move operators are trivial (generated by the compiler or noted as '= default');
- Have a trivial non-deleted destructor;
- The default constructor is trivial (generated by the compiler or marked as '= default');
- All non-static data members have the same access control ('private', 'protected', or 'public');
- Have no virtual functions or virtual base classes;
- Have no non-static data members of the reference type;
- All the non-static data members and base classes are themselves standard layout types;
- Either have no base classes with non-static data members, or has no non-static data members in the most derived class and at most one base class with non-static data members;
- Have no base classes of the same type as the first non-static data member.
If a non-POD type object is passed to an ellipsis of function as a parameter, it almost always indicates an error in a program. According to the C++11 standard:
Passing a potentially-evaluated argument of class type having a non-trivial copy constructor, a non-trivial move constructor, or a non-trivial destructor, with no corresponding parameter, is conditionally-supported with implementation-defined semantics.
Here is an example of incorrect code:
void bar(size_t count, ...);
void foo()
{
std::string s1 = ....;
std::string s2 = ....;
std::string s3 = ....;
bar(3, s1, s2, s3);
}Starting from C++11, you can use variadic templates to fix the error. They help store the information about the types of passed arguments:
template <typename T, typename ...Ts>
void bar(T &&arg, Ts &&...args);
void foo()
{
std::string s1 = ....;
std::string s2 = ....;
std::string s3 = ....;
bar(s1, s2, s3);
}The analyzer will not generate a warning if the passing of a non-POD type object occurs in an unevaluated context (for example, within 'sizeof' / 'alignof'):
int bar(size_t count, ...);
void foo()
{
auto res = sizeof(bar(2, std::string {}, std::string {}));
}Practically, the diagnostic rule V510 helps detect the errors when passing arguments to formatted IO functions from C:
void foo(const std::wstring &ws)
{
wchar_t buf[100];
swprintf(buf, L"%s", ws);
}Instead of a pointer to a string, the stack gets the contents of the object. This code will generate "abracadabra" in the buffer or cause a program crash.
Here's the correct version of the code:
wchar_t buf[100];
std::wstring ws(L"12345");
swprintf(buf, L"%s", ws.c_str());Instead of printf-like functions in C++, it is recommended to use safer alternatives. For example: 'boost::format', 'fmt::format', 'std::format' (C++20), etc.
Note. The diagnostic rule V510 also considers POD-type objects when passing them to the formatted IO function. Despite the fact that such a forwarding is safe, further work of the function with such arguments may lead to unexpected results.
If false positives from diagnostic rules cause inconvenience, you can suppress them within a specific function. To do that, insert a special type of comment into the code:
//-V:MyPrintf:510Feature of using the CString class from the MFC library
We can see an error similar to the one above in the following code:
void foo()
{
CString s;
CString arg(L"OK");
s.Format(L"Test CString: %s\n", arg);
}The correct version of the code should look like this:
s.Format(L"Test CString: %s\n", arg.GetString());Or, as MSDN suggests, to get a pointer to a string, you can use the explicit cast operator to 'LPCTSTR', implemented in the 'CString' class:
void foo()
{
CString kindOfFruit = "bananas";
int howmany = 25;
printf("You have %d %s\n", howmany, (LPCTSTR)kindOfFruit);
}However, 's.Format(L"Test CString: %s\n", arg);' is also correct, as are the others. More on this topic: "Big Brother helps you".
MFC developers implemented the 'CString' type in a special way so that it can be passed to functions like 'printf' and 'Format'. This is done quite cleverly. If you are interested, you can get acquainted with the implementation of the 'CStringT' class.
So, the analyzer makes an exception for the 'CString' type and considers the following code correct:
void foo()
{
CString s;
CString arg(L"OK");
s.Format(L"Test CString: %s\n", arg);
}This diagnostic is classified as:
|
You can look at examples of errors detected by the V510 diagnostic. |
V511. The sizeof() operator returns pointer size instead of array size.
The 'sizeof' operator returns size of a pointer, not of an array, when the array was passed by value to a function.
There is one specific feature of the language you might easily forget about and make a mistake. Look at the following code fragment:
char A[100];
void Foo(char B[100])
{
}In this code, the A object is an array and the sizeof(A) expression will return value 100.
The B object is simply a pointer. Value 100 in the square brackets indicates to the programmer that he is working with an array of 100 items. But it is not an array of a hundred items which is passed into the function - it is only the pointer. So, the sizeof(B) expression will return value 4 or 8 (the size of the pointer in a 32-bit/64-bit system).
The V511 warning is generated when the size of a pointer is calculated which is passed as an argument in the format "TypeName ArrayName[N]". Such code is most likely to have an error. Look at the sample:
void Foo(float array[3])
{
size_t n = sizeof(array) / sizeof(array[0]);
for (size_t i = 0; i != n; i++)
array[i] = 1.0f;
}The function will not fill the whole array with value 1.0f but only 1 or 2 items depending on the system's capacity.
Win32: sizeof(array) / sizeof(array[0]) = 4/4 = 1.
Win64: sizeof(array) / sizeof(array[0]) = 8/4 = 2.
To avoid such errors, we must explicitly pass the array's size. Here is correct code:
void Foo(float *array, size_t arraySize)
{
for (size_t i = 0; i != arraySize; i++)
array[i] = 1.0f;
}Another way is to use a reference to the array:
void Foo(float (&array)[3])
{
size_t n = sizeof(array) / sizeof(array[0]);
for (size_t i = 0; i != n; i++)
array[i] = 1.0f;
}This diagnostic is classified as:
|
You can look at examples of errors detected by the V511 diagnostic. |
V512. Call of the 'Foo' function will lead to buffer overflow.
- The compatibility with the previous versions
- Work with unknown values of arguments to format strings
- Note regarding the 'strncpy' function
The analyzer has detected a potential error related to filling, copying or comparing memory buffers. The error can lead to butter overflow.
Note: previously this diagnostic rule contained some additional functionality, but afterwards we decided to transfer this functionality into a separate diagnostic V1086. You can read more about the causes and consequences of this decision in the special note.
This is a common type of errors caused, for example, by typos or inattention. As a result, memory occupied by other data can be read or written to. Attackers can exploit this error to execute malicious program code, read sensitive information, or cause the operating system to crash. The specific trouble with this kind of errors is that the program can work stably for a long time.
Let's look at the example N1.
#define BYTES_COUNT 5
struct Example
{
unsigned char id[BYTES_COUNT];
unsigned char extended[BYTES_COUNT - 2];
unsigned char data[20];
};
void ClearID(Example *data)
{
memset(&data->id, 0, BYTES_COUNT);
memset(&data->extended, 0, BYTES_COUNT);
}In this example a pointer to an object of the 'Example' type is passed to the 'ClearID' function. Within the function, the 'id' and 'extended' fields are cleared with the 'memset' function. Careless use of the 'BYTES_COUNT' macro will cause the buffer overflow when you clear the 'extended' field. This will result in rewriting the adjacent 'data' field.
Similarly, the buffer overflow can be caused by an incorrect type conversion, as in the example N2:
struct MyTime
{
int timestamp;
....
};
MyTime s;
time((time_t*)&s.timestamp);This example, at first glance, does not contain any dangers and will even work properly as long as the size of the 'int' and 'time_t' types matches. The problem will reveal itself if you use the standard library, where the 'time_t' type can be 64-bit. Meanwhile, the 'int' variable has a size of 32 bits.
In this case, if we call the 'time' function, it will write its result to the 'timestamp' variable and also to the memory area next to it. The correct variant:
struct MyTime
{
time_t time;
....
};
MyTime s;
time(&s.time);The compatibility with the previous versions
Previously, this diagnostic rule contained some additional functionality, which has been transferred to the V1086 diagnostic rule. The new one detects cases of a buffer underflow.
Before splitting the V512, you had the ability to fine-tune the diagnostic and disable the irrelevant part of it by using special comments. In order to provide backward compatibility, it's still possible to disable the V512 diagnostic with a special comment:
//-V512_OVERFLOW_OFFYou can add this comment into the header file, included into all the other files. For instance, it can be the "stdafx.h" file. If you add this comment into the "*.cpp" file, it will affect only this particular file.
Since the V512 diagnostic rule now only detects buffer overflows, this comment has become equivalent to a complete disabling of the diagnostic (//-V::512).
Work with unknown values of arguments to format strings
Sometimes the analyzer may not know the exact value of the argument – for example, when it came from function's parameter:
void foo(int someVar)
{
char buf[2];
sprintf(buf, "%d", someVar);
....
}There will be no warning by default. To enable it, use the following comment:
//V_512_WARN_ON_UNKNOWN_FORMAT_ARGSIn this case the analyzer will use the range of values from type of the argument.
Note regarding the 'strncpy' function
Several times customers contacted our support because they thought that the analyzer generates false positive on the following code:
char buf[5];
strncpy(buf, "X", 100);It may seem that the function has to copy only 2 bytes (the 'X' character and the terminal null). But in fact, an array overrun will occur here. And the reason for this is the important property of the 'strncpy' function:
If, after copying the terminating null character from source string, count (the third argument of the function) is not reached, additional null characters are written to destination string until the total of count characters have been written.
For more details about this or other properties of the 'strncpy' function, see cppreference.
This diagnostic is classified as:
You can look at examples of errors detected by the V512 diagnostic. |
V513. Use _beginthreadex/_endthreadex functions instead of CreateThread/ExitThread functions.
A use of the CreateThread function or ExitThread function is detected in a program. If CRT (C run-time library) functions are used in concurrent threads, you should call the functions _beginthreadex/_endthreadex instead of CreateThread/ExitThread.
Below is an extract from the 6-th chapter of the book "Advanced Windows: creating efficient Win32-applications considering the specifics of the 64-bit Windows" by Jeffrey Richter / 4-th issue.
"CreateThread is a Windows-function creating a thread. But never call it if you write your code in C/C++. You should use the function _beginthreadex from the Visual C++ library instead.
To make multi-threaded applications using C/C++ (CRT) library work correctly, you should create a special data structure and link it to every thread from which the library functions are called. Moreover, they must know that when you address them, they must look through this data block in the master thread in order not to damage data in some other thread.
So how does the system know that it must create this data block together with creating a new thread? The answer is very simple - it doesn't know and never will like to. Only you are fully responsible for it. If you use functions which are unsafe in multi-threaded environment, you should create threads with the library function _beginthreadex and not Windows-function CreateThread.
Note that the _beginthreadex function exists only in multi-threaded versions of the C/C++ library. When linking a project to a single-threaded library, the linker will generate an error message "unresolved external symbol". Of course, it is done intentionally since the single-threaded library cannot work correctly in a multi-threaded application. Note also that Visual Studio chooses the single-threaded library by default when creating a new project. This way is not the safest one, so you should choose yourself one of the multi-threaded versions of the C/C++ library for multi-threaded applications."
Correspondingly, you must use the function _endthreadex to destruct a thread created with the function _beginthreadex.
Additional materials on this topic:
- Discussion at Stack Overflow. "Windows threading: _beginthread vs _beginthreadex vs CreateThread C++". http://stackoverflow.com/questions/331536/windows-threading-beginthread-vs-beginthreadex-vs-createthread-c
- Discussion at CodeGuru Forum. "_beginthread vs CreateThread". http://forums.codeguru.com/showthread.php?371305.html
- Discussion at MSDN forum. "CreateThread vs _beginthreadex". https://social.msdn.microsoft.com/Forums/vstudio/en-US/c727ae29-5a7a-42b6-ad0b-f6b21c1180b2/createthread-vs-beginthreadex?forum=vclanguage
This diagnostic is classified as:
|
You can look at examples of errors detected by the V513 diagnostic. |
V514. Potential logical error. Size of a pointer is divided by another value.
The analyzer found a potential error related to division of the pointer's size by some value. Division of the pointer's size is rather a strange operation since it has no practical sense and most likely indicates an error or misprint in code.
Consider an example:
const size_t StrLen = 16;
LPTSTR dest = new TCHAR[StrLen];
TCHAR src[StrLen] = _T("string for V514");
_tcsncpy(dest, src, sizeof(dest)/sizeof(dest[0]));In the "sizeof(dest)/sizeof(dest[0])" expression, the pointer's size is divided by the size of the element the pointer refers to. As a result, we might get different numbers of copied bytes depending on sizes of the pointer and TCHAR type - but never the number the programmer expected.
Taking into account that the _tcsncpy function is unsafe in itself, correct and safer code may look in the following way:
const size_t StrLen = 16;
LPTSTR dest = new TCHAR[StrLen];
TCHAR src[StrLen] = _T("string for V514");
_tcsncpy_s(dest, StrLen, src, StrLen);This diagnostic is classified as:
|
You can look at examples of errors detected by the V514 diagnostic. |
V515. The 'delete' operator is applied to non-pointer.
In code, the delete operator is applied to a class object instead of the pointer. It is most likely to be an error.
Consider a code sample:
CString str;
...
delete str;The 'delete' operator can be applied to an object of the CString type since the CString class can be automatically cast to the pointer. Such code might cause an exception or unexpected program behavior.
Correct code might look so:
CString *pstr = new CString;
...
delete pstr;In some cases, applying the 'delete' operator to class objects is not an error. You may encounter such code, for instance, when working with the QT::QbasicAtomicPointer class. The analyzer ignores calls of the 'delete' operator to objects of this type. If you know other similar classes it is a normal practice to apply the 'delete' operator to, please tell us about them. We will add them into exceptions.
This diagnostic is classified as:
|
V516. Non-null function pointer is compared to null. Consider inspecting the expression.
Code contains a construct comparing a non-null pointer to a function with null. It is most probably that there is a misprint in code – parentheses are missing.
Consider this example:
int Foo();
void Use()
{
if (Foo == 0)
{
//...
}
}The condition "Foo == 0" is meaningless. The address of the 'Foo' function never equals zero, so the comparison result will always be 'false'. In the code we consider, the programmer missed parentheses by accident. This is the correct version of the code:
if (Foo() == 0)
{
//...
}If there is an explicit taking of address, the code is considered correct. For example:
int Foo();
void Use()
{
if (&Foo != NULL)
//...
}This diagnostic is classified as:
You can look at examples of errors detected by the V516 diagnostic. |
V517. Potential logical error. The 'if (A) {...} else if (A) {...}' pattern was detected.
The analyzer detected a possible error in a construct consisting of conditional statements.
Consider the sample:
if (a == 1)
Foo1();
else if (a == 2)
Foo2();
else if (a == 1)
Foo3();In this sample, the 'Foo3()' function will never get control. Most likely, we deal with a logical error and the correct code should look as follows:
if (a == 1)
Foo1();
else if (a == 2)
Foo2();
else if (a == 3)
Foo3()In practice, such an error might look in the following way:
if (radius < THRESH * 5)
*yOut = THRESH * 10 / radius;
else if (radius < THRESH * 5)
*yOut = -3.0f / (THRESH * 5.0f) * (radius - THRESH * 5.0f) + 3.0f;
else
*yOut = 0.0f;It is difficult to say how a correct comparison condition must look, but the error in this code is evident.
This diagnostic is classified as:
|
You can look at examples of errors detected by the V517 diagnostic. |
V518. The 'malloc' function allocates suspicious amount of memory calculated by 'strlen(expr)'. Perhaps the correct expression is strlen(expr) + 1.
The analyzer found a potential error related to allocating insufficient amount of memory. The string's length is calculated in code and the memory buffer of a corresponding size is allocated but the terminal '\0' is not allowed for.
Consider this example:
char *p = (char *)malloc(strlen(src));
strcpy(p, src);In this case, it is just +1 which is missing. The correct version is:
char *p = (char *)malloc(strlen(src) + 1);
strcpy(p, src);Here is another example of incorrect code detected by the analyzer in one application:
if((t=(char *)realloc(next->name, strlen(name+1))))
{
next->name=t;
strcpy(next->name,name);
}The programmer was inattentive and made a mistake when writing the right bracket ')'. As a result, we will allocate 2 bytes less memory than necessary. This is the correct code:
if((t=(char *)realloc(next->name, strlen(name)+1)))This diagnostic is classified as:
|
You can look at examples of errors detected by the V518 diagnostic. |
V519. The 'x' variable is assigned values twice successively. Perhaps this is a mistake.
The analyzer detected a potential error related to assignment of a value two times successively to the same variable while the variable itself is not used between these assignments.
Consider this sample:
A = GetA();
A = GetB();The fact that the 'A' variable is assigned values twice might signal an error. Most probably, the code should look this way:
A = GetA();
B = GetB();If the variable is used between assignments, the analyzer considers this code correct:
A = 1;
A = A + 1;
A = Foo(A);Let's see how such an error may look in practice. The following sample is taken from a real application where a user class CSize is implemented:
class CSize : public SIZE
{
...
CSize(POINT pt) { cx = pt.x; cx = pt.y; }The correct version is the following:
CSize(POINT pt) { cx = pt.x; cy = pt.y; }Let's study one more example. The second line was written for the purpose of debugging or checking how text of a different color would look. And it seems that the programmer forgot to remove the second line then:
m_clrSample = GetSysColor(COLOR_WINDOWTEXT);
m_clrSample = RGB(60,0,0);Sometimes the analyzer generates false alarms when writing into variables is used for the purpose of debugging. Here is an example of such code:
status = Foo1();
status = Foo2();In this case, we may suppress false alarms using the "//-V519" comment. We may also remove meaningless assignments from the code. And the last thing. Perhaps this code is still incorrect, so we have to check the value of the 'status' variable.
This diagnostic is classified as:
|
You can look at examples of errors detected by the V519 diagnostic. |
V520. Comma operator ',' in array index expression.
The analyzer found a potential error that may be caused by a misprint. An expression containing the ',' operator is used as an index for an array.
Here is a sample of suspicious code:
float **array_2D;
array_2D[getx() , gety()] = 0;Most probably, it was meant to be:
array_2D[ getx() ][ gety() ] = 0;Such errors might appear if the programmer worked earlier with a programming language where array indexes are separated by commas.
Let's look at a sample of an error found by the analyzer in one project:
float **m;
TextOutput &t = ...
...
t.printf("%10.5f, %10.5f, %10.5f,\n%10.5f, %10.5f, %10.5f,\n%10.5f,
%10.5f, %10.5f)",
m[0, 0], m[0, 1], m[0, 2],
m[1, 0], m[1, 1], m[1, 2],
m[2, 0], m[2, 1], m[2, 2]);Since the printf function of the TextOutput class works with a variable number of arguments, it cannot check whether pointers will be passed to it instead of values of the float type. As a result, we will get rubbish displayed instead of matrix items' values. This is the correct code:
t.printf("%10.5f, %10.5f, %10.5f,\n%10.5f, %10.5f, %10.5f,\n%10.5f,
%10.5f, %10.5f)",
m[0][0], m[0][1], m[0][2],
m[1][0], m[1][1], m[1][2],
m[2][0], m[2][1], m[2][2]);This diagnostic is classified as:
|
You can look at examples of errors detected by the V520 diagnostic. |
V521. Expressions that use comma operator ',' are dangerous. Make sure the expression is correct.
The comma operator ',' is used to execute expressions to the both sides of it in the left-to-right order and get the value of the right expression.
The analyzer found an expression in code that uses the ',' operator in a suspicious way. It is highly probable that the program text contains a misprint.
Consider the following sample:
float Foo()
{
double A;
A = 1,23;
float f = 10.0f;
return 3,f;
}In this code, the A variable will be assigned value 1 instead of 1.23. According to C/C++ rules, the "A = 1,23" expression equals "(A = 1),23". Also, the Foo() function will return value 10.0f instead of 3.0f. In the both cases, the error is related to using the ',' character instead of the '.' character.
This is the corrected version:
float Foo()
{
double A;
A = 1.23;
float f = 10.0f;
return 3.f;
}Note. There were cases when the analyzer could not make out the code and generated V521 warnings for absolutely safe constructs. It is usually related to usage of template classes or complex macros. If you noted such a false alarm when working with the analyzer, please tell the developers about it. To suppress false alarms, you may use the comment of the "//-V521" type.
This diagnostic is classified as:
|
You can look at examples of errors detected by the V521 diagnostic. |
V522. Possible null pointer dereference.
The analyzer detected a fragment of code that might cause using a null pointer.
Let's study several examples the analyzer generates the V522 diagnostic message for:
if (pointer != 0 || pointer->m_a) { ... }
if (pointer == 0 && pointer->x()) { ... }
if (array == 0 && array[3]) { ... }
if (!pointer && pointer->x()) { ... }In all the conditions, there is a logical error that leads to dereferencing of the null pointer. The error may be introduced into the code during code refactoring or through a misprint.
Correct versions:
if (pointer == 0 || pointer->m_a) { ... }
if (pointer != 0 && pointer->x()) { ... }
if (array != 0 && array[3]) { ... }
if (pointer && pointer->x()) { ... }These are simple cases, of course. In practice, operations of pointer check and pointer use may be located in different places. If the analyzer generates the V522 warning, study the code above and try to understand why the pointer might be a null pointer.
Here is a code sample where pointer check and pointer use are in different strings
if (ptag == NULL) {
SysPrintf("SPR1 Tag BUSERR\n");
psHu32(DMAC_STAT)|= 1<<15;
spr1->chcr = ( spr1->chcr & 0xFFFF ) |
( (*ptag) & 0xFFFF0000 );
return;
}The analyzer will warn you about the danger in the "( (*ptag) & 0xFFFF0000 )" string. It's either an incorrectly written condition here or there should be a different variable instead of 'ptag'.
Sometimes programmers deliberately use null pointer dereferencing for the testing purpose. For example, analyzer will produce the warning for those places that contain this macro:
/// This generate a coredump when we need a
/// method to be compiled but not usabled.
#define elxFIXME { char * p=0; *p=0; }Extraneous warnings can be turned off by using the "//-V522" comment in those strings that contain the 'elxFIXME' macro. Or, as an alternative, you can write a comment of a special kind beside the macro:
//-V:elxFIXME:522The comment can be written both before and after the macro - it doesn't matter. To learn more about methods of suppressing false positives, follow here.
malloc, realloc
Programmers often don't preliminarily check the pointer returned by the 'malloc' or similar functions. This omission often results in a warning. Some programmers believe that it is not necessary to check the pointer. If a programmer gets a memory allocation error, the program is no longer functional anyway. So it is an acceptable scenario when a program crashes due to the null pointer.
However, everything is much more complicated and dangerous than it may seem at first glance. We suggest reading the article: "Why it is important to check what the malloc function returned".
If you still do not plan to check such pointers, keep reading to find out about the specialized analyzer configuration.
Additional Settings
This diagnostic relies on information about whether a particular pointer could be null. In some cases, this information is retrieved from the table of annotated functions, which is stored inside the analyzer itself.
'malloc' is one of such functions. Since it can return 'NULL', using the pointer returned by it without a prior check may result in null pointer dereferencing.
Sometimes our users wish to change the analyzer's behavior and make it think that 'malloc' cannot return 'NULL'. For example, to do that, they use the system libraries, where 'out of memory' errors are handled in a specific way.
They may also want to tell the analyzer that a certain function can return a null pointer.
In that case, you can use the additional settings, described in the section "How to tell the analyzer that a function can or cannot return nullptr".
This diagnostic is classified as:
You can look at examples of errors detected by the V522 diagnostic. |
V523. The 'then' statement is equivalent to the 'else' statement.
The analyzer found a case when the true and false statements of the 'if' operator coincide completely. This often signals a logical error.
Here is an example:
if (X)
Foo_A();
else
Foo_A();Whether the X condition is false or true, the Foo_A() function will be called anyway.
This is the correct version of the code:
if (X)
Foo_A();
else
Foo_B();Here is an example of such an error taken from a real application:
if (!_isVertical)
Flags |= DT_BOTTOM;
else
Flags |= DT_BOTTOM;Presence of two empty statements is considered correct and safe. You might often see such constructs when using macros. This is a sample of safe code:
if (exp) {
} else {
}Also the analyzer thinks that it is suspicious, if the 'if' statement does not contain the 'else' block, and the code written next is identical to the conditional statement block. At the same time, this code block ends with a return, break, etc.
Suspicious code snippet:
if (X)
{
doSomething();
Foo_A();
return;
}
doSomething();
Foo_A();
return;Perhaps the programmer forgot to edit the copied code fragment or wrote excessive code.
This diagnostic is classified as:
You can look at examples of errors detected by the V523 diagnostic. |
V524. It is suspicious that the body of 'Foo_1' function is fully equivalent to the body of 'Foo_2' function.
This warning is generated when the analyzer detects two functions implemented in the same way. Presence of two identical functions is not an error in itself but you should study them.
The sense of such diagnosis is detecting the following type of errors:
class Point
{
...
float GetX() { return m_x; }
float GetY() { return m_x; }
};The misprint in the code causes the two functions different in sense to perform the same actions. This is the correct version:
float GetX() { return m_x; }
float GetY() { return m_y; }Identity of the bodies of functions GetX() and GetY() in this sample obviously signals an error. However, the percentage of false alarms will be too great if the analyzer generates warnings for all identical functions, so it is guided by a range of exceptions when it must not warn the programmer about identical function bodies. Here are some of them:
- The analyzer does not report about identity of functions' bodies if they do not use variables except for arguments. For example: "bool IsXYZ() { return true; }".
- Functions use static objects and therefore have different inner states. For example: "int Get() { static int x = 1; return x++; }"
- Functions are type cast operators.
- Functions with identical bodies are repeated more than twice.
- And so on.
However, in some cases the analyzer cannot understand that identical function bodies are not an error. This is code which is diagnosed as dangerous but really it is not:
PolynomialMod2 Plus(const PolynomialMod2 &b) const
{return Xor(b);}
PolynomialMod2 Minus(const PolynomialMod2 &b) const
{return Xor(b);}You can suppress false alarms using several methods. If false alarms refer to files of external libraries, you may add this library (i.e. its path) to exceptions. If false alarms refer to your own code, you may use the comment of the "//-V524" type to suppress false warnings. If there are too many false alarms, you may completely disable this diagnosis in the analyzer's settings. You may also modify the code so that one function calls another with the same code.
The last method is often the best since it, first, reduces the amount of code and, second, makes it easier to support. You need to edit only one function instead of the both functions. This is a sample of real code where the programmer could benefit from calling one function from another:
static void PreSave(void) {
int x;
for(x=0;x<TotalSides;x++) {
int b;
for(b=0; b<65500; b++)
diskdata[x][b] ^= diskdatao[x][b];
}
}
static void PostSave (void) {
int x;
for(x=0;x<TotalSides;x++) {
int b;
for(b=0; b<65500; b++)
diskdata[x][b] ^= diskdatao[x][b];
}
}This code should be replaced with the following:
static void PreSave(void) {
int x;
for(x=0;x<TotalSides;x++) {
int b;
for(b=0; b<65500; b++)
diskdata[x][b] ^= diskdatao[x][b];
}
}
static void PostSave (void) {
PreSave();
}We did not fix the error in this sample, but the V524 warning disappeared after refactoring and the code got simpler.
You can look at examples of errors detected by the V524 diagnostic. |
V525. Code contains collection of similar blocks. Check items X, Y, Z, ... in lines N1, N2, N3, ...
The analyzer detected code that might contain a misprint. This code can be split into smaller similar fragments. Although they look similar, they differ in some way. It is highly probable that this code was created with the Copy-Paste method. The V525 message is generated if the analyzer suspects that some element was not fixed in the copied text. The error might be located in one of the lines whose numbers are listed in the V525 message.
Disadvantages of the V525 message:
1) This diagnostic rule is based on heuristic methods and often produces false alarms.
2) Implementation of the rule's heuristic algorithm is complicated and occupies more than 1000 lines of C++ code. That is why it is difficult to describe in documentation. So it may be hard for the user to understand why the V525 message was generated.
3) The diagnostic message refers not to one line but several lines. The analyzer cannot point out only one line since the error may be in any of them.
Advantages of the V525 message:
1) It can detect errors which are too hard to notice during code review.
Let's study an artificial sample at first:
...
float rgba[4];
rgba[0] = object.GetR();
rgba[1] = object.GetG();
rgba[2] = object.GetB();
rgba[3] = object.GetR();The 'rgba' array presents color and transparency of some object. When writing the code that fills the array, we wrote the line "rgba[0] = object.GetR();" at first. Then we copied and changed this line several times. But in the last line, we missed some changes, so it is the 'GetR()' function which is called instead of the 'GetA()' function. The analyzer generates the following warning on this code:
V525: The code containing the collection of similar blocks. Check items 'GetR', 'GetG', 'GetB', 'GetR' in lines 12, 13, 14, 15.
If you review lines 12, 13, 14 and 15, you will find the error. This is the correct code:
rgba[3] = object.GetA();Now let's study several samples taken from real applications. The first sample:
tbb[0].iBitmap = 0;
tbb[0].idCommand = IDC_TB_EXIT;
tbb[0].fsState = TBSTATE_ENABLED;
tbb[0].fsStyle = BTNS_BUTTON;
tbb[0].dwData = 0;
tbb[0].iString = -1;
...
tbb[6].iBitmap = 6;
tbb[6].idCommand = IDC_TB_SETTINGS;
tbb[6].fsState = TBSTATE_ENABLED;
tbb[6].fsStyle = BTNS_BUTTON;
tbb[6].dwData = 0;
tbb[6].iString = -1;
tbb[7].iBitmap = 7;
tbb[7].idCommand = IDC_TB_CALC;
tbb[7].fsState = TBSTATE_ENABLED;
tbb[7].fsStyle = BTNS_BUTTON;
tbb[6].dwData = 0;
tbb[7].iString = -1;The code fragment is far not complete. More than half of it was cut out. The fragment was being written through copying and editing the code. No wonder that an incorrect index was lost in such a large fragment. The analyzer generates the following diagnostic message: "The code containing the collection of similar blocks. Check items '0', '1', '2', '3', '4', '5', '6', '6' in lines 589, 596, 603, 610, 617, 624, 631, 638". If we review these lines, we will find and correct the index '6' repeated twice. This is the correct code:
tbb[7].iBitmap = 7;
tbb[7].idCommand = IDC_TB_CALC;
tbb[7].fsState = TBSTATE_ENABLED;
tbb[7].fsStyle = BTNS_BUTTON;
tbb[7].dwData = 0;
tbb[7].iString = -1;The second sample:
pPopup->EnableMenuItem(
ID_CONTEXT_EDITTEXT,MF_GRAYED|MF_DISABLED|MF_BYCOMMAND);
pPopup->EnableMenuItem(
ID_CONTEXT_CLOSEALL, MF_GRAYED|MF_DISABLED|MF_BYCOMMAND);
pPopup->EnableMenuItem(
ID_CONTEXT_CLOSE, MF_GRAYED|MF_DISABLED|MF_BYCOMMAND);
pPopup->EnableMenuItem(
ID_CONTEXT_SAVELAYOUT, MF_GRAYED|MF_DISABLED|MF_BYCOMMAND);
pPopup->EnableMenuItem(
ID_CONTEXT_RESIZE, MF_GRAYED|MF_DISABLED|MF_BYCOMMAND);
pPopup->EnableMenuItem(
ID_CONTEXT_REFRESH, MF_GRAYED|MF_DISABLED|MF_BYCOMMAND);
pPopup->EnableMenuItem(
ID_CONTEXT_EDITTEXT, MF_GRAYED|MF_DISABLED|MF_BYCOMMAND);
pPopup->EnableMenuItem(
ID_CONTEXT_SAVE, MF_GRAYED|MF_DISABLED|MF_BYCOMMAND);
pPopup->EnableMenuItem(
ID_CONTEXT_EDITIMAGE,MF_GRAYED|MF_DISABLED|MF_BYCOMMAND);
pPopup->EnableMenuItem(
ID_CONTEXT_CLONE,MF_GRAYED|MF_DISABLED|MF_BYCOMMAND);It is very difficult to find an error in this code while reviewing it. But there is an error here: the state of the same menu item 'ID_CONTEXT_EDITTEXT' is modified twice. Let's mark the two repeated lines:
------------------------------
pPopup->EnableMenuItem(
ID_CONTEXT_EDITTEXT,MF_GRAYED|MF_DISABLED|MF_BYCOMMAND);
------------------------------
pPopup->EnableMenuItem(
ID_CONTEXT_CLOSEALL, MF_GRAYED|MF_DISABLED|MF_BYCOMMAND);
pPopup->EnableMenuItem(
ID_CONTEXT_CLOSE, MF_GRAYED|MF_DISABLED|MF_BYCOMMAND);
pPopup->EnableMenuItem(
ID_CONTEXT_SAVELAYOUT, MF_GRAYED|MF_DISABLED|MF_BYCOMMAND);
pPopup->EnableMenuItem(
ID_CONTEXT_RESIZE, MF_GRAYED|MF_DISABLED|MF_BYCOMMAND);
pPopup->EnableMenuItem(
ID_CONTEXT_REFRESH, MF_GRAYED|MF_DISABLED|MF_BYCOMMAND);
------------------------------
pPopup->EnableMenuItem(
ID_CONTEXT_EDITTEXT, MF_GRAYED|MF_DISABLED|MF_BYCOMMAND);
------------------------------
pPopup->EnableMenuItem(
ID_CONTEXT_SAVE, MF_GRAYED|MF_DISABLED|MF_BYCOMMAND);
pPopup->EnableMenuItem(
ID_CONTEXT_EDITIMAGE,MF_GRAYED|MF_DISABLED|MF_BYCOMMAND);
pPopup->EnableMenuItem(
ID_CONTEXT_CLONE,MF_GRAYED|MF_DISABLED|MF_BYCOMMAND);Maybe it is a small error and one of the lines is just unnecessary. Or maybe the programmer forgot to change the state of some other menu item.
Unfortunately, the analyzer often makes a mistake while carrying out this diagnosis and generates false alarms. This is an example of code causing a false alarm:
switch (i) {
case 0: f1 = 2; f2 = 3; break;
case 1: f1 = 0; f2 = 3; break;
case 2: f1 = 1; f2 = 3; break;
case 3: f1 = 1; f2 = 2; break;
case 4: f1 = 2; f2 = 0; break;
case 5: f1 = 0; f2 = 1; break;
}The analyzer does not like a correct column of numbers: 2, 0, 1, 1, 2, 0. In such cases, you may enable the warning suppression mechanism by typing the comment //-V525 in the end of the line:
switch (i) {
case 0: f1 = 2; f2 = 3; break; //-V525
case 1: f1 = 0; f2 = 3; break;
case 2: f1 = 1; f2 = 3; break;
case 3: f1 = 1; f2 = 2; break;
case 4: f1 = 2; f2 = 0; break;
case 5: f1 = 0; f2 = 1; break;
}If there are too many false alarms, you may disable this diagnostic rule in the analyzer's settings. We will also appreciate if you write to our support service about cases when false alarms are generated and we will try to improve the diagnosis algorithm. Please attach corresponding code fragments to your letters.
This diagnostic is classified as:
You can look at examples of errors detected by the V525 diagnostic. |
V526. The 'strcmp' function returns 0 if corresponding strings are equal. Consider inspecting the condition for mistakes.
This message is a kind of recommendation. It rarely diagnoses a logical error but helps make code more readable for young developers.
The analyzer detected a construct comparing two strings that can be written in a clearer way. Such functions as strcmp, strncmp and wcsncmp return 0 if strings identical. It may cause logical errors in program. Look at a code sample:
if (strcmp(s1, s2))This condition will hold if the strings ARE NOT IDENTICAL. Perhaps you remember well what strcmp() returns, but a person who rarely works with string functions might think that the strcmp() function returns the value of type 'bool'. Then he will read this code in this way: "the condition is true if the strings match".
You'd better not save on more characters in the program text and write the code this way:
if (strcmp(s1, s2) != 0)This text tells the programmer that the strcmp() function returns some numeric value, not the bool type. This code ensures that the programmer will understand it properly.
If you do not want to get this diagnostic message, you may disable it in the analyzer settings.
This diagnostic is classified as:
You can look at examples of errors detected by the V526 diagnostic. |
V527. The 'zero' value is assigned to pointer. Probably meant: *ptr = zero.
This error occurs in two similar cases.
1) The analyzer found a potential error: a pointer to bool type is assigned false value. It is highly probable that the pointer dereferencing operation is missing. For example:
float Get(bool *retStatus)
{
...
if (retStatus != nullptr)
retStatus = false;
...
}The '*' operator is missing in this code. The operation of nulling the retStatus pointer will be performed instead of status return. This is the correct code:
if (retStatus != nullptr)
*retStatus = false;2) The analyzer found a potential error: a pointer referring to the char/wchar_t type is assigned value '\0' or L'\0'. It is highly probable that the pointer dereferencing operation is missing. For example:
char *cp;
...
cp = '\0';This is the correct code:
char *cp;
...
*cp = '\0';This diagnostic is classified as:
|
You can look at examples of errors detected by the V527 diagnostic. |
V528. Pointer is compared with 'zero' value. Probably meant: *ptr != zero.
This error occurs in two similar cases.
1) The analyzer found a potential error: a pointer to bool type is compared to false value. It is highly probable that the pointer dereferencing operation is missing. For example:
bool *pState;
...
if (pState != false)
...The '*' operator is missing in this code. As a result, we compare the pState pointer's value to the null pointer. This is the correct code:
bool *pState;
...
if (*pState != false)
...2) The analyzer found a potential error: a pointer to the char/wchar_t type is compared to value '\0' or L'\0'. It is highly probable that the pointer dereferencing operation is missing. For example:
char *cp;
...
if (cp != '\0')This is the correct code:
char *cp;
...
if (*cp != '\0')This diagnostic is classified as:
|
You can look at examples of errors detected by the V528 diagnostic. |
V529. Suspicious semicolon ';' after 'if/for/while' operator.
The analyzer detected a potential error: a semicolon ';' stands after the 'if', 'for' or 'while' operator.
For example:
for (i = 0; i < n; i++);
{
Foo(i);
}This is the correct code:
for (i = 0; i < n; i++)
{
Foo(i);
}Using a semicolon ';' right after the for or while operator is not an error in itself and you may see it quite often in code. So the analyzer eliminates many cases relying on some additional factors. For instance, the following code sample is considered safe:
for (depth = 0, cur = parent; cur; depth++, cur = cur->parent)
;This diagnostic is classified as:
|
You can look at examples of errors detected by the V529 diagnostic. |
V530. Return value of 'Foo' function is required to be used.
Calls of some functions are senseless if their results are not used.
Let's study the first sample:
void VariantValue::Clear()
{
m_vtype = VT_NULL;
m_bvalue = false;
m_ivalue = 0;
m_fvalue = 0;
m_svalue.empty();
m_tvalue = 0;
}This value emptying code is taken from a real application. The error here is the following: by accident, the 'empty' function is called instead of the 'clear' function of the 'std::string' object, and the line's content remains unchanged. The analyzer detects this error relying on knowledge that the result of the 'empty' function must be used. For instance, it must be compared to something or written into a variable.
This is the correct code:
void VariantValue::Clear()
{
m_vtype = VT_NULL;
m_bvalue = false;
m_ivalue = 0;
m_fvalue = 0;
m_svalue.clear();
m_tvalue = 0;
}The second sample:
void unregisterThread() {
Guard<TaskQueue> g(_taskQueue);
std::remove(_threads.begin(), _threads.end(),
ThreadImpl::current());
}The 'std::remove' function does not remove elements from the container. It only shifts the elements and brings the iterator back to the beginning of the trash. Suppose we have the vector<int> container that contains elements 1,2,3,1,2,3,1,2,3. If we execute the code "remove( v.begin(), v.end(), 2 )", the container will contain elements 1,3,1,3,?,?,?, where ? is some trash. The function will bring the iterator back to the first senseless element, so if we want to remove these trash elements, we must write the code this way: "v.erase(remove(v.begin(), v.end(), 2), v.end())".
As you may see from this explanation, the result of 'std::remove' must be used. This is the correct code:
void unregisterThread() {
Guard<TaskQueue> g(_taskQueue);
auto trash = std::remove(_threads.begin(), _threads.end(),
ThreadImpl::current());
_threads.erase(trash, _threads.end());
}There are very many functions whose results must be used. Among them are the following: 'malloc', 'realloc', 'fopen', 'isalpha', 'atof', 'strcmp' and many, many others. An unused result signals an error which is usually caused by a misprint. However, the analyzer warns only about errors related to using the standard library. There are two reasons for that:
1) It is much more difficult to make a mistake by not using the result of the 'fopen' function than confuse 'std::clear' and 'std::empty' .
2) This functionality duplicates the capabilities of Code Analysis for C/C++ included into some Visual Studio editions (see warning C6031). But these warnings are not implemented in Visual Studio for standard library functions.
If you want to propose extending the list of functions supported by analyzer, contact our support service. We will appreciate if you give interesting samples and advice.
Security
In addition to straightforward bugs and typos, security is another area to be taken into account. There are functions that deal with access control, such as LogonUser and SetThreadToken, but there are many more. One must always check on the statuses returned by these functions. Not using these return values is a grave mistake and potential vulnerability - this is why the analyzer issues warning V530 for such functions as well.
Additional features
You can specify the names of user functions for which it should be checked if their return values are used.
To enable this option, you need to use custom annotations. Insert a special comment near the function prototype (or in the common header file), for example:
//+V530, function: MyNamespace::MyClass::MyFunc
namespace MyNamespace {
class MyClass {
int MyFunc();
}
....
obj.MyFunc(); // warning V530
}Format:
- The 'function' key specifies the full name of the function, which consists of the namespace name, the class name, and the function name. Nested namespaces and nested classes are supported.
In projects with special quality requirements, you might need to find all functions, the return value of which is not used. To do this, you can use the 'RET_USE_ALL' custom annotation. If you want to know more, read the documentation for custom annotations.
Note. Custom annotations are not applied to virtual functions by default. You can read about how to enable this feature here.
This diagnostic is classified as:
|
You can look at examples of errors detected by the V530 diagnostic. |
V531. The sizeof() operator is multiplied by sizeof(). Consider inspecting the expression.
Code where a value returned by the sizeof() operator is multiplied by another sizeof() operator most always signals an error. It is unreasonable to multiply the size of one object by the size of another object. Such errors usually occur when working with strings.
Let's study a real code sample:
TCHAR szTemp[256];
DWORD dwLen =
::LoadString(hInstDll, dwID, szTemp,
sizeof(szTemp) * sizeof(TCHAR));The LoadString function takes the buffer's size in characters as the last argument. In the Unicode version of the application, we will tell the function that the buffer's size is larger than it is actually. This may cause a buffer overflow. Note that if we fix the code in the following way, it will not become correct at all:
TCHAR szTemp[256];
DWORD dwLen =
::LoadString(hInstDll, dwID, szTemp, sizeof(szTemp));Here is a quotation from MSDN on this topic:
"Using this function incorrectly can compromise the security of your application. Incorrect use includes specifying the wrong size in the nBufferMax parameter. For example, if lpBuffer points to a buffer szBuffer which is declared as TCHAR szBuffer[100], then sizeof(szBuffer) gives the size of the buffer in bytes, which could lead to a buffer overflow for the Unicode version of the function. Buffer overflow situations are the cause of many security problems in applications. In this case, using sizeof(szBuffer)/sizeof(TCHAR) or sizeof(szBuffer)/sizeof(szBuffer[0]) would give the proper size of the buffer."
This is the correct code:
TCHAR szTemp[256];
DWORD dwLen =
::LoadString(hInstDll, dwID, szTemp,
sizeof(szTemp) / sizeof(TCHAR));Here is another correct code:
const size_t BUF_LEN = 256;
TCHAR szTemp[BUF_LEN];
DWORD dwLen =
::LoadString(hInstDll, dwID, szTemp, BUF_LEN);This diagnostic is classified as:
|
You can look at examples of errors detected by the V531 diagnostic. |
V532. Consider inspecting the statement of '*pointer++' pattern. Probably meant: '(*pointer)++'.
The analyzer detected a potential error: a pointer dereferencing operation is present in code but the value the pointer refers to is not used in any way.
Let's study this sample:
int *p;
...
*p++;The "*p++" expression performs the following actions. The "p" pointer is incremented by one, but before that a value of the "int" type is fetched from memory. This value is not used in any way, which is strange. It looks as if the dereferencing operation "*" is unnecessary. There are several ways of correcting the code:
1) We may remove the unnecessary dereferencing operation - the "*p++;" expression is equal to "p++;":
int *p;
...
p++;2) If the developer intended to increment the value instead of the pointer, we should write it so:
int *p;
...
(*p)++;If the "*p++" expression's result is used, the analyzer considers the code correct. This is a sample of safe code:
while(*src)
*dest++ = *src++;Let's study a sample taken from a real application:
STDMETHODIMP CCustomAutoComplete::Next(
ULONG celt, LPOLESTR *rgelt, ULONG *pceltFetched)
{
...
if (pceltFetched != NULL)
*pceltFetched++;
...In this case, parentheses are missing. This is the correct code:
if (pceltFetched != NULL)
(*pceltFetched)++;This diagnostic is classified as:
|
You can look at examples of errors detected by the V532 diagnostic. |
V533. It is possible that a wrong variable is incremented inside the 'for' operator. Consider inspecting 'X'.
The analyzer detected a potential error: a variable referring to an outer loop and located inside the 'for' operator is incremented.
This is the simplest form of this error:
for (size_t i = 0; i != 5; i++)
for (size_t j = 0; j != 5; i++)
A[i][j] = 0;It is the 'i' variable which is incremented instead of 'j' in the inner loop. Such an error might be not so visible in a real application. This is the correct code:
for (size_t i = 0; i != 5; i++)
for (size_t j = 0; j != 5; j++)
A[i][j] = 0;This diagnostic is classified as:
|
You can look at examples of errors detected by the V533 diagnostic. |
V534. It is possible that a wrong variable is compared inside the 'for' operator. Consider inspecting 'X'.
The analyzer detected a potential error: a variable referring to an outer loop is used in the condition of the 'for' operator.
This is the simplest form of this error:
for (size_t i = 0; i != 5; i++)
for (size_t j = 0; i != 5; j++)
A[i][j] = 0;It is the comparison 'i != 5' that is performed instead of 'j != 5' in the inner loop. Such an error might be not so visible in a real application. This is the correct code:
for (size_t i = 0; i != 5; i++)
for (size_t j = 0; j != 5; j++)
A[i][j] = 0;This diagnostic is classified as:
|
You can look at examples of errors detected by the V534 diagnostic. |
V535. The 'X' variable is used for this loop and outer loops.
The analyzer detected a potential error: a nested loop is arranged by a variable which is also used in an outer loop.
In a schematic form, this error looks in the following way:
size_t i, j;
for (i = 0; i != 5; i++)
for (i = 0; i != 5; i++)
A[i][j] = 0;Of course, this is an artificial sample, so we may easily see the error, but in a real application, the error might be not so apparent. This is the correct code:
size_t i, j;
for (i = 0; i != 5; i++)
for (j = 0; j != 5; j++)
A[i][j] = 0;Using one variable both for the outer and inner loops is not always a mistake. Consider a sample of correct code the analyzer won't generate the warning for:
for(c = lb; c <= ub; c++)
{
if (!(xlb <= xlat(c) && xlat(c) <= ub))
{
Range * r = new Range(xlb, xlb + 1);
for (c = lb + 1; c <= ub; c++)
r = doUnion(
r, new Range(xlat(c), xlat(c) + 1));
return r;
}
}In this code, the inner loop "for (c = lb + 1; c <= ub; c++)" is arranged by the "c" variable. The outer loop also uses the "c" variable. But there is no error here. After the inner loop is executed, the "return r;" operator will perform exit from the function.
This diagnostic is classified as:
|
You can look at examples of errors detected by the V535 diagnostic. |
V536. Constant value is represented by an octal form.
Using constants in the octal number system is not an error in itself. This system is convenient when handling bits and is used in code that interacts with a network or external devices. However, an average programmer uses this number system rarely and therefore may make a mistake by writing 0 before a number forgetting that it makes this value an octal number.
The analyzer warns about octal constants if there are no other octal constants nearby. Such "single" octal constants are usually errors.
Let's study a sample taken from a real application. It is rather large but it illustrates the sense of the issue very well.
inline
void elxLuminocity(const PixelRGBf& iPixel,
LuminanceCell< PixelRGBf >& oCell)
{
oCell._luminance = 0.2220f*iPixel._red +
0.7067f*iPixel._blue +
0.0713f*iPixel._green;
oCell._pixel = iPixel;
}
inline
void elxLuminocity(const PixelRGBi& iPixel,
LuminanceCell< PixelRGBi >& oCell)
{
oCell._luminance = 2220*iPixel._red +
7067*iPixel._blue +
0713*iPixel._green;
oCell._pixel = iPixel;
}It is hard to find the error while reviewing this code, but it does have an error. The first function elxLuminocity is correct and handles values of the 'float' type. There are the following constants in the code: 0.2220f, 0.7067f, 0.0713f. The second function is similar to the first but it handles integer values. All the integer values are multiplied by 10000. Here are they: 2220, 7067, 0713. The error is that the last constant "0713" is defined in the octal number system and its value is 459, not 713. This is the correct code:
oCell._luminance = 2220*iPixel._red +
7067*iPixel._blue +
713*iPixel._green;As it was said above, the warning of octal constants is generated only if there are no other octal constants nearby. That is why the analyzer considers the following sample safe and does not produce any warnings for it:
static unsigned short bytebit[8] = {
01, 02, 04, 010, 020, 040, 0100, 0200 };This diagnostic is classified as:
|
You can look at examples of errors detected by the V536 diagnostic. |
V537. Potential incorrect use of item 'X'. Consider inspecting the expression.
The analyzer has detected a potential misprint in code related to incorrect use of similar names.
This rule tries to diagnose an error of the following type using the heuristic method:
int x = static_cast<int>(GetX()) * n;
int y = static_cast<int>(GetX()) * n;In the second line, the 'GetX' function is used instead of 'GetY'. This is the correct code:
int x = static_cast<int>(GetX()) * n;
int y = static_cast<int>(GetY()) * n;To detect this suspicious fragment, the analyzer followed this logic: we have a line containing a name that includes the 'x' fragment. Beside it, there is a line that has a similar name with 'y'. But this second line has 'X' as well. Since this condition and some other conditions hold, the construct must be reviewed by the programmer. This code would not be considered dangerous if, for instance, there were no variables 'x' and 'y' to the left. This is a code sample the analyzer ignores:
array[0] = GetX() / 2;
array[1] = GetX() / 2;Unfortunately, this rule often produces false alarms since the analyzer does not know how the program is organized and what the code's purpose is. This is a sample of a false alarm:
halfWidth -= borderWidth + 2;
halfHeight -= borderWidth + 2;The analyzer supposed that the second line must be presented by a different expression, for instance, 'halfHeight -= borderHeight + 2'. But actually there is no error here. The border's size is equal in both vertical and horizontal positions. There is just no 'borderHeight' constant. However, such high-level abstractions are not clear to the analyzer. To suppress this warning, you may type the '//-V537' comment into the code.
You can use another technique to prevent false positives. Below is the code fragment:
bsdf->alpha_x = closure->alpha_x;
bsdf->alpha_y = bsdf->alpha_x;The code is correct. However, it looks suspicious, and not only from the analyzer's viewpoint. The developer who maintains the code will have a hard time understanding it. If you want to assign the same value to 'alpha_x' and 'alpha_y', you can write the following:
bsdf->alpha_y = bsdf->alpha_x = closure->alpha_x;This fragment won't confuse the developer and the analyzer won't issue a warning.
This diagnostic is classified as:
You can look at examples of errors detected by the V537 diagnostic. |
V538. The line contains control character 0x0B (vertical tabulation).
There are ASCII control characters in the program text.
The following character refers to them:
0x0B - LINE TABULATION (vertical tabulation) - Moves the typing point to the next vertical tabulation position. In terminals, this character is usually equivalent to line feed.
Such characters are allowed to be present in program text and such text is successfully compiled in Visual C++. However, these characters must have appeared in the program text by accident and you'd better get rid of them. There are two reasons for that:
1) If such a control character stands in the first lines of a file, the Visual Studio environment cannot understand the file's format and opens it with the Notepad application instead of its own embedded editor.
2) Some external tools working with program texts may incorrectly process files containing the above mentioned control characters.
0x0B characters are invisible in the Visual Studio 2010 editor. To find and delete them in a line, you may open the file in the Notepad application or any other editor that can display such control characters.
You can look at examples of errors detected by the V538 diagnostic. |
V539. Iterators are passed as arguments to 'Foo' function. Consider inspecting the expression.
The analyzer detected code handling containers which is likely to have an error. You should examine this code fragment.
Let's study several samples demonstrating cases when this warning is generated:
Sample 1.
void X(std::vector<int> &X, std::vector<int> &Y)
{
std::for_each (X.begin(), X.end(), SetValue);
std::for_each (Y.begin(), X.end(), SetValue);
}Two arrays are filled with some values in the function. Due to the misprint, the "std::for_each" function, being called for the second time, receives iterators from different containers, which causes an error during program execution. This is the correct code:
std::for_each (X.begin(), X.end(), SetValue);
std::for_each (Y.begin(), Y.end(), SetValue);Sample 2.
std::includes(a.begin(), a.end(), a.begin(), a.end());This code is strange. The programmer most probably intended to process two different chains instead of one. This is the correct code:
std::includes(a.begin(), a.end(), b.begin(), b.end());This diagnostic is classified as:
|
You can look at examples of errors detected by the V539 diagnostic. |
V540. Member 'x' should point to string terminated by two 0 characters.
In Windows API, there are structures where string-pointers must end with a double zero.
For example, such is the lpstrFilter member in the OPENFILENAME structure.
Here is the description of lpstrFilter in MSDN:
"LPCTSTR
A buffer containing pairs of null-terminated filter strings. The last string in the buffer must be terminated by two NULL characters."
It follows from this description that we must add one more zero at the end of the string. For example: lpstrFilter = "All Files\0*.*\0";
However, many programmers forget about this additional zero. This is a sample of incorrect code we found in one application:
lofn.lpstrFilter = L"Equalizer Preset (*.feq)\0*.feq";This code will cause generating rubbish in the filter field in the file dialogue. This is the correct code:
lofn.lpstrFilter = L"Equalizer Preset (*.feq)\0*.feq\0";We added 0 at the end of the string manually while the compiler will add one more zero. Some programmers write this way to make it clearer:
lofn.lpstrFilter = L"Equalizer Preset (*.feq)\0*.feq\0\0";But here we will get three zeroes instead of two. It is unnecessary yet well visible to the programmer.
There are also some other structures besides OPENFILENAME where you might make such mistakes. For instance, the strings lpstrGroupNames and lpstrCardNames in structures OPENCARD_SEARCH_CRITERIA, OPENCARDNAME must end with a double zero too.
This diagnostic is classified as:
|
You can look at examples of errors detected by the V540 diagnostic. |
V541. String is printed into itself. Consider inspecting the expression.
The analyzer detected a potential error: a string gets printed inside itself. This may lead to unexpected results.
Look at this sample:
char s[100] = "test";
sprintf(s, "N = %d, S = %s", 123, s);In this code, the 's' buffer is used simultaneously as a buffer for a new string and as one of the elements making up the text. The programmer intends to get this string:
N = 123, S = test
But actually this code will cause creating the following string:
N = 123, S = N = 123, S =
In other cases, such code can lead not only to the output of incorrect text, but also to the buffer overflow or a program crash. To fix the code, we should use a new buffer to save the result. This is the correct code:
char s1[100] = "test";
char s2[100];
sprintf(s2, "N = %d, S = %s", 123, s1);This diagnostic is classified as:
|
You can look at examples of errors detected by the V541 diagnostic. |
V542. Suspicious type cast: 'Type1' to ' Type2'. Consider inspecting the expression.
The analyzer found a very suspicious explicit type conversion. This type conversion may signal an error. You should review the corresponding code fragment.
For example:
typedef unsigned char Byte;
void Process(wchar_t ch);
void Process(wchar_t *str);
void Foo(Byte *buf, size_t nCount)
{
for (size_t i = 0; i < nCount; ++i)
{
Process((wchar_t *)buf[i]);
}
}There is the Process function that can handle both separate characters and strings. There is also the 'Foo' function which receives a buffer-pointer at the input. This buffer is handled as an array of characters of the wchar_t type. But the code contains an error, so the analyzer warns you that the 'char' type is explicitly cast to the ' wchar_t *' type. The reason is that the "(wchar_t *)buf[i]" expression is equivalent to "(wchar_t *)(buf[i])". A value of the 'char' type is first fetched out of the array and then cast to a pointer. This is the correct code:
Process(((wchar_t *)buf)[i]);However, strange type conversions are not always errors. Consider a sample of safe code taken from a real application:
wchar_t *destStr = new wchar_t[len+1];
...
for (int j = 0 ; j < nbChar ; j++)
{
if (Case == UPPERCASE)
destStr[j] =
(wchar_t)::CharUpperW((LPWSTR)destStr[j]);
...Here you may see an explicit conversion of the 'wchar_t' type to 'LPWSTR' and vice versa. The point is that Windows API and the CharUpperW function can handle an input value both as a pointer and a character. This is the function's prototype:
LPTSTR WINAPI CharUpperW(__inout LPWSTR lpsz);If the high-order part of the pointer is 0, the input value is considered a character. Otherwise, the function processes the string.
The analyzer knows about the CharUpperW function's behavior and considers this code safe. But it may produce a false alarm in some other similar situation.
This diagnostic is classified as:
|
You can look at examples of errors detected by the V542 diagnostic. |
V543. It is suspicious that value 'X' is assigned to the variable 'Y' of HRESULT type.
The analyzer detected a potential error related to handling a variable of the HRESULT type.
HRESULT is a 32-bit value divided into three different fields: severity code, device code and error code. Such special constants as S_OK, E_FAIL, E_ABORT, etc. serve to handle HRESULT-values while the SUCCEEDED and FAILED macros are used to check HRESULT-values.
The V543 warning is generated if the analyzer detects an attempt to write value -1, true or false into a variable of the HRESULT type. Consider this sample:
HRESULT h;
...
if (bExceptionCatched)
{
ShowPluginErrorMessage(pi, errorText);
h = -1;
}Writing of value "-1" is incorrect. If you want to report about some unspecified error, you should use value 0x80004005L (Unspecified failure). This constant and the like are described in "WinError.h". This is the correct code:
if (bExceptionCatched)
{
ShowPluginErrorMessage(pi, errorText);
h = E_FAIL;
}References:
- MSDN. Common HRESULT Values.
- Wikipedia. HRESULT.
This diagnostic is classified as:
You can look at examples of errors detected by the V543 diagnostic. |
V544. It is suspicious that the value 'X' of HRESULT type is compared with 'Y'.
The analyzer detected a potential error related to handling a variable of the HRESULT type.
HRESULT is a 32-bit value divided into three different fields: severity code, device code and error code. Such special constants as S_OK, E_FAIL, E_ABORT, etc. serve to handle HRESULT-values while the SUCCEEDED and FAILED macros are used to check HRESULT-values.
The V544 warning is generated if the analyzer detects an attempt to compare a variable of the HRESULT type to -1, true or false. Consider this sample:
HRESULT hr;
...
if (hr == -1)
{
}Comparison of the variable to "-1" is incorrect. Error codes may differ. For instance, these may be 0x80000002L (Ran out of memory), 0x80004005L (unspecified failure), 0x80070005L (General access denied error) and so on. To check the HRESULT -value in this case, we must use the FAILED macro defined in "WinError.h". This is the correct code:
if (FAILED(hr))
{
}References:
- MSDN. Common HRESULT Values.
- Wikipedia. HRESULT.
This diagnostic is classified as:
V545. Conditional expression of 'if' statement is incorrect for the HRESULT type value 'Foo'. The SUCCEEDED or FAILED macro should be used instead.
The analyzer detected a potential error related to handling a variable of the HRESULT type.
HRESULT is a 32-bit value divided into three different fields: severity code, device code and error code. Such special constants as S_OK, E_FAIL, E_ABORT, etc. serve to handle HRESULT-values while the SUCCEEDED and FAILED macros are used to check HRESULT-values.
The V545 warning is generated if a variable of the HRESULT type is used in the 'if' operator as a bool-variable. Consider this sample:
HRESULT hr;
...
if (hr)
{
}'HRESULT' and 'bool' are two types absolutely different in meaning. This sample of comparison is incorrect. The HRESULT type can have many states including 0L (S_OK), 0x80000002L (Ran out of memory), 0x80004005L (unspecified failure) and so on. Note that the code of the state S_OK is 0.
To check the HRESULT-value, we must use macro SUCCEEDED or FAILED defined in "WinError.h". These are correct versions of code:
if (FAILED(hr))
{
}
if (SUCCEEDED(hr))
{
}References:
- MSDN. Common HRESULT Values.
- Wikipedia. HRESULT.
This diagnostic is classified as:
You can look at examples of errors detected by the V545 diagnostic. |
V546. The 'Foo(Foo)' class member is initialized with itself.
The analyzer detected a misprint in the fragment where a class member is being initialized with itself.
Consider an example of a constructor:
C95(int field) : Field(Field)
{
...
}The names of the parameter and the class member here differ only in one letter. Because of that, the programmer misprinted here causing the 'Field' member to remain uninitialized. This is the correct code:
C95(int field) : Field(field)
{
...
}This diagnostic is classified as:
|
You can look at examples of errors detected by the V546 diagnostic. |
V547. Expression is always true/false.
The analyzer detected a potential error: a condition is always true or false. Such conditions do not always signal an error but still you must review such code fragments.
Consider a code sample:
LRESULT CALLBACK GridProc(HWND hWnd,
UINT message, WPARAM wParam, LPARAM lParam)
{
...
if (wParam<0)
{
BGHS[SelfIndex].rows = 0;
}
else
{
BGHS[SelfIndex].rows = MAX_ROWS;
}
...
}The "BGHS[SelfIndex].rows = 0;" branch here will never be executed because the wParam variable has an unsigned type WPARAM which is defined as "typedef UINT_PTR WPARAM".
Either this code contains a logical error or we may reduce it to one line: "BGHS[SelfIndex].rows = MAX_ROWS;".
Now let's examine a code sample which is correct yet potentially dangerous and contains a meaningless comparison:
unsigned int a = _ttoi(LPCTSTR(str1));
if((0 > a) || (a > 255))
{
return(FALSE);
}The programmer wanted to implement the following algorithm.
1) Convert a string into a number.
2) If the number lies outside the range [0..255], return FALSE.
The error here is in using the 'unsigned' type. If the _ttoi function returns a negative value, it will turn into a large positive value. For instance, value "-3" will become 4294967293. The comparison '0 > a' will always evaluate to false. The program works correctly only because the range of values [0..255] is checked by the 'a > 255' condition.
The analyzer will generate the following warning for this code fragment: "V547 Expression '0 > a' is always false. Unsigned type value is never < 0."
We should correct this fragment this way:
int a = _ttoi(LPCTSTR(str1));
if((0 > a) || (a > 255))
{
return(FALSE);
}Let's consider one special case. The analyzer generates the warning:
V547 Expression 's == "Abcd"' is always false. To compare strings you should use strcmp() function.
for this code:
const char *s = "Abcd";
void Test()
{
if (s == "Abcd")
cout << "TRUE" << endl;
else
cout << "FALSE" << endl;
}But it is not quite true. This code still can print "TRUE" when the 's' variable and Test() function are defined in one module. The compiler does not produce a lot of identical constant strings but uses one string. As a result, the code sometimes seems quite operable. However, you must understand that this code is very bad and you should use special functions for comparison.
Another example:
if (lpszHelpFile != 0)
{
pwzHelpFile = ((_lpa_ex = lpszHelpFile) == 0) ?
0 : Foo(lpszHelpFile);
...
}This code works quite correctly but it is too tangled. The "((_lpa_ex = lpszHelpFile) == 0)" condition is always false, as the lpszHelpFile pointer is always not equal to zero. This code is difficult to read and should be rewritten.
This is the simplified code:
if (lpszHelpFile != 0)
{
_lpa_ex = lpszHelpFile;
pwzHelpFile = Foo(lpszHelpFile);
...
}Another example:
SOCKET csd;
csd = accept(nsd, (struct sockaddr *) &sa_client, &clen);
if (csd < 0)
....The accept function in Visual Studio header files returns a value that has the unsigned SOCKET type. That's why the check 'csd < 0' is invalid since its result is always false. The returned values must be explicitly compared to different constants, for instance, SOCKET_ERROR:
if (csd == SOCKET_ERROR)The analyzer warns you far not of all the conditions which are always false or true. It diagnoses only those cases when an error is highly probable. Let's consider some samples that the analyzer considers absolutely correct:
// 1) Eternal loop
while (true)
{
...
}
// 2) Macro expanded in the Release version
// MY_DEBUG_LOG("X=", x);
0 && ("X=", x);
// 3) assert(false);
if (error) {
assert(false);
return -1;
}Note. Every now and then, we get similar emails where users tell us they don't understand the V547 diagnostic. Let's make things clear. This is the typical scenario described in those emails: "The analyzer issues the warning "Expression 'i == 1' is always true", but it's not actually true. The value of the variable can be not only one but also zero. Perhaps you should fix the diagnostic."
for (int i = 0; i <= 1; i++)
{
if(i == 0)
A();
else if(i == 1) // V547
B();
}Explanation. The warning doesn't say that the value of the 'i' variable is always 1. It says that 'i' equals 1 in a particular line and points this line out.
When executing the check 'if (i == 1)', it is known for sure that the 'i' variable will be equal to 1. There are no other options. This code is of course not necessarily faulty, but it is definitely worth reviewing.
As you can see, the warning for this code is absolutely legal. If you encounter a warning like that, there are two ways to deal with it:
- If it's a bug, fix it.
- If it's not a bug but just an unnecessary check, remove it.
Simplified code:
for (int i = 0; i <= 1; i++)
{
if(i == 0)
A();
else
B();
}If it's an unnecessary check, but you still don't want to change the code, use one of the false positive suppression options.
Let's take a look at another example, this time, related to enumeration types.
enum state_t { STATE_A = 0, STATE_B = 1 }
state_t GetState()
{
if (someFailure)
return (state_t)-1;
return STATE_A;
}
state_t state = GetState();
if (state == STATE_A) // <= V547The author intended to return -1 if something went wrong while running the 'GetState' function.
The analyzer issues the "V547 CWE-571 Expression 'state == SOME_STATE' is always true" warning here. This may seem a false positive since we cannot predict the function's return value. However, the analyzer actually behaves this way due to undefined behavior in the code.
No named constant with the value of -1 is defined inside 'state_t', and the 'return (state_t)-1' statement can actually return any value due to undefined behavior. By the way, in this example, the analyzer warns about undefined behavior by issuing the "V1016 The value '-1' is out of range of enum values. This causes unspecified or undefined behavior" warning in the 'return (state_t)-1' line.
Therefore, since 'return (state_t)-1;' is in fact undefined behavior, the analyzer does not consider -1 a possible return value of the function. From the analyzer's perspective, the 'GetState' function can return only 'STATE_A'. This is the cause of the V547 warning.
In order to correct the issue, we should add a constant indicating an erroneous result to the enumeration:
enum state_t { STATE_ERROR = -1, STATE_A = 0, STATE_B = 1 }
state_t GetState()
{
if (someFailure)
return STATE_ERROR;
return STATE_A;
}Both the V547 and V1016 warnings will now be resolved.
Additional materials on this topic:
- An interesting example, when the V547 warning seems to be strange and incorrect. But if you study this out, it turns out that the code is actually dangerous. Discussion at Stack Overflow: Does PVS-Studio know about Unicode chars?
This diagnostic is classified as:
You can look at examples of errors detected by the V547 diagnostic. |
V548. TYPE X[][] is not equivalent to TYPE **X. Consider inspecting type casting.
The analyzer detected a potential error related to an explicit type conversion. An array defined as "type Array[3][4]" is cast to type "type **". This type conversion is most likely to be meaningless.
Types "type[a][b]" and "type **" are different data structures. Type[a][b] is a single memory area that you can handle as a two-dimensional array. Type ** is an array of pointers referring to some memory areas.
Here is an example:
void Foo(char **names, size_t count)
{
for(size_t i=0; i<count; i++)
printf("%s\n", names[i]);
}
void Foo2()
{
char names[32][32];
...
Foo((char **)names, 32); //Crash
}This is the correct code:
void Foo2()
{
char names[32][32];
...
char *names_p[32];
for(size_t i=0; i<32; i++)
names_p[i] = names[i];
Foo(names_p, 32); //OK
}This diagnostic is classified as:
|
You can look at examples of errors detected by the V548 diagnostic. |
V549. The 'first' argument of 'Foo' function is equal to the 'second' argument.
The analyzer detected a potential error in the program: coincidence of two actual arguments of a function. Passing the same value as two arguments is a normal thing for many functions. But if you deal with such functions as memmove, memcpy, strstr and strncmp, you must check the code.
Here is a sample from a real application:
#define str_cmp(s1, s2) wcscmp(s1, s2)
...
v = abs(str_cmp(a->tdata, a->tdata));The misprint here causes the wcscmp function to perform comparison of a string from itself. This is the correct code:
v = abs(str_cmp(a->tdata, b->tdata));The analyzer generates the warning if the following functions are being handled: memcpy, memmove, memcmp, _memicmp, strstr, strspn, strtok, strcmp, strncmp, wcscmp, _stricmp, wcsncmp, etc. If you found a similar error that analyzer fails to diagnose, please tell us the name of the function that must not take same values as the first and second arguments.
This diagnostic is classified as:
|
You can look at examples of errors detected by the V549 diagnostic. |
V550. Suspicious precise comparison. Consider using a comparison with defined precision: fabs(A - B) < Epsilon or fabs(A - B) > Epsilon.
The analyzer detected a potential error: the == or != operator is used to compare floating point numbers. Precise comparison might often cause an error.
Consider this sample:
double a = 0.5;
if (a == 0.5) //OK
x++;
double b = sin(M_PI / 6.0);
if (b == 0.5) //ERROR
x++;The first comparison 'a == 0.5' is true. The second comparison 'b == 0.5' may be both true and false. The result of the 'b == 0.5' expression depends upon the processor, compiler's version and settings being used. For instance, the 'b' variable's value was 0.49999999999999994 when we used the Visual C++ 2010 compiler. A more correct version of this code looks this way:
double b = sin(M_PI / 6.0);
if (fabs(b - 0.5) < DBL_EPSILON)
x++;In this case, the comparison with error presented by DBL_EPSILON is true because the result of the sin() function lies within the range [-1, 1]. But if we handle values larger than several units, errors like FLT_EPSILON and DBL_EPSILON will be too small. And vice versa, if we handle values like 0.00001, these errors will be too big. Each time you must choose errors adequate to the range of possible values.
Question: how do I compare two double-variables then?
double a = ...;
double b = ...;
if (a == b) // how?
{
}There is no single right answer. In most cases, you may compare two variables of the double type by writing the following code:
if (fabs(a-b) <= DBL_EPSILON * fmax(fabs(a), fabs(b)))
{
}But be careful with this formula - it works only for numbers with the same sign. Besides, if you have a row with many calculations, there is an error constantly accumulating, which might cause the 'DBL_EPSILON' constant to appear a too small value.
Well, can I perform precise comparison of floating point values?
Sometimes, yes. But rather rarely. You may perform such comparison if the values you are comparing are one and the same value in its sense.
Here is a sample where you may use precise comparison:
// -1 - a flag that the variable's value is not set
float val = -1.0f;
if (Foo1())
val = 123.0f;
if (val == -1.0f) //OK
{
}In this case, the comparison with value "-1" is permissible because it is this very value which we used to initialize the variable before.
We cannot cover the topic of comparing float/double types within the scope of documentation, so please refer to additional sources given at the end of this article.
The analyzer can only point to potentially dangerous code fragments where comparison may result unexpectedly. But it is only the programmer who may understand whether these code fragments really contain errors. We cannot also give precise recommendations in the documentation since tasks where floating point types are used are too diverse.
The diagnostic message isn't generated if two identical expressions of 'float' or 'double' types are being compared. Such a comparison allows to identify the value as NaN. The example of code implementing the verification of this kind:
bool isnan(double X) { return X != X; }However, such code can't be called good. It's better to use the 'std::isnan' standard function instead.
References:
- Bruce Dawson. Comparing floating point numbers, 2012 Edition.
- Andrey Karpov. 64-bit programs and floating-point calculations.
- Wikipedia. Floating point.
- CodeGuru Forums. C++ General: How is floating point representated?
- Boost. Floating-point comparison algorithms.
This diagnostic is classified as:
|
You can look at examples of errors detected by the V550 diagnostic. |
V551. Unreachable code under a 'case' label.
The analyzer detected a potential error: one of the switch() operator's branches never gets control. The reason is that the switch() operator's argument cannot accept the value defined in the case operator.
Consider this sample:
char ch = strText[i];
switch (ch)
{
case '<':
strHTML += "<";
bLastCharSpace = FALSE;
nNonbreakChars++;
break;
case '>':
strHTML += ">";
bLastCharSpace = FALSE;
nNonbreakChars++;
break;
case 0xB7:
case 0xBB:
strHTML += ch;
strHTML += "<wbr>";
bLastCharSpace = FALSE;
nNonbreakChars = 0;
break;
...
}The branch following "case 0xB7:" and "case 0xBB:" in this code will never get control. The 'ch' variable has the 'char' type and therefore the range of its values is [-128..127]. The comparisons "ch == 0xB7" and "ch==0xBB" will always be false. To make the code correct, we must cast the 'ch' variable to the 'unsigned char' type:
unsigned char ch = strText[i];
switch (ch)
{
...
case 0xB7:
case 0xBB:
strHTML += ch;
strHTML += "<wbr>";
bLastCharSpace = FALSE;
nNonbreakChars = 0;
break;
...
}This diagnostic is classified as:
|
You can look at examples of errors detected by the V551 diagnostic. |
V552. A bool type variable is incremented. Perhaps another variable should be incremented instead.
The analyzer detected a potentially dangerous construct in code where a variable of the bool type is being incremented.
Consider the following contrived example:
bool bValue = false;
...
bValue++;First, the C++ language's standard reads:
The use of an operand of type bool with the postfix ++ operator is deprecated.
It means that we should not use such a construct.
Second, it is better to assign the 'true' value explicitly to this variable. This code is clearer:
bValue = true;Third, it might be that there is a misprint in the code and the programmer actually intended to increment a different variable. For example:
bool bValue = false;
int iValue = 1;
...
if (bValue)
bValue++;A wrong variable was used by accident here while it was meant to be this code:
bool bValue = false;
int iValue = 1;
...
if (bValue)
iValue++;This diagnostic is classified as:
You can look at examples of errors detected by the V552 diagnostic. |
V553. Length of function body or class declaration is more than 2000 lines. Consider refactoring the code.
The analyzer detected a class definition or function body that occupies more than 2000 lines. This class or function does not necessarily contain errors yet the probability is very high. The larger a function is, the more probable it is to make an error and the more difficult it is to debug. The larger a class is, the more difficult it is to examine its interfaces.
This message is a good opportunity to find time for code refactoring at last. Yes, you always have to do something urgent but the larger you functions and classes are, the more time you will spend on supporting the old code and eliminating errors in it instead of writing a new functionality.
References:
- Steve McConnell, "Code Complete, 2nd Edition" Microsoft Press, Paperback, 2nd edition, Published June 2004, 914 pages, ISBN: 0-7356-1967-0. (Part 7.4. How Long Can a Routine Be?).
V554. Incorrect use of smart pointer.
Analyzer located an issue then the usage of smart pointer could lead to undefined behavior, in particular to the heap damage, abnormal program termination or incomplete objects destruction. The error here is that different methods will be used to allocate and free memory.
Consider a sample:
void Foo()
{
struct A
{
A() { cout << "A()" << endl; }
~A() { cout << "~A()" << endl; }
};
std::unique_ptr<A> p(new A[3]);
}By default, the unique_ptr class uses the 'delete' operator to release memory. That is why only one object of the 'A' class will be destroyed and the following text will be displayed:
A()
A()
A()
~A()To fix this error, we must specify that the class must use the 'delete []' operator. Here is the correct code:
std::unique_ptr<A[]> p(new A[3]);Now the same number of constructors and destructors will be called and we will see this text:
A()
A()
A()
~A()
~A()
~A()Consider another sample:
std::unique_ptr<int []> p((int *)malloc(sizeof(int) * 5));The function 'malloc()' is used to allocate memory while the 'delete []' operator is used to release it. It is incorrect and we must specify that the 'free()' function must be used to release memory. This is the correct code:
int *d =(int *)std::malloc(sizeof(int) * 5);
unique_ptr<int, void (*)(void*)> p(d, std::free);Additional materials on this topic:
- Discussion at Stack Overflow. "How could pairing new[] with delete possibly lead to memory leak only?".
This diagnostic is classified as:
|
You can look at examples of errors detected by the V554 diagnostic. |
V555. Expression of the 'A - B > 0' kind will work as 'A != B'.
The analyzer detected a potential error in an expression of "A - B > 0" type. It is highly probable that the condition is wrong if the "A - B" subexpression has the unsigned type.
The "A - B > 0" condition holds in all the cases when 'A' is not equal to 'B'. It means that we may write the "A != B" expression instead of "A - B > 0". However, the programmer must have intended to implement quite a different thing.
Consider this sample:
unsigned int *B;
...
if (B[i]-70 > 0)The programmer wanted to check whether the i-item of the B array is above 70. He could write it this way: "B[i] > 70". But he, proceeding from some reasons, wrote it this way: "B[i]-70 > 0" and made a mistake. He forgot that items of the 'B' array have the 'unsigned' type. It means that the "B[i]-70" expression has the 'unsigned' type too. So it turns out that the condition is always true except for the case when the 'B[i]' item equals to 70.
Let's clarify this case.
If 'B[i]' is above 70, then "B[i]-70" is above 0.
If 'B[i]' is below 70, then we will get an overflow of the unsigned type and a very large value as a result. Let B[i] == 50. Then "B[i]-70" = 50u - 70u = 0xFFFFFFECu = 4294967276. Surely, 4294967276 > 0.
A demonstration sample:
unsigned A;
A = 10; cout << "A=10 " << (A-70 > 0) << endl;
A = 70; cout << "A=70 " << (A-70 > 0) << endl;
A = 90; cout << "A=90 " << (A-70 > 0) << endl;
// Will be printed
A=10 1
A=70 0
A=90 1The first way to correct the code:
unsigned int *B;
...
if (B[i] > 70)The second way to correct the code:
int *B;
...
if (B[i]-70 > 0)Note that an expression of the "A - B > 0" type far not always signals an error. Consider a sample where the analyzer generates a false alarm:
// Functions GetLength() and GetPosition() return
// value of size_t type.
while ((inStream.GetLength() - inStream.GetPosition()) > 0)
{ ... }GetLength() is always above or equal to GetPosition() here, so the code is correct. To suppress the false alarm, we may add the comment //-V555 or rewrite the code in the following way:
while (inStream.GetLength() != inStream.GetPosition())
{ ... }Here is another case when no error occurs.
__int64 A;
__uint32 B;
...
if (A - B > 0)The "A - B" subexpression here has the signed type __int64 and no error occurs. The analyzer does not generate warnings in such cases.
This diagnostic is classified as:
|
You can look at examples of errors detected by the V555 diagnostic. |
V556. Values of different enum types are compared.
The analyzer detected a potential error: code contains comparison of enum values which have different types.
Consider a sample:
enum ErrorTypeA { E_OK, E_FAIL };
enum ErrorTypeB { E_ERROR, E_SUCCESS };
void Foo(ErrorTypeB status) {
if (status == E_OK)
{ ... }
}The programmer used a wrong name in the comparison by accident, so the program's logic is disrupted. This is the correct code:
void Foo(ErrorTypeB status) {
if (status == E_SUCCESS)
{ ... }
}Comparison of values of different enum types is not necessarily an error, but you must review such code.
This diagnostic is classified as:
|
You can look at examples of errors detected by the V556 diagnostic. |
V557. Possible array overrun.
The analyzer detected a potential memory access outside an array. The most common case is an error occurring when writing the '\0' character after the last array's item.
Let's examine a sample of this error:
struct IT_SAMPLE
{
unsigned char filename[14];
...
};
static int it_riff_dsmf_process_sample(
IT_SAMPLE * sample, const unsigned char * data)
{
memcpy( sample->filename, data, 13 );
sample->filename[ 14 ] = 0;
...
}The last array's item has index 13, not 14. That is why the correct code is this one:
sample->filename[13] = 0;Of course, you'd better use an expression involving the sizeof() operator instead of constant index' value in such cases. However, remember that you may make a mistake in this case too. For example:
typedef wchar_t letter;
letter name[30];
...
name[sizeof(name) - 1] = L'\0';At first sight, the "sizeof(name) - 1" expression is right. But the programmer forgot that he handled the 'wchar_t' type and not 'char'. As a result, the '\0' character is written far outside the array's boundaries. This is the correct code:
name[sizeof(name) / sizeof(*name) - 1] = L'\0';To simplify writing of such constructs, you may use this special macro:
#define str_len(arg) ((sizeof(arg) / sizeof(arg[0])) - 1)
name[str_len(name)] = L'\0';The analyzer detects some errors when the index is represented by a variable whose value might run out of the array's boundaries. For example:
int buff[25];
for (int i=0; i <= 25; i++)
buff[i] = 10;This is the correct code:
int buff[25];
for (int i=0; i < 25; i++)
buff[i] = 10;Note that the analyzer might make mistakes when handling such value ranges and generate false alarms.
This diagnostic is classified as:
You can look at examples of errors detected by the V557 diagnostic. |
V558. Function returns pointer/reference to temporary local object.
The analyzer detected an issue when a function returns a pointer to a local object. This object will be destroyed when leaving the function, so you will not be able to use the pointer to it anymore.
In a most common case, this diagnostic message is generated against the following code:
float *F()
{
float f = 1.0;
return &f;
}Of course, the error would hardly be present in such a form in real code. Let's consider a more real example.
int *Foo()
{
int A[10];
// ...
if (err)
return 0;
int *B = new int[10];
memcpy(B, A, sizeof(A));
return A;
}Here, we handled the temporary array A. On some condition, we must return the pointer to the new array B. But the misprint causes the A array to be returned, which will cause unexpected behavior of the program or crash. This is the correct code:
int *Foo()
{
...
int *B = new int[10];
memcpy(B, A, sizeof(A));
return B;
}This diagnostic is classified as:
|
You can look at examples of errors detected by the V558 diagnostic. |
V559. Suspicious assignment inside the conditional expression of 'if/while/for' statement.
The analyzer detected an issue that has to do with using the assignment operator '=' in the conditional expression of an 'if' or 'while' statement. Such a construct usually indicates the presence of a mistake. It is very likely that the programmer intended to use the '==' operator instead of '='.
Consider the following example:
const int MAX_X = 100;
int x;
...
if (x = MAX_X)
{ ... }There is a typo in this code: the value of the 'x' variable will be modified instead of being compared with the constant MAX_X:
if (x == MAX_X)
{ ... }Using assignments inside conditions is not always an error, of course. This technique is used by many programmers to make code shorter. However, it is a bad style because it takes a long time to find out if such a construct results from a typo or the programmer's intention to make the code shorter.
Instead of using assignments inside conditional expressions, we recommend implementing them as a separate operation or enclosing them in additional parentheses:
while ((x = Foo()))
{
...
}Code like this will be interpreted by both the analyzer and most compilers as correct. Besides, it tells other programmers that there is no error here.
This diagnostic is classified as:
|
You can look at examples of errors detected by the V559 diagnostic. |
V560. Part of conditional expression is always true/false.
The analyzer detected a potential error inside a logical condition. A part of a logical condition is always true and therefore is considered dangerous.
Consider this sample:
#define REO_INPLACEACTIVE (0x02000000L)
...
if (reObj.dwFlags && REO_INPLACEACTIVE)
m_pRichEditOle->InPlaceDeactivate();The programmer wanted to check some particular bit in the dwFlags variable. But he made a misprint by writing the '&&' operator instead of '&' operator. This is the correct code:
if (reObj.dwFlags & REO_INPLACEACTIVE)
m_pRichEditOle->InPlaceDeactivate();Let's examine another sample:
if (a = 10 || a == 20)The programmer wrote the assignment operator '=' instead of comparison operator '==' by accident. From the viewpoint of the C++ language, this expression is identical to an expression like "if (a = (10 || a == 20))".
The analyzer considers the "10 || a == 20" expression dangerous because its left part is a constant. This is the correct code:
if (a == 10 || a == 20)Sometimes the V560 warning indicates just a surplus code, not an error. Consider the following sample:
if (!mainmenu) {
if (freeze || winfreeze ||
(mainmenu && gameon) ||
(!gameon && gamestarted))
drawmode = normalmode;
}The analyzer will warn you that the 'mainmenu' variable in the (mainmenu && gameon) subexpression is always equal to 0. It follows from the check above " if (!mainmenu)". This code can be quite correct. But it is surplus and should be simplified. It will make the program clearer to other developers.
This is the simplified code:
if (!mainmenu) {
if (freeze || winfreeze ||
(!gameon && gamestarted))
drawmode = normalmode;
}This is a more interesting case.
int16u Integer = ReadInt16u(Liste);
int32u Exponent=(Integer>>10) & 0xFF;
if (Exponent==0 || Exponent==0xFF) // V560
return 0;The user who sent us this example was puzzled by the analyzer issuing a warning saying that the 'Exponent==0xFF' subexpression was always false. Let's figure this out. To do that, we need to count carefully.
The range of values of 16-bit unsigned variable 'Integer' is [0..0b1111111111111111], i.e. [0..0xFFFF].
Shifting by 10 bits to the right reduces the range: [0..0b111111], i.e. [0..0x3F].
After that, the '& 0xFF' operation is executed.
As a result, there's no way you can get the value '0xFF' - only '0x3F' at most.
Some C++ constructs are considered safe even if a part of an expression inside them is a constant. Here are some samples when the analyzer considers the code safe:
- a subexpression contains operators sizeof(): if (a == b && sizeof(T) < sizeof(__int64)) {};
- an expression is situated inside a macro: assert(false);
- two numerical constants are being compared: if (MY_DEFINE_BITS_COUNT == 4) {};
- etc.
Special settings for the V560 diagnostic
Upon the additional request of our clients, we added the feature to control the behavior of the V560 diagnostic. You may write a special kind of comment in the common header file or in the pvsconfig file:
//+V560 ENABLE_PEDANTIC_WARNINGSThe 'ENABLE_PEDANTIC_WARNINGS' mode weakens the diagnostic exceptions. Code example:
void foo()
{
bool debugCheck = false; // maybe in macros
if (x)
{
if (debugCheck)
{
....
}
}
}By default, the analyzer wouldn't consider such code fragment dangerous, since it is often written for debugging. The comment allows you to weaken the rule exception, so the analyzer can issue a warning here.
This diagnostic is classified as:
You can look at examples of errors detected by the V560 diagnostic. |
V561. Consider assigning value to 'foo' variable instead of declaring it anew.
The analyzer detected a potential error: there is a variable in code which is defined and initialized but not being used further. Besides, there is a variable in the exterior scope which also has the same name and type. It is highly probable that the programmer intended to use an already existing variable instead of defining a new one.
Let's examine this sample:
BOOL ret = TRUE;
if (m_hbitmap)
BOOL ret = picture.SaveToFile(fptr);The programmer defined a new variable 'ret' by accident, which causes the previous variable to always have the TRUE value regardless if the picture is saved into a file successfully or not. This is the correct code:
BOOL ret = TRUE;
if (m_hbitmap)
ret = picture.SaveToFile(fptr);This diagnostic is classified as:
|
You can look at examples of errors detected by the V561 diagnostic. |
V562. Bool type value is compared with value of N. Consider inspecting the expression.
The analyzer detected an issue when a value of the bool type is compared to a number. Most likely, there is an error.
Consider this sample:
if (0 < A < 5)The programmer not familiar with the C++ language well wanted to use this code to check whether the value lies within the range between 0 and 5. Actually, the calculations will be performed in the following sequence: ((0 < A) < 5). The result of the "0 < A" expression has the bool type and therefore is always below 5.
This is the correct code for the check:
if (0 < A && A < 5)The previous example resembles a mistake usually made by students. But even skilled developers are not secure from such errors.
Let's consider another sample:
if (! (fp = fopen(filename, "wb")) == -1) {
perror("opening image file failed");
exit(1);
}Here we have 2 errors of different types at once. First, the "fopen" function returns the pointer and compares the returned value to NULL. The programmer confused the "fopen" function with "open" function, the latter being that very function that returns "-1" if there is an error. Second, the negation operation "!" is executed first and only then the value is compared to "-1". There is no sense in comparing a value of the bool type to "-1" and that is why the analyzer warned us about the code.
This is the correct code:
if ( (fp = fopen(filename, "wb")) == NULL) {
perror("opening image file failed");
exit(1);
}This diagnostic is classified as:
|
You can look at examples of errors detected by the V562 diagnostic. |
V563. An 'else' branch may apply to the previous 'if' statement.
The analyzer detected a potential error in logical conditions: code's logic does not coincide with the code editing.
Consider this sample:
if (X)
if (Y) Foo();
else
z = 1;The code editing disorientates you so it seems that the "z = 1" assignment takes place if X == false. But the 'else' branch refers to the nearest operator 'if'. In other words, this code is actually analogous to the following code:
if (X)
{
if (Y)
Foo();
else
z = 1;
}So, the code does not work the way it seems at first sight.
If you get the V563 warning, it may mean one of the two following things:
1) Your code is badly edited and there is no error actually. In this case you need to edit the code so that it becomes clearer and the V563 warning is not generated. Here is a sample of correct editing:
if (X)
if (Y)
Foo();
else
z = 1;2) A logical error has been found. Then you may correct the code, for instance, this way:
if (X) {
if (Y)
Foo();
} else {
z = 1;
}This diagnostic is classified as:
|
You can look at examples of errors detected by the V563 diagnostic. |
V564. The '&' or '|' operator is applied to bool type value. Check for missing parentheses or use the '&&' or '||' operator.
The analyzer detected a potential error: operators '&' and '|' handle bool-type values. Such expressions are not necessarily errors but they usually signal misprints or condition errors.
Consider this sample:
int a, b;
#define FLAG 0x40
...
if (a & FLAG == b)
{
}This example is a classic one. A programmer may be easily mistaken in operations' priorities. It seems that computing runs in this sequence: "(a & FLAG) == b". But actually it is "a & (FLAG == b)". Most likely, it is an error.
The analyzer will generate a warning here because it is odd to use the '&' operator for variables of int and bool types.
If it turns out that the code does contain an error, you may fix it the following way:
if ((a & FLAG) == b)Of course, the code might appear correct and work as it was intended. But still you'd better rewrite it to make it clearer. Use the && operator or additional brackets:
if (a && FLAG == b)
if (a & (FLAG == b))The V564 warning will not be generated after these corrections are done while the code will get easier to read.
Consider another sample:
#define SVF_CASTAI 0x00000010
if ( !ent->r.svFlags & SVF_CASTAI ) {
...
}Here we have an obvious error. It is the "!ent->r.svFlags" subexpression that will be calculated at first and we will get either true of false. But it does not matter: whether we execute "true & 0x00000010" operation or "false & 0x00000010" operation, the result will be the same. The condition in this sample is always false.
This is the correct code:
if ( ! (ent->r.svFlags & SVF_CASTAI) )Note. The analyzer will not generate the warning if there are bool-type values to the left and to the right of the '&' or '|' operator. Although such code does not look too smart, still it is correct. Here is a code sample the analyzer considers safe:
bool X, Y;
...
if (X | Y)
{ ... }This diagnostic is classified as:
|
You can look at examples of errors detected by the V564 diagnostic. |
V565. Empty exception handler. Silent suppression of exceptions can hide errors in source code during testing.
An exception handler was found that does not do anything.
Consider this code:
try {
...
}
catch (MyExcept &)
{
}Of course, this code is not necessarily incorrect. But it is very odd to suppress an exception by doing nothing. Such exception handling might conceal defects in the program and complicate the testing process.
You must react to exceptions somehow. For instance, you may add "assert(false)" at least:
try {
...
}
catch (MyExcept &)
{
assert(false);
}Programmers sometimes use such constructs to return control from a number of nested loops or recursive functions. But it is bad practice because exceptions are very resource-intensive operations. They must be used according to their intended purpose, i.e. for possible contingencies that must be handled on a higher level.
The only thing where you may simply suppress exceptions is destructors. A destructor must not throw exceptions. But it is often not quite clear what to do with exceptions in destructors and the exception handler might well remain empty. The analyzer does not warn you about empty handlers inside destructors:
CClass::~ CClass()
{
try {
DangerousFreeResource();
}
catch (...) {
}
}This diagnostic is classified as:
You can look at examples of errors detected by the V565 diagnostic. |
V566. Integer constant is converted to pointer. Check for an error or bad coding style.
The analyzer detected an explicit conversion of a numerical value to the pointer type. This warning is usually generated for code fragments where numbers are used for flagging objects' states. Such methods are not necessarily errors but usually signal a bad code design.
Consider this sample:
const DWORD SHELL_VERSION = 0x4110400;
...
char *ptr = (char*) SHELL_VERSION;
...
if (ptr == (char*) SHELL_VERSION)The constant value which marks some special state is saved into the pointer. This code might work well for a long time, but if an object is created by the address 0x4110400, we will not determine if this is a magic flag or just an object. If you want to use a special flag, you'd better write it so:
const DWORD SHELL_VERSION = 0x4110400;
...
char *ptr = (char*)(&SHELL_VERSION);
...
if (ptr == (char*)(&SHELL_VERSION))Note. To make false alarms fewer, the V566 message is not generated for a range of cases. For instance, it does not appear if values -1, 0, 0xcccccccc and 0xdeadbeef are magic numbers; if a number lies within the range between 0 and 65535 and is cast to a string pointer. This enables us to skip correct code fragments like the following one:
CString sMessage( (LPCSTR)IDS_FILE_WAS_CHANGED ) ;This method of loading a string from resources is rather popular but certainly you'd better use MAKEINTRESOURCE. There are some other exceptions as well.
This diagnostic is classified as:
|
V567. Modification of variable is unsequenced relative to another operation on the same variable. This may lead to undefined behavior.
The analyzer detected an expression leading to undefined behavior. A variable is used several times between two sequence points while its value is changing. We cannot predict the result of such an expression. Let's consider the notions "undefined behavior" and "sequence point" in detail.
Undefined behavior is a feature of some programming languages — most famously C/C++. In these languages, to simplify the specification and allow some flexibility in implementation, the specification leaves the results of certain operations specifically undefined.
For example, in C the use of any automatic variable before it has been initialized yields undefined behavior, as do division by zero and indexing an array outside of its defined bounds. This specifically frees the compiler to do whatever is easiest or most efficient, should such a program be submitted. In general, any behavior afterwards is also undefined. In particular, it is never required that the compiler diagnose undefined behavior — therefore, programs invoking undefined behavior may appear to compile and even run without errors at first, only to fail on another system, or even on another date. When an instance of undefined behavior occurs, so far as the language specification is concerned anything could happen, maybe nothing at all.
A sequence point in imperative programming defines any point in a computer program's execution at which it is guaranteed that all side effects of previous evaluations will have been performed, and no side effects from subsequent evaluations have yet been performed. They are often mentioned in reference to C and C++, because the result of some expressions can depend on the order of evaluation of their subexpressions. Adding one or more sequence points is one method of ensuring a consistent result, because this restricts the possible orders of evaluation.
It is worth noting that in C++11, the terms sequenced before/after, sequenced and unsequenced were introduced instead of sequence points. Many expressions, resulting in undefined behavior in C++03, became defined (for instance, i = ++i). These rules were also supplemented in C++14 and C++17. The analyzer issues a false positive regardless of the used standard. The certainty of the expressions of i = ++i type is not an excuse to use them. It is better to rewrite such expressions to make them more understandable. Also if you need to support an earlier standard, you can get a bug that is hardly debugged.
i = ++i + 2; // undefined behavior until C++11
i = i++ + 2; // undefined behavior until C++17
f(i = -2, i = -2); // undefined behavior until C++17
f(++i, ++i); // undefined behavior until C++17,
// unspecified after C++17
i = ++i + i++; // undefined behavior
cout << i << i++; // undefined behavior until C++17
a[i] = i++; // undefined behavior until C++17
n = ++i + i; // undefined behaviorSequence points come into play when the same variable is modified more than once within a single expression. An often-cited example is the expression i=i++, which both assigns i to itself and increments i. The final value of i is ambiguous, because, depending on the language semantics, the increment may occur before, after or interleaved with the assignment. The definition of a particular language might specify one of the possible behaviors or simply say the behavior is undefined. In C and C++, evaluating such an expression yields undefined behavior.
C and C++ define the following sequence points:
- Between evaluation of the left and right operands of the && (logical AND), || (logical OR), and comma operators. For example, in the expression *p++ != 0 && *q++ != 0, all side effects of the sub-expression *p++ != 0 are completed before any attempt to access q.
- Between the evaluation of the first operand of the ternary "question-mark" operator and the second or third operand. For example, in the expression a = (*p++) ? (*p++) : 0 there is a sequence point after the first *p++, meaning it has already been incremented by the time the second instance is executed.
- At the end of a full expression. This category includes expression statements (such as the assignment a=b;), return statements, the controlling expressions of if, switch, while, or do-while statements, and all three expressions in a for statement.
- Before a function is entered in a function call. The order in which the arguments are evaluated is not specified, but this sequence point means that all of their side effects are complete before the function is entered. In the expression f(i++) + g(j++) + h(k++), f is called with a parameter of the original value of i, but i is incremented before entering the body of f. Similarly, j and k are updated before entering g and h respectively. However, it is not specified in which order f(), g(), h() are executed, nor in which order i, j, k are incremented. The values of j and k in the body of f are therefore undefined.[3] Note that a function call f(a,b,c) is not a use of the comma operator and the order of evaluation for a, b, and c is unspecified.
- At a function return, after the return value is copied into the calling context. (This sequence point is only specified in the C++ standard; it is present only implicitly in C[4].)
- At the end of an initializer; for example, after the evaluation of 5 in the declaration int a = 5;.
- In C++, overloaded operators act as functions, so a call of an overloaded operator is a sequence point.
Now let's consider several samples causing undefined behavior:
int i, j;
...
X[i]=++i;
X[i++] = i;
j = i + X[++i];
i = 6 + i++ + 2000;
j = i++ + ++i;
i = ++i + ++i;We cannot predict the calculation results in all these cases. Of course, these samples are artificial and we can notice the danger right away. So let's examine a code sample taken from a real application:
while (!(m_pBitArray[m_nCurrentBitIndex >> 5] &
Powers_of_Two_Reversed[m_nCurrentBitIndex++ & 31]))
{}
return (m_nCurrentBitIndex - BitInitial - 1);The compiler can calculate either of the left or right arguments of the '&' operator first. It means that the m_nCurrentBitIndex variable might be already incremented by one when calculating "m_pBitArray[m_nCurrentBitIndex >> 5]". Or it might still be not incremented.
This code may work well for a long time. However, you should keep in mind that it will behave correctly only when it is built in some particular compiler version with a fixed set of compilation options. This is the correct code:
while (!(m_pBitArray[m_nCurrentBitIndex >> 5] &
Powers_of_Two_Reversed[m_nCurrentBitIndex & 31]))
{ ++m_nCurrentBitIndex; }
return (m_nCurrentBitIndex - BitInitial);This code does not contain ambiguities anymore. We also got rid of the magic constant "-1".
Programmers often think that undefined behavior may occur only when using postincrement, while preincrement is safe. It's not so. Further is an example from a discussion on this subject.
Question:
I downloaded the trial version of your studio, ran it on my project and got this warning: V567 Undefined behavior. The 'i_acc' variable is modified while being used twice between sequence points.
The code
i_acc = (++i_acc) % N_acc;It seems to me that there is no undefined behavior because the i_acc variable does not participate in the expression twice.
Answer:
There is undefined behavior here. It's another thing that the probability of error occurrence is rather small in this case. The '=' operator is not a sequence point. It means that the compiler might first put the value of the i_acc variable into the register and then increment the value in the register. After that it calculates the expression and writes the result into the i_acc variable and then again writes a register with the incremented value into the same variable. As a result we will get a code like this:
REG = i_acc;
REG++;
i_acc = (REG) % N_acc;
i_acc = REG;The compiler has the absolute right to do so. Of course, in practice it will most likely increment the variable's value at once, and everything will be calculated as the programmer expects. But you should not rely on that.
Consider one more situation with function calls.
The order of calculating function arguments is not defined. If a variable changing over time serves as arguments, the result will be unpredictable. This is unspecified behavior. Consider this sample:
int A = 0;
Foo(A = 2, A);The 'Foo' function may be called both with the arguments (2, 0) and with the arguments (2, 2). The order in which the function arguments will be calculated depends on the compiler and optimization settings.
References
- Wikipedia. Undefined behavior.
- Wikipedia. Sequence point.
- Klaus Kreft & Angelika Langer. Sequence Points and Expression Evaluation in C++.
- Discussion at Bytes.com. Sequence points.
- Discussion at StackOverflow.com. Why is a = (a+b) - (b=a) a bad choice for swapping two integers?
- cppreference.com. Order of evaluation
This diagnostic is classified as:
|
You can look at examples of errors detected by the V567 diagnostic. |
V568. It is suspicious that the argument of sizeof() operator is the expression.
The analyzer detected a potential error: a suspicious expression serves as an argument of the sizeof() operator.
Suspicious expressions can be arranged in two groups:
1. An expression attempts to change some variable.
The sizeof() operator calculates the expression's type and returns the size of this type. But the expression itself is not calculated. Here is a sample of suspicious code:
int A;
...
size_t size = sizeof(A++);This code does not increment the 'A' variable. If you need to increment 'A', you'd better rewrite the code in the following way:
size_t size = sizeof(A);
A++;2. Operations of addition, multiplication and the like are used in the expression.
Complex expressions signal errors. These errors are usually related to misprints. For example:
SendDlgItemMessage(
hwndDlg, RULE_INPUT_1 + i, WM_GETTEXT,
sizeof(buff - 1), (LPARAM) input_buff);The programmer wrote "sizeof(buff - 1)" instead of "sizeof(buff) - 1". This is the correct code:
SendDlgItemMessage(
hwndDlg, RULE_INPUT_1 + i, WM_GETTEXT,
sizeof(buff) - 1, (LPARAM) input_buff);Here is another sample of a misprint in program text:
memset(tcmpt->stepsizes, 0,
sizeof(tcmpt->numstepsizes * sizeof(uint_fast16_t)));The correct code:
memset(tcmpt->stepsizes, 0,
tcmpt->numstepsizes * sizeof(uint_fast16_t));3. The argument of the sizeof() operator is a pointer to a class. In most cases this shows that the programmer forgot to dereference the pointer.
Example:
class MyClass
{
public:
int a, b, c;
size_t getSize() const
{
return sizeof(this);
}
};The getSize() method returns the size of the pointer, not of the object. Here is a correct variant:
size_t getSize() const
{
return sizeof(*this);
}This diagnostic is classified as:
|
You can look at examples of errors detected by the V568 diagnostic. |
V569. Truncation of constant value.
The analyzer detected a potential error: a constant value is truncated when it is assigned into a variable.
Consider this sample:
int A[100];
unsigned char N = sizeof(A);The size of the 'A' array (in Win32/Win64) is 400 bytes. The value range for unsigned char is 0..255. Consequently, the 'N' variable cannot store the size of the 'A' array.
The V569 warning tells you that you have chosen a wrong type to store this size or that you actually intended to calculate the number of items in the array instead of the array's size.
If you have chosen a wrong type, you may correct the code this way:
size_t N = sizeof(A);If you intended to calculate the number of items in the array, you should rewrite the code this way:
unsigned char N = sizeof(A) / sizeof(*A);This diagnostic is classified as:
|
You can look at examples of errors detected by the V569 diagnostic. |
V570. Variable is assigned to itself.
The analyzer detected a potential error: a variable is assigned to itself.
Consider this sample:
dst.m_a = src.m_a;
dst.m_b = dst.m_b;The value of the 'dst.m_b' variable will not change because of the misprint. This is the correct code:
dst.m_a = src.m_a;
dst.m_b = src.m_b;The analyzer issues a warning not only for the copy assignment, but for the move assignment too.
dst.m_a = std::move(src.m_a);The analyzer does not produce the warning every time it detects assignment of a variable to itself. For example, if the variables are enclosed in parentheses. This method is often used to suppress compiler-generated warnings. For example:
int Foo(int foo)
{
UNREFERENCED_PARAMETER(foo);
return 1;
}The UNREFERENCED_PARAMETER macro is defined in the WinNT.h file in the following way:
#define UNREFERENCED_PARAMETER(P) \
{ \
(P) = (P); \
}The analyzer knows about such cases and will not generate the V570 warning on assignment like this:
(foo) = (foo);If such an approach isn't used in your project, you can add the following comment to enable the warning:
//V_WARN_ON_ARGUMENT_SELF_ASSIGNNote. If V570 warning shows on macro that should not be changed, it is possible to use macro suppression mechanism. Special comment in the file that is used in the whole project (for instance, StdAfx.h file) may be enough for that. Example:
//-V:MY_MACROS:V570This diagnostic is classified as:
You can look at examples of errors detected by the V570 diagnostic. |
V571. Recurring check. This condition was already verified in previous line.
The analyzer detected a potential error: one and the same condition is checked twice.
Consider two samples:
// Example N1:
if (A == B)
{
if (A == B)
...
}
// Example N2:
if (A == B) {
} else {
if (A == B)
...
}In the first case, the second check "if (A==B)" is always true. In the second case, the second check is always false.
It is highly probable that this code has an error. For instance, a wrong variable name is used because of a misprint. This is the correct code:
// Example N1:
if (A == B)
{
if (A == C)
...
}
// Example N2:
if (A == B) {
} else {
if (A == C)
...
}This diagnostic is classified as:
You can look at examples of errors detected by the V571 diagnostic. |
V572. Object created using 'new' operator is immediately cast to another type. Consider inspecting the expression.
The analyzer detected a potential error: an object created by the 'new' operator is explicitly cast to a different type.
For example:
T_A *p = (T_A *)(new T_B());
...
delete p;There are three possible ways of how this code has appeared and what to do with it.
1) T_B was not inherited from the T_A class.
Most probable, it is an unfortunate misprint or crude error. The way of correcting it depends upon the purpose of the code.
2) T_B is inherited from the T_A class. The T_A class does not have a virtual destructor.
In this case you cannot cast T_B to T_A because you will not be able to correctly destroy the created object then. This is the correct code:
T_B *p = new T_B();
...
delete p;3) T_B is inherited from the T_A class. The T_A class has a virtual destructor.
In this case the code is correct but the explicit type conversion is meaningless. We can write it in a simpler way:
T_A *p = new T_B();
...
delete p;There can be other cases when the V572 warning is generated. Let's consider a code sample taken from a real application:
DWORD CCompRemoteDriver::Open(HDRVR,
char *, LPVIDEO_OPEN_PARMS)
{
return (DWORD)new CCompRemote();
}The program handles the pointer as a descriptor for its purposes. To do that, it explicitly converts the pointer to the DWORD type. This code will work correctly in 32-bit systems but might fail in a 64-bit program. You may avoid the 64-bit error using a more suitable data type DWORD_PTR:
DWORD_PTR CCompRemoteDriver::Open(HDRVR,
char *, LPVIDEO_OPEN_PARMS)
{
return (DWORD_PTR)new CCompRemote();
}Sometimes the V572 warning may be aroused by an atavism remaining since the time when the code was written in C. Let's consider such a sample:
struct Joint {
...
};
joints=(Joint*)new Joint[n]; //malloc(sizeof(Joint)*n);The comment tells us that the 'malloc' function was used earlier to allocate memory. Now it is the 'new' operator which is used for this purpose. But the programmers forgot to remove the type conversion. The code is correct but the type conversion is needless here. We may write a shorter code:
joints = new Joint[n];This diagnostic is classified as:
You can look at examples of errors detected by the V572 diagnostic. |
V573. Use of uninitialized variable 'Foo'. The variable was used to initialize itself.
The analyzer detected a potential error: a variable being declared is used to initialize itself.
Let's consider a simple synthetic sample:
int X = X + 1;The X variable will be initialized by a random value. Of course, this sample is farfetched yet it is simple and good to show the warning's meaning. In practice, such an error might occur in more complex expressions. Consider this sample:
void Class::Foo(const std::string &FileName)
{
if (FileName.empty())
return;
std::string FullName = m_Dir + std::string("\\") + FullName;
...
}Because of the misprint in the expression, it is the FullName name which is used instead of FileName. This is the correct code:
std::string FullName = m_Dir + std::string("\\") + FileName;This diagnostic is classified as:
|
You can look at examples of errors detected by the V573 diagnostic. |
V574. Pointer is used both as an array and as a pointer to single object.
The analyzer detected a potential error: a variable is used simultaneously as a pointer to a single object and as an array.
Let's study a sample of the error the analyzer has found in itself:
TypeInfo *factArgumentsTypeInfo =
new (GC_QuickAlloc) TypeInfo[factArgumentsCount];
for (size_t i = 0; i != factArgumentsCount; ++i)
{
Typeof(factArguments[i], factArgumentsTypeInfo[i]);
factArgumentsTypeInfo->Normalize();
}It is suspicious that we handle the factArgumentsTypeInfo variable as the "factArgumentsTypeInfo[i]" array and as a pointer to the single object "factArgumentsTypeInfo ->". Actually we should call the Normalize() function for all the items. This is the fixed code:
TypeInfo *factArgumentsTypeInfo =
new (GC_QuickAlloc) TypeInfo[factArgumentsCount];
for (size_t i = 0; i != factArgumentsCount; ++i)
{
Typeof(factArguments[i], factArgumentsTypeInfo[i]);
factArgumentsTypeInfo[i].Normalize();
}This diagnostic is classified as:
|
You can look at examples of errors detected by the V574 diagnostic. |
V575. Function receives suspicious argument.
The analyzer found a potential error: the function receives a very odd value as an actual argument.
Consider the sample:
bool Matrix4::operator==(const Matrix4& other) const {
if (memcmp(this, &other, sizeof(Matrix4) == 0))
return true;
...We deal with a misprint here: one round bracket is in a wrong place. Unfortunately, this error is not clearly visible and might exist in the code for a long time. Because of this misprint the size of memory being compared is calculated with the "sizeof(Matrix4) == 0" expression. Since the result of the expression is 'false', 0 bytes of memory are compared. This is the fixed code:
bool Matrix4::operator==(const Matrix4& other) const {
if (memcmp(this, &other, sizeof(Matrix4)) == 0)
return true;
...Another example. The diagnostic detects cases where an array of enum elements is filled using the 'memset' function and the size of one element is other than one byte. The filling will not work correctly in this case because it is not each element but rather each byte that will get filled with a value.
Example of incorrect code:
enum E { V0, V1, V2, V3, V4 };
E array[123];
memset(array, V1, sizeof(array));If the compiler makes each element, say, 4 bytes long, each of the elements will have the value 0x01010101 rather than 0x00000001 (V1) as the programmer expected.
Fixed code to fill the array correctly:
for (size_t i = 0; i < sizeof(array) / sizeof(array[0]); ++i)
{
array[i] = V1;
}Another way to fix it:
std::fill(begin(array), end(array), V1);Note. NULL is odd argument.
Sometimes programmers use constructs like the one below to calculate the amount of memory to be allocated for a buffer:
const char* format = getLocalizedString(id, resource);
int len = ::vsprintf(NULL, format, args);
char* buf = (char*) alloca(len);
::vsprintf(buf, format, args);But one should keep in mind that the call ::vsprintf(NULL, format, args) is incorrect. Here's what MSDN has to say about it:
int vsprintf(*buffer, char *format, va_list argptr);
....vsprintf and vswprintf return the number of characters written, not including the terminating null character, or a negative value if an output error occurs. If buffer or format is a null pointer, these functions invoke the invalid parameter handler, as described in Parameter Validation. If execution is allowed to continue, these functions return -1 and set errno to EINVAL.
Additional Settings
This diagnostic relies on information about whether a particular pointer could be null. In some cases, this information is retrieved from the table of annotated functions, which is stored inside the analyzer itself.
'malloc' is one of such functions. Since it can return 'NULL', using the pointer returned by it without a prior check may result in null pointer dereferencing.
Sometimes our users wish to change the analyzer's behavior and make it think that 'malloc' cannot return 'NULL'. For example, to do that, they use the system libraries, where 'out of memory' errors are handled in a specific way.
They may also want to tell the analyzer that a certain function can return a null pointer.
In that case, you can use the additional settings, described in the section "How to tell the analyzer that a function can or cannot return nullptr".
This diagnostic is classified as:
|
You can look at examples of errors detected by the V575 diagnostic. |
V576. Incorrect format. Consider checking the Nth actual argument of the 'Foo' function.
The analyzer has detected a potential issue with the application of formatted output functions ('printf', 'sprintf', 'wprintf', etc.). The formatting string doesn't correspond with actual arguments passed into the function.
Let's review a simple example:
int A = 10;
double B = 20.0;
printf("%i %i\n", A, B);According to the formatting string the 'printf' function is expecting two actual arguments of the 'int' type. However, the second argument's value is of the 'double' type. Such an inconsistency leads to undefined behavior of a program. For example, it can lead to the output of senseless values.
The correct version:
int A = 10;
double B = 20.0;
printf("%i %f\n", A, B);It's possible to cite countless examples of 'printf' function's incorrect use. Let's review some of the typical examples that are the most frequently encountered in applications.
Address printout
The value of a pointer is quite commonly printed using these lines:
int *ptr = new int[100];
printf("0x%0.8X\n", ptr);This source code is invalid because it will function properly only on systems which have their pointer size equal to size of the 'int' type. For example, in Win64, this code will print only the low-order part of the 'ptr' pointer. The correct version:
int *ptr = new int[100];
printf("0x%p\n", ptr);The analyzer has detected the potential issue with an odd value being passed as the function's actual argument.
Unused arguments
You can often encounter function calls in which some of these function's arguments are being unused.
For example:
int nDOW;
#define KEY_ENABLED "Enabled"
...
wsprintf(cDowKey, L"EnableDOW%d", nDOW, KEY_ENABLED);It is obvious that the 'KEY_ENABLED' parameter is unnecessary here or the source code should look like this:
wsprintf(cDowKey, L"EnableDOW%d%s", nDOW, KEY_ENABLED);Insufficient number of arguments
A little more dangerous is the situation in which the number of arguments passed to the function is less than necessary. This can easily lead to the memory access error, buffer overflow, or senseless printout. Let's review an example of memory allocation function taken from a real-life application:
char* salloc(register int nbytes)
{
register char* p;
p = (char*) malloc((unsigned)nbytes);
if (p == (char *)NULL)
{
fprintf(stderr, "%s: out of memory\n");
exit(1);
}
return (p);
}If 'malloc' returns 'NULL', the program will not be able to report the shortage of memory and to be terminated correctly. It instead will be terminated emergently, and it will output the senseless text. In any case, such a behavior will complicate analysis of the program's inoperability.
Confusion with signed/unsigned
Developers often employ the character printing specificator ('%i' for example) to output the variables of the 'unsigned' type. And vice versa. This error usually is not critical and is encountered so often than it has a low priority in analyzer. In many cases such source code works flawlessly and fails only with large or negative values. Let us examine the code which is not correct, but successfully works:
int A = 10;
printf("A = %u\n", A);
for (unsigned i = 0; i != 5; ++i)
printf("i = %d\n", i);Although there is an inconsistency here, this code outputs correct values in practice. Of course, it's better not to do this and to write correctly:
int A = 10;
printf("A = %d\n", A);
for (unsigned i = 0; i != 5; ++i)
printf("i = %u\n", i);The error will manifest itself in case there are large or negative values in the program. An Example:
int A = -1;
printf("A = %u", A);Instead of "A=-1" string the program will print "A=4294967295". The correct version:
printf("A = %i", A);Wide character strings
Visual Studio has one displeasing feature when it interprets the string format in a non-standard way to print wide characters. Therefore, the analyzer can diagnose errors in code like the following sample:
const wchar_t *p = L"abcdef";
wprintf(L"%S", p);In Visual C++, '%S' is meant to be used to print a string of the 'const char *' type, so from its viewpoint, the correct version of the code above should look like this:
wprintf(L"%s", p);Starting with Visual Studio 2015, the developers offer a solution to this issue for the sake of compatibility. To make your code compatible with ISO C (C99), you need to specify the _CRT_STDIO_ISO_WIDE_SPECIFIERS macro for the preprocessor.
In that case, the code:
const wchar_t *p = L"abcdef";
wprintf(L"%S", p);will be treated as correct.
PVS-Studio knows about the '_CRT_STDIO_ISO_WIDE_SPECIFIERS' macro and takes it into account when performing the analysis.
By the way, if you have the ISO C compatibility mode enabled (i.e. declared the '_CRT_STDIO_ISO_WIDE_SPECIFIERS' macro), you can restore the old-type conversion in certain places by using the '%Ts' format specifier.
This story with wide characters is quite complicated and is outside the scope of this documentation. To figure it all out, see the following resources:
- Bug 1121290 - distinguish specifier s and ls in the printf family of functions
- Visual Studio swprintf is making all my %s formatters want wchar_t * instead of char *
- Update. In 2019, an article appeared which explains why confusion takes place: The sad history of Unicode printf-style format specifiers in Visual C++.
Additional diagnostic setup
Use custom annotations to specify the names of user-declared functions for which the format check should be performed. You can read more about this here.
Additional references:
- Wikipedia. Printf.
- MSDN. Format Specification Fields: printf and wprintf Functions.
This diagnostic is classified as:
You can look at examples of errors detected by the V576 diagnostic. |
V577. Label is present inside switch(). Check for typos and consider using the 'default:' operator instead.
The analyzer detected a potential error inside the switch operator. A label is used whose name is similar to 'default'. A misprint is probable.
Consider this sample:
int c = 10;
int r = 0;
switch(c){
case 1:
r = 3; break;
case 2:
r = 7; break;
defalt:
r = 8; break;
}It seems that after the code's work is done, the value of the 'r' variable will be 8. Actually the 'r' variable will still equal zero. The point is that "defalt" is a label, not the "default" operator. This is the correct code:
int c = 10;
int r = 0;
switch(c){
case 1:
r = 3; break;
case 2:
r = 7; break;
default:
r = 8; break;
}This diagnostic is classified as:
|
V578. Suspicious bitwise operation was detected. Consider inspecting it.
The analyzer detected a potential error in an expression handling bits. A part of the expression is meaningless or excessive. Usually such errors occur due to a misprint.
Consider this sample:
if (up & (PARAMETER_DPDU | PARAMETER_DPDU | PARAMETER_NG))The PARAMETER_DPDU constant is used twice here. In a correct code there must be two different constants: PARAMETER_DPDU and PARAMETER_DPDV. The letter 'U' resembles 'V' and that is why this misprint has occurred. This is the correct code:
if (up & (PARAMETER_DPDU | PARAMETER_DPDV | PARAMETER_NG))Another example. There is no error here but the code is excessive:
if (((pfds[i].dwFlags & pPFD->dwFlags) & pPFD->dwFlags)
!= pPFD->dwFlags)This is a shorter code:
if ((pfds[i].dwFlags & pPFD->dwFlags) != pPFD->dwFlags)This diagnostic also generates a warning when the label name begins with "case". A space character is most probably missing. For example, the label "case1:" should be written as "case 1:".
This diagnostic is classified as:
You can look at examples of errors detected by the V578 diagnostic. |
V579. The 'Foo' function receives the pointer and its size as arguments. This may be a potential error. Inspect the Nth argument.
The analyzer detected an odd function call in code. A pointer and the size of the pointer are passed into a function as its arguments. Actually it is a common case when developers want to pass a buffer size instead of a pointer size into a function.
Let's see how an error like that can appear in code. Assume we had the following code in the beginning:
char buf[100];
...
memset(buf, 0, sizeof(buf));The code is correct. The memset() function clears an array of 100 bytes. Then the code was changed and the buffer became variable-sized. The programmer forgot to change the code of buffer clearing:
char *buf = new char[N];
...
memset(buf, 0, sizeof(buf));Now the code is incorrect. The sizeof() operator returns the pointer size instead of the size of the buffer with data. As a result, the memset() function clears only part of the array.
Let's consider another sample taken from a real application:
apr_size_t ap_regerror(int errcode,
const ap_regex_t *preg, char *errbuf,
apr_size_t errbuf_size)
{
...
apr_snprintf(errbuf, sizeof errbuf,
"%s%s%-6d", message, addmessage,
(int)preg->re_erroffset);
...
}It is not easy to notice the error in this code. The apr_snprintf() function accepts the 'errbuf' pointer and the size of this pointer 'sizeof errbuf' as arguments. The analyzer considers this code odd and is absolutely right. The buffer size is stored in the 'errbuf_size' variable and it is this variable that should be used. This is the correct code:
apr_snprintf(errbuf, errbuf_size,
"%s%s%-6d", message, addmessage,
(int)preg->re_erroffset);This diagnostic is classified as:
|
You can look at examples of errors detected by the V579 diagnostic. |
V580. Suspicious explicit type casting. Consider inspecting the expression.
The analyzer detected an odd explicit type conversion. It may be either an error or a potential error.
Consider this sample:
DWORD errCode = 0;
void* dwErrParams[MAX_MESSAGE_PARAMS];
dwErrParams[0] = *((void**)&errCode);The code contains a 64-bit error. The 'DWORD' type is cast to 'void *' type. This code works incorrectly in 64-bit systems where the pointer's size does not coincide with the size of the DWORD type. This is the correct code:
DWORD_PTR errCode = 0;
void* dwErrParams[MAX_MESSAGE_PARAMS];
dwErrParams[0] = (void *)errCode;This diagnostic is classified as:
|
V581. Conditional expressions of 'if' statements located next to each other are identical.
The analyzer detected code where there are two 'if' operators with identical close to each other. This is either a potential error or excessive code.
Consider the following sample:
if (strlen(S_1) == SIZE)
Foo(A);
if (strlen(S_1) == SIZE)
Foo(B);Whether this code contains an error or not, depends upon what exactly the programmer intended to do. If the second condition must calculate the length of the other string, then it is an error. This is the correct code:
if (strlen(S_1) == SIZE)
Foo(A);
if (strlen(S_2) == SIZE)
Foo(B);Maybe the code is correct, but it is inefficient in this case because it has to calculate the length of one and the same string twice. This is the optimized code:
if (strlen(S_1) == SIZE) {
Foo(A);
Foo(B);
}This diagnostic is classified as:
You can look at examples of errors detected by the V581 diagnostic. |
V582. Consider reviewing the source code that uses the container.
The analyzer detected a potential error related to handling a fixed-sized container. One of our users advised us to implement this diagnostic. This is how he has formulated the task.
In order to handle arrays of a fixed size, we use the following template class:
template<class T_, int numElements > class idArray
{
public:
int Num() const { return numElements; };
.....
inline const T_ & operator[]( int index ) const {
idassert( index >= 0 );
idassert( index < numElements );
return ptr[index];
};
inline T_ & operator[]( int index ) {
idassert( index >= 0 );
idassert( index < numElements );
return ptr[index];
};
private:
T_ ptr[numElements];
};It has no performance overhead in release builds, but does index range checking in debug builds. Here is an example of incorrect code:
idArray<int, 1024> newArray;
newArray[-1] = 0;
newArray[1024] = 0;The errors will be detected on launching the debug version. But we would like to be able to detect such errors using static analysis at the compilation time.
It is this type of issues that the V582 diagnostic is intended to detect. If a class is used in a program that makes use of a fixed-sized container's functionality, the analyzer tries to make sure that the index does not go beyond its boundaries. Here are examples of this diagnostic:
idArray<float, 16> ArrA;
idArray<float, 8> ArrB;
for (size_t i = 0; i != 16; i++)
ArrA[i] = 1.0f;
for (size_t i = 0; i != 16; i++)
ArrB[i] = 1.0f;The analyzer will generate the following message on this code:
V582 Consider reviewing the source code which operates the 'ArrB' container. The value of the index belongs to the range: [0..15].
The error here is that the both loops handle 16 items, although the second array contains only 8 items. This is the correct code:
for (size_t i = 0; i != 16; i++)
ArrA[i] = 1.0f;
for (size_t i = 0; i != 8; i++)
ArrB[i] = 1.0f;Note that passing of too large or too small indexes does not necessarily indicate an error in the program. For instance, the [] operator can be implemented in the following way:
inline T_ & operator[]( int index ) {
if (index < 0) index = 0;
if (index >= numElements) index = numElements - 1;
return ptr[index];
};If you use such classes and get too many false reports, you should turn off the V582 diagnostic.
Note. The analyzer does not possess an AI and its capabilities of searching for defects when handling containers are limited. We are working on improving the algorithms, so if you have noticed obviously false reports or, on the contrary, cases when the analyzer does not generate the warning, please write to us and send us the corresponding code sample.
This diagnostic is classified as:
V583. The '?:' operator, regardless of its conditional expression, always returns the same value.
Analyzer found a potential error with utilization of "?:" ternary operator. Regardless of its conditional expression, the same operation will be performed. It is quite possible that a misprint is present in the source code.
Let's review the most basic example:
int A = B ? C : C;In all cases the value of C variable will be assigned to the A variable.
Let's review how such a mistake could appear in the source code of real-life application:
fovRadius[0] =
tan(DEG2RAD((rollAngleClamped % 2 == 0 ?
cg.refdef.fov_x : cg.refdef.fov_x) * 0.52)) * sdist;The code here is formatted. In the program's sources this is a single line of code and it is not surprising that the misprint could be overlooked quite easily. The essence of an error is that the member of the "fov_x" structure is used twice.
The correct code:
fovRadius[0] =
tan(DEG2RAD((rollAngleClamped % 2 == 0 ?
cg.refdef.fov_x : cg.refdef.fov_y) * 0.52)) * sdist;This diagnostic is classified as:
You can look at examples of errors detected by the V583 diagnostic. |
V584. Same value is present on both sides of the operator. The expression is incorrect or can be simplified.
Analyzer found an expression that can be simplified. The possibility of a misprint presence in it is quite high.
Let's review an example:
float SizeZ;
if (SizeZ + 1 < SizeZ)The analyzer thinks that this condition contains a mistake because it is practically senseless. Most likely another check was implied. The correct variant:
if (SizeZ + 1 < maxSizeZ)Of course programmers sometimes utilize some tricks which are formally correct but do appear quite odd. The analyzer tries to detect such situations if possible and not to produce warnings. For instance the analyzer considers such checks as being safe:
//overflow test for summation
int a, b;
if (a + b < a)
//Verifying that x does not equals zero, +infinity, -infinity
double X;
if (X * 0.5f != X)This diagnostic is classified as:
You can look at examples of errors detected by the V584 diagnostic. |
V585. Attempt to release memory that stores the 'Foo' local variable.
Analyzer detected an attempt to release the memory occupied by the local variable. Such errors could be produced in case of careless refactoring or as misprints.
Let's review an example of the incorrect code:
void Foo()
{
int *p;
...
free(&p);
}The corrected code:
void Foo()
{
int *p;
...
free(p);
}This diagnostic is classified as:
|
V586. The 'Foo' function is called twice to deallocate the same resource.
Analyzer detected a potential error of recurrent resource deallocation. Under certain circumstances this code may turn into a security defect.
The resource mentioned could be a memory space, some file or, for example, an HBRUSH object.
Let's review the example of incorrect code:
float *p1 = (float *)malloc(N * sizeof(float));
float *p2 = (float *)malloc(K * sizeof(float));
...
free(p1);
free(p1);There is a misprint in application's source code which causes the double deallocation of same memory space. It is hard to predict the consequences of such code's execution. It's possible that such a program would crash. Or it will continue its execution but memory leak will occur.
Moreover, this code is a security defect and may lead to a vulnerability. For example, the 'malloc' ('dmalloc') function by Doug Lea that is used in some libraries as 'malloc' by default, is subject to the vulnerability. There are several conditions needed for the appearance of the vulnerability, related to the double memory freeing: memory blocks, contiguously-allocated with the freed ones, should not be free, and the list of the free memory blocks should be empty. In this case it is possible to create an exploit. Despite the fact that vulnerabilities of this kind are hard to exploit because of its specific memory configuration, there are real examples of the vulnerable code that was successfully hacked.
The correct example:
float *p1 = (float *)malloc(N * sizeof(float));
float *p2 = (float *)malloc(K * sizeof(float));
...
free(p1);
free(p2);Sometimes an error of double resource deallocation is not a dangerous one:
vector<unsigned> m_arrStack;
...
m_arrStack.clear();
m_arrBlock.clear();
m_arrStack.clear();Accidently the array is emptied twice. The code operates correctly but still it should be reviewed and corrected. During its study, it could be discovered that another array dissaalocation should have been performed nevertheless.
The correct example:
vector<unsigned> m_arrStack;
...
m_arrStack.clear();
m_arrBlock.clear();This diagnostic is classified as:
You can look at examples of errors detected by the V586 diagnostic. |
V587. Suspicious sequence of assignments: A = B; B = A;.
Analyzer detected a potential error concerning the senseless mutual assignment of variables.
Let's review an example:
int A, B, C;
...
A = B;
C = 10;
B = A;Here the assignment "B=A" lacks any sort of practical utility. It is possibly a misprint or just an unnecessary operation. The correct code:
A = B;
C = 10;
B = A_2;An example stated above is a synthetic one. Let's see how such an error could appear in the source code of a real-life application:
// Swap; exercises counters
{
RCPFooRef temp = f2;
f2 = f3;
f3 = f2;
}The correct code:
// Swap; exercises counters
{
RCPFooRef temp = f2;
f2 = f3;
f3 = temp;
}You can look at examples of errors detected by the V587 diagnostic. |
V588. Expression of the 'A =+ B' kind is used. Possibly meant: 'A += B'. Consider inspecting the expression.
The analyzer detected a potential error: there is a sequence of '=+' characters. It might be a misprint and you should use the '+=' operator.
Consider the following example:
size_t size, delta;
...
size=+delta;This code may be correct, but it is highly probable that there is a misprint and the programmer actually intended to use the '+=' operator. This is the fixed code:
size_t size, delta;
...
size+=delta;If this code is correct, you may remove '+' or type in an additional space to prevent showing the V588 warning. The following is an example of correct code where the warning is not generated:
size = delta;
size = +delta;Note. To search for misprints of the 'A =- B' kind, we use the V589 diagnostic rule. This check is implemented separately since a lot of false reports are probable and you may want to disable it.
This diagnostic is classified as:
You can look at examples of errors detected by the V588 diagnostic. |
V589. Expression of the 'A =- B' kind is used. Possibly meant: 'A -= B'. Consider inspecting the expression.
The analyzer detected a potential error: there is a sequence of '=-' characters in code. It might be a misprint and you should use the '-=' operator.
Consider this sample:
size_t size, delta;
...
size =- delta;This code may be correct, but it is highly probable that there is a misprint and the programmer actually intended to use the '-=' operator. This is the fixed code:
size_t size, delta;
...
size -= delta;If the code is correct, you may type in an additional space between the characters '=' and '-' to remove the V589 warning. This is an example of correct code where the warning is not generated:
size = -delta;To make false reports fewer, there are some specific exceptions to the V589 rule. For instance, the analyzer will not generate the warning if a programmer does not use spaces between variables and operators. Here you are some samples of code the analyzer considers safe:
A=-B;
int Z =- 1;
N =- N;Note. To search for misprints of the 'A =+ B' type, the V588 diagnostic check is used.
This diagnostic is classified as:
V590. Possible excessive expression or typo. Consider inspecting the expression.
The analyzer detected a potential error: there is an excessive comparison in code.
Let me explain this by a simple example:
if (Aa[42] == 10 && Aa[42] != 3)The condition will hold if 'Aa == 10'. The second part of the expression is meaningless. On studying the code, you may come to one of the two conclusions:
1) The expression can be simplified. This is the fixed code:
if (Aa[42] == 10)2) The expression has an error. This is the fixed code:
if (Aa[42] == 10 && Aa[43] != 3)Let's study the example from practice. We have no error here, but the expression is excessive, which might make the code less readable:
while (*pBuff == ' ' && *pBuff != '\0')
pBuff++;The " *pBuff != '\0' " check is meaningless. This is the shortened code:
while (*pBuff == ' ')
pBuff++;This diagnostic is classified as:
|
You can look at examples of errors detected by the V590 diagnostic. |
V591. Non-void function must return value.
The analyzer has detected a non-void function with an execution path that does not return a value. Such a function results in undefined behavior.
Flowing off the end of a non-void function with no 'return' results in undefined behavior.
Let's consider an example:
int GetSign(int arg)
{
if (arg > 0)
{
return 1;
}
else if (arg < 0)
{
return -1;
}
}If the 'GetSign' function receives 0, undefined behavior will occur. Here's the correct version:
int GetSign(int arg)
{
if (arg > 0)
{
return 1;
}
else if (arg < 0)
{
return -1;
}
return 0;
}The 'main' and 'wmain' functions are the exceptions. Flowing off the end of these functions is equivalent to a 'return 0;'. Thus, these functions do not result in undefined behavior. Let's consider an example.
....
int main()
{
AnalyzeFile(FILE_NAME);
}In this case, we have the 'main' function. There will be no undefined behavior here. That's why, the analyzer will not issue a warning. The code fragment is equivalent to the following:
....
int main()
{
AnalyzeFile(FILE_NAME);
return 0;
}Note that undefined behavior occurs only if the end of a non-void function is actually reached. Particularly, if during the function execution an exception is thrown and is not caught in the body of the same function, there will be no undefined behavior.
The analyzer will not issue a warning for the following code fragment:
int Calc(int arg);
int Bar(int arg)
{
if (arg > 0)
{
return Calc(arg);
}
throw std::logic_error { "bad arg was passed to Bar" };
}There will also be no undefined behavior if, during the function execution, another function that does not return control, is called. Such functions are usually marked '[[noreturn]]'. Thus, the analyzer will not issue a warning for the following code fragment:
[[noreturn]] void exit(int exit_code);
int Foo()
{
....
exit(10);
}This diagnostic is classified as:
|
You can look at examples of errors detected by the V591 diagnostic. |
V592. Expression is enclosed by parentheses twice: ((expression)). One pair of parentheses is unnecessary or typo is present.
The analyzer detected double parentheses enclosing an expression. It is probable that one of the brackets is in a wrong place.
Note that the analyzer does not search for code fragments where parentheses are used twice. For instance, the analyzer considers the check "if ((A = B))" safe. Additional parentheses are used here to suppress warnings of some compilers. You cannot arrange parentheses in this expression so that an error occurs.
The analyzer tries to find cases when you may change an expression's meaning by changing a location of one bracket. Consider the following sample:
if((!osx||howmanylevels))This code is suspicious. The purpose of additional parentheses here is not clear. Perhaps the expression should look this way:
if(!(osx||howmanylevels))Even if the expression is correct, we still should remove the additional parentheses. There are two reasons for that.
1) A person reading the code may doubt that it is correct on seeing double parentheses.
2) If you remove additional parentheses, the analyzer will stop generating a false report.
You can look at examples of errors detected by the V592 diagnostic. |
V593. Expression 'A = B == C' is calculated as 'A = (B == C)'. Consider inspecting the expression.
The analyzer detected a potential error in an expression that is most probably working in a way other than intended by the programmer. Most often you may see errors of this type in expressions where an assignment operation and operation of checking a function's result are performed simultaneously.
Consider a simple example:
if (handle = Foo() != -1)While creating this code, the programmer usually wants the actions to be performed in the following order:
if ((handle = Foo()) != -1)
But the priority of the '!=' operator is higher than that of the '=' operator. That is why the expression will be calculated in the following way:
if (handle = (Foo() != -1))
To fix the error, you may use parentheses, or rather not be stingy with code lines. Your program's text will become more readable if you write it this way:
handle = Foo();
if (handle != -1)Let's see how such an error might look in a real application:
if (hr = AVIFileGetStream(pfileSilence,
&paviSilence, typeAUDIO, 0) != AVIERR_OK)
{
ErrMsg("Unable to load silence stream");
return hr;
}The check in the code where the error has occurred works correctly and we will get the message "Unable to load silence stream". The trouble is that the 'hr' variable will store value 1 and not the error's code. This is the fixed code:
if ((hr = AVIFileGetStream(pfileSilence,
&paviSilence, typeAUDIO, 0)) != AVIERR_OK)
{
ErrMsg("Unable to load silence stream");
return hr;
}The analyzer does not always generate warnings on detecting a construct of the "if (x = a == b)" kind. For instance, the analyzer understands that the following code is safe:
char *from;
char *to;
bool result;
...
if (result = from == to)
{}Note. If the analyzer still generates a false alarm, you may use two methods to suppress it:
1) Add one more pair of parentheses. For example: "if (x = (a == b))".
2) Use a comment to suppress the warning. For example: "if (x = a == b) //-V593".
This diagnostic is classified as:
|
You can look at examples of errors detected by the V593 diagnostic. |
V594. Pointer to array is out of array bounds.
The analyzer has detected a potential error of pointer handling. There is an expression in the program, on calculating which a pointer leaves array bounds.
Here is a simple example to clarify this point:
int A[10];
fill(A, A + sizeof(A), 33);We want all the array items to be assigned value 33. The error is this: the "A + sizeof(A)" pointer points far outside the array's bounds. As a result, we will change more memory cells than intended. A result of such an error is unpredictable.
This is the correct code:
int A[10];
fill(A, A + sizeof(A) / sizeof(A[0]), 33);This diagnostic is classified as:
|
You can look at examples of errors detected by the V594 diagnostic. |
V595. Pointer was used before its check for nullptr. Check lines: N1, N2.
The analyzer has detected a potential error that may cause dereferencing of a null pointer.
The analyzer has noticed the following situation in the code: a pointer is being used first and only then it is checked whether or not this is a NULL pointer. It means one of the two things:
1) An error occurs if the pointer is equal to NULL.
2) The program works correctly, since the pointer is never equal to NULL. The check is not necessary in this case.
Let's consider the first case. There is an error.
buf = Foo();
pos = buf->pos;
if (!buf) return -1;If the 'buf' pointer is equal to NULL, the 'buf->pos ' expression will cause an error. The analyzer will generate a warning for this code mentioning 2 lines: the first line is the place where the pointer is used; the second line is the place where the pointer is compared to NULL.
This is the correct code:
buf = Foo();
if (!buf) return -1;
pos = buf->pos;Let's consider the second case. There is no error.
void F(MyClass *p)
{
if (!IsOkPtr(p))
return;
printf("%s", p->Foo());
if (p) p->Clear();
}This code is always correct. The pointer is never equal to NULL. But the analyzer does not understand this situation and generates a warning. To make it disappear, you should remove the check "if (p)". It has no sense and can only confuse a programmer reading this code.
This is the correct code:
void F(MyClass *p)
{
if (!IsOkPtr(p))
return;
printf("%s", p->Foo());
p->Clear();
}When the analyzer is mistaken, you may use (apart from changing the code) a comment to suppress warnings. For example: "p->Foo(); //-V595".
Note N1.
Some users report that the analyzer generates the V595 warning on correct code like in the following sample:
static int Foo(int *dst, int *src)
{
*dst = *src; // V595 !
if (src == 0)
return 0;
return Foo(dst, src);
}
...
int a = 1, b = 2;
int c = Foo(&a, &b);Yes, analyzer produces a false-positive warning here. The code is correct and the 'src' pointer cannot be equal to NULL at the moment when assignment "*dst = *src" is performed. Perhaps we will implement an exception for such cases in future but we won't hurry. Though there is no error, the analyzer has detected a surplus code: the function can be shortened and the V595 warning will stop appearing, while the code will become simpler.
This is the better code:
int Foo(int *dst, int *src)
{
assert(dst && src);
*dst = *src;
return Foo(dst, src);
}Note N2.
Sometimes programmers write code like this:
int *x=&p->m_x; //V595
if (p==NULL) return(OV_EINVAL);In this fragment, a pointer to a class member is calculated. This pointer is not dereferenced and one may find it strange that the analyzer generates the V595 warning here. But this code actually leads to undefined behavior. It's only sheer luck that the program works properly. One can't calculate the "&p->m_x" expression if the 'p' pointer is null.
A similar issue may occur when sorting an array:
int array[10];
std::sort(&array[0], &array[10]); // Undefined behavior&array[10] will cause undefined behavior as the array[10] item lies outside the array boundaries. However, it is legal to use pointer arithmetic: you can use a pointer addressing the last array item. So the fixed code may look like this:
int array[10];
std::sort(array, array+10); //okRelated materials
- Andrey Karpov. Explanation on Diagnostic V595. http://www.viva64.com/en/b/0353/
This diagnostic is classified as:
|
You can look at examples of errors detected by the V595 diagnostic. |
V596. Object was created but is not used. Check for missing 'throw' keyword.
The analyzer has detected a strange use of the std::exception class or derived class. The analyzer generates this warning when an object of the std::exception / CException type is created but not being used.
For example:
if (name.empty())
std::logic_error("Name mustn't be empty");The error is this: the key word 'throw' is missing by accident. As a result, this code does not generate an exception in case of an error. This is the fixed code:
if (name.empty())
throw std::logic_error("Name mustn't be empty");This diagnostic is classified as:
|
You can look at examples of errors detected by the V596 diagnostic. |
V597. Compiler may delete 'memset' function call that is used to clear 'Foo' buffer. Use the RtlSecureZeroMemory() function to erase private data.
The analyzer has detected a potential error: an array containing private information is not cleared.
Consider the following code sample.
void Foo()
{
char password[MAX_PASSWORD_LEN];
InputPassword(password);
ProcessPassword(password);
memset(password, 0, sizeof(password));
}The function on the stack creates a temporary buffer intended for password storage. When we finish working with the password, we want to clear this buffer. If you don't do this, the password will remain in memory, which might lead to unpleasant consequences. Article about this: "Overwriting memory - why?".
Unfortunately, the code above may leave the buffer uncleared. Note that the 'password' array is cleared at the end and is not used anymore. That's why when building the Release version of the application, the compiler will most likely delete the call of the memset() function. The compiler has an absolute right to do that. This change does not affect the observed behavior which is described in the Standard as a sequence of calls of input-output functions and volatile data read-write functions. That is, from the viewpoint of the C/C++ language removing the call of the memset() function does not change anything!
To clear buffers containing private information you should use a special function RtlSecureZeroMemory() or memset_s() (see also "Safe Clearing of Private Data").
This is the fixed code:
void Foo()
{
char password[MAX_PASSWORD_LEN];
InputPassword(password);
ProcessPassword(password);
RtlSecureZeroMemory(password, sizeof(password));
}It seems that in practice the compiler cannot delete a call of such an important function as memset(). You might think that we speak of some exotic compilers. It's not so. Take the Visual C++ 10 compiler included into Visual Studio 2010, for instance.
Let's consider the two functions.
void F1()
{
TCHAR buf[100];
_stprintf(buf, _T("Test: %d"), 123);
MessageBox(NULL, buf, NULL, MB_OK);
memset(buf, 0, sizeof(buf));
}
void F2()
{
TCHAR buf[100];
_stprintf(buf, _T("Test: %d"), 123);
MessageBox(NULL, buf, NULL, MB_OK);
RtlSecureZeroMemory(buf, sizeof(buf));
}The functions differ in the way they clear the buffer. The first one uses the memset() function, and the second the RtlSecureZeroMemory() function. Let's compile the optimized code enabling the "/O2" switch for the Visual C++ 10 compiler. Look at the assembler code we've got as a result:

Figure 1. The memset() function is removed.

Figure 2. The RtlSecureZeroMemory() function fills memory with nulls.
As you can see from the assembler code, the memset() function was deleted by the compiler during optimization, while the RtlSecureZeroMemory() function was arranged into the code, thus clearing the array successfully.
Additional materials on this topic:
- Safe Clearing of Private Data
- Security, security! But do you test it?
- Zero and forget - caveats of zeroing memory in C.
This diagnostic is classified as:
|
You can look at examples of errors detected by the V597 diagnostic. |
V598. Memory manipulation function is used to work with a class object containing a virtual table pointer. The result of such an operation may be unexpected.
The analyzer has detected that such low-level functions as 'memset', 'memcpy', 'memmove', 'memcmp', 'memchr' are used to handle a class object. It is inadmissible when a class contains a pointer to a virtual function table (vtable).
If a pointer to an object is passed as a destination to the 'memset', 'memcpy' or 'memmove' functions, they may corrupt the vtable. If a pointer is passed as a source to the 'memcpy' or 'memmove' functions, the result of such copying may be unpredictable. In the case of 'memcmp' or 'memchr' functions, comparing or searching in the presence of the vtable may also lead to unexpected results.
Consider the following code sample:
class MyClass
{
public:
MyClass();
virtual ~MyClass();
private:
int A, B, C;
char buf[100];
};
MyClass::MyClass()
{
memset(this, 0, sizeof(*this));
}Note that there is a virtual destructor in the class. It means that the class has a vtable. The programmer was too lazy to clear the class data members separately and used the 'memset' function for that purpose. It will corrupt the vtable, since the 'memset' function does not know anything about it.
This is the correct code:
MyClass::MyClass() : A(0), B(0), C(0)
{
memset(buf, 0, sizeof(buf));
}Since C++11, you can rewrite the code as follows if you want to zeroize data members:
class MyClass
{
public:
MyClass() = default;
virtual ~MyClass() = default;
private:
int A = {}, B = {}, C = {};
char buf[100] = {};
};This diagnostic is classified as:
|
You can look at examples of errors detected by the V598 diagnostic. |
V599. The virtual destructor is not present, although the 'Foo' class contains virtual functions.
The analyzer has found a potential error: a virtual destructor is absent in a class.
The following conditions must hold for the analyzer to generate the V599 warning:
1) A class object is destroyed by the delete operator.
2) The class has at least one virtual function.
Presence of virtual functions indicates that the class may be used polymorphically. In this case a virtual destructor is necessary to correctly destroy the object.
Consider the following code sample.
class Father
{
public:
Father() {}
~Father() {}
virtual void Foo() { ... }
};
class Son : public Father
{
public:
int* buffer;
Son() : Father() { buffer = new int[1024]; }
~Son() { delete[] buffer; }
virtual void Foo() { ... }
};
...
Father* object = new Son();
delete object; // Call ~Father()!!The code is incorrect and leads to memory leak. At the moment of deleting the object only the destructor in the 'Father' class is called. To call the 'Son' class' destructor you should make the destructor virtual.
This is the correct code:
class Father
{
public:
Father() {}
virtual ~Father() {}
virtual void Foo() { ... }
};The V599 diagnostic message helps to detect far not all the issues related to absence of virtual destructors. Here is the corresponding example: "You develop a library. It contains the XXX class which has virtual functions but no virtual destructor. You don't handle this class in the library yourself, so the analyzer won't warn you about the danger. The problem might occur at the side of a programmer who uses your library and whose classes are inheritance of the XXX class."
The C4265: 'class' : class has virtual functions, but destructor is not virtual diagnostic message implemented in Visual C++ allows you to detect much more issues. This is a very useful message. But it is turned off by default. I cannot say why. This subject was discussed on the Stack Overflow site: Why is C4265 Visual C++ warning (virtual member function and no virtual destructor) off by default? Unfortunately, nobody managed to give a reasonable explanation.
We suppose that C4265 gives many false positives in code where the mixin pattern is used. When using this pattern, a lot of interface classes appear which contain virtual functions but they don't need a virtual destructor.
We can say that the V599 diagnostic rule is a special case of C4265. It produces fewer false reports but, unfortunately, allows you to detect fewer defects. If you want to analyze your code more thoroughly, turn on the C4265 warning.
P. S.
Unfortunately, ALWAYS declaring a destructor as a virtual one is not a good programming practice. It leads to additional overhead costs, since the class has to store a pointer to the Virtual Method Table.
P.P.S.
The related diagnostic warning are V689https://www.viva64.com/en/w/v108/.
Additional resources:
- Wikipedia. Virtual method table.
- Wikipedia. Virtual function.
- Wikipedia. Destructor.
- Discussion on Stack Overflow. When to use virtual destructors?
- The Old New Thing. When should your destructor be virtual?
This diagnostic is classified as:
|
You can look at examples of errors detected by the V599 diagnostic. |
V600. The 'Foo' pointer is always not equal to NULL. Consider inspecting the condition.
The analyzer has detected a comparison of an array address to null. This comparison is meaningless and might signal an error in the program.
Consider the following code sample.
void Foo()
{
short T_IND[8][13];
...
if (T_IND[1][j]==0 && T_IND[5]!=0)
T_buf[top[0]]= top[1]*T_IND[6][j];
...
}The program handles a two-dimensional array. The code is difficult to read, so the error is not visible at first sight. But the analyzer will warn you that the "T_IND[5]!=0" comparison is meaningless. The pointer "T_IND[5]" is always not equal to zero.
After studying the V600 warnings you may find errors which are usually caused by misprints. For instance, it may turn out that the code above should be written in the following way:
if (T_IND[1][j]==0 && T_IND[5][j]!=0)The V600 warning doesn't always indicate a real error. Careless refactoring is often the reason for generating the V600 warning. Let's examine the most common case. This is how the code looked at first:
int *p = (int *)malloc(sizeof(int) *ARRAY_SIZE);
...
if (!p)
return false;
...
free(p);Then it underwent some changes. It appeared that the ARRAY_SIZE value was small and the array was able to be created on the stack. As a result, we have the following code:
int p[ARRAY_SIZE];
...
if (!p)
return false;
...The V600 warning is generated here. But the code is correct. It simply turns out that the "if (!p)" check has become meaningless and can be removed.
This diagnostic is classified as:
You can look at examples of errors detected by the V600 diagnostic. |
V601. Suspicious implicit type casting.
The analyzer has detected an odd implicit type conversion. Such a type conversion might signal an error or carelessly written code.
Let's consider the first example.
std::string str;
bool bstr;
...
str = true;Any programmer will be surprised on seeing an assignment of the 'true' value to a variable of the 'std::string' type. But this construct is quite permissible and working. The programmer just made a mistake here and wrote a wrong variable.
This is the correct code:
std::string str;
bool bstr;
...
bstr = true;Consider the second example:
bool Ret(int *p)
{
if (!p)
return "p1";
...
}The string literal "p1" turns into the 'true' variable and is returned from the function. It is a very odd code.
We cannot give you general recommendations on fixing such code, since every case must be considered individually.
This diagnostic is classified as:
|
You can look at examples of errors detected by the V601 diagnostic. |
V602. The '<' operator should probably be replaced with '<<'. Consider inspecting this expression.
The analyzer has detected a potential error that may be caused by a misprint. It is highly probable that the '<<' operator must be used instead of '<' in an expression.
Consider the following code sample.
void Foo(unsigned nXNegYNegZNeg, unsigned nXNegYNegZPos,
unsigned nXNegYPosZNeg, unsigned nXNegYPosZPos)
{
unsigned m_nIVSampleDirBitmask =
(1 << nXNegYNegZNeg) | (1 < nXNegYNegZPos) |
(1 << nXNegYPosZNeg) | (1 << nXNegYPosZPos);
...
}The code contains an error, since it is the '<' operator that is written by accident in the expression. This is the correct code:
unsigned m_nIVSampleDirBitmask =
(1 << nXNegYNegZNeg) | (1 << nXNegYNegZPos) |
(1 << nXNegYPosZNeg) | (1 << nXNegYPosZPos);Note.
The analyzer considers comparisons ('<', '>') odd if their result is used in binary operations such as '&', '|' or '^'. The diagnostic is more complex but we hope you understand the point in general. On finding such expressions the analyzer emits the V602 warning.
If the analyzer produces a false positive error, you may suppress it using the "//-V602" comment. But in most cases you'd better rewrite this code. It's not a good practice to handle expressions of the 'bool' type using binary operators: it makes the code unevident and less readable.
This diagnostic is classified as:
You can look at examples of errors detected by the V602 diagnostic. |
V603. Object was created but not used. If you wish to call constructor, use 'this->Foo::Foo(....)'.
The analyzer has detected a potential error: incorrect use of a constructor. Programmers often make mistakes trying to call a constructor explicitly to initialize an object.
Consider a typical sample taken from a real application:
class CSlideBarGroup
{
public:
CSlideBarGroup(CString strName, INT iIconIndex,
CListBoxST* pListBox);
CSlideBarGroup(CSlideBarGroup& Group);
...
};
CSlideBarGroup::CSlideBarGroup(CSlideBarGroup& Group)
{
CSlideBarGroup(Group.GetName(), Group.GetIconIndex(),
Group.GetListBox());
}There are two constructors in the class. To reduce the source code's size the programmer decided to call one constructor from the other. But this code does quite the other thing than intended.
The following happens: a new unnamed object of the CSlideBarGroup type is created and gets destroyed right after. As a result, the class fields remain uninitialized.
The correct way is to create an initialization function and call it from the constructors. This is the correct code:
class CSlideBarGroup
{
void Init(CString strName, INT iIconIndex,
CListBoxST* pListBox);
public:
CSlideBarGroup(CString strName, INT iIconIndex,
CListBoxST* pListBox)
{
Init(strName, iIconIndex, pListBox);
}
CSlideBarGroup(CSlideBarGroup& Group)
{
Init(Group.GetName(), Group.GetIconIndex(),
Group.GetListBox());
}
...
};If you still want to call the constructor, you may write it in this way:
CSlideBarGroup::CSlideBarGroup(CSlideBarGroup& Group)
{
this->CSlideBarGroup::CSlideBarGroup(
Group.GetName(), Group.GetIconIndex(), Group.GetListBox());
}Another identical code:
CSlideBarGroup::CSlideBarGroup(CSlideBarGroup& Group)
{
new (this) CSlideBarGroup(
Group.GetName(), Group.GetIconIndex(),
Group.GetListBox());
}The code of the given samples is very dangerous and you should understand well how they work!
You may do more harm than good with this code. Consider the following samples showing where such a constructor call is admissible and where it is not.
class SomeClass
{
int x,y;
public:
SomeClass() { SomeClass(0,0); }
SomeClass(int xx, int yy) : x(xx), y(yy) {}
};The code contains an error. In the 'SomeClass() ' constructor, a temporary object is created. As a result, the 'x' and 'y' fields remain uninitialized. You can fix the code in this way:
class SomeClass
{
int x,y;
public:
SomeClass() { new (this) SomeClass(0,0); }
SomeClass(int xx, int yy) : x(xx), y(yy) {}
};This code will work well. It is safe and working because the class contains primary data types and is not a descendant of other classes. In this case the double constructor call is not harmful.
Consider another code where the explicit constructor call causes an error:
class Base
{
public:
char *ptr;
std::vector vect;
Base() { ptr = new char[1000]; }
~Base() { delete [] ptr; }
};
class Derived : Base
{
Derived(Foo foo) { }
Derived(Bar bar) {
new (this) Derived(bar.foo);
}
}When we call the "new (this) Derived(bar.foo);" constructor, the Base object is already created and the fields are initialized. The repeated constructor call will lead to double initialization; we will write a pointer to the newly allocated memory area into 'ptr'. As a result we will get memory leak. And if you take double initialization of an object of the std::vector type, you cannot predict its result at all. But one thing is obvious: this code is inadmissible.
In conclusion, I want to note it once again that you'd better create an initialization function instead of explicitly calling a constructor. Explicit constructor call is needed only in very rare cases.
Explicit call of one constructor from the other in C++11 (delegation)
The new standard allows you to perform call of constructors from other constructors (known as delegation). It enables you to create constructors that use behavior of other constructors without added code.
This is an example of correct code:
class MyClass {
int m_x;
public:
MyClass(int X) : m_x(X) {}
MyClass() : MyClass(33) {}
};The MyClass constructor without arguments calls a constructor of the same class with an integer argument.
C++03 considers an object to be constructed when its constructor finishes executing, but C++11 considers an object constructed once any constructor finishes execution. Since multiple constructors will be allowed to execute, this will mean that each delegate constructor will be executing on a fully constructed object of its own type. Derived class constructors will execute after all delegation in their base classes is complete.
Additional information
- Discussion on Stack Overflow. C++'s "placement new".
- Discussion on Stack Overflow. Using new (this) to reuse constructors.
This diagnostic is classified as:
|
You can look at examples of errors detected by the V603 diagnostic. |
V604. Number of iterations in loop equals size of a pointer. Consider inspecting the expression.
The analyzer has detected a potential error in a construct that comprises a loop. The loop is odd because the number of iterations in it equals to the sizeof(pointer). It is highly probable that the number of iterations should correspond to the size of the array the pointer refers to.
Let's see how such an error might occur. This is how the program looked at first:
char A[N];
for (size_t i=0; i < sizeof(A); ++i)
A[i] = 0;Then the program code underwent some changes and the 'A' array has become a variable-sized array. The code has become incorrect:
char *A = (char *)malloc(N);
for (size_t i=0; i < sizeof(A); ++i)
A[i] = 0;Now the "sizeof(A)" expression returns the pointer size, not the array's size.
This is the correct code:
char *A = (char *)malloc(N);
for (size_t i=0; i < N; ++i)
A[i] = 0;This diagnostic is classified as:
|
You can look at examples of errors detected by the V604 diagnostic. |
V605. Unsigned value is compared to the NN number. Consider inspecting the expression.
The analyzer has detected a potential error in an expression where an unsigned variable is compared to a negative number. This is a rather rare situation and such a comparison is not always an error. However, getting the V605 warning is a good reason to review the code.
This is an example of code the V605 warning will be generated for:
unsigned u = ...;
if (u < -1)
{ ... }This diagnostic is classified as:
|
You can look at examples of errors detected by the V605 diagnostic. |
V606. Ownerless token 'Foo'.
The analyzer has detected a potential error: an extra lexeme in the code. Such "lost" lexemes most often occur in the code when the key word return is missing.
Consider this sample:
bool Run(int *p)
{
if (p == NULL)
false;
...
}The developer forgot to write "return" here. The code compiles well but has no practical sense.
This is the correct code:
bool Run(int *p)
{
if (p == NULL)
return false;
...
}This diagnostic is classified as:
|
You can look at examples of errors detected by the V606 diagnostic. |
V607. Ownerless expression 'Foo'.
The analyzer has detected a potential error: an extra expression in the code. Such "lost" expressions most often occur in the code when the key word return is missing or due to careless code refactoring.
Consider this sample:
void Run(int &a, int b, int c, bool X)
{
if (X)
a = b + c;
else
b - c;
}The program text is incomplete because of the misprint. It compiles well but has no practical sense.
This is the correct code:
void Run(int &a, int b, int c, bool X)
{
if (X)
a = b + c;
else
a = b - c;
}Sometimes "lost" expressions do have practical sense. For example, the analyzer won't generate the warning for the following code:
struct A {};
struct B : public A {};
...
void Foo(B *p)
{
static_cast<A*>(p);
...
}The "static_cast<A*>(p);" expression here checks that the 'B' class is a inherits of the 'A' class. If it is not so, a compilation error will occur.
As another example, we can cite the following code intended to suppress the compiler-generated warnings about unused variables:
void Foo(int a, int b)
{
a, b;
}The analyzer won't generate the V607 warning in this case.
This diagnostic is classified as:
You can look at examples of errors detected by the V607 diagnostic. |
V608. Recurring sequence of explicit type casts.
The analyzer has detected repeating sequences consisting of explicit type conversion operators. This code usually appears because of misprints and doesn't lead to errors. But it's reasonable to check those code fragments the analyzer generates the V608 warning for. Perhaps there is an error, or the code can be simplified at least.
Consider this sample:
m_hIcon = AfxGetApp()->LoadStandardIcon(
MAKEINTRESOURCE(IDI_ASTERISK));The analyzer generates the warning for this code: V608 "Recurring sequence of explicit type casts: (LPSTR)(ULONG_PTR)(WORD) (LPSTR)(ULONG_PTR)(WORD)."
Let's find out where we get the two chains "(LPSTR)(ULONG_PTR)(WORD)" from.
The constant value IDI_ASTERISK is a macro of the following kind:
#define IDI_ASTERISK MAKEINTRESOURCE(32516)It means that the above cited code is equivalent to the following code:
m_hIcon = AfxGetApp()->LoadStandardIcon(
MAKEINTRESOURCE(MAKEINTRESOURCE(32516)));The MAKEINTRESOURCE macro is expanded into (LPSTR)((DWORD)((WORD)(i))). As a result, we get the following sequence:
m_hIcon = AfxGetApp()->LoadStandardIcon(
(LPSTR)((DWORD)((WORD)((LPSTR)((DWORD)((WORD)((32516))))))
);This code will work correctly but it is surplus and can be rewritten without extra type conversions:
m_hIcon = AfxGetApp()->LoadStandardIcon(IDI_ASTERISK);This diagnostic is classified as:
V609. Possible division or mod by zero.
The analyzer has detected a situation when division by zero may occur.
Consider this sample:
for (int i = -10; i != 10; ++i)
{
Foo(X / i);
}While executing the loop, the 'i' variable will acquire a value equal to 0. At this moment, an operation of division by zero will occur. To fix it we need to specifically handle the case when the 'i' iterator equals zero.
This is the correct code:
for (int i = -10; i != 10; ++i)
{
if (i != 0)
Foo(X / i);
}This diagnostic is classified as:
|
You can look at examples of errors detected by the V609 diagnostic. |
V610. Undefined behavior. Check the shift operator.
The analyzer has detected a shift operator that causes undefined behavior/unspecified behavior.
This is how the C++11 standard describes shift operators' work:
The shift operators << and >> group left-to-right.
shift-expression << additive-expression
shift-expression >> additive-expression
The operands shall be of integral or unscoped enumeration type and integral promotions are performed.
1. The type of the result is that of the promoted left operand. The behavior is undefined if the right operand is negative, or greater than or equal to the length in bits of the promoted left operand.
2. The value of E1 << E2 is E1 left-shifted E2 bit positions; vacated bits are zero-filled. If E1 has an unsigned type, the value of the result is E1 * 2^E2, reduced modulo one more than the maximum value representable in the result type. Otherwise, if E1 has a signed type and non-negative value, and E1*2^E2 is representable in the result type, then that is the resulting value; otherwise, the behavior is undefined.
3. The value of E1 >> E2 is E1 right-shifted E2 bit positions. If E1 has an unsigned type or if E1 has a signed type and a non-negative value, the value of the result is the integral part of the quotient of E1/2^E2. If E1 has a signed type and a negative value, the resulting value is implementation-defined.
Let's give some code samples that cause undefined or unspecified behavior:
int A = 1;
int B;
B = A << -3; // undefined behavior
B = A << 100; // undefined behavior
B = -1 << 5; // undefined behavior
B = -1 >> 5; // unspecified behaviorThese are, of course, simplified samples. In real applications, it's more complicated. Consider a sample taken from practice:
SZ_RESULT
SafeReadDirectUInt64(ISzInStream *inStream, UInt64 *value)
{
int i;
*value = 0;
for (i = 0; i < 8; i++)
{
Byte b;
RINOK(SafeReadDirectByte(inStream, &b));
*value |= ((UInt32)b << (8 * i));
}
return SZ_OK;
}The function tries to read a 64-bit value byte-by-byte. Unfortunately, it will fail if the number was larger than 0x00000000FFFFFFFF. Note the shift "(UInt32)b << (8 * i)". The size of the left operand is 32 bits. The shift takes from 0 to 56 bits. In practice, it will cause the high-order part of the 64-bit value to remain filled with zeroes. Theoretically, it is undefined behavior here and the result cannot be predicted.
This is the correct code:
*value |= ((UInt64)b << (8 * i));To learn more on the issue we've discussed, please read the article "Wade not in unknown waters. Part three".
Let's examine the situation with the negative left operand in detail. Such a code usually seems to work correctly. You might think that although this is undefined behavior, all the compilers should handle the code in the same way. It's not so. It'd be more correct to say that most compilers do that in the same way. If you are concerned about code portability, you shouldn't use negative value shifts.
Here is an example to prove my words. You may get an unexpected result when using the GCC compiler for the MSP430 microprocessor. Such a situation is described here. Though the programmer blames the compiler, we in fact have that very case when the compiler acts in a different way than we're used to.
Nevertheless, we understand when programmers want the warning to be disabled for the cases when the left operand is negative. For this purpose, you may type in a special comment somewhere in the program text:
//-V610_LEFT_SIGN_OFFThis comment should be added into the header file included into all the other files. For example, such is the "stdafx.h" file. If you add this comment into a "*.cpp" file, it will affect only this particular file.
This diagnostic is classified as:
|
You can look at examples of errors detected by the V610 diagnostic. |
V611. Memory allocation and deallocation methods are incompatible.
The analyzer has detected a potential error: memory is allocated and released through incompatible methods.
For example, the analyzer will warn you if memory is allocated through the 'new' operator and released through the 'free' function.
Consider an example of incorrect code:
int *p = (int *)malloc(sizeof(int) * N);
...
...
delete [] p;This is the fixed code:
int *p = (int *)malloc(sizeof(int) * N);
...
...
free(p);This diagnostic is classified as:
You can look at examples of errors detected by the V611 diagnostic. |
V612. Unconditional 'break/continue/return/goto' within a loop.
The analyzer has detected an odd loop. One of the following operators is used in the loop body: break, continue, return, goto. These operators are executed always without any conditions.
Consider the following corresponding examples:
do {
X();
break;
} while (Foo();)
for (i = 0; i < 10; i++) {
continue;
Foo();
}
for (i = 0; i < 10; i++) {
x = x + 1;
return;
}
while (*p != 0) {
x += *p++;
goto endloop;
}
endloop:The above shown examples of loops are artificial, of course, and of little interest to us. Now let's look at a code fragment found in one real application. We have abridged the function code to make it clearer.
int DvdRead(....)
{
....
for (i=lsn; i<(lsn+sectors); i++){
....
// switch (mode->datapattern){
// case CdSecS2064:
((u32*)buf)[0] = i + 0x30000;
memcpy_fast((u8*)buf+12, buff, 2048);
buf = (char*)buf + 2064; break;
// default:
// return 0;
// }
}
....
}Some of the lines in the function are commented out. The trouble is that the programmer forgot to comment out the "break" operator.
When there were no comments, "break" was inside the "switch" body. Then "switch" was commented out and the "break" operator started to finish the loop earlier than it should. As a result, the loop body is executed only once.
This is the correct code:
buf = (char*)buf + 2064; // break;Note that the V612 diagnostic rule is rather complicated: a lot of cases are accounted for, when using the break/continue/return/goto operator is quite correct. Let's examine a few cases when the V612 warning don't generated.
1) Presence of a condition.
while (*p != 0) {
if (Foo(p))
break;
}2) Special methods used in macros usually:
do { Foo(x); return 1; } while(0);3) Passing the 'continue' operator using 'goto':
for (i = 0; i < 10; i++) {
if (x == 7) goto skipcontinue;
continue;
skipcontinue: Foo(x);
}There are other methods possible which are used in practice and are unknown to us. If you have noticed that the analyzer generates false V612 warnings, please write to us and send us the corresponding samples. We will study them and try to make exceptions to these cases.
This diagnostic is classified as:
|
You can look at examples of errors detected by the V612 diagnostic. |
V613. Suspicious pointer arithmetic with 'malloc/new'.
The analyzer has detected a potential error in the code allocating memory. A pointer returned by the 'malloc' function or any other similar function is summed up with some number. It is very strange and it's highly probable that the code contains a misprint.
Consider this sample:
a = ((int *)(malloc(sizeof(int)*(3+5)))+2);The expression contains many extraneous parentheses and the programmer must have got mixed up in them. Let's simplify this code to make it clearer:
a = (int *)malloc(sizeof(int)*8);
a += 2;It's very strange to add number 2 to the pointer. Even if it should be so and the code is correct, it is very dangerous. For example, you might easily forget that memory should be free this way: "free(a - 2);".
This is the correct code:
a = (int *)malloc(sizeof(int)*(3+5+2));This diagnostic is classified as:
|
V614. Use of 'Foo' uninitialized variable.
The analyzer has detected use of an uninitialized variable. Using uninitialized variables has unpredictable results. What is dangerous about such defects is that they may hide for years until chance gets suitable values gathered in uninitialized variables.
Consider the following simple example:
int Aa = Get();
int Ab;
if (Ab) // Ab - uninitialized variable
Ab = Foo();
else
Ab = 0;Whether or not the Foo() function is called depends on a combination of various circumstances. Usually errors of using uninitialized variables occur through misprints. For example, it may appear that a different variable should be used in this place. This is the correct code:
int Aa = Get();
int Ab;
if (Aa) // OK
Ab = Foo();
else
Ab = 0;It is not only using simple types that the V614 warning is generated. The analyzer may show the warning for variables of the class type which have a constructor and are initialized, as a matter of fact. However, using them without preliminary assignment doesn't have sense. Smart pointers and iterators are examples of such classes.
Have a look at the following samples:
std::auto_ptr<CLASS> ptr;
UsePtr(ptr);
std::list<T>::iterator it;
*it = X;This is the correct code:
std::auto_ptr<CLASS> ptr(Get());
UsePtr(ptr);
std::list<T>::iterator it;
it = Get();
*it = X;It happens that the analyzer generates false V614 warnings. But sometimes it happens through the fault of programmers themselves who write tricky code. Have a look at a code sample taken from a real application:
virtual size_t _fread(const void *ptr, size_t bytes){
size_t ret = ::fread((void*)ptr, 1, bytes, fp);
if(ret < bytes)
failbit = true;
return ret;
}
int read32le(uint32 *Bufo, EMUFILE *fp)
{
uint32 buf;
if(fp->_fread(&buf,4)<4) // False alarm: V614
return 0;
....
}Note that the buffer reading the data from the file is declared as "const void *ptr". For the code to compile, the programmer uses an explicit conversion of the pointer to the type "(void*)". We don't know what made the programmer write this code. The meaningless "const" qualifier confuses the analyzer: it thinks that the _fread() function will use the 'buf' variable only for reading. Since the 'buf' variable is not initialized, the analyzer generates the warning.
The code works, but it cannot be called smart. It should be rewritten: first, it will become shorter and clearer; second, it will stop triggering the V614 warning.
This is the fixed code:
virtual size_t _fread(void *ptr, size_t bytes){
size_t ret = ::fread(ptr, 1, bytes, fp);
if(ret < bytes)
failbit = true;
return ret;
}There's another situation where V614 may look like a false alarm. Look at the following synthetic example:
std::shared_ptr<foo> GetFoo()
{
std::shared_ptr<foo> Bar;
return Bar; // V614
}In this code fragment, the 'Bar' smart pointer of the 'std::shared_ptr' type is created. The default constructor is called for this smart pointer. Thus, 'Bar' is always initialized with 'nullptr'. The analyzer considers it dangerous to use smart pointers created by the default constructor. Still, we can write the code this way. There are several ways to suppress such analyzer warnings.
We can fix the code like this:
std::shared_ptr<foo> GetFoo()
{
std::shared_ptr<foo> Bar { nullptr };
return Bar; // no V614
}This code fragment is more readable. We see that the 'GetFoo' function returns an object of the 'std::shared_ptr' type, which contains a null pointer. In this case, a reviewer will expect the 'GetFoo' function to return the null pointer. This code fragment also gives a sign to the analyzer that everything's fine, and the null pointer is returned deliberately.
However, if the analyzer issues a lot of such warnings on the code and you don't want to see them, you can use the following comment:
//-V614_IGNORE_SMART_POINTERSThis comment should be written to the header file included in all other files. For example, "stdafx.h" can be such a file. If you write this comment to the "*.c" or "*.cpp" file, the comment will apply only to this file.
Otherwise, you can suppress false positive warnings.
This diagnostic is classified as:
You can look at examples of errors detected by the V614 diagnostic. |
V615. Suspicious explicit conversion from 'float *' type to 'double *' type.
The analyzer has detected an odd pointer type conversion. Among such strange cases are situations when programmers try to cast a float-pointer to a double-pointer or vice versa. The point is that float and double types have different sizes and this type conversion most likely indicates an error.
Consider a simplest example:
float *A;
double* B = (double*)(A);Incompatibility between the sizes of the types being cast causes 'B' to point to a number format incorrect for the double type. Such pointer type conversion errors occur because of misprints or through inattention. For example, it may appear that a different data type or a different pointer should be used in such a code fragment.
This is the correct code:
double *A;
double* B = A;This diagnostic is classified as:
|
You can look at examples of errors detected by the V615 diagnostic. |
V616. Use of 'Foo' named constant with 0 value in bitwise operation.
The analyzer has detected use of a zero constant in the bitwise operation AND (&). The result of such an expression is always zero. It may lead to an incorrect logic of program execution when such an expression is used in conditions or loops.
Consider a simplest example:
enum { FirstValue, SecondValue };
int Flags = GetFlags();
if (Flags & FirstValue)
{...}The expression in the 'if' operator's condition always equals zero. It causes an incorrect logic of program execution. Errors related to using zero constants in bitwise operations usually occur because of misprints or incorrect constant declaration. For example, it may appear that another constant should be used in such a fragment. This is the correct code:
enum { FirstValue, SecondValue };
int Flags = GetFlags();
if (Flags & SecondValue)
{...}Another correct variant of this code is the following sample where the constant is declared as a non-zero constant. For example:
enum { FirstValue = 1, SecondValue };
int Flags = GetFlags();
if (Flags & FirstValue)
{...}This diagnostic is classified as:
You can look at examples of errors detected by the V616 diagnostic. |
V617. Argument of the '|' bitwise operation always contains non-zero value. Consider inspecting the condition.
The analyzer has detected use of a non-zero constant in the bitwise operation OR (|). The result of this expression is always a non-zero value. It may cause incorrect logic of program execution when such an expression is used in conditions or loops.
Consider a simplest example:
enum { FirstValue, SecondValue };
int Flags = GetFlags();
if (Flags | SecondValue)
{...}The expression in the 'if' operator's condition is always true. Errors related to using non-zero constants in bitwise operations occur because of misprints. For example, it may appear that another bitwise operation, for example &, should be used in such a fragment. This is the correct code:
enum { FirstValue, SecondValue };
int Flags = GetFlags();
if (Flags & SecondValue)
{...}Consider a code sample the analyzer has found in one real application:
#define PSP_HIDEHEADER 0x00000800
BOOL CResizablePageEx::NeedsRefresh(....)
{
if (m_psp.dwFlags | PSP_HIDEHEADER)
return TRUE;
...
return
CResizableLayout::NeedsRefresh(layout, rectOld, rectNew);
}It's obvious that the 'if' operator will always execute the 'return TRUE;' branch, which is incorrect. This is the fixed code:
#define PSP_HIDEHEADER 0x00000800
BOOL CResizablePageEx::NeedsRefresh(....)
{
if (m_psp.dwFlags & PSP_HIDEHEADER)
return TRUE;
...
return
CResizableLayout::NeedsRefresh(layout, rectOld, rectNew);
}This diagnostic is classified as:
You can look at examples of errors detected by the V617 diagnostic. |
V618. Dangerous call of 'Foo' function. The passed line may contain format specification. Example of safe code: printf("%s", str);
The analyzer has detected that a formatted output function call might cause an incorrect result. Moreover, such a code can be used for an attack (see this article for details).
The string is output directly without using the "%s" specifier. As a result, if there is a command character added into the string accidentally or deliberately, it will cause a program failure. Consider a simplest example:
char *p;
...
printf(p);The call of the printf(p) function is incorrect, as there is no format string of the "%s" kind. If there are format specifications to be found in the 'p' string, this output will be most likely incorrect. The following code is safe:
char *p;
...
printf ("%s", p);The V618 warning might seem insignificant. But actually this is a very important thing when creating quality and safe programs.
Keep in mind that you may come across format specifications (%i, %p and so on) in a string quite unexpectedly. It may occur accidentally when user inputs incorrect data. It may also occur deliberately when incorrect data are input consciously. Absence of the "%s" specifier may cause program crash or output of private data somewhere outside the program. Before you turn off the V618 diagnostic, we insist that you read the article "Wade not in unknown waters. Part two". Corrections to the code you'll have to make will be too few to ignore this type of defects.
Note. The analyzer tries not to generate the V618 warning when a function call cannot have any bad consequences. Here is an example when the analyzer won't show you the warning:
printf("Hello!");This diagnostic is classified as:
|
You can look at examples of errors detected by the V618 diagnostic. |
V619. Array is used as pointer to single object.
The analyzer has detected that the '->' operator is applied to a variable defined as a data array. Such a code might indicate incorrect use of data structures leading to incorrect filling of the structure fields.
Consider a sample of incorrect code:
struct Struct {
int r;
};
...
Struct ms[10];
for (int i = 0; i < 10; i++)
{
ms->r = 0;
...
}Using it in this way is incorrect, as only the first array item will be initialized. Perhaps there is a misprint here or some other variable should be used. This is the correct code:
Struct ms[10];
for (int i = 0; i < 10; i++)
{
ms[i].r = 0;
...
}This diagnostic is classified as:
|
You can look at examples of errors detected by the V619 diagnostic. |
V620. Expression of sizeof(T)*N kind is summed up with pointer to T type. Consider inspecting the expression.
The analyzer has detected that a variable of the pointer type is added to an expression containing the sizeof(T) operator. Using the operator in such a way might indicate incorrect address arithmetic.
Consider a simplest example:
int *p;
size_t N = 5;
...
p = p + sizeof(int)*N;This use is incorrect. It is expected that we will move by N items in the data structure. Instead, a 20-item shift occurs, as sizeof(int) value is 4 in 32-bit programs. As a result, we'll get the following: "p = p + 20;". Perhaps there is a misprint or other mistake. This is the correct code:
int *p;
size_t N = 5;
...
p = p + N;Note. The analyzer considers the code correct if the char type is being handled in it. Consider a sample where the analyzer won't generate the warning:
char *c;
size_t N = 5;
...
c = c + sizeof(float)*N;This diagnostic is classified as:
|
You can look at examples of errors detected by the V620 diagnostic. |
V621. Loop may execute incorrectly or may not execute at all. Consider inspecting the 'for' operator.
The analyzer has detected a potential error: odd initial and finite counter values are used in the 'for' operator. It may cause incorrect loop execution and break the program execution logic.
Consider the following example:
signed char i;
for (i = -10; i < 100; i--)
{
...
};Perhaps there is a misprint here causing the initial and finite values to be mixed up. The error may also occur if operators '++' and '--' are mixed up.
This is the correct code:
for (i = -10; i < 100; i++)
{
...
};The following code is also correct:
for (i = 100; i > -10; i--)
{
...
};Consider the following code sample found by the analyzer in a real application:
void CertificateRequest::Build()
{
...
uint16 authCount = 0;
for (int j = 0; j < authCount; j++) {
int sz = REQUEST_HEADER + MIN_DIS_SIZE;
...
}
}The 'authCount' variable is initialized by an incorrect value or perhaps there is even some other variable to be used here.
This diagnostic is classified as:
|
You can look at examples of errors detected by the V621 diagnostic. |
V622. First 'case' operator may be missing. Consider inspecting the 'switch' statement.
The analyzer has detected a potential error: the first operator in the 'switch' operator's block is not the 'case' operator. It causes the code fragment never to get control.
Consider this example:
char B = '0';
int I;
...
switch(I)
{
B = '1';
break;
case 2:
B = '2';
break;
default:
B = '3';
break;
}Assignment "B = '1';" will never be performed. This is the correct code:
switch(I)
{
case 1:
B = '1';
break;
case 2:
B = '2';
break;
default:
B = '3';
break;
}This diagnostic is classified as:
|
You can look at examples of errors detected by the V622 diagnostic. |
V623. Temporary object is created and then destroyed. Consider inspecting the '?:' operator.
The analyzer has detected a possible error occurring when handling the ternary operator '?:'. If, while handling the '?:' operator, an object of the class type and any other type which can be cast to this class are used together, temporary objects are created. The temporary objects will be destroyed after exiting the '?:' operator. An error occurs if we save the result into a pointer-variable in this case.
Consider this example:
CString s1(L"1");
wchar_t s2[] = L"2";
bool a = false;
...
const wchar_t *s = a ? s1 : s2;The result of executing this code is the 's' variable pointing to the data stored inside a temporary object. The trouble is that this object is already destroyed!
This is the correct code:
wchar_t s1[] = L"1";
wchar_t s2[] = L"2";
bool a = false;
...
const wchar_t *s = a ? s1 : s2;This is another code variant which is correct too:
CString s1(L"1");
wchar_t s2[] = L"2";
bool a = false;
...
CString s = a ? s1 : s2;The V623 warning demands better attention from the programmer. The trouble is that errors of this type can hide very well. A code containing such errors may work successfully for many years. However, it's only an illusion of correct operation. Actually it is the released memory which is being used. The fact that there are correct data in memory is just a matter of luck. The program behavior can change any moment. It can occur as you switch to another compiler version, or after code refactoring, or when a new object appears which uses the same memory area. Let's study this by example.
Let's write, compile and run the following code:
bool b = false;
CComBSTR A("ABCD");
wchar_t *ptr = b ? A : L"Test OK";
wcout << ptr << endl;This code was compiled with Visual Studio 2010 and it printed "Test OK". It seems to be working well. But let's edit the code a bit:
bool b = false;
CComBSTR A("ABCD");
wchar_t *ptr = b ? A : L"Test OK";
wchar_t *tmp = b ? A : L"Error!";
wcout << ptr << endl;It seems that the string where the 'tmp' variable is being initialized won't change anything. But it's not true. The program now prints the text: "Error!".
The point is that the new temporary object was using the same memory area as the previous one. By the way, note that this code can work quite successfully in certain circumstances. Everything depends on luck and phase of Moon. It's impossible to predict where temporary objects will be created, so don't refuse fixing the code proceeding from the idea "this code has been working right for several years, so it has no errors".
This diagnostic is classified as:
|
You can look at examples of errors detected by the V623 diagnostic. |
V624. Use of constant NN. The resulting value may be inaccurate. Consider using the M_NN constant from <math.h>.
The analyzer has detected a potential error occurring when handling constants of the double type. Perhaps poor accuracy constants are used for mathematical calculations or a constant is written with a misprint.
Consider this sample:
double pi = 3.141592654;This way of writing the constant is not quite correct and you'd better use mathematical constants from the header file 'math.h'. This is the correct code:
#include <math.h>
...
double pi = M_PI;The analyzer doesn't show the warning when constants are written explicitly in the 'float' format. It is determined by the fact that the 'float' type has fewer significant digits than the 'double' type. Here is an example:
float f = 3.14159f; //okThis diagnostic is classified as:
You can look at examples of errors detected by the V624 diagnostic. |
V625. Initial and final values of the iterator are the same. Consider inspecting the 'for' operator.
The analyzer has detected a potential error: initial and finite counter values coincide in the 'for' operator. Using the 'for' operator in such a way will cause the loop to be executed only once or not be executed at all.
Consider the following example:
void beginAndEndForCheck(size_t beginLine, size_t endLine)
{
for (size_t i = beginLine; i < beginLine; ++i)
{
...
}The loop body is never executed. Most likely, there's a misprint and "i < beginLine" should be replaced with the correct expression "i < endLine". This is the correct code:
for (size_t i = beginLine; i < endLine; ++i)
{
...
}Another example:
for (size_t i = A; i <= A; ++i)
...This loop's body will be executed only once. This is hardly what the programmer intended.
This diagnostic is classified as:
You can look at examples of errors detected by the V625 diagnostic. |
V626. It's possible that ',' should be replaced by ';'. Consider checking for typos.
The analyzer has detected a potential error: comma ',' is written by accident instead of semicolon ';'. This misprint can lead to an incorrect logic of program execution.
Consider an example:
int a;
int b;
...
if (a == 2)
a++,
b = a;This code will result in executing the "b = a;" expression only when the 'if' operator's condition holds. This is most likely a misprint and ',' should be replaced with ';'. This is the correct code:
if (a == 2)
a++;
b = a;The analyzer won't generate the message if formatting of a code fragment demonstrates deliberate use of the ',' operator. Here is a code sample:
if (a == 2)
a++,
b = a;
if (a == 2)
a++, b = a;This diagnostic is classified as:
You can look at examples of errors detected by the V626 diagnostic. |
V627. Argument of sizeof() is a macro, which expands to a number. Consider inspecting the expression.
The analyzer has detected a potential error: a macro expanding into a number serves as an argument for the 'sizeof' operator. Using the operator in such a way can cause allocation of memory amount of incorrect size or other defects.
Consider an example:
#define NPOINT 100
...
char *point = (char *)malloc(sizeof(NPOINT));Executing this code will result in allocation of insufficient memory amount. This is the correct code:
#define NPOINT 100
...
char *point = (char *)malloc(NPOINT);This diagnostic is classified as:
You can look at examples of errors detected by the V627 diagnostic. |
V628. It is possible that a line was commented out improperly, thus altering the program's operation logic.
The analyzer has detected a potential error: two 'if' operators in a row are divided by a commented out line. It's highly probable that a code fragment was commented carelessly. The programmer's carelessness has caused a significant change of the program execution logic.
Consider this sample:
if(!hwndTasEdit)
//hwndTasEdit = getTask()
if(hwndTasEdit)
{
...
}The program has become meaningless. The condition of the second 'if' operator never holds. This is the correct code:
//if(!hwndTasEdit)
//hwndTasEdit = getTask()
if(hwndTasEdit)
{
...
}The analyzer doesn't generate the warning for code where code formatting demonstrates deliberate use of two 'if' operators in a row divided by a comment line. Here is an example:
if (Mail == ready)
// comment
if (findNewMail)
{
...
}This diagnostic is classified as:
|
You can look at examples of errors detected by the V628 diagnostic. |
V629. Bit shifting of the 32-bit value with a subsequent expansion to the 64-bit type. Consider inspecting the expression.
The analyzer has detected a potential error in an expression containing a shift operation: a 32-bit value is shifted in the program. The resulting 32-bit value is then explicitly or implicitly cast to a 64-bit type.
Consider an example of incorrect code:
unsigned __int64 X;
X = 1u << N;This code causes undefined behavior if the N value is higher than 32. In practice, it means that you cannot use this code to write a value higher than 0x80000000 into the 'X' variable.
You can fix the code by making the type of the left argument 64-bit.
This is the correct code:
unsigned __int64 X;
X = 1ui64 << N;Note that the V629 diagnostic doesn't refer to 64-bit errors. By 64-bit errors those cases are meant when the 32-bit version of a program works correctly, while the 64-bit version doesn't.
The case we consider here causes an error both in the 32-bit and 64-bit versions. That's why the V629 diagnostic refers to general analysis rules.
The analyzer will not generate the warning if the result of an expression with the shift operation fits into a 32-bit type. It means that significant bits don't get lost and the code is correct.
This is an example of safe code:
char W = 7;
long long Q = W << 10;The code works in the following way. At first, the 'W' variable is extended to the 32-bit 'int' type. Then a shift operation is performed and we get the value 0x00001C00. This number fits into a 32-bit type, which means that no error occurs. At the last step this value is extended to the 64-bit 'long long' type and written into the 'Q' variable.
This diagnostic is classified as:
|
You can look at examples of errors detected by the V629 diagnostic. |
V630. The 'malloc' function is used to allocate memory for an array of objects that are classes containing constructors/destructors.
The analyzer has detected a potential error caused by using one of the dynamic memory allocation functions such as malloc, calloc, realloc. The allocated memory is being handled as an object array that has a constructor or a destructor. When memory is allocated for the class in this way, the code does not call the constructor. When memory is released through the 'free()' function, the code does not call the destructor. This is quite odd: such a code might cause handling uninitialized variables and other errors.
Consider an example of incorrect code:
class CL
{
int num;
public:
CL() : num(0) {...}
...
};
...
CL *pCL = (CL*)malloc(sizeof(CL) * 10);As a result, the 'num' variable won't be initialized. Of course, you can call the constructor for each object "manually", but a more correct way is to use the 'new' operator.
This is the fixed code:
CL *pCL = new CL[10];This diagnostic is classified as:
|
You can look at examples of errors detected by the V630 diagnostic. |
V631. Defining absolute path to file or directory is considered a poor coding style. Consider inspecting the 'Foo' function call.
The analyzer has detected a potential error that occurs when calling a function intended to handle files. An absolute path to a file or directory is passed into a function in one of the actual arguments. Using a function in such a way is dangerous, as there may be cases that this path doesn't exist on the user's computer.
Consider an example of incorrect code:
FILE *text = fopen("c:\\TEMP\\text.txt", "r");A better way is to get the path to a file on certain conditions.
This is the correct code:
string fullFilePath = GetFilePath() + "text.txt";
FILE *text = fopen(fullFilePath.c_str(), "r");This diagnostic is classified as:
You can look at examples of errors detected by the V631 diagnostic. |
V632. Argument is of the 'T' type. Consider inspecting the NN argument of the 'Foo' function.
The analyzer has detected a potential error: an odd argument is passed into a function. An argument having the format of a floating-point number has been passed into a function, although it was awaiting an integer type. It is incorrect because the argument value will be cast to an integer type.
Consider the following sample:
double buf[N];
...
memset(buf, 1.0, sizeof(buf));The programmer intended to fill the array with values '1.0'. But this code will fill the array with garbage.
The second argument of the 'memset' function has an integer type. This argument defines the value to fill each byte of the array with.
Value '1.0' will be cast to the integer value '1'. The 'buf' data array will be filled byte-by-byte with "one" values. This result is different from what we get when filling each array item with value '1.0'.
This is the fixed code:
double buf[N];
...
for (size_t i = 0; i != N; ++i)
buf[i] = 1.0;This diagnostic is classified as:
|
V633. The '!=' operator should probably be used here. Consider inspecting the expression.
The analyzer has detected a potential error. The '!=' or '==!' operator should be probably used instead of the '=!' operator. Such errors most often occur through misprints.
Consider an example of incorrect code:
int A, B;
...
if (A =! B)
{
...
}It's most probably that this code should check that the 'A' variable is not equal to 'B'. If so, the correct code should look like follows:
if (A != B)
{
...
}The analyzer accounts for formatting in the expression. That's why if it is exactly assignment you need to perform - not comparison - you should specify it through parentheses or blanks. The following code samples are considered correct:
if (A = !B)
...
if (A=(!B))
...This diagnostic is classified as:
|
V634. Priority of '+' operation is higher than priority of '<<' operation. Consider using parentheses in the expression.
The analyzer has detected a potential error occurring because of the addition, subtraction, division and multiplication operations having a higher priority than the shift operation. Programmers often forget about this, which sometimes causes an expression to have quite a different result than they expect.
Consider an example of incorrect code:
int X = 1<<4 + 2;The programmer most likely expected that the result of shifting '1' by '4' would be added to '2'. But according to operation priorities in C/C++, addition is performed first and shifting is performed after that.
We can recommend you to write parentheses in all expressions containing operators that you use rarely. Even if some of these parentheses turn out to be unnecessary, it's OK. On the other hand, your code will become more readable and comprehensible and less error-prone.
This is the correct code:
int X = (1<<4) + 2;How to remove a false warning if it is really that very sequence of calculations you intended: addition first, then the shift?
There are 3 ways to do it:
1) The worst way. You can use the "//-V634" comment to suppress the warning in a certain line.
int X = 1<<4 + 2; //-V6342) You can add additional parentheses:
int X = 1<<(4 + 2);3) You can specify your intention using blanks:
int X = 1 << 4+2;References:
- Terminology. Operation priorities in C/C++. http://www.viva64.com/en/t/0064/
This diagnostic is classified as:
|
You can look at examples of errors detected by the V634 diagnostic. |
V635. Length should be probably multiplied by sizeof(wchar_t). Consider inspecting the expression.
The analyzer has detected a potential error: a memory amount of incorrect size is allocated to store a string in the UNICODE format.
This error usually occurs when the 'strlen' or 'wcslen' function is used to calculate an array size. Programmers often forget to multiply the resulting number of characters by sizeof(wchar_t). As a result, an array overrun may occur.
Consider an example of incorrect code:
wchar_t src[] = L"abc";
wchar_t *dst = (wchar_t *)malloc(wcslen(src) + 1);
wcscpy(dst, src);In this case, it's just 4 bytes that will be allocated. Since the 'wchar_t' type's size is 2 or 4 bytes depending on the data model, this memory amount may appear insufficient. To correct the mistake you should multiply the expression inside 'malloc' by 'sizeof(wchar_t)'.
This is the correct code:
wchar_t *dst =
(wchar_t *)malloc((wcslen(src) + 1) * sizeof(wchar_t));This diagnostic is classified as:
|
You can look at examples of errors detected by the V635 diagnostic. |
V636. Expression was implicitly cast from integer type to real type. Consider using an explicit type cast to avoid overflow or loss of a fractional part.
An expression contains a multiplication or division operation over integer data types. The resulting value is implicitly cast to a floating-point type. When detecting this, the analyzer warns you about a potential error that may cause an overflow or calculation of an incorrect result.
Below are examples of possible errors.
Case one. Overflow.
int LX = 1000;
int LY = 1000;
int LZ = 1000;
int Density = 10;
double Mass = LX * LY * LZ * Density;We want to calculate an object's mass relying on its density and volume. We know that the resulting value may be a large one. That's why we declare the 'Mass' variable as the 'double' type. But this code doesn't take into account that there are variables of the 'int' type which are multiplied. As a result, we'll get an integer overflow in the right part of the expression and the result will be incorrect.
There are two ways to fix the issue. The first way is to change the variables' types:
double LX = 1000.0;
double LY = 1000.0;
double LZ = 1000.0;
double Density = 10.0;
double Mass = LX * LY * LZ * Density;The second way is to use an explicit type conversion:
int LX = 1000;
int LY = 1000;
int LZ = 1000;
int Density = 10;
double Mass = (double)(LX) * LY * LZ * Density;We can cast only the first variable to the 'double' type - that'll be enough. Since the multiplication operation refers to left-associative operators, calculation will be executed in the following way: (((double)(LX) * LY) * LZ) * Density. Consequently, each of the operands will be cast to the 'double' type before multiplication and we will get a correct result.
P.S. Let me remind you that it will be incorrect if you try to solve the issue in the following way: Mass = (double)(ConstMass) + LX * LY * LZ * Density. The expression to the right of the '=' operator will have the 'double' type, but it's still variables of the 'int' type that will be multiplied.
Case two. Loss of accuracy.
int totalTime = 1700;
int operationNum = 900;
double averageTime = totalTime / operationNum;The programmer may be expecting that the 'averageTime' variable will have value '1.888(8)', but the result will equal '1.0' when executing the program. It happens because the division operation is performed over integer types and only then is cast to the floating-point type.
Like in the previous case, we may fix the error in two ways.
The first way is to change the variables' types:
double totalTime = 1700;
double operationNum = 900;
double averageTime = totalTime / operationNum;The second way is to use an implicit type conversion.
int totalTime = 1700;
int operationNum = 900;
double averageTime = (double)(totalTime) / operationNum;Note
Certainly, in some cases it's exactly division of integers that you need to execute. In such cases you can use the following comment to suppress false positives:
//-V636See also: Documentation. Suppression of false alarms.
This diagnostic is classified as:
|
You can look at examples of errors detected by the V636 diagnostic. |
V637. Use of two opposite conditions. The second condition is always false.
The analyzer has detected a potential logic error in the program. The error is this: two conditional operators in a sequence contain mutually exclusive conditions.
Here are examples of mutually exclusive conditions:
- 'A == B' and 'A != B';
- 'B < C' and 'B > C';
- 'X == Y' and 'X < Y';
- etc.
This error usually occurs as a consequence of a misprint or poor refactoring. As a result, program execution logic is violated.
Consider an example of incorrect code:
if (A == B)
if (B != A)
B = 5;In this case, the "B = 5;" statement will never be executed. Most likely, an incorrect variable is used in the first or in the second condition. We need to find out the program execution logic.
This is the fixed code:
if (A == B)
if (B != C)
B = 5;This diagnostic is classified as:
You can look at examples of errors detected by the V637 diagnostic. |
V638. Terminal null is present inside a string. Use of '\0xNN' characters. Probably meant: '\xNN'.
The analyzer has detected a potential error: there is a terminal null character inside a string.
This error usually occurs through a misprint. For example, the "\0x0A" sequence is considered by the program as a sequence of four bytes: { '\0', 'x', '0', 'A' }.
If you want to define the character code in the hexadecimal form, the 'x' character should stand right after the '\' character. If you write "\0", the program will consider it as zero (in the octal format). See also:
- MSDN. C Character Constants.
- MSDN. Escape Sequences.
Consider an example of incorrect code:
const char *s = "string\0x0D\0x0A";If you try to print this string, the control characters intended to translate the string will not be used. The output functions will stop at the line-end character '\0'. To fix this bug you should replace "\0x0D\0x0A" with "\x0D\x0A".
This is the fixed code:
const char *s = "string\x0D\x0A";This diagnostic is classified as:
You can look at examples of errors detected by the V638 diagnostic. |
V639. One of closing ')' parentheses is probably positioned incorrectly. Consider inspecting the expression for function call.
The analyzer has detected a potential error: a suspicious function call is present which is followed by commas and expressions. Perhaps these expressions should be part of the function call.
This error usually occurs if a function is called inside a conditional operator and the function has arguments by default. In this case you may easily make a mistake writing a closing parenthesis in a wrong place. What is dangerous about these errors is that the code is compiled and executed without errors. Consider the following sample of incorrect code:
bool rTuple(int a, bool Error = true);
....
if (rTuple(exp), false)
{
....
}The closing parenthesis put in a wrong place will cause two errors at once:
1) The 'Error' argument will equal 'true' when calling the 'rTuple' function, though the programmer meant it to be 'false'.
2) The comma operator ',' returns the value of the right part. It means that the (rTuple(exp), false) condition will always be 'false'
This is the fixed code:
if (rTuple(exp, false))
{
....
}This diagnostic is classified as:
|
You can look at examples of errors detected by the V639 diagnostic. |
V640. Code's operational logic does not correspond with its formatting.
The analyzer has detected a potential error: code formatting following a conditional operator doesn't correspond to the program execution logic. It's highly probable that opening and closing curly brackets are missing.
Consider the following sample of incorrect code:
if (a == 1)
b = c; d = b;In this case, the 'd = b;' assignment will be executed all the time regardless of the 'a == 1' condition.
If the code contains a mistake, it can be fixed through adding curly brackets. This is the fixed code:
if (a == 1)
{ b = c; d = b; }Another example of incorrect code:
if (a == 1)
b = c;
d = b;To fix the error here, we should use curly brackets too. This is the fixed code:
if (a == 1)
{
b = c;
d = b;
}If the code is correct, it should be formatted in the following way, for the V640 warning not to be generated:
if (a == 1)
b = c;
d = b;This type of errors can be often seen in programs that actively use macros. Consider the following error found in one real application:
#define DisposeSocket(a) shutdown(a, 2); closesocket(a)
...
if (sockfd > 0)
(void) DisposeSocket(sockfd);The call of the 'closesocket(a);' function will be executed all the time. This will lead to a fault if the 'sockfd' variable is <= 0.
The error can be fixed by using curly brackets in the macro. But you'd better create a full-fledged function: code without macros is safer and more convenient to debug.
This is what the correct code may look like:
inline void DisposeSocket(int a) {
shutdown(a, 2);
closesocket(a);
}
...
if (sockfd > 0)
DisposeSocket(sockfd);This diagnostic is classified as:
|
You can look at examples of errors detected by the V640 diagnostic. |
V641. Buffer size is not a multiple of element size.
The analyzer has detected a potential error that has to do with casting a pointer to a buffer to a pointer to a different type, while the size of the original buffer is not a multiple of the size of a single element of the resulting type. We will discuss two patterns of type casting mistakes.
The first pattern has to do with allocating memory of incorrect size for storage of array elements using functions 'malloc', 'calloc', 'alloca', 'realloc', etc.
Such errors typically occur when the size of the allocated memory is specified by a constant (or constants in case of 'calloc'). To ensure correct allocation of memory for 'N' elements of an array of type 'T', we recommend using the 'sizeof(T)' operator. Depending on the function used for memory allocation, the pattern of the construct may look like this:
int *p = (int*)malloc(N * sizeof(int));or like this:
int *p = (int*)calloc(N, sizeof(int));Incorrect memory allocation may result in an array overrun.
Consider the following example of incorrect code with the 'malloc' function:
int *p = (int*)malloc(70);The function will allocate 70 bytes. An attempt to access the 'p[17]' element will result in undefined behavior due to an array overrun (the program needs 72 bytes to read the 18th element correctly). This is what the correct version looks like:
p = (int*)malloc(72);Another possible situation is allocating memory for 70 elements. In this case, the fixed code should look like this:
p = (int*)malloc(70 * sizeof(int));The following example, taken from real code, uses the 'calloc' function:
int data16len = MultiByteToWideChar(CP_UTF8,
0,
data,
datalen,
NULL,
0);
if (!data16)
{
data16 = (wchar_t*)calloc(data16len + 1, 1);
}
MultiByteToWideChar(CP_UTF8, 0, data, -1, data16, data16len);In this case, the programmer intended to allocate a buffer to store a wide string converted from a UTF-8 string. However, the size of 'wchar_t' is not 1 byte (it is 2 bytes in Windows and 4 bytes in Linux). The fixed code:
data16 = (wchar_t*)calloc(data16len + 1, sizeof(wchar_t));Note on the 'calloc' function. Although the function prototype follows this pattern:
void* calloc(size_t num, size_t size );some programmers believe that the size of the allocated storage is evaluated by the expression num*size, and will often swap the arguments. Executing such code may result in bugs. This is what the documentation has to say about this: "Due to the alignment requirements, the number of allocated bytes is not necessarily equal to num*size."
The second pattern of errors deals with casting a pointer to an object of type 'A' to a pointer to an object of type 'B'. Consider the following example:
struct A
{
int a, b;
float c;
unsigned char d;
};
struct B
{
int a, b;
float c;
unsigned short d;
};
....
A obj1;
B *obj2 = (B*)&obj1; //V641
std::cout << obj2->d;
....The two structs are different in the last field. The types of 'd' fields of the structs have different size. When casting pointer 'A*' to pointer 'B*', there is a risk of undefined behavior when attempting to access the 'd' field. Note that pointer 'B*' can be cast to pointer 'A*' without undefined behavior (although it will be a bad code).
The analyzer does not issue the warning when pointer 'A*' is cast to pointer 'B*' in case one of the two classes (structures) deriving from the other.
This diagnostic is classified as:
|
You can look at examples of errors detected by the V641 diagnostic. |
V642. Function result is saved inside the 'byte' type variable. Significant bits may be lost. This may break the program's logic.
The analyzer has detected a potential error: a function result is saved into a variable whose size is only 8 or 16 bits. It may be inadmissible for some functions that return a status of the 'int' type: significant bits may get lost.
Consider the following example of incorrect code:
char c = memcmp(buf1, buf2, n);
if (c != 0)
{
...
}The 'memcmp' function returns the following values of the 'int' type:
- < 0 - buf1 less than buf2;
- 0 - buf1 identical to buf2;
- > 0 - buf1 greater than buf2;
Note that "> 0" means any numbers, not 1. It can be 2, 3, 100, 256, 1024, 5555 and so on. It means that this result cannot be stored in a 'char'-variable, as significant bits may be thrown off, which will violate the program execution logic.
What is dangerous about such errors is that the returned value may depend on the architecture and an implementation of a particular function on this architecture. For instance, the program may work correctly in the 32-bit mode and incorrectly in the 64-bit mode.
This is the fixed code:
int c = memcmp(buf1, buf2, n);
if (c != 0)
{
...
}Some of you might think that this danger is farfetched. But this error caused a severe vulnerability in MySQL/MariaDB up to versions 5.1.61, 5.2.11, 5.3.5, 5.5.22. The point is that when a MySQL /MariaDB user logins, the token (SHA of the password and hash) is calculated and compared to the expected value returned by the 'memcmp' function. On some platforms the returned value might fall out of the range [-128..127]. As a result, in 1 case in 256 the procedure of comparing the hash with the expected value always returns 'true' regardless of the hash. It means that an intruder can use a simple bash-command to get root access to the vulnerable MySQL server even if he/she doesn't know the password. This breach is caused by the following code contained in the file 'sql/password.c':
typedef char my_bool;
...
my_bool check(...) {
return memcmp(...);
}This issue is described in more detail here: Security vulnerability in MySQL/MariaDB.
This diagnostic is classified as:
|
You can look at examples of errors detected by the V642 diagnostic. |
V643. Suspicious pointer arithmetic. Value of 'char' type is added to a string pointer.
The analyzer has detected a potential error: incorrect addition of a character constant to a string literal pointer.
This error usually occurs when the programmer tries to unite a string literal with a character.
Consider a simple example of incorrect code:
std::string S = "abcd" + 'x';The programmer expected to get the "abcdx" string, but actually value 120 will be added to the pointer to the "abcd" string. This will surely lead to the string literal overrun. To prevent this bug you should avoid such arithmetic operations over string and character variables.
This is the correct code:
std::string S = std::string("abcd") + 'x';This diagnostic is classified as:
|
You can look at examples of errors detected by the V643 diagnostic. |
V644. Suspicious function declaration. Consider creating a 'T' type object.
The analyzer has detected a potential error: creating an object of the 'T' type in an incorrect way.
This error usually occurs when an argument of a call of a constructor of a certain type is missing. In this case, we'll get a declaration of a function returning the 'T' type instead of creating an object of the type we need. This error usually occurs when using auxiliary classes that simplify mutex locking and unlocking. For example, such is the 'QMutexLocker' class in the 'Qt' library that simplifies handling of the 'QMutex class'.
Consider an example of incorrect code:
QMutex mutex;
...
QMutexLocker lock();
++objectVarCounter;What is dangerous about these errors is that code is compiled and executed without errors. But you won't get the result you need. That is, other threads using the 'objectVarCounter' variable are not locked. That's why such errors take much time and effort to catch.
This is the fixed code:
QMutex mutex;
...
QMutexLocker lock(&mutex);
++objectVarCounter;This diagnostic is classified as:
V645. Function call may lead to buffer overflow. Bounds should not contain size of a buffer, but a number of characters it can hold.
The analyzer detected a potential error related to string concatenation. An error can cause buffer overflow. A program may run consistently for a long time if only short strings come to input. This makes such errors nasty.
Functions like 'strncat', 'wcsncat' and others [1] are subject to this type of vulnerability.
'strncat' function description:
char *strncat(
char *strDest,
const char *strSource,
size_t count
);Where:
- 'destination' - desnination string;
- 'source' - source string;
- 'count' - maximum number of characters you can add.
The 'strncat' function is perhaps one of the most dangerous string functions. Its working principle differs from the way programmers imagine it.
The third argument does not specify the size of the buffer—it indicates the number of characters that you can place in it. MSDN describes this function as follows: "strncat does not check for sufficient space in strDest; it is therefore a potential cause of buffer overruns. Keep in mind that count limits the number of characters appended; it is not a limit on the size of strDest."
Developers often forget this and use 'strncat' in wrong ways. 3 types of common mistakes:
1) Developers think that the 'count' argument is the size of the 'strdest' buffer. This misunderstanding results in incorrect code, as follows:
char newProtoFilter[2048] = "....";
strncat(newProtoFilter, szTemp, 2048);
strncat(newProtoFilter, "|", 2048);The author passes 2048 as the third argument. The developer mistakes to believe that it protects the code from overflow. That's not the case. In fact, this indicates that we can add up to 2048 characters to the string!
2) Developers forget that the 'strncat' function will add terminal 0 after copying characters. Example of dangerous code:
char filename[NNN];
...
strncat(filename,
dcc->file_info.filename,
sizeof(filename) - strlen(filename));It may seem that the developer has secured from 'filename' buffer overflow. That's not true. The code author subtracted the length of the string from the array size. If the entire string is already filled, the expression 'sizeof (filename) - strlen(filename)' will return 1. As a result, one more character will be added to the string, and the terminal null will be written outside the buffer boundary.
This simple example explains the mistake:
char buf[5] = "ABCD";
strncat(buf, "E", 5 - strlen(buf));There is no room for new characters in the buffer anymore. It contains 4 characters and the terminal null. The expression "5 - strlen(buf)" equals 1. strncpy() will copy "E" to the last element of the 'buf' array. Terminal 0 will be written outside the buffer!
3) Developers forget the integer overflow factor. Look at this error example:
struct A
{
....
char consoleText[512];
};
void foo(A a)
{
char inputBuffer[1024];
....
strncat(a.consoleText, inputBuffer,
sizeof(a.consoleText) - strlen(a.consoleText) - 5);
}Here, an infix expression is used as the third argument. Once reviewed heedlessly, the value of the expression "sizeof(a.consoleText) - strlen(a.consoleText) – 5" lies in the range [0, 507], and the code is correct. But that's not so.
- The result of the 'strlen (A.Consoletext)' function can be in the range [0, 511].
- If 'strlen(a.consoleText)' returns a value from 0 to 507, the resulting expression value will also be in the range [0, 507]. 'a.consoleText' buffer overflow will not happen.
- If 'strlen(a.consoleText)' returns a value from 508 to 511, an unsigned overflow will occur in the resulting expression. If the type 'size_t' is 64-bit size, we'll get the range [0xFFFFFFFFFFFFFFFC, 0xFFFFFFFFFFFFFFFF] accordingly. It's like you can write a huge number of characters into the buffer. Obviously, that's not the case. Eventually, we get the 'a.consoleText' buffer overflow.
Fixed versions of the above examples:
// Sample N1
char newProtoFilter[2048] = "....";
strncat(newProtoFilter, szTemp,
2048 - 1 - strlen(newProtoFilter));
strncat(newProtoFilter, "|",
2048 - 1 - strlen(newProtoFilter));
// Sample N2
char filename[NNN];
...
strncat(filename,
dcc->file_info.filename,
sizeof(filename) - strlen(filename) - 1);
// Sample N3
void foo(A a)
{
char inputBuffer[1024];
....
size_t textSize = strlen(a.consoleText);
if (sizeof(a.consoleText) - textSize > 5u)
{
strncat(a.consoleText, inputBuffer,
sizeof(a.consoleText) - textSize - 5);
}
else
{
// ....
}
}This code is not readable or truly safe. A much better solution would be to avoid the use of 'strncat' functions in favor of more secure ones. For example, one can use the 'std::string' class or functions such as 'strncat_s', and others [2].
Resources
- MSDN. strncat, _strncat_l, wcsncat, wcsncat_l, _mbsncat _mbsncat_l
- MSDN. strncat_s, _strncat_s_l, wcsncat_s, _wcsncat_s_l, _mbsncat_s, _mbsncat_s_l
This diagnostic is classified as:
You can look at examples of errors detected by the V645 diagnostic. |
V646. The 'else' keyword may be missing. Consider inspecting the program's logic.
The if operator is located in the same line as the closing parenthesis referring to the previous if. Perhaps, the key word 'else' is missing here, and the program works in a different way than expected.
Have a look at a simple example of incorrect code:
if (A == 1) {
Foo1(1);
} if (A == 2) {
Foo2(2);
} else {
Foo3(3);
}If the 'A' variable takes value 1, not only the 'Foo1' function will be called, but the 'Foo3' function as well. Note the program execution logic: maybe this is what the programmer actually expects it to do. Otherwise, the key word 'else' should be added.
This is the fixed code:
if (A == 1) {
Foo1(1);
} else if (A == 2) {
Foo2(2);
} else {
Foo3(3);
}The analyzer also considers the code correct when the 'then' part of the first 'if' operator contains the unconditional operator 'return' - because the program execution logic is not broken in this case, while it's just a bit incorrect code formatting. Here is an example of such a code:
if (A == 1) {
Foo1(1);
return;
} if (A == 2) {
Foo2(2);
} else {
Foo3(3);
}If there is no error, the V646 warning can be avoided by moving the 'if' operator onto the next line. For example:
if (A == 1) {
Foo1(1);
}
if (A == 2) {
Foo2(2);
} else {
Foo3(3);
}In the samples cited above, the error is clearly seen and seems improbable to be found in real applications. But if your code is quite complex, it becomes very easy not to notice the missing 'else' operator. Here is a sample of this error taken from a real application:
if( 1 == (dst->nChannels) ) {
ippiCopy_16s_C1MR((Ipp16s*)pDstCh, dstStep,
(Ipp16s*)pDst, dst->widthStep, roi, pMask, roi.width);
} if( 3 == (dst->nChannels) ) { //V646
ippiCopy_16s_C3R((Ipp16s*)pDst-coi, dst->widthStep,
(Ipp16s*)pTmp, dst->widthStep, roi);
ippiCopy_16s_C1C3R((Ipp16s*)pDstCh, dstStep,
(Ipp16s*)pTmp+coi, dst->widthStep, roi);
ippiCopy_16s_C3MR((Ipp16s*)pTmp, dst->widthStep,
(Ipp16s*)pDst-coi, dst->widthStep, roi, pMask, roi.width);
} else {
ippiCopy_16s_C4R((Ipp16s*)pDst-coi, dst->widthStep,
(Ipp16s*)pTmp, dst->widthStep, roi);
ippiCopy_16s_C1C4R((Ipp16s*)pDstCh, dstStep,
(Ipp16s*)pTmp+coi, dst->widthStep, roi);
ippiCopy_16s_C4MR((Ipp16s*)pTmp, dst->widthStep,
(Ipp16s*)pDst-coi, dst->widthStep, roi, pMask, roi.width);
}This code is very hard to read and comprehend. But the analyzer always stays focused.
In this sample, the conditions '3 == (dst->nChannels)' and '1 == (dst->nChannels)' cannot be executed simultaneously, while the code formatting indicates that the key word 'else' is missing. This is what the correct code should look like:
if( 1 == (dst->nChannels) ) {
....
} else if( 3 == (dst->nChannels) ) {
....
} else {
....
}This diagnostic is classified as:
You can look at examples of errors detected by the V646 diagnostic. |
V647. Value of 'A' type is assigned to a pointer of 'B' type.
The analyzer has detected an incorrect pointer operation: an integer value or constant is written into a pointer to the integer type. Either the variable address should be most likely written into the pointer, or the value should be written by the address the pointer refers to.
Consider an example of incorrect code:
void foo()
{
int *a = GetPtr();
int b = 10;
a = b; // <=
Foo(a);
}In this case, value 10 is assigned to the 'a' pointer. We will actually get an invalid pointer. To fix this, we should dereference the 'a' pointer or take the address of the 'b' variable.
This is the fixed code:
void foo()
{
int *a = GetPtr();
int b = 10;
*a = b;
Foo(a);
}The following code variant is correct too:
void foo()
{
int *a = GetPtr();
int b = 10;
a = &b;
Foo(a);
}The analyzer considers it safe when a variable of the pointer type is used to store such magic numbers as -1, 0xcccccccc, 0xbadbeef, 0xdeadbeef, 0xfeeefeee, 0xcdcdcdcd, and so on. These values are often used for the debugging purpose or as special markers.
Note 1
This error is possible only in the C language. In C++, you cannot implicitly cast an integer value to the pointer (except for 0).
Note 2
Sometimes the analyzer's warnings may look strange. Take a look at the following example:
char *page_range_split = strtok(page_range, ",");The analyzer outputs a warning saying that a value of type 'int' is stored into a pointer. But the 'strtok' function returns a pointer, so what's the problem?
The problem is that the declaration of the 'strtok' function may be missing! The programmer may have forgotten to include the corresponding header file. In C, the default return value of functions is of type 'int'. It is based on these assumptions that the code will be compiled. It's a serious defect, which will cause pointer corruption in 64-bit programs. This issue is disucssed in detail in the article "A nice 64-bit error in C".
This diagnostic is classified as:
|
You can look at examples of errors detected by the V647 diagnostic. |
V648. Priority of '&&' operation is higher than priority of '||' operation.
The analyzer has detected a potential error: the priority of the '&&' logical operation is higher than that of the '||' operation. Programmers often forget this, which causes the result of a logical expression using these operations to be quite different from what was expected.
Consider the following sample of incorrect code:
if ( c == 'l' || c == 'L' &&
!( token->subtype & TT_LONG ) )
{ .... }The programmer most likely expected that equality of the 'c' variable and the value 'l' or 'L' would be checked first, and only then the '&&' operation would be executed. But according to the Operation priorities in C/C++, the '&&' operation is executed first, and only then, the '||' operation.
We recommend that you add parentheses in every expression that contains operators you use rarely, or whenever you're not sure about the priorities. Even if parentheses appear to be unnecessary, it's ok. At the same time, you code will become easier to comprehend and less error-prone.
This is the fixed code:
if ( ( c == 'l' || c == 'L' ) &&
!( token->subtype & TT_LONG ) )How to get rid of a false warning in case it was this very sequence you actually intended: first '&&', then '||'?
There are several ways:
1) Bad way. You may add the "//-V648" comment into the corresponding line to suppress the warning.
if ( c == 'l' || c == 'L' && //-V648
!( token->subtype & TT_LONG ) )2) Good way. You may write additional parentheses:
if ( c == 'l' || ( c == 'L' &&
!( token->subtype & TT_LONG ) ) )These will help other programmers understand that the code is correct.
This diagnostic is classified as:
|
You can look at examples of errors detected by the V648 diagnostic. |
V649. Two 'if' statements with identical conditional expressions. The first 'if' statement contains function return. This means that the second 'if' statement is senseless.
The analyzer has detected an issue when the 'then' part of the 'if' operator never gets control. It happens because there is another 'if' before which contains the same condition whose 'then' part contains the unconditional 'return' operator. It may signal both a logical error in the program and an unnecessary second 'if' operator.
Consider the following example of incorrect code:
if (l >= 0x06C0 && l <= 0x06CE) return true;
if (l >= 0x06D0 && l <= 0x06D3) return true;
if (l == 0x06D5) return true; // <=
if (l >= 0x06E5 && l <= 0x06E6) return true;
if (l >= 0x0905 && l <= 0x0939) return true;
if (l == 0x06D5) return true; // <=
if (l >= 0x0958 && l <= 0x0961) return true;
if (l >= 0x0985 && l <= 0x098C) return true;In this case, the 'l == 0x06D5' condition is doubled, and we just need to remove one of them to fix the code. However, it may be that the value being checked in the second case should be different from the first one.
This is the fixed code:
if (l >= 0x06C0 && l <= 0x06CE) return true;
if (l >= 0x06D0 && l <= 0x06D3) return true;
if (l == 0x06D5) return true;
if (l >= 0x06E5 && l <= 0x06E6) return true;
if (l >= 0x0905 && l <= 0x0939) return true;
if (l >= 0x0958 && l <= 0x0961) return true;
if (l >= 0x0985 && l <= 0x098C) return true;The V649 warning may indirectly point to errors of quite a different type. Have a look at this interesting sample:
AP4_Result AP4_StscAtom::WriteFields(AP4_ByteStream& stream)
{
AP4_Result result;
AP4_Cardinal entry_count = m_Entries.ItemCount();
result = stream.WriteUI32(entry_count);
for (AP4_Ordinal i=0; i<entry_count; i++) {
stream.WriteUI32(m_Entries[i].m_FirstChunk);
if (AP4_FAILED(result)) return result;
stream.WriteUI32(m_Entries[i].m_SamplesPerChunk);
if (AP4_FAILED(result)) return result;
stream.WriteUI32(m_Entries[i].m_SampleDescriptionIndex);
if (AP4_FAILED(result)) return result;
}
return result;
}The checks 'if (AP4_FAILED(result)) return result;' in the loop are meaningless. The error is this: the 'result' variable is not changed when reading data from files.
This is the fixed code:
AP4_Result AP4_StscAtom::WriteFields(AP4_ByteStream& stream)
{
AP4_Result result;
AP4_Cardinal entry_count = m_Entries.ItemCount();
result = stream.WriteUI32(entry_count);
for (AP4_Ordinal i=0; i<entry_count; i++) {
result = stream.WriteUI32(m_Entries[i].m_FirstChunk);
if (AP4_FAILED(result)) return result;
result = stream.WriteUI32(m_Entries[i].m_SamplesPerChunk);
if (AP4_FAILED(result)) return result;
result = stream.WriteUI32(m_Entries[i].m_SampleDescriptionIndex);
if (AP4_FAILED(result)) return result;
}
return result;
}This diagnostic is classified as:
|
You can look at examples of errors detected by the V649 diagnostic. |
V650. Type casting is used 2 times in a row. The '+' operation is executed. Probably meant: (T1)((T2)a + b).
The analyzer has detected a potential error in an expression with address arithmetic. Addition/subtraction operations are performed over an expression which is a double type conversion. It may be a misprint: the programmer forgot to put the first type conversion and addition operation into brackets.
Consider an example of incorrect code:
ptr = (int *)(char *)p + offset_in_bytes;The programmer was most likely expecting the 'p' variable to be cast to the 'char *' type, the shift in bytes added to it after that. Then the new pointer was expected to be cast to the 'int *' type.
But the missing parentheses turn this expression into a double type conversion and addition of the shift to the 'int'-pointer. The result will be different from the expected one. Such an error might well cause an array overrun.
This is the fixed code:
ptr = (int *)((char *)p + offset_in_bytes);This diagnostic is classified as:
|
You can look at examples of errors detected by the V650 diagnostic. |
V651. Suspicious operation of 'sizeof(X)/sizeof(T)' kind, where 'X' is of the 'class' type.
The analyzer has detected a potential error in an expression of the 'sizeof(X)/sizeof(X[0])' kind. The strange thing is that the 'X' object is a class instance.
The 'sizeof(X)/sizeof(X[0]) ' is usually used to calculate the number of items in the 'X' array. The error might occur during careless code refactoring. The 'X' variable was an ordinary array at first and was then replaced with a container class, while calculation of the items number remained the same.
Consider an example of incorrect code:
#define countof( x ) (sizeof(x)/sizeof(x[0]))
Container<int, 4> arr;
for( int i = 0; i < countof(arr); i++ )
{ .... }The programmer expected the code to calculate the number of the items of the 'arr' variable. But the resulting value is the class size divided by the size of the 'int'- variable. Most likely, this value is not in any way related to the number of data items being stored in the container.
This is the fixed code:
const size_t count = 4;
Container<int, count> arr;
for( int i = 0; i < arr.size(); i++ )
{ .... }This diagnostic is classified as:
V652. Operation is executed 3 or more times in a row.
The analyzer has detected a potential error: one of the operations '!', '~', '-', or '+' is repeated three or more times. This error may occur because of a misprint. Doubling operators like this is meaningless and may contain an error.
Consider the following sample of incorrect code:
if(B &&
C && !!!
D) { .... }This error must have occurred because of a misprint. For instance, comment delimiters could have been omitted or an odd operator symbol could have been typed.
This is the fixed code:
if (B &&
C && //!!!
D) { .... }The following code variant is correct too:
if (B &&
C && !!D) { .... }This method is often used to cast integer types to the 'bool' type.
This diagnostic is classified as:
You can look at examples of errors detected by the V652 diagnostic. |
V653. Suspicious string consisting of two parts is used for initialization. Comma may be missing.
The analyzer has detected a potential error: two strings are concatenated into one when declaring an array, consisting of string literals. The error may be a consequence of a misprint when a comma is missing between two string literals.
It may stay unnoticed for a long time: for example, it reveals itself on rare occasions when an array of string literals is used to form error messages.
Have a look at an example of incorrect code:
const char *Array [] = {
"Min", "Max", "1",
"Begin", "End" "2" };A comma is missing between the literals "End" and "2"; that's why they will be united into one string literal "End2". To fix it, you should separate the string literals with a comma.
This is the fixed code:
const char *Array [] = {
"Min", "Max", "1",
"Begin", "End", "2" };The analyzer doesn't generate the warning message if the concatenated string appears to be too long (more than 50 characters) or consists of more than two fragments. This method is often used by programmers to format code with long string literals.
This diagnostic is classified as:
You can look at examples of errors detected by the V653 diagnostic. |
V654. Condition of a loop is always true/false.
The analyzer has detected an issue when the condition in the 'for' or 'while' operator is always true or always false. It usually indicates presence of errors. It's highly probable that the programmer made a misprint when writing the code and this fragment should be examined.
Consider an example of incorrect code:
for (i = 0; 1 < 50; i++)
{ .... }There is a misprint there. In the condition, the constant '1' is written instead of the 'i' variable. This code is easy to fix:
for (i = 0; i < 50; i++)
{ .... }The analyzer won't generate the warning message if the condition is defined explicitly as a constant expression '1' or '0', 'true' or 'false'. For example:
while (true)
{ .... }This diagnostic is classified as:
You can look at examples of errors detected by the V654 diagnostic. |
V655. Strings were concatenated but not used. Consider inspecting the expression.
The analyzer has detected a potential error: an unused concatenation of string variables in the code was found. The types of these variables are as follows: std::string, CString, QString, wxString. These expressions most often appear in the code when an assignment operator is missing or as a result of careless code refactoring.
Consider the following sample of incorrect code:
void Foo(std::string &s1, const std::string &s2)
{
s1 + s2;
}The code contains a misprint: '+' is written instead of '+='. The code compiles well but is senseless. This is the fixed code:
void Foo(std::string &s1, const std::string &s2)
{
s1 += s2;
}This diagnostic is classified as:
You can look at examples of errors detected by the V655 diagnostic. |
V656. Variables are initialized through the call to the same function. It's probably an error or un-optimized code.
The analyzer has detected a potential error: two different variables are initialized by the same expression. Only those expressions using function calls are considered dangerous by the analyzer.
Here is the simplest case:
x = X();
y = X();The following three situations are possible:
1) The code has an error, and we should fix the error by replacing 'X()' with 'Y()'.
2) The code is correct but slow. If the 'X()' function requires too many calculations, you'd better replace it with 'y = x;'.
3) The code is correct and fast, or the 'X()' function is reading values from the file. To get rid of false positives produced by the analyzer in this case, we may use the comment "//-V654".
Now let's take a real-life sample:
while (....)
{
if ( strstr( token, "playerscale" ) )
{
token = CommaParse( &text_p );
skin->scale[0] = atof( token );
skin->scale[1] = atof( token );
continue;
}
}There's no error in this code, but it is not the best one. It can be rewritten so that the unnecessary call of the 'atof' function is eliminated. Considering that the assignment operation is inside a loop and can be called many times, this change may give a significant performance gain of the function. This is the fixed code:
while (....)
{
if ( strstr( token, "playerscale" ) )
{
token = CommaParse( &text_p );
skin->scale[1] = skin->scale[0] = atof( token );
continue;
}
}One more sample:
String path, name;
SplitFilename(strSavePath, &path, &name, NULL);
CString spath(path.c_str());
CString sname(path.c_str());We definitely have an error here: the 'path' variable is used twice - to initialize the variables 'spath' and 'sname'. But we can see from the program's logic that the 'name' variable should be used to initialize the 'sname' variable. This is the fixed code:
....
CString spath(path.c_str());
CString sname(name.c_str());This diagnostic is classified as:
You can look at examples of errors detected by the V656 diagnostic. |
V657. Function always returns the same value of NN. Consider inspecting the function.
The analyzer has detected a strange function: it doesn't have any state and doesn't change any global variables. At the same time, it has several return points returning one and the same numerical value.
This code is very odd and might signal a possible error. The function is most likely intended to return different values.
Consider the following simple example:
int Foo(int a)
{
if (a == 33)
return 1;
return 1;
}This code contains an error. Let's change one of the returned values to fix it. You can usually identify the necessary returned values only when you know the operation logic of the whole application in general
This is the fixed code:
int Foo(int a)
{
if (a == 33)
return 1;
return 2;
}If the code is correct, you may get rid of the false positive using the "//-V657" comment.
This diagnostic is classified as:
V658. Value is subtracted from unsigned variable. It can result in an overflow. In such a case, the comparison operation may behave unexpectedly.
The analyzer has detected a potential overrun.
The following operations are executed:
- some value is being subtracted from an unsigned variable;
- the result is compared to a certain value (operators <, <=, >, >= are used).
If an overrun occurs during the subtraction, the check result might be different from what the programmer expects.
Consider the simplest case:
unsigned A = ...;
int B = ...;
if (A - B > 1)
Array[A - B] = 'x';The programmer believes that this check will protect the code against an array overrun. But this check won't help if A < B.
Let A = 3 and B = 5;
Then 0x00000003u - 0x00000005i = FFFFFFFEu
The "A - B" expression has the "unsigned int" type according to the C++ standards. It means that "A - B" will equal FFFFFFFEu. This number is higher than one. As a result, memory outside the array's boundaries will be addressed.
There are two ways to fix the code. First, we may use variables of signed types to participate in calculations:
intptr_t A = ...;
intptr_t B = ...;
if (A - B > 1)
Array[A - B] = 'x';Second, we can change the condition. How exactly it should be done depends on the result we want to get and the input values. If B >= 0, we just need to write the following code:
unsigned A = ...;
int B = ...;
if (A > B + 1)
Array[A - B] = 'x';If the code is correct, you may turn off the diagnostic message for this line using the "//-V658" comment.
This diagnostic is classified as:
|
You can look at examples of errors detected by the V658 diagnostic. |
V659. Functions' declarations with 'Foo' name differ in 'const' keyword only, while these functions' bodies have different composition. It is suspicious and can possibly be an error.
The analyzer has detected two functions with identical names in the code. The functions are different in the constancy parameter.
Function declarations may differ in:
- the constancy of the returned value;
- the constancy of arguments;
- the constancy of the function itself (in case of class methods).
Although the names of the functions coincide, they work differently. It may be a sign of an error.
Consider a simple case:
class CLASS {
DATA *m_data;
public:
char operator[](size_t index) const {
if (!m_data || index >= m_data->len)
throw MyException;
return m_data->data[index];
}
char &operator[](size_t index) {
return m_data->data[index];
}
};The constant function 'operator[]' contains a check so that an exception is thrown in case of an error. A non-constant function doesn't contain such a check. This is most likely a slip-up that should be fixed.
The analyzer takes into account a set of different situations when the differences in function bodies are reasonable. But we cannot account for all the exceptional cases. So, if the analyzer has generated a false positive, you can suppress it using the "//-V659" comment.
V660. Program contains an unused label and function call: 'CC:AA()'. Probably meant: 'CC::AA()'.
The analyzer has detected a potential error when the programmer makes a misprint writing ':' instead of '::'.
An unused label is found in the code of a class method. This label is followed by a function call. The analyzer considers it dangerous when a function with such a name is placed inside one of the base classes.
Consider the following sample:
class Employee {
public:
void print() const {}
};
class Manager: public Employee {
void print() const;
};
void Manager::print() const {
Employee:print();
}The line 'Employee:print();' is very likely to be incorrect. The error is this: unlike it was intended, the function from the own class 'Manager' is called instead of the function from the 'Employee' class. To fix the error we just need to replace ':' with '::'.
This is the fixed code:
void Manager::print() const {
Employee::print();
}Here's one more sample:
namespace Abcd
{
void Foo() {}
}
class Employee {
void Foo() {}
void X() { Abcd:Foo(); }
};The error here is this: the function within the scope of 'Abcd' should have been called. This error is easy to fix:
void X() { Abcd::Foo(); }This diagnostic is classified as:
V661. Suspicious expression 'A[B < C]'. Probably meant 'A[B] < C'.
The analyzer has detected a suspicious code fragment where an array item is being accessed. A logical expression is used as an array index.
Here are examples of such expressions: Array[A >= B], Array[A != B]. Perhaps the closing square bracket is in the wrong place. These errors usually occur through misprints.
Consider an example of incorrect code:
if ((bs->inventory[INVENTORY_ROCKETLAUNCHER] <= 0 ||
bs->inventory[INVENTORY_ROCKETS < 10]) && <<== ERROR!
(bs->inventory[INVENTORY_RAILGUN] <= 0 ||
bs->inventory[INVENTORY_SLUGS] < 10)) {
return qfalse;
}This code is compilable but works incorrectly. It's highly probable that the following text should be written instead:
if ((bs->inventory[INVENTORY_ROCKETLAUNCHER] <= 0 ||
bs->inventory[INVENTORY_ROCKETS] < 10) &&
(bs->inventory[INVENTORY_RAILGUN] <= 0 ||
bs->inventory[INVENTORY_SLUGS] < 10)) {
return qfalse;
}Note. The analyzer doesn't generate the warning all the time a logical expression is placed inside square brackets. It is sometimes justified. For instance, such an exception is the case when an array consists of only two items:
int A[2];
A[x != y] = 1;You can look at examples of errors detected by the V661 diagnostic. |
V662. Different containers are used to set up initial and final values of iterator. Consider inspecting the loop expression.
The analyzer has detected a suspicious loop. The A container is used to initialize the iterator. Then this iterator is compared to the end of the B container. It's highly probable that it is a misprint and the code is incorrect.
Here is a sample for which this warning will be generated:
void useVector(vector<int> &v1, vector<int> &v2)
{
vector<int>::iterator it;
for (it = v1.begin(); it != v2.end(); ++it)
*it = rand();
....
}The array is being filled in the 'for' loop. Different variables (v1 and v2) are used to initialize the iterator and to check the bounds. If the references v1 and v2 actually point to different arrays, it will cause an error at the program execution stage.
The error is very easy to fix. You need to use one and the same container in the both cases. This is the fixed code:
void useVector(vector<int> &v1, vector<int> &v2)
{
vector<int>::iterator it;
for (it = v1.begin(); it != v1.end(); ++it)
*it = rand();
....
}If the variables v1 and v2 refer to one and the same container, the code is correct. You can use the false positive suppression mechanism of analyzer in this case. However, code refactoring seems a better solution to this issue. The current code may confuse not only the analyzer, but also those programmers who will maintain it in the future.
This diagnostic is classified as:
|
You can look at examples of errors detected by the V662 diagnostic. |
V663. Infinite loop is possible. The 'cin.eof()' condition is insufficient to break from the loop. Consider adding the 'cin.fail()' function call to the conditional expression.
The analyzer has detected a potential error that may lead to an infinite loop. When you deal with the 'std::istream' class, calling the 'eof()' function is not enough to terminate the loop. If data reading fails, a call of the 'eof()' function will always return 'false'. You need an additional check of the value returned by the 'fail()' function to terminate the loop in this case.
Have a look at an example of incorrect code:
while (!cin.eof())
{
int x;
cin >> x;
}You can fix the error by making the condition a bit more complex:
while (!cin.eof() && !cin.fail())
{
int x;
cin >> x;
}However, this option has drawbacks. Correct and the simplest code version looks as follows:
int x;
while(cin >> x) {
....;
}Check out a more detailed discussion on reading from the stream here: Why is iostream::eof inside a loop condition (i.e. 'while (!stream.eof())') considered wrong?
This diagnostic is classified as:
You can look at examples of errors detected by the V663 diagnostic. |
V664. Pointer is dereferenced on the initialization list before its check for null inside the body of a constructor function.
The pointer is being dereferenced in the constructor initialization list and then checked inside the constructor body for not being a null pointer. It may signal a hidden error that may stay unnoticed for a long time.
Consider a sample of incorrect code:
Layer(const Canvas *canvas) :
about(canvas->name, canvas->coord)
{
if (canvas)
{
....
}
}When dereferencing a null pointer, undefined behavior occurs, i.e. normal execution of the program becomes impossible. To fix the error you should move the initialization operation into the constructor body in the code block where the pointer is known to not be equal to zero. Here is the fixed code:
Layer(const Canvas *canvas)
{
if (canvas)
{
about.set(canvas->name, canvas->coord);
}
}This diagnostic is classified as:
|
You can look at examples of errors detected by the V664 diagnostic. |
V665. Possible incorrect use of '#pragma warning(default: X)'. The '#pragma warning(push/pop)' should be used instead.
The analyzer has detected an incorrect sequence of '#pragma warning' directives in the code.
Programmers often assume that warnings disabled with the "pragma warning(disable: X)" directive earlier will start working again after using the "pragma warning(default : X)" directive. It's not so. The 'pragma warning(default : X)' directive sets the 'X' warning to the DEFAULT state which is quite not the same thing.
Imagine that a file is compiled with the /Wall switch used. The C4061 warning must be generated in this case. If you add the "#pragma warning(default : 4061)" directive, this warning will not be displayed, as it is turned off by default.
The correct way to return the previous state of a warning is to use directives "#pragma warning(push[ ,n ])" and "#pragma warning(pop)". See the Visual C++ documentation for descriptions of these directives: Pragma Directives. Warnings.
Here's an example of incorrect code:
#pragma warning(disable: 4001)
....
//Correct code triggering the 4001 warning
....
#pragma warning(default: 4001)The 4001 warning will be set to the default state in this sample. But the programmer must have intended to return the previous state used before it had been disabled. For this purpose, we should use the 'pragma warning(push)' directive before turning off the warning and the 'pragma warning(pop)' directive after the correct code.
This is the fixed code:
#pragma warning(push)
#pragma warning(disable: 4001)
....
// Correct code triggering the 4001 warning
....
#pragma warning(pop)Library developers should pay special attention to the V665 warning. Careless warning customization may cause a whole lot of troubles on the library users' side.
Good article about this theme: "So, You Want to Suppress This Warning in Visual C++".
This diagnostic is classified as:
|
You can look at examples of errors detected by the V665 diagnostic. |
V666. Value may not correspond with the length of a string passed with YY argument. Consider inspecting the NNth argument of the 'Foo' function.
The analyzer suspects that an incorrect argument has been passed into a function. An argument whose numerical value doesn't coincide with the string length found in the previous argument is considered incorrect. The analyzer draws this conclusion examining pairs of arguments consisting of a string literal and an integer constant. Analysis is performed over all the function calls of the same name.
Here's an example of incorrect code:
if (!_strnicmp(szDir, "My Documents", 11)) // <<== Error!
nFolder = 1;
if (!_strnicmp(szDir, "Desktop", 7))
nFolder = 2;
if (!_strnicmp(szDir, "Network Favorites", 17))
nFolder = 3;In this case, the value 11 in the first function call is incorrect. Because of that, comparison will be successful if the 'szDir' variable points to the string literal "My Document". To fix the code you should just change the string length to a correct value, i.e. 12.
This is the fixed code:
if (!_strnicmp(szDir, "My Documents", 12))
nFolder = 1;The V666 diagnostic is of empirical character. If you want to understand the point of it, you will have to read a complicated explanation. It's not obligatory, but if you choose not to read, then please check the function arguments very attentively. If you are sure that the code is absolutely correct, you may disable the diagnostic message output by adding the comment "//-V666".
Let's try to figure out how this diagnostic rule works. Look at the following code:
foo("1234", 1, 4);
foo("123", 2, 3);
foo("321", 2, 2);The analyzer will choose pairs of arguments: a string literal and a numerical value. For these, the analyzer will examine all the calls of this function and build a table of coincidence between the string length and numerical argument.
{ { "1234", 1 }, { "1234", 4 } } -> { false, true }
{ { "123", 2 }, { "123", 3 } } -> { false, true }
{ { "321", 2 }, { "321", 2 } } -> { false, false }
The first column is of no interest to us. It doesn't seem to be the string length. But the second column seems to represent the string length, and one of the calls contains an error.
This description is pretty sketchy, of course, but it allows you to grasp the general principle behind the diagnostic. Such an analysis is certainly not ideal, and false positives are inevitable. But it also lets you find interesting bugs sometimes.
This diagnostic is classified as:
|
You can look at examples of errors detected by the V666 diagnostic. |
V667. The 'throw' operator does not have any arguments and is not located within the 'catch' block.
The analyzer has detected that the 'throw' operator doesn't have arguments and is not located inside the 'catch' block. This code may be an error. The 'throw' operator without arguments is used inside the 'catch' block to pass on an exception it has caught to the upper level. According to the standard, a call of the 'throw' operator without an argument will cause the 'std::terminate()' function to be called if the exception is still not caught. It means that the program will be terminated.
Here's an example of incorrect code:
try
{
if (ok)
return;
throw;
}
catch (...)
{
}We should pass the argument to the 'throw' operator to fix the error.
This is the fixed code:
try
{
if (ok)
return;
throw exception("Test");
}
catch (...)
{
}However, calling the 'throw' operator outside the 'catch' block is not always an error. For example, if a function is being called from the 'catch' block and serves to pass on the exception to the upper level, no error will occur. But the analyzer may fail to distinguish between the two ways of behavior and will generate the diagnostic message for both. This is an example of such code:
void error()
{
try
{
....
if (ok)
return;
throw; <<== no error here actually
}
catch (...)
{
throw;
}
}
void foo()
{
try
{
....
if (ok)
return;
throw exception("Test");
}
catch (...)
{
error();
}
}In this case you may suppress the diagnostic message output by adding the comment '//-V667'.
This diagnostic is classified as:
|
V668. Possible meaningless check for null, as memory was allocated using 'new' operator. Memory allocation will lead to an exception.
The analyzer has detected an issue when the value of the pointer returned by the 'new' operator is compared to zero. It usually means that the program will behave in an unexpected way if memory cannot be allocated.
If the 'new' operator has failed to allocate memory, the exception std::bad_alloc() is thrown, according to the C++ standard. It's therefore pointless to check the pointer for being a null pointer. Take a look at a simple example:
MyStatus Foo()
{
int *p = new int[100];
if (!p)
return ERROR_ALLOCATE;
...
return OK;
}The 'p' pointer will never equal zero. The function will never return the constant value ERROR_ALLOCATE. If memory cannot be allocated, an exception will be generated. We may choose to fix the code in the simplest way:
MyStatus Foo()
{
try
{
int *p = new int[100];
...
}
catch(const std::bad_alloc &)
{
return ERROR_ALLOCATE;
}
return OK;
}Note, however, that the fixed code shown above is very poor. The philosophy of exception handling is quite different: it is due to the fact that they allow us to avoid numerous checks and returned statuses that exceptions are used. We should rather let the exception leave the 'Foo' function and process it somewhere else at a higher level. Unfortunately, discussion of how to use exceptions lies outside the scope of the documentation.
Let's see what such an error may look like in real life. Here's a code fragment taken from a real-life application:
// For each processor; spawn a CPU thread to access details.
hThread = new HANDLE [nProcessors];
dwThreadID = new DWORD [nProcessors];
ThreadInfo = new PTHREADINFO [nProcessors];
// Check to see if the memory allocation happenned.
if ((hThread == NULL) ||
(dwThreadID == NULL) ||
(ThreadInfo == NULL))
{
char * szMessage = new char [128];
sprintf(szMessage,
"Cannot allocate memory for "
"threads and CPU information structures!");
MessageBox(hDlg, szMessage, APP_TITLE, MB_OK|MB_ICONSTOP);
delete szMessage;
return false;
}The user will never see the error message window. If memory cannot be allocated, the program will crash or generate an inappropriate message, having processed the exception in some other place.
A common reason for issues of that kind is a change of the 'new' operator's behavior. In the times of Visual C++ 6.0, the 'new' operator is return NULL in case of an error. Later Visual C++ versions follow the standard and generate an exception. Keep this behavior change in mind. Thus, if you are adapting an old project for building it by a contemporary compiler, you should be especially attentive to the V668 diagnostic.
Note N1. The analyzer will not generate the warning if placement new or "new (std::nothrow) T" is used. For example:
T * p = new (std::nothrow) T; // OK
if (!p) {
// An error has occurred.
// No storage has been allocated and no object constructed.
...
}Note N2. You can link your project with nothrownew.obj. The 'new' operator won't throw an exception in this case. Driver developers, for instance, employ this capability. For details see: new and delete operators. Just turn off the V668 warning in this case.
References:
- Wikipedia. Placement syntax.
- Microsoft Support. Operator new does not throw a bad_alloc exception on failure in Visual C++.
- Stack Overflow. Will new return NULL in any case?
This diagnostic is classified as:
You can look at examples of errors detected by the V668 diagnostic. |
V669. Argument is a non-constant reference. The analyzer is unable to determine the position where this argument is modified. Consider checking the function for an error.
The analyzer has detected that an argument is being passed by reference into a function but not modified inside the function body. This may indicate an error which is caused by a misprint.
Consider a sample of incorrect code:
void foo(int &a, int &b, int c)
{
a = b == c;
}Because of a misprint, the assignment operator ('=') has turned into the comparison operator ('=='). As a result, the 'b' variable is used only for reading, although this is a non-constant reference. The way of fixing the code is chosen individually in each particular case. The important thing is that such a code requires more thorough investigation.
This is the fixed code:
void foo(int &a, int &b, int c)
{
a = b = c;
}Note. The analyzer might make mistakes when trying to figure out whether or not a variable is modified inside the function body. If you get an obvious false positive, please send us the corresponding code fragment for us to study it.
You may also add the comment "//-V669" to suppress the false positive in a particular line.
You can look at examples of errors detected by the V669 diagnostic. |
V670. Uninitialized class member is used to initialize another member. Remember that members are initialized in the order of their declarations inside a class.
The analyzer has detected a possible error in the class constructor's initialization list. According to the language standard, class members are initialized in the constructor in the same order as they are declared inside the class. In our case, the program contains a constructor where initialization of one class member depends on the other. At the same time, a variable used for initialization is not yet initialized itself.
Here is an example of such a constructor:
class Foo
{
int foo;
int bar;
Foo(int i) : bar(i), foo(bar + 1) { }
};The 'foo' variable is initialized first! The variable 'bar' is not yet initialized at this moment. To fix the bug, we need to put the declaration of the 'foo' class member before the declaration of the 'bar' class member. This is the fixed code:
class Foo
{
int bar;
int foo;
Foo(int i) : bar(i), foo(bar + 1) { }
};If the sequence of class fields cannot be changed, you need to change the initialization expressions:
class Foo
{
int foo;
int bar;
Foo(int i) : bar(i), foo(i + 1) { }
};This diagnostic is classified as:
|
You can look at examples of errors detected by the V670 diagnostic. |
V671. The 'swap' function may interchange a variable with itself.
The analyzer has detected a potential error that may occur when calling the 'swap' function. The function receives identical actual arguments, which is very strange. The programmer must have made a misprint.
Have a look at this example:
int arg1, arg2;
....
swap(arg1, arg1);
....A misprint causes the swap() function to swap the value of the 'arg1' variable for itself. The code should be fixed in the following way:
swap(arg1, arg2);The following sample is also considered suspicious:
MyClass arg1, arg2;
....
arg1.Swap(arg1);
....It can be fixed in the following way:
arg1.Swap(arg2);This diagnostic is classified as:
|
You can look at examples of errors detected by the V671 diagnostic. |
V672. It is possible that creating a new variable is unnecessary. One of the function's arguments has the same name and this argument is a reference.
The analyzer has detected a possible error: a variable is being declared whose name coincides with that of one of the arguments. If the argument is a reference, the whole situation is quite strange. The analyzer also imposes some other conditions to reduce the number of false positives, but there's no point describing them in the documentation.
To understand this type of errors better, have a look at the following sample:
bool SkipFunctionBody(Body*& body, bool t)
{
body = 0;
if (t)
{
Body *body = 0;
if (!SkipFunctionBody(body, true))
return false;
body = new Body(body);
return true;
}
return false;
}The function requires a temporary variable to handle the SkipFunctionBody () function. Because of inattention, the programmer once again declares a temporary variable 'body' inside the 'if' block. It means that this local variable will be modified inside the 'if' block instead of the 'body' argument. When leaving the function, the 'body' variable's value will be always NULL. The error might reveal itself further, somewhere else in the program, when null pointer dereferencing takes place. We need to create a local variable with a different name to fix the error. This is the fixed code:
bool SkipFunctionBody(Body*& body, bool t)
{
body = 0;
if (t)
{
Body *tmp_body = 0;
if (!SkipFunctionBody(tmp_body, true))
return false;
body = new Body(tmp_body);
return true;
}
return false;
}You can look at examples of errors detected by the V672 diagnostic. |
V673. More than N bits are required to store the value, but the expression evaluates to the T type which can only hold K bits.
The analyzer has detected a potential error in an expression using shift operations. Shift operations cause an overflow and loss of the high-order bits' values.
Let's start with a simple example:
std::cout << (77u << 26);The value of the "77u << 26" expression equals 5167382528 (0x134000000) and is of the 'unsigned int' type at the same time. It means that the high-order bits will be truncated and you'll get the value 872415232 (0x34000000) printed on the screen.
Overflows caused by shift operations usually indicate a logic error or misprint in the code. It may be, for example, that the programmer intended to define the number '77u' as an octal number. If this is the case, the correct code should look like this:
std::cout << (077u << 26);No overflow occurs now; the value of the "077u << 26" expression is 4227858432 (0xFC000000).
If you need to have the number 5167382528 printed, the number 77 must be defined as a 64-bit type. For example:
std::cout << (77ui64 << 26);Now let's see what errors we may come across in real life. The two samples shown below are taken from real applications.
Example 1.
typedef __UINT64 Ipp64u;
#define MAX_SAD 0x07FFFFFF
....
Ipp64u uSmallestSAD;
uSmallestSAD = ((Ipp64u)(MAX_SAD<<8));The programmer wants the value 0x7FFFFFF00 to be written into the 64-bit variable uSmallestSAD. But the variable will store the value 0xFFFFFF00 instead, as the high-order bits will be truncated because of the MAX_SAD<<8 expression being of the 'int' type. The programmer knew that and decided to use an explicit type conversion. Unfortunately, he made a mistake when arranging parentheses. This is a good example to demonstrate that such bugs can easily be caused by ordinary mistakes. This is the fixed code:
uSmallestSAD = ((Ipp64u)(MAX_SAD))<<8;Example 2.
#define MAKE_HRESULT(sev,fac,code) \
((HRESULT) \
(((unsigned long)(sev)<<31) | \
((unsigned long)(fac)<<16) | \
((unsigned long)(code))) )
*hrCode = MAKE_HRESULT(3, FACILITY_ITF, messageID);The function must generate an error message in a HRESULT-variable. The programmer uses the macro MAKE_HRESULT for this purpose, but in a wrong way. He suggested that the range for the first argument 'severity' was to be from 0 to 3 and must have mixed these figures up with the values needed for the mechanism of error code generation used by the functions GetLastError()/SetLastError().
The macro MAKE_HRESULT can only take either 0 (success) or 1 (failure) as the first argument. For details on this issue see the topic on the CodeGuru website's forum: Warning! MAKE_HRESULT macro doesn't work.
Since the number 3 is passed as the first actual argument, an overflow occurs. The number 3 "turns into" 1, and it's only thanks to this that the error doesn't affect program execution. I've given you this example deliberately just to show that it's a frequent thing when your code works because of mere luck, not because it is correct.
The fixed code:
*hrCode = MAKE_HRESULT(SEVERITY_ERROR, FACILITY_ITF, messageID);This diagnostic is classified as:
|
You can look at examples of errors detected by the V673 diagnostic. |
V674. Expression contains a suspicious mix of integer and real types.
The analyzer has detected a potential error in an expression where integer and real data types are used together. Real types are data types such as float/double/long double.
Let's start with a simple case. A literal of the 'double' type is implicitly cast to an integer, which may indicate a software bug in the code.
int a = 1.1;This fragment is meaningless. The variable should be most likely initialized with some other value.
The example shown above is an artificial one and therefore of no interest to us. Let's examine some real-life cases.
Example 1.
int16u object_layer_width;
int16u object_layer_height;
if (object_layer_width == 0 ||
object_layer_height == 0 ||
object_layer_width/object_layer_height < 0.1 ||
object_layer_width/object_layer_height > 10)An integer value is compared to the constant '0.1', and that's very strange. Assume the variables have the following values:
- object_layer_width = 20;
- object_layer_height = 100;
The programmer expects that division of these numbers will give '0.2'; it fits into the range [0.1..10].
But in fact the division result will be 0. Division is performed over integer data types, and though the result is extended to the type 'double' when compared to '0.1' a bit later, it is too late. To fix the code we need to perform an explicit type conversion beforehand:
if (object_layer_width == 0 ||
object_layer_height == 0 ||
(double)object_layer_width/object_layer_height < 0.1 ||
(double)object_layer_width/object_layer_height > 10.0)Example 2.
// be_aas_reach.c
ladderface1vertical =
abs( DotProduct( plane1->normal, up ) ) < 0.1;The argument of the abs() function is of the 'double' type. The code seems to execute correctly at first sight, and one may think it was just "silly" of the analyzer to attack this good code.
But let's examine the issue closer. Look how the function abs() is declared in header files.
int __cdecl abs( int _X);
#ifdef __cplusplus
extern "C++" {
inline long __CRTDECL abs(__in long _X) { .... }
inline double __CRTDECL abs(__in double _X) { .... }
inline float __CRTDECL abs(__in float _X) { .... }
}
#endifYes, abs() functions are overloaded for different types in C++. But we are dealing with a C code (see the file: be_aas_reach.c).
It means that a 'float'-type expression will be implicitly cast to the 'int' type. The abs() function will also return a value of the 'int' type. Comparing a value of the 'int' type to '0.1' is meaningless. And this is what analyzer warns you about.
In C applications, you need another function to calculate the absolute value correctly:
double __cdecl fabs(__in double _X);The fixed code:
ladderface1vertical =
fabs( DotProduct( plane1->normal, up ) ) < 0.1;This diagnostic is classified as:
|
You can look at examples of errors detected by the V674 diagnostic. |
V675. Writing into read-only memory.
The analyzer has detected an attempt of writing into read-only memory.
Have a look at the following sample:
char *s = "A_string";
if (x)
s[0] = 'B';The pointer 's' refers to a memory area which is read-only. Changing this area will cause undefined behavior of the program which will most probably take form of an access violation.
This is the fixed code:
char s[] = "A_string";
if (x)
s[0] = 'B';The 's' array is created on the stack, and a string from read-only memory is copied into it. Now you can safely change the 's' string.
P.S.
If "A_string" is "const char *", why should this type be implicitly cast to "char *"?
This is done due to compatibility reasons. There exists a TOO large amount of legacy code in C where non-constant pointers are used, and C++ standard/compiler developers didn't dare to break the backward compatibility with that code.
This diagnostic is classified as:
|
You can look at examples of errors detected by the V675 diagnostic. |
V676. Incorrect comparison of BOOL type variable with TRUE.
The analyzer has detected an issue when a BOOL value is compared to the TRUE constant (or 1). This is a potential error, since the value "true" may be presented by any non-zero number.
Let's recall the difference between the types 'bool' and 'BOOL'.
The following construct:
bool x = ....;
if (x == true) ....is absolutely correct. The 'bool' type may take only two values: true and false.
When dealing with the BOOL type, such checks are inadmissible. The BOOL type is actually the 'int' type, which means that it can store values other than zero and one. Any non-zero value is considered to be "true".
Values other than 1 may be returned, for example, by functions from Windows SDK.
The constants FALSE/TRUE are declared in the following way:
#define FALSE 0
#define TRUE 1It means that the following comparison may fail:
BOOL ret = Some_SDK_Function();
if (TRUE == ret)
{
// do something
}It is not guaranteed that it is 1 that the function Some_SDK_Function() will return, if executed successfully. The correct code should look this:
if (FALSE != ret)or:
if (ret)For more information on this subject, I recommend you to study FAQ on the website CodeGuru: Visual C++ General: What is the difference between 'BOOL' and 'bool'?
When found in a real application, the error may look something like this:
if (CDialog::OnInitDialog() != TRUE )
return FALSE;The CDialog::OnInitDialog() function's description reads: "If OnInitDialog returns nonzero, Windows sets the input focus to the default location, the first control in the dialog box. The application can return 0 only if it has explicitly set the input focus to one of the controls in the dialog box."
Notice that there is not a word about TRUE or 1. The fixed code should be like this:
if (CDialog::OnInitDialog() == FALSE)
return FALSE;This code may run successfully for a long time, but no one can say for sure that it will be always like that.
A few words concerning false positives. The programmer may be sometimes absolutely sure that a BOOL variable will always have 0 or 1. In this case, you may suppress a false positive using one of the several techniques. However, you'd still better fix your code: it will be more reliable from the viewpoint of future refactoring.
This diagnostic is close to the V642 diagnostic.
This diagnostic is classified as:
|
You can look at examples of errors detected by the V676 diagnostic. |
V677. Custom declaration of standard type. Consider using the declaration from system header files instead.
The analyzer has found a custom declaration of a standard data type in your program. This is an excessive code which may potentially cause errors. You should use system files containing declarations of the standard types.
Below is an example of incorrect type declaration:
typedef unsigned *PSIZE_T;The PSIZE_T type is declared as a pointer to the 'unsigned' type. This declaration may cause issues when trying to build a 64-bit application: the program won't compile or will behave in a different way than expected. This is how the PSIZE_T type is declared in the file "BaseTsd.h": "typedef ULONG_PTR SIZE_T, *PSIZE_T;". You should include the corresponding header file instead of changing the type declaration.
This is the fixed code:
#include <BaseTsd.h>This diagnostic is classified as:
|
You can look at examples of errors detected by the V677 diagnostic. |
V678. Object is used as an argument to its own method. Consider checking the first actual argument of the 'Foo' function.
The analyzer has detected a call to a non-static member function in which the object itself was passed as the first argument.
A.Foo(A);This code may probably contain an error. For example, an incorrect variable name is used because of a misprint. The correct code should look like this then:
A.Foo(B);or like this:
B.Foo(A);Let's see how such misprints may affect the code in real life. Here's a fragment from a real application:
CXMLAttribute* pAttr1 =
m_pXML->GetAttribute(CXMLAttribute::schemaName);
CXMLAttribute* pAttr2 =
pXML->GetAttribute(CXMLAttribute::schemaName);
if ( pAttr1 && pAttr2 &&
!pAttr1->GetValue().CompareNoCase(pAttr1->GetValue()))
....This code should compare two attributes. But a misprint causes the value "pAttr1->GetValue()" to be compared to itself.
This is the fixed code:
if ( pAttr1 && pAttr2 &&
!pAttr1->GetValue().CompareNoCase(pAttr2->GetValue()))This diagnostic is classified as:
You can look at examples of errors detected by the V678 diagnostic. |
V679. The 'X' variable was not initialized. This variable is passed by reference to the 'Foo' function in which its value will be used.
The analyzer has detected an issue when an uninitialized variable is being passed into a function by reference or by pointer. The function tries to read a value from this variable.
Here is an example.
void Copy(int &x, int &y)
{
x = y;
}
void Foo()
{
int x, y;
x = 1;
Copy(x, y);
}This is a very simple artificial sample, of course, but it explains the point very well. The 'y' variable is uninitialized. A reference to this variable is passed into the Copy() function which tries to read from this uninitialized variable.
The fixed code may look like this:
void Copy(int &x, int &y)
{
x = y;
}
void Foo()
{
int x, y;
y = 1;
Copy(x, y);
}This diagnostic is classified as:
|
V680. The 'delete A, B' expression only destroys the 'A' object. Then the ',' operator returns a resulting value from the right side of the expression.
The analyzer has detected a strange construct, which implied freeing memory for an arbitrary number of pointers, but only the first one will be freed.
For example:
delete p1, p2;It could have been written by an unskillful programmer or a programmer who has not dealt with C++ for a long time. At first you might think that this code deletes two objects whose addresses are stored in the pointers 'p1' and 'p2'. But actually we have two operators here: one is 'delete', the other is the comma operator ','.
The 'delete' operator is executed first, and then the ',' operator returns the value of the second argument (i.e. 'p2').
In other words, this construct is identical to this one: (delete p1), p2;
The correct code should look like this:
delete p1;
delete p2;Note. The analyzer won't generate the warning if the comma operator is used deliberately for certain purposes. Here's an example of safe code:
if (x)
delete p, p = nullptr;After deleting the object, the pointer is set to null. The ',' operator is used to unite the two operations so that one doesn't have to use curly braces.
This diagnostic is classified as:
V681. The language standard does not define order in which 'Foo' functions are called during evaluation of arguments.
The analyzer has detected a potential error in a sequence of function calls.
According to the C++ standard, the order of calculating a function's actual arguments is not determined. In the expression 'A(B(), C())', you can't tell for sure which of the two functions 'B()' and 'C()' will be called first - it depends on the compiler, compilation parameters, and so on.
This may cause troubles on rare occasions. The analyzer warns you about code fragments that look most strange. Unfortunately, we had to deliberately limit the number of occasions this warning is generated to avoid too many false positives. You see, actual arguments are too often represented by calls of other functions, which is in most cases absolutely safe.
Here's an example of code PVS-Studio will warn you about:
Point ReadPoint()
{
return Point(ReadFixed(), ReadFixed());
}This code may cause the X and Y values to be swapped, since it is not known which of the two will be calculated first.
This is the fixed code:
Point ReadPoint()
{
float x = ReadFixed();
return Point(x, ReadFixed());
}This diagnostic is classified as:
|
You can look at examples of errors detected by the V681 diagnostic. |
V682. Suspicious literal: '/r'. It is possible that a backslash should be used instead: '\r'.
The analyzer has detected a potential error when a forward slash is used.
It's easy to make a mistake mixing up the forward slash and backward slash characters.
For example:
if (x == '/n')The programmer intended to compare the variable 'x' to the code 0xA (line feed) but made a mistake and wrote a forward slash. It results in the variable being compared to the value 0x2F6E.
This is the fixed code:
if (x == '\n')Such a mistake is usually made when working with the following escape sequences:
- newline - \n
- horizontal tab - \t
- vertical tab - \v
- backspace - \b
- carriage return - \r
- form feed - \f
- alert - \a
- backslash - \\
- the null character - \0
References:
V683. The 'i' variable should probably be incremented instead of the 'n' variable. Consider inspecting the loop expression.
The analyzer has detected a potential error in a loop: there may be a typo which causes a wrong variable to be incremented/decremented.
For example:
void Foo(float *Array, size_t n)
{
for (size_t i = 0; i != n; ++n)
{
....
}
}The variable 'n' is incremented instead of the variable 'i'. It results in an unexpected program behavior.
This is the fixed code:
for (size_t i = 0; i != n; ++i)This diagnostic is classified as:
V684. Value of variable is not modified. It is possible that '1' should be present instead of '0'. Consider inspecting the expression.
The analyzer has detected a suspicious expression which is used to change certain bits of a variable, but the variable actually remains unchanged.
Here is an example of suspicious code:
MCUCR&=~(0<<SE);This code is taken from the firmware for the ATtiny2313 microcontroller. The SE bit must be set to one so that the microcontroller switches to sleep mode when receiving the SLEEP command. To avoid accidental switch to sleep mode, it is recommended to set the SE bit to one immediately before calling the SLEEP command and reset it after wake-up. It is this reset on wake-up that the programmer wanted to implement. But he made a typo causing the value of the MCUCR register to remain unchanged. So it appears that although the program works, it is not reliable.
This is the fixed code:
MCUCR&=~(1<<SE);Note. Sometimes the V684 warning generates a set of multiple false positives. These are usually triggered by large and complex macros. See the corresponding section of the documentation to find out the methods of suppressing false positives in macros.
This diagnostic is classified as:
You can look at examples of errors detected by the V684 diagnostic. |
V685. The expression contains a comma. Consider inspecting the return statement.
The analyzer has found that a value returned by a function might be incorrect as it contains the comma operator ','. This is not necessarily an error, but this code should be checked.
Here is an example of suspicious code:
int Foo()
{
return 1, 2;
}The function will return the value 2. The number 1 is redundant in this code and won't affect the program behavior in any way.
If it is just a typo, the redundant value should be eliminated:
int Foo()
{
return 2;
}But it may be possible sometimes that such a return value contains a genuine error. That's why the analyzer tracks such constructs. For example, a function call may have been accidentally removed during refactoring.
If this is the case, the code can be fixed in the following way:
int Foo()
{
return X(1, 2);
}Comma is sometimes useful when working with the 'return' operator. For example, the following code can be shortened by using a comma.
The lengthy code:
if (A)
{
printf("hello");
return X;
}The shorter code:
if (A)
return printf("hello"), X; // No warning triggeredWe do not find the shorter code version smart and do not recommend using it. However, this is a frequent practice and such code does have sense, so the analyzer doesn't generate the warning if the expression to the left of the comma affects the program behavior.
This diagnostic is classified as:
V686. Pattern A || (A && ...) was detected. The expression is excessive or contains a logical error.
The analyzer has detected an expression that can be simplified. In some cases, it may also mean that such an expression contains a logical error.
Here is an example of suspicious code:
int k,n,j;
...
if (n || (n && j))This expression is redundant. If "n==0", the condition is always false. If "n!=0", the condition is always true. That is, the condition does not depend on the 'j' variable and therefore can be simplified:
if (n)Sometimes such redundancy may indicate a typo. Imagine, for instance, that the condition must actually be like this one:
if (k || (n && j))Now, the following is a more realistic example which actually caused us to implement this diagnostic:
const char *Name = ....;
if (Name || (Name && Name[0] == 0))Here we have both an error and redundancy. The condition must be executed if the string referred to by the 'Name' pointer is empty. An empty string can be referred to by a null pointer.
Because of a mistake, the condition will be executed whenever Name != nullptr. This is the fixed code:
if (!Name || (Name && Name[0] == 0))We've got rid of the error, but we can also eliminate unnecessary check:
if (!Name || Name[0] == 0)This diagnostic is classified as:
You can look at examples of errors detected by the V686 diagnostic. |
V687. Size of array calculated by sizeof() operator was added to a pointer. It is possible that the number of elements should be calculated by sizeof(A)/sizeof(A[0]).
The analyzer has detected an issue when an array size is added to a pointer, which is strange. Perhaps it is an error, and it is actually the number of the array items instead of its size that should be added to the pointer.
Note. It is safe to work with arrays consisting of bytes (char/unsigned char).
An example of the error:
int A[10];
...
std::sort(A, A + sizeof(A));The function's first argument is a random-access iterator addressing the position of the first element in the range to be sorted.
The function's second argument is a random-access iterator addressing the position one past the final element in the range to be sorted.
The function call is incorrect: by mistake, the array size is added to the pointer which results in the function trying to sort more elements than necessary.
To fix the bug, the code should be rewritten so that the pointer is summed with the number of array items:
int A[10];
...
std::sort(A, A + sizeof(A) / sizeof(A[0]));This diagnostic is classified as:
|
V688. The 'foo' local variable has the same name as one of class members. This can result in confusion.
The analyzer has detected an issue when the name of a local variable coincides with the name of a class member. It is not an error in most cases, but such code may be EXTREMELY dangerous as it is exposed to errors that may occur after refactoring. The programmer assumes he is working with a class member while actually using the local variable.
An example of the error:
class M
{
int x;
void F() { int x = 1; foo(x); }
....
};The class contains a member named 'x'. The same name is used for the local variable in the F() function.
The error is clearly seen in a small sample like that, so you may find the V688 diagnostic uninteresting. But when you work with large functions, such a careless choice of names for variables may cause much trouble to developers maintaining the code.
We just need to choose another name for the local variable to avoid the error:
class M
{
int x;
void F() { int value = 1; foo(value); }
....
};Another solution is to use the 'm_' prefix in the names of class members:
class M
{
int m_x;
void F() { int x = 1; foo(x); }
....
};The analyzer generates this warning in certain cases only. It employs certain heuristics mechanisms to avoid false positives. For example, it won't react to the following code:
class M
{
int value;
void SetValue(int value) { this->value = value; }
....
};This diagnostic is classified as:
|
You can look at examples of errors detected by the V688 diagnostic. |
V689. Destructor of 'Foo' class is not declared as virtual. A smart pointer may not destroy an object correctly.
The analyzer has detected an issue when a smart pointer may destroy an object incorrectly. This error is caused by a missing virtual destructor in the base class.
For example:
class Base
{
public:
~Base() { }
};
class Derived : public Base
{
public:
Derived()
{
data = new int[5];
}
~Derived()
{
delete [] data;
}
int* data;
};
void GO()
{
std::auto_ptr<Base> smartPtr(new Derived);
}Notice that the object created in this code belongs to the 'Derived' class. However, the smart pointer stores a reference to the Base class. The destructor in the Base class is not virtual, and that's why an error will occur when the smart pointer tries to destroy an object it has been storing.
The fixed code of the Base class:
class Base
{
public:
virtual ~Base() { }
};P.S.
The V599 diagnostic message is related to this one.
References:
- Wikipedia. Virtual method table.
- Wikipedia. Virtual function.
- Wikipedia. Destructor.
- Discussion on Stack Overflow. When to use virtual destructors?
- The Old New Thing. When should your destructor be virtual?
This diagnostic is classified as:
|
V690. The class implements a copy constructor/operator=, but lacks the operator=/copy constructor.
The analyzer has detected a class where a copy constructor is implemented but the 'operator =' is not, or vice versa, the 'operator =' is implemented but a copy constructor is not.
Handling such classes is very dangerous. In other words, we are dealing with the violated "Law of The Big Two". We will discuss this law a bit further.
Let's examine an example of a dangerous class. It is pretty long, but the only thing we are concerned with now is that the class has the assignment operator but lacks a copy constructor.
class MyArray
{
char *m_buf;
size_t m_size;
void Clear() { delete [] m_buf; }
public:
MyArray() : m_buf(0), m_size(0) {}
~MyArray() { Clear(); }
void Allocate(size_t s)
{ Clear(); m_buf = new char[s]; m_size = s; }
void Copy(const MyArray &a)
{ Allocate(a.m_size);
memcpy(m_buf, a.m_buf, a.m_size * sizeof(char)); }
char &operator[](size_t i) { return m_buf[i]; }
MyArray &operator =(const MyArray &a)
{ Copy(a); return *this; }
};We are not going to discuss how practical and useful this class is; it's just an example and what we care about is that the following code fragment will work well:
{
MyArray A;
A.Allocate(100);
MyArray B;
B = A;
}The assignment operator is successfully copying the array.
The next code fragment will cause undefined behavior: the application will either crash or its operation will be violated otherwise.
{
MyArray A;
A.Allocate(100);
MyArray C(A);
}The point is that the class lacks a copy constructor. When creating the 'C' object, the pointer to the array will be simply copied, which will cause double memory freeing when destroying the objects A and C.
A similar trouble will occur when a copy constructor is present but the assignment operator is absent.
To fix the class, we need to implement a copy constructor:
MyArray &operator =(const MyArray &a)
{ Copy(a); return *this; }
MyArray(const MyArray &a) : m_buf(0), m_size(0)
{ Copy(a); }If the analyzer generates the V690 warning, please don't be lazy to implement an absent method. Do so even if the code works well currently and you are sure you remember the class' specifics. Some time later, you will forget about the missing operator= or a copy constructor, and you or your colleagues will make a mistake which will be difficult to find. When class fields are copied automatically, it's a usual thing that such classes "almost work". Troubles reveal themselves later in absolutely different places of code.
The Law of The Big Two
As it was said in the beginning, the V690 diagnostic rule detects classes that violate "The Law of The Big Two". Let's examine this in detail. But we should start with "The rule of three" first. Here is an extract from Wikipedia:
The rule of three (also known as the Law of The Big Three or The Big Three) is a rule of thumb in C++ that claims that if a class defines one of the following it should probably explicitly define all three:
- destructor;
- copy constructor;
- copy assignment operator.
These three functions are special member functions. If one of these functions is used without first being declared by the programmer it will be implicitly implemented by the compiler with the default semantics of performing the said operation on all the members of the class. The default semantics are:
- Destructor - Call the destructors of all the object's class-type members
- Copy constructor - Construct all the object's members from the corresponding members of the copy constructor's argument, calling the copy constructors of the object's class-type members, and doing a plain assignment of all non-class type (e.g., int or pointer) data members
- Copy assignment operator - Assign all the object's members from the corresponding members of the assignment operator's argument, calling the copy assignment operators of the object's class-type members, and doing a plain assignment of all non-class type (e.g., int or pointer) data members.
The Rule of Three claims that if one of these had to be defined by the programmer, it means that the compiler-generated version does not fit the needs of the class in one case and it will probably not fit in the other cases either. The term "Rule of three" was coined by Marshall Cline in 1991.
An amendment to this rule is that if Resource Acquisition Is Initialization (RAII) is used for the class members, the destructor may be left undefined (also known as The Law of The Big Two).
Because implicitly-generated constructors and assignment operators simply copy all class data members, one should define explicit copy constructors and copy assignment operators for classes that encapsulate complex data structures or have external references such as pointers, since only the pointer gets copied, not the object it points to. In the case that this default behavior is actually the intended behavior, an explicit declaration can prevent ambiguity.
"The Law of The Big Two" itself is discussed in detail in the following article: The Law of The Big Two.
As you can see, "The Law of The Big Two" is very important - that's why we have implemented the corresponding diagnostic in our code analyzer.
Starting from C++11, there has been move semantics, so this rule expanded to the "Big Five". A list of methods, which all have to be defined in case if at least one of them is defined:
- destructor;
- copy constructor;
- copy assignment operator;
- move constructor;
- move assignment operator;
Therefore, everything that is true for the constructor/copy operator, is true for the move constructor/operator.
Note
Does the V690 diagnostic always reveal genuine errors? No, it doesn't. Sometimes we deal not with an error but just a redundant function. Take a look at the following sample taken from a real application:
struct wdiff {
int start[2];
int end[2];
wdiff(int s1=0, int e1=0, int s2=0, int e2=0)
{
if (s1>e1) e1=s1-1;
if (s2>e2) e2=s2-1;
start[0] = s1;
start[1] = s2;
end[0] = e1;
end[1] = e2;
}
wdiff(const wdiff & src)
{
for (int i=0; i<2; ++i)
{
start[i] = src.start[i];
end[i] = src.end[i];
}
}
};This class has a copy constructor but lacks the assignment operator. But it's alright: the arrays 'start' and 'end' consist of simple types 'int' and will be correctly copied by the compiler. To eliminate the V690 warning here, we need to remove the meaningless copy constructor. The compiler will build the code, copying the class members in no way slower, if not even faster.
The fixed code:
struct wdiff {
int start[2];
int end[2];
wdiff(int s1=0, int e1=0, int s2=0, int e2=0)
{
if (s1>e1) e1=s1-1;
if (s2>e2) e2=s2-1;
start[0] = s1;
start[1] = s2;
end[0] = e1;
end[1] = e2;
}
};You can look at examples of errors detected by the V690 diagnostic. |
V691. Empirical analysis. Possible typo inside the string literal. The 'foo' word is suspicious.
Whenever the analyzer detects two identical string literals, it will try to figure out if it is a consequence of poor Copy-Paste. We want to warn you right away that this diagnostic is based on an empirical algorithm and therefore may produce strange false positives sometimes.
Take a look at the following example:
static const wchar_t left_str[] = L"Direction: left.";
static const wchar_t right_str[] = L"Direction: right.";
static const wchar_t up_str[] = L"Direction: up.";
static const wchar_t down_str[] = L"Direction: up.";The code was written with the help of the Copy-Paste method. The programmer forgot to replace the string literal "up" with "down" at the end of the block. The analyzer will suspect something is wrong and point out the strange word "up" in the last line.
The fixed code:
static const wchar_t left_str[] = L"Direction: left.";
static const wchar_t right_str[] = L"Direction: right.";
static const wchar_t up_str[] = L"Direction: up.";
static const wchar_t down_str[] = L"Direction: down.";;You can look at examples of errors detected by the V691 diagnostic. |
V692. Inappropriate attempt to append a null character to a string. To determine the length of a string by 'strlen' function correctly, use a string ending with a null terminator in the first place.
The analyzer has detected an interesting error pattern. In order to write a terminal null at the end of a string, the programmer uses the strlen() function to calculate its length. The result will be unpredictable. The string must be already null-terminated for the strlen() function to work properly.
For example:
char *linkname;
....
linkname[strlen(linkname)] = '\0';This code doesn't make any sense: the null terminator will be written right into that very cell where 0 was found. At the same time, the strlen() function may reach far beyond the buffer, leading to undefined behavior.
To fix the code, we should use some other method to calculate the string length:
char *linkname;
size_t len;
....
linkname[len] = '\0';This diagnostic is classified as:
|
You can look at examples of errors detected by the V692 diagnostic. |
V693. It is possible that 'i < X.size()' should be used instead of 'X.size()'. Consider inspecting conditional expression of the loop.
The analyzer has detected a typo in the loop termination condition.
For example:
for (size_t i = 0; v.size(); ++i)
sum += v[i];If the 'v' array is not empty, an infinite loop will occur.
The fixed code:
for (size_t i = 0; i < v.size(); ++i)
sum += v[i];This diagnostic is classified as:
You can look at examples of errors detected by the V693 diagnostic. |
V694. The condition (ptr - const_value) is only false if the value of a pointer equals a magic constant.
The analyzer has detected a very suspicious condition: a constant value is added to or subtracted from a pointer. The result is then compared to zero. Such code is very likely to contain a typo.
Take a look at the following example with addition:
int *p = ...;
if (p + 2)This condition will be always true. The only case when the expression evaluates to 0 is when you deliberately write the magic number "-2" into the pointer.
The fixed code:
int *p = ...;
if (*p + 2)Now let's examine an example with subtraction:
char *begin = ...;
char *end = ...;
....
const size_t ibegin = 1;
....
if (end - ibegin)It is the variable 'begin' that should have been subtracted from the variable 'end'. Because of the poor variable naming, the programmer used by mistake the constant integer variable 'ibegin'.
The fixed code:
char *begin = ...;
char *end = ...;
....
if (end - begin)Note. This warning is generated only when the pointer is "actual" - e.g. pointing to a memory area allocated through the "malloc()" function. If the analyzer does not know what the pointer equals to, it won't generate the warning in order to avoid unnecessary false positives. It does happen sometimes that programmers pass "magic numbers" in pointers and conditions of the (ptr - 5 == 0) pattern do make sense.
This diagnostic is classified as:
|
You can look at examples of errors detected by the V694 diagnostic. |
V695. Range intersections are possible within conditional expressions.
The analyzer has detected a potential error in a condition. The program must perform different actions depending on which range of values a certain variable meets.
For this purpose, the following construct is used in the code:
if ( MIN_A < X && X < MAX_A ) {
....
} else if ( MIN_B < X && X < MAX_B ) {
....
}The analyzer generates the warning when the ranges checked in conditions overlap. For example:
if ( 0 <= X && X < 10)
FooA();
else if ( 10 <= X && X < 20)
FooB();
else if ( 20 <= X && X < 300)
FooC();
else if ( 30 <= X && X < 40)
FooD();The code contains a typo. The programmer's fingers faltered at some moment and he wrote "20 <= X && X < 300" instead of "20 <= X && X < 30" by mistake. If the X variable stores, for example, the value 35, it will be the function FooC() that will be called instead of FooD().
The fixed code:
if ( 0 <= X && X < 10)
FooA();
else if ( 10 <= X && X < 20)
FooB();
else if ( 20 <= X && X < 30)
FooC();
else if ( 30 <= X && X < 40)
FooD();Here is another example:
const int nv_ab = 5;
const int nv_bc = 10;
const int nv_re = 15;
const int nv_we = 20;
const int nv_tw = 25;
const int nv_ww = 30;
....
if (n < nv_ab) { AB(); }
else if (n < nv_bc) { BC(); }
else if (n < nv_re) { RE(); }
else if (n < nv_tw) { TW(); } // <=
else if (n < nv_we) { WE(); } // <=
else if (n < nv_ww) { WW(); }Depending on the value of the 'n' variable, different actions are performed. Poor variable naming may confuse a programmer - and so it did in this example. The 'n' variable should have been compared to 'nv_we' first and only then to 'nv_tw'.
To make the mistake clear, let's substitute the values of the constants into the code:
if (n < 5) { AB(); }
else if (n < 10) { BC(); }
else if (n < 15) { RE(); }
else if (n < 25) { TW(); }
else if (n < 20) { WE(); } // Condition is always false
else if (n < 30) { WW(); }The fixed code:
if (n < nv_ab) { AB(); }
else if (n < nv_bc) { BC(); }
else if (n < nv_re) { RE(); }
else if (n < nv_we) { WE(); } // <=
else if (n < nv_tw) { TW(); } // <=
else if (n < nv_ww) { WW(); }This diagnostic is classified as:
You can look at examples of errors detected by the V695 diagnostic. |
V696. The 'continue' operator will terminate 'do { ... } while (FALSE)' loop because the condition is always false.
The analyzer has detected code that may mislead the programmer. Not every programmer is aware that the continue operator in the "do { ... } while(0)" loop will terminate the loop instead of continuing it.
This is what the standard has to say about it:
§6.6.2 in the standard: "The continue statement (...) causes control to pass to the loop-continuation portion of the smallest enclosing iteration-statement, that is, to the end of the loop." (Not to the beginning.)
Thus, after calling the 'continue' operator, the (0) condition will be checked and the loop will terminate because the condition is false.
For example:
int i = 1;
do {
std::cout << i;
i++;
if(i < 3) continue;
std::cout << 'A';
} while(false);The programmer would expect the program to print "12A", but it will actually print "1".
Even if the code was written that way consciously, you'd better change it. For example, you may use the 'break' operator:
int i=1;
do {
std::cout << i;
i++;
if(i < 3) break;
std::cout << 'A';
} while(false);The code looks clearer now. You can see right away that the loop will terminate if the (i < 3) condition is true. Besides, the analyzer won't generate the warning on this code.
If the code is incorrect, it needs to be rewritten. I cannot give any precise recommendations about that; it all depends on the code execution logic. For instance, if you want to get "12A" printed, you'd better write the following code:
for (i = 1; i < 3; ++i)
std::cout << i;
std::cout << 'A';This diagnostic is classified as:
|
You can look at examples of errors detected by the V696 diagnostic. |
V697. Number of elements in the allocated array equals the size of a pointer in bytes.
The number of items in an array allocated by the 'new' operator equals the pointer size in bytes, which makes this code fragment very suspicious.
Take a look at an example demonstrating how such a fragment is introduced into the code. At first, the program contained a fixed array consisting of bytes. We needed to create an array of the same size but consisting of float items. As a result, we wrote the following code:
void Foo()
{
char A[10];
....
float *B = new float[sizeof(A)];
....
}We won't discuss the quality of this code now; what we are interested in is that the 'A' array has become dynamic too as a result of refactoring. The fragment where the 'B' array is created was forgotten to be changed. Because of that, we get the following incorrect code:
void Foo(size_t n)
{
char *A = new char[n];
....
float *B = new float[sizeof(A)];
....
}The number of items in the 'B' array is 4 or 8, depending on the platform bitness. It is this problem that the analyzer detects.
The fixed code:
void Foo(size_t n)
{
char *A = new char[n];
....
float *B = new float[n];
....
}This diagnostic is classified as:
|
V698. Functions of strcmp() kind can return any values, not only -1, 0, or 1.
The analyzer has detected a comparison of the result of strcmp() or similar function to 1 or -1. The C/C++ language specification, however, says that the strcmp() function can return any positive or negative value when strings are not equal – not only 1 or -1.
Depending on the implementation, the strcmp() function can return the following values when strings are not equal:
- -1 or any negative number if the first string is less than the second in the lexicographical order;
- 1 or any positive number if the first string is larger than the second.
Whether constructs like strcmp() == 1 will work right depends on libraries, the compiler and its settings, the operating system and its bitness, and so on; in this case you should always write strcmp() > 0.
For example, below is a fragment of incorrect code:
std::vector<char *> vec;
....
std::sort(vec.begin(), vec.end(), [](
const char * a, const char * b)
{
return strcmp(a, b) == 1;
});When you change over to a different compiler, target operating system or application bitness, the code may start working improperly.
The fixed code:
std::vector<char *> vec;
....
std::sort(vec.begin(), vec.end(), [](
const char * a, const char * b)
{
return strcmp(a, b) > 0;
});The analyzer also considers code incorrect when it compares results of two strcmp() functions. Such code is very rare but always needs examining.
This diagnostic is classified as:
|
You can look at examples of errors detected by the V698 diagnostic. |
V699. It is possible that 'foo = bar == baz ? .... : ....' should be used here instead of 'foo = bar = baz ? .... : ....'. Consider inspecting the expression.
The analyzer has detected an expression of the 'foo = bar = baz ? xyz : zzy' pattern. It is very likely to be an error: the programmer actually meant it to be 'foo = bar == baz ? xyz : zzy' but made a mistake causing the code to do assignment instead of comparison.
For example, take a look at the following incorrect code fragment:
int newID = currentID = focusedID ? focusedID : defaultID;The programmer made a mistake writing an assignment operator instead of comparison operator. The fixed code should look like this:
int newID = currentID == focusedID ? focusedID : defaultID;Note that the code below won't trigger the warning because the expression before the ternary operator is obviously of the bool type, which makes the analyzer assume it was written so on purpose.
result = tmpResult = someVariable == someOtherVariable? 1 : 0;This fragment is quite clear. It is equivalent to the following lengthier one:
if (someVariable == someOtherVariable)
tmpResult = 1;
else
tmpResult = 0;
result = tmpResult;This diagnostic is classified as:
|
V700. It is suspicious that variable is initialized through itself. Consider inspecting the 'T foo = foo = x;' expression.
The analyzer has detected an expression of the 'T foo = foo = X' pattern. The variable being initialized is itself taking part in the assignment. Unlike the issue diagnosed by the V593 rule, the foo variable here is initialized by an X expression; however, this code is very suspicious: the programmer should have most likely meant something else.
Here is an example of incorrect code:
int a = a = 3;It's hard to say for sure what was actually meant here. Probably the correct code should look as follows:
int a = 3;It is also possible that the programmer wanted to initialize the variable through assigning a value to another variable:
int a = b = 3;This diagnostic is classified as:
You can look at examples of errors detected by the V700 diagnostic. |
V701. Possible realloc() leak: when realloc() fails to allocate memory, original pointer is lost. Consider assigning realloc() to a temporary pointer.
The analyzer has detected an expression of the 'foo = realloc(foo, ...)' pattern. This expression is potentially dangerous: it is recommended to save the result of the realloc function into a different variable.
The realloc(ptr, ...) function is used to change the size of some memory block. When it succeeds to do so without moving the data, the resulting pointer will coincide with the source ptr. When changing a memory block's size is impossible without moving it, the function will return the pointer to the new block while the old one will be freed. But when changing a memory block's size is currently impossible at all even with moving it, the function will return a null pointer. This situation may occur when allocating a large data array whose size is comparable to RAM size, and also when the memory is highly segmented. This third scenario is just what makes it potentially dangerous: if realloc(ptr, ...) returns a null pointer, the data block at the ptr address won't change in size. The main problem is that using a construct of the "ptr = realloc(ptr, ...)" pattern may cause losing the ptr pointer to this data block.
For example, see the following incorrect code taken from a real-life application:
void buffer::resize(unsigned int newSize)
{
if (capacity < newSize)
{
capacity = newSize;
ptr = (unsigned char *)realloc(ptr, capacity);
}
}The realloc(...) function changes the buffer size when the required buffer size is larger than the current one. But what will happen if realloc() fails to allocate memory? It will result in writing NULL into ptr, which by itself is enough to cause a lot of troubles, but more than that, the pointer to the source memory area will be lost. The correct code looks as follows:
void buffer::resize(unsigned int newSize)
{
if (capacity < newSize)
{
capacity = newSize;
unsigned char * tmp = (unsigned char *)realloc(ptr, capacity);
if (tmp == NULL)
{
/* Handle exception; maybe throw something */
} else
ptr = tmp;
}
}This diagnostic is classified as:
|
You can look at examples of errors detected by the V701 diagnostic. |
V702. Classes should always be derived from std::exception (and alike) as 'public'.
The analyzer has detected a class derived from the std::exception class (or other similar classes) through the private or protected modifier. What is dangerous about such inheritance is that in case of nonpublic inheritance, the attempt to catch a std::exception will fail.
The error is often a result of the programmer forgetting to specify an inheritance type. According to the language rules, the default inheritance type is private inheritance. It results in exception handlers behaving other way than expected.
For example, see the following incorrect code:
class my_exception_t : std::exception // <=
{
public:
explicit my_exception_t() { }
virtual const int getErrorCode() const throw() { return 42; }
};
....
try
{ throw my_exception_t(); }
catch (const std::exception & error)
{ /* Can't get there */ }
catch (...)
{ /* This code executed instead */ }The code to catch all the standard and user exceptions "catch (const std::exception & error)" won't work properly because private inheritance does not allow for implicit type conversion.
To make the code run correctly, we need to add the public modifier before the base class std::exception in the list of base classes:
class my_exception_t : public std::exception
{
....
}This diagnostic is classified as:
You can look at examples of errors detected by the V702 diagnostic. |
V703. It is suspicious that the 'foo' field in derived class overwrites field in base class.
The analyzer has detected that a descendant class contains a field whose type and name coincide with those of some field of the parent class. Such a declaration may be incorrect as the inheritance technology in itself implies inheriting all the parent class' fields by the descendant, while declaring in the latter a field with the same name only complicates the code and confuses programmers who will be maintaining the code in future.
For example, see the following incorrect code:
class U {
public:
int x;
};
class V : public U {
public:
int x; // <=
int z;
};This code may be dangerous since there are two x variables in the V class: 'V::x' proper and 'U::x'. The possible consequences of this code are illustrated by the following sample:
int main() {
V vClass;
vClass.x = 1;
U *uClassPtr = &vClass;
std::cout << uClassPtr->x << std::endl; // <=
....
}This code will cause outputting an uninitialized variable.
To fix the error, we just need to delete the variable declaration in the descendant class:
class U {
public:
int x;
};
class V : public U {
public:
int z;
};There are a few arguable cases the analyzer doesn't consider incorrect:
- conflicting fields have different types;
- at least one of the conflicting fields is declared as static;
- the base class' field is declared as private;
- private inheritance is used;
- the field is expanded through define;
- the field has one of the special names like "reserved" (such names point out that the variable is actually used to reserve some part of the class structure in the memory for future use).
We recommend that you always do code refactoring for all the places triggering the V703 warning. Using variables with the same name both in the base and descendant classes is far not always an error. But such code is still very dangerous. Even if the program runs well now, it's very easy to make a mistake when modifying classes later.
This diagnostic is classified as:
|
You can look at examples of errors detected by the V703 diagnostic. |
V704. The expression is always false on newer compilers. Avoid using 'this == 0' comparison.
The analyzer has detected an expression of the 'this == 0' pattern. This expression may work well in some cases but it is extremely dangerous due to certain reasons.
Here is a simple example:
class CWindow {
HWND handle;
public:
HWND GetSafeHandle() const
{
return this == 0 ? 0 : handle;
}
};Calling the CWindow::GetSafeHandle() method for the null pointer 'this' will generally lead to undefined behavior, according to the C++ standard. But since this class' fields are not being accessed while executing the method, it may run well. On the other hand, two negative scenarios are possible when executing this code. First, since the this pointer can never be null, according to the C++ standard, the compiler may optimize the method call by reducing it to the following line:
return handle;Second, suppose we've got the following code fragment:
class CWindow {
.... // CWindow from the previous example
};
class MyWindowAdditions {
unsigned long long x; // 8 bytes
};
class CMyWindow: public MyWindowAdditions, public CWindow {
....
};
....
void foo()
{
CMyWindow * nullWindow = NULL;
nullWindow->GetSafeHandle();
}This code will cause reading from the memory at the address 0x00000008. You can make sure it's true by adding the following line:
std::cout << nullWindow->handle << std::endl;What you will get on the screen is the address 0x00000008, for the source pointer NULL (0x00000000) has been shifted in such a way as to point to the beginning of the CWindow class' subobject. For this purpose, it needs to be shifted by sizeof(MyWindowAdditions) bytes.
What's most interesting, the "this == 0" check turns absolutely meaningless now. The 'this' pointer is always equal to the 0x00000008 value at least.
On the other hand, the error won't reveal itself if you swap the base classes in CMyWindow's declaration:
class CMyWindow: public CWindow, public MyWindowAdditions{
....
};All this may cause very vague errors.
Unfortunately, fixing the code is far from trivial. Theoretically, a correct way out in such cases is to change the class method to static. This will require editing a lot of other places where this method call is used.
class CWindow {
HWND handle;
public:
static HWND GetSafeHandle(CWindow * window)
{
return window == 0 ? 0 : window->handle;
}
};Another way is to use the Null Object pattern which will also require plenty of work.
class CWindow {
HWND handle;
public:
HWND GetSafeHandle() const
{
return handle;
}
};
class CNullWindow : public CWindow {
public:
HWND GetSafeHandle() const
{
return nullptr;
}
};
....
void foo(void)
{
CNullWindow nullWindow;
CWindow * windowPtr = &nullWindow;
// Output: 0
std::cout << windowPtr->GetSafeHandle() << std::endl;
}It should be noted that this defect is extremely dangerous because one is usually too short of time to care about solving it, for it all seems to "work well as it is", while refactoring is too expensive. But code working stably for years may suddenly fail after a slightest change of circumstances: building for a different operating system, changing to a different compiler version (including update), and so on. The following example is quite illustrative: the GCC compiler, starting with version 4.9.0, has learned to throw away the check for null of the pointer dereferenced a bit earlier in the code (see the V595 diagnostic):
int wtf( int* to, int* from, size_t count ) {
memmove( to, from, count );
if( from != 0 ) // <= condition is always true after optimization
return *from;
return 0;
}There are quite a lot of real-life examples of problem code turned broken because of undefined behavior. Here are a few of them to underline the importance of the problem.
Example No. 1. A vulnerability in the Linux core
struct sock *sk = tun->sk; // initialize sk with tun->sk
....
if (!tun) // <= always false
return POLLERR; // if tun is NULL return errorExample No. 2. Incorrect work of srandomdev():
struct timeval tv;
unsigned long junk; // <= not initialized on purpose
gettimeofday(&tv, NULL);
// LLVM: analogue of srandom() of uninitialized variable,
// i.e. tv.tv_sec, tv.tv_usec and getpid() are not taken into account.
srandom((getpid() << 16) ^ tv.tv_sec ^ tv.tv_usec ^ junk);Example No. 3. An artificial example that demonstrates very clearly both compilers' aggressive optimization policy concerning undefined behavior and new ways to "shoot yourself in the foot":
#include <stdio.h>
#include <stdlib.h>
int main() {
int *p = (int*)malloc(sizeof(int));
int *q = (int*)realloc(p, sizeof(int));
*p = 1;
*q = 2;
if (p == q)
printf("%d %d\n", *p, *q); // <= Clang r160635: Output: 1 2
}As far as we know, none of the compilers has ignored the call of the this == 0 check as of the implementation date of this diagnostic, but it's just a matter of time because the C++ standard clearly reads (§9.3.1/1): "If a nonstatic member function of a class X is called for an object that is not of type X, or of a type derived from X, the behavior is undefined.". In other words, the result of calling any nonstatic function for a class with this == 0 is undefined. As I've said, it's just a matter of time for compilers to start substituting false instead of (this == 0) during compilation.
This diagnostic is classified as:
You can look at examples of errors detected by the V704 diagnostic. |
V705. It is possible that 'else' block was forgotten or commented out, thus altering the program's operation logics.
This diagnostic is similar to V628 but deals with the else branch of the if operator. The analyzer has detected a suspicious code fragment which may be a forgotten or incorrectly commented else block.
This issue is best explained on examples.
if (!x)
t = x;
else
z = t;In this case, code formatting doesn't meet its logic: the z = t expression will execute only if (x == 0), which is hardly what the programmer wanted. A similar situation may occur when a code fragment is not commented properly:
if (!x)
t = x;
else
//t = -1;
z = t;In this case, we either need to fix the formatting by turning it into something more readable or fix the logic error by adding a missing branch of the if operator.
However, there are cases when it's difficult to figure out if such code is incorrect or it's just stylization. The analyzer tries to reduce the number of false positives related to stylization through heuristic analysis. For example, the following code won't trigger the diagnostic rule:
if (x == 1)
t = 42;
else
if (x == 2)
t = 84;
else
#ifdef __extended__x
if (x == 3)
t = 741;
else
#endif
t = 0;This diagnostic is classified as:
|
You can look at examples of errors detected by the V705 diagnostic. |
V706. Suspicious division: sizeof(X) / Value. Size of every element in X array is not equal to divisor.
The analyzer has detected a suspicious division of one sizeof() operator's result by another sizeof() operator or number, sizeof() being applied to an array and the item size not coinciding with the divisor. The code is very likely to contain an error.
An example:
size_t A[10];
n = sizeof(A) / sizeof(unsigned);In the 32-bit build mode, the sizes of the types unsigned and size_t coincide and 'n' will equal ten. In the 64-bit build mode, however, the size of the size_t type is 8 bytes while that of the unsigned type is just 4 bytes. As a result, the n variable will equal 20, which is hardly what the programmer wanted.
Code like the following one will also be considered incorrect:
size_t A[9];
n = sizeof(A) / 7;In the 32-bit mode, the array's size is 4 * 9 = 36 bytes. Dividing 36 by 7 is very strange. So what did the programmer actually want to do? Something is obviously wrong with this code.
No concrete recommendations can be given on how to deal with issues like that because each particular case needs to be approached individually as reasons may vary: a type size might have been changed or an array size defined incorrectly, and so on. This error often results from typos or simply inattention.
The analyzer won't generate this warning if the array is of the char or uchar type since such arrays are often used as buffers to store some data of other types. The following is an example of code the analyzer treats as safe:
char A[9];
n = sizeof(A) / 3;This diagnostic is classified as:
You can look at examples of errors detected by the V706 diagnostic. |
V707. Giving short names to global variables is considered to be bad practice.
The analyzer has detected a globally declared variable with a short name. Even if it won't cause any errors, it indicates a bad programming practice and makes the program text less comprehensible.
An example:
int i;The problem about short variable names is that there is a large risk you'll make a mistake and use a global variable instead of a local one inside a function's or class method's body. For instance, instead of:
void MyFunc()
{
for (i = 0; i < N; i++)
AnotherFunc();
....
}the following must be written:
void MyFunc()
{
for (int i = 0; i < N; i++)
AnotherFunc();
....
}In cases like this, the analyzer will suggest changing the variable name to a longer one. The smallest length to satisfy the analyzer is three characters. It also won't generate the warning for variables with the names PI, SI, CR, LF.
The analyzer doesn't generate the warning for variables with short names if they represent structures. Although it's a bad programming practice as well, accidentally using a structure in an incorrect way is less likely. For example, if the programmer by mistake writes the following code:
struct T { int a, b; } i;
void MyFunc()
{
for (i = 0; i < N; i++)
AnotherFunc();
....
}it simply won't compile.
However, the analyzer does get angry about constants with short names. They cannot be changed, but nothing prevents one from using them in an incorrect check. For example:
const float E = 2.71828;
void Foo()
{
S *e = X[i];
if (E)
{
e->Foo();
}
....
}The fixed code:
const float E = 2.71828;
void Foo()
{
S *e = X[i];
if (e)
{
e->Foo();
}
....
}But an even better way is to use a longer name or wrap such constants in a special namespace:
namespace Const
{
const float E = 2.71828;
}You can look at examples of errors detected by the V707 diagnostic. |
V708. Dangerous construction is used: 'm[x] = m.size()', where 'm' is of 'T' class. This may lead to undefined behavior.
The analyzer has detected an instant of undefined behavior related to containers of the map type or similar to it.
An example of incorrect code:
std::map<size_t, size_t> m;
....
m[0] = m.size();This code fragment leads to undefined behavior as the calculation sequence for the operands of the assignment operator is not defined. In case the object already contains an item associated with zero, no troubles will occur. However, if it is absent, program may go on to execute in two different ways depending on the version of the compiler, operating system and so on.
Suppose the compiler will first calculate the right operand of the assignment operator and only after that the left one. Since the container is empty, m.size() returns zero. Zero is then associated with zero and we've got m[0] == 0.
Now suppose the compiler will first calculate the left operand and only then the right one. It is m[0] that will be taken first. Since nothing is associated with zero, an empty association will be created. Then m.size() is calculated. Since the container is not empty anymore, m.size() returns one. After that, one is associated with zero. And the result will be m[0] == 1.
A correct way to fix this code is to use a temporary variable and associate some value with zero in advance:
std::map<size_t, size_t> m;
....
m[0] = 0;
const size_t mapSize = m.size();
m[0] = mapSize;Despite that this situation is not likely to occur often in real code, it is dangerous in that the code fragment leading to undefined behavior is usually very difficult to spot.
This diagnostic is classified as:
|
You can look at examples of errors detected by the V708 diagnostic. |
V709. Suspicious comparison found: 'a == b == c'. Remember that 'a == b == c' is not equal to 'a == b && b == c'.
The analyzer has detected a logical expression of the a == b == c pattern. Unfortunately, programmers tend to forget every now and then that rules of the C and C++ languages do not coincide with mathematical rules (and, at first glance, common sense), and believe they can use this comparison to check if three variables are equal. But actually, a bit different thing will be calculated instead of that.
Let's check an example.
if (a == b == c) ....Let a == 2, b == 2 and c == 2. The first comparison (a == b) is true as 2 == 2. As a result, this comparison returns the value true (1). But the second comparison (... = c) will return the value false because true != 2. To have a comparison of three (or more) variables done correctly, one should use the following expression:
if (a == b && b == c) ....In this case, a == b will return true, b == c will return true and the result of the logical operation AND will also be true.
However, expressions looking similar to incorrect ones are often used to make code shorter. The analyzer won't generate the warning for cases when:
1) The third variable is of the bool, BOOL, etc. types or by itself equals 0, 1, true or false. In this case, the error is very unlikely - the code is almost surely to be correct:
bool compare(int a, int b, bool res)
{
return a == b == res;
}2) The expression contains parentheses. In this case, it is obvious that the programmer understands the expression's logic perfectly well and wants it to be executed exactly the way it is written:
if ((a == b) == c) ....In case the analyzer has generated a false V709 waning, we recommend that you add parentheses into the code to eliminate it, like in the example above. Thus you will indicate to other programmers that the code is correct.
This diagnostic is classified as:
|
You can look at examples of errors detected by the V709 diagnostic. |
V710. Suspicious declaration. There is no point to declare constant reference to a number.
The analyzer has detected a suspicious code fragment where a constant reference to a numerical literal is created. This operation doesn't have any practical sense and is most likely to be a consequence of some typo. It may involve using a wrong macro or something else.
A couple of examples:
const int & u = 7;
const double & v = 4.2;You'd better not suppress this warning but eliminate it by deleting the ampersand character thus turning the reference into a regular constant value (of course, you should check first that it all was meant exactly that way):
const int u = 7;
const double v = 4.2;V711. It is dangerous to create a local variable within a loop with a same name as a variable controlling this loop.
The analyzer has detected a variable declared inside a loop body so that its name coincides with that of the loop control variable. Although it's not always critical for for and foreach (C++11) loops, it is still a bad programming style. For do {} while and while {} loops, however, it's much more dangerous as the new variable inside the loop body may accidentally get changed instead of the variable in the loop condition.
An example:
int ret;
....
while (ret != 0)
{
int ret;
ret = SomeFunctionCall();
while (ret != 0)
{
DoSomeJob();
ret--;
}
ret--;
}In this situation, an infinite loop may occur since the external variable 'ret' in the loop body is not changed at all. An obvious solution in this case is to change the name of the internal variable:
int ret;
....
while (ret != 0)
{
int innerRet;
innerRet = SomeFunctionCall();
while (innerRet != 0)
{
DoSomeJob();
innerRet--;
}
ret--;
}The analyzer doesn't generate the V711 warning for each and every case when a variable has the same name as that used in the loop body. For example, below is a code sample that won't trigger the warning:
int ret;
....
while (--ret != 0)
{
int ret;
ret = SomeFunctionCall();
while (ret != 0)
{
DoSomeJob();
ret--;
}
}Neither does the analyzer generate the warning when suspicious variables are obviously of non-corresponding types (say, a class and a pointer to int). There are much fewer chances to make a mistake in such cases.
This diagnostic is classified as:
|
You can look at examples of errors detected by the V711 diagnostic. |
V712. Compiler may optimize out this loop or make it infinite. Use volatile variable(s) or synchronization primitives to avoid this.
The analyzer has detected a loop with an empty body which may be turned into an infinite loop or removed completely from the program text by the analyzer in the course of optimization. Such loops are usually used when awaiting some external event.
An example:
bool AllThreadsCompleted = false; // Global variable
....
while (!AllThreadsCompleted);In this case, the optimizing compiler will make the loop infinite. Let's take a look at the assembler code from the debug version:
; 8 : AllThreadsCompleted = false;
mov BYTE PTR ?AllThreadsCompleted@@3_NA, 0
; AllThreadsCompleted
$LN2@main:
; 9 :
; 10 : while (!AllThreadsCompleted);
movzx eax, BYTE PTR ?AllThreadsCompleted@@3_NA
; AllThreadsCompleted
test eax, eax
jne SHORT $LN1@main
jmp SHORT $LN2@main
$LN1@main:The check is evidently present here. Now let's look at the release version:
$LL2@main:
; 8 : AllThreadsCompleted = false;
; 9 :
; 10 : while (!AllThreadsCompleted);
jmp SHORT $LL2@mainNow the jump was optimized into a non-conditional one. Such differences between debug and release versions are often a source of complicated and hard-to-detect errors.
There are several ways to solve this issue. If this variable is really meant to be used to control the logic of a multi-threaded program, one should rather use the operating system's synchronization means such as mutexes and semaphores. Another way of fixing it is to add the 'volatile' modifier to the variable declaration to prohibit optimization:
volatile bool AllThreadsCompleted; // Global variable
....
while (!AllThreadsCompleted);Check the corresponding assembler code in the release version:
$LL2@main:
; 9 :
; 10 : while (!AllThreadsCompleted);
movzx eax, BYTE PTR ?AllThreadsCompleted@@3_NC
; AllThreadsCompleted
test al, al
je SHORT $LL2@mainHowever, the V712 diagnostic message sometimes "misses the target" and points to those fragments where no infinite loop should exist at all. In such cases, an empty loop is probably caused by a typo. Then this diagnostic often (but not always) intersects with the V715 diagnostic.
This diagnostic is classified as:
|
You can look at examples of errors detected by the V712 diagnostic. |
V713. Pointer was used in the logical expression before its check for nullptr in the same logical expression.
The analyzer has detected an issue when a pointer is checked for being nullptr after having been used. Unlike the V595 diagnostic, this one covers the range of one logical statement.
Here's an incorrect example.
if (P->x != 0 && P != nullptr) ....In this case, the second check doesn't make any sense. If 'P' equals nullptr, a memory access error will occur when trying to dereference the null pointer. Something is obviously wrong in this code. The easiest way out is to swap the checks in the logical statement:
if (P != nullptr && P->x != 0) ....However, it is always recommended in such cases to additionally carry out code review to find out if that is exactly what the programmer wanted. Perhaps the pointer by itself cannot be nullptr and the check is therefore excessive. Or perhaps a wrong variable is dereferenced or checked for being nullptr. Such cases have to be approached individually and there's no general recommendation to give on that.
This diagnostic is classified as:
|
You can look at examples of errors detected by the V713 diagnostic. |
V714. Variable is not passed into foreach loop by reference, but its value is changed inside of the loop.
The analyzer has detected a suspicious situation: there is a foreach loop in the code, the loop control variable being assigned some value. At the same time, the loop control variable is passed by value. It is more likely to have been meant to be passed by reference.
An example:
for (auto t : myvector)
t = 17;It will cause copying the 't' variable at each iteration and changing the local copy, which is hardly what the programmer wanted. Most likely, he intended to change the values in the 'myvector' container. A correct version of this code fragment should look as follows:
for (auto & t : myvector)
t = 17;This diagnostic detects only the simplest cases of incorrect use of the foreach loop, where there's a higher risk of making a mistake. In more complex constructs, the programmer is more likely to have a clear idea of what he's doing, so you can see constructs like the following one sometimes used in real-life code:
for (auto t : myvector)
{
function(t); // t used by value
// t is used as local variable further on
t = anotherFunction();
if (t)
break;
}The analyzer won't generate the V714 warning on this code.
This diagnostic is classified as:
|
You can look at examples of errors detected by the V714 diagnostic. |
V715. The 'while' operator has empty body. This pattern is suspicious.
The analyzer has detected a strange code fragment with an unusually placed while operator with an empty body. The 'while' operator is standing after a closing parenthesis associated with the body of an 'if', 'for' or another 'while' operator. Such errors may occur when dealing with complex code with a high nesting level. This diagnostic may sometimes intersect with the V712 diagnostic.
An example from a real-life application:
while (node != NULL) {
if ((node->hashCode == code) &&
(node->entry.key == key)) {
return true;
}
node = node->next;
} while (node != NULL);This sample is totally correct from the viewpoint of the C++ language's syntax: the first 'while' loop ends with a closing curly brace and is followed by a second while loop with an empty body. Moreover, the second loop will never become an infinite one as Node will surely be not equal to NULL after leaving the first loop. However, it is obvious that something is wrong with this code. Perhaps the programmer wanted to write a while loop at first but then changed his mind and made a do .... while loop but for some reason didn't change the first condition to do. Or maybe it was the do .... while loop that appeared first and then was replaced with while but only partially. Anyway, there is only one conclusion to draw from this: the code needs reviewing and then rewriting in such a way as to get rid of the meaningless while loop.
If the code is written right as it was supposed to, we recommend that instead of marking it as a false positive you rather move while to the next line in order to explicitly specify that it doesn't refer to the previous block and thus simplify the job of other programmers to maintain the project in future.
This diagnostic is classified as:
|
You can look at examples of errors detected by the V715 diagnostic. |
V716. Suspicious type conversion: HRESULT -> BOOL (BOOL -> HRESULT).
The analyzer has found code that explicitly or implicitly casts a value from the bool or BOOL type to HRESULT type or vice versa. While this operation is possible in terms of C++ language, it does not have any practical meaning. HRESULT type is meant to keep a return status. It has a relatively complicated format and it does not have anything to do with the bool or BOOL type.
It is possible to provide an example from a real-life application:
BOOL WINAPI DXUT_Dynamic_D3D10StateBlockMaskGetSetting(....)
{
if( DXUT_EnsureD3D10APIs() &&
s_DynamicD3D10StateBlockMaskGetSetting != NULL )
....
else
return E_FAIL;
}The main danger here is in the fact that the HRESULT type is, actually, the 'long' type, while the BOOL type is 'int'. These types can be easily cast to each other, and the compiler does not find anything suspicious in code above.
However, from the programmer's point of view, these types are different. While the BOOL type is a logical variable, the HRESULT type has a complex structure and should report an operation's result: was the operation successful; if it was - which result it returned; in case of an error - where the error occurred, in which circumstances etc.
Let's talk about the HRESULT type. The first bit from the left (i.e. the most significant bit) keeps whether operation was successful or not: if it was successful, the first bit is set to zero, if not - to one. The next four bits describe the kind of error. The next eleven bits describe the module that ran into exception. The last sixteen bits, the least significant ones, describe the operation's status: they may hold the error's code if the execution was unsuccessful – or the execution status if the execution was successful. Thus, non-negative values usually show that the operation was successful. In this case, the 'S_OK' macro constant, that equals 0, is frequently used.
The MSDN website provides a detailed description of HRESULT in this article. The most common HRESULT values are listed here.
The BOOL type should be equal to zero to represent the "false" logical value; otherwise, it represents "true" logical value. In other words, these types look like each other in terms of types and their conversion to each other, but the conversion operation makes no sense. The initial idea of the HRESULT type is to keep information about an operation's success or failure - and also to store some additional information if the function call was successful. The HRESULT type's S_FALSE value is the most dangerous because it is equal to 0x1. Successful runs return non-zero values rarely. So, getting such a value could lead to painful debugging: the developer would need to search for errors that show up from time to time.
One may frequently encounter a code fragment that looks something like the one below:
HRESULT result = someWinApiFunction(....);
if (!result)
{
// This is an error!
}Such code is incorrect. The error check will work only if the function executes successfully and returns 0. Meanwhile, the code, that should handle the error, will not work when the function reports a problem by returning a negative number. In such cases, implicit conversions between integer and Boolean types may be part of complex expressions, where the human eye will have a hard time looking for an error.
We encourage developers to use the SUCCEEDED and FAILED macros to control functions' return values.
HRESULT someFunction(int x);
....
BOOL failure = FAILED(someFunction(q));In other cases, refactoring is more complex and requires in-depth code analysis.
A few more words on the main subject. Remember the following:
- FALSE == 0
- TRUE == 1
- S_OK == 0
- S_FALSE == 1
- E_FAIL == 0x80004005
- etc.
Never mix up HRESULT and BOOL. Mixing these types is a serious error in program operation logic. To check HRESULT type values use special macros.
The V543 related diagnostic looks for situations, where 'true' or 'false' values are assigned to the HRESULT type variables
This diagnostic is classified as:
|
You can look at examples of errors detected by the V716 diagnostic. |
V717. It is suspicious to cast object of base class V to derived class U.
Analyzer has found a code that utilizes an unusual type cast: pointer to base class object is cast to pointer to derived class, and pointer to base class actually points to the object of base class.
Casting pointers from the derived class to the base class is a typical situation. However, casting pointers from base class to one of its derivatives sometimes can be erroneous. When types were cast improperly, an attempt to access one of derivative' members may lead to Access Violation or to anything else.
Sometimes programmers makes errors by casting a pointer to base class into pointer to derived class. An example from real application:
typedef struct avatarCacheEntry { .... };
struct CacheNode : public avatarCacheEntry,
public MZeroedObject
{
....
BOOL loaded;
DWORD dwFlags;
int pa_format;
....
};
avatarCacheEntry tmp;
....
CacheNode *cc = arCache.find((CacheNode*)&tmp);
// Now on accessing any derived class fields, for instance,
// cc->loaded, access violation will occur.Unfortunately, it this case it is hard to advice something specific to fix incorrect code - it is likely that refactoring with goals of improving code quality, increasing readability and preventing future mistakes should be required. For instance, if there is no need to access class new fields, it is possible to replace the pointer to the base class with the pointer to derived class.
Code below is considered correct:
base * foo() { .... }
derived *y = (derived *)foo();The idea here is simple: foo() function actually may always return a pointer to one of classes derived from base class, and casting its result to the derived class is pretty common. In general, analyzer shows V717 warning only in case when it is know that it is pointer exactly to the base class being casted to the derived class. However, analyzer would not show V717 warning in case when there are no new non-static members in the derived class (nevertheless, it is still not good, but it is closer to violation of good coding style rather than to actual error):
struct derived : public base
{
static int b;
void bar();
};
....
base x;
derived *y = (derived *)(&x);This diagnostic is classified as:
V718. The 'Foo' function should not be called from 'DllMain' function.
Many of the functions cannot be called within the DllMain() function as it may cause a program to hang or lead to other issues. This diagnostic message indicates that the analyzer has detected a dangerous call of this kind.
There is a good description of the issue with DllMain at MSDN: Dynamic-Link Library Best Practices. Below are a few excerpts from it:
DllMain is called while the loader-lock is held. Therefore, significant restrictions are imposed on the functions that can be called within DllMain. As such, DllMain is designed to perform minimal initialization tasks, by using a small subset of the Microsoft Windows API. You cannot call any function in DllMain that directly or indirectly tries to acquire the loader lock. Otherwise, you will introduce the possibility that your application deadlocks or crashes. An error in a DllMain implementation can jeopardize the entire process and all of its threads.
The ideal DllMain would be just an empty stub. However, given the complexity of many applications, this is generally too restrictive. A good rule of thumb for DllMain is to postpone as much initialization as possible. Lazy initialization increases robustness of the application because this initialization is not performed while the loader lock is held. Also, lazy initialization enables you to safely use much more of the Windows API.
Some initialization tasks cannot be postponed. For example, a DLL that depends on a configuration file should fail to load if the file is malformed or contains garbage. For this type of initialization, the DLL should attempt the action and fail quickly rather than waste resources by completing other work.
You should never perform the following tasks from within DllMain:
- Call LoadLibrary or LoadLibraryEx (either directly or indirectly). This can cause a deadlock or a crash.
- Call GetStringTypeA, GetStringTypeEx, or GetStringTypeW (either directly or indirectly). This can cause a deadlock or a crash.
- Synchronize with other threads. This can cause a deadlock.
- Acquire a synchronization object that is owned by code that is waiting to acquire the loader lock. This can cause a deadlock.
- Initialize COM threads by using CoInitializeEx. Under certain conditions, this function can call LoadLibraryEx.
- Call the registry functions. These functions are implemented in Advapi32.dll. If Advapi32.dll is not initialized before your DLL, the DLL can access uninitialized memory and cause the process to crash.
- Call CreateProcess. Creating a process can load another DLL.
- Call ExitThread. Exiting a thread during DLL detach can cause the loader lock to be acquired again, causing a deadlock or a crash.
- Call CreateThread. Creating a thread can work if you do not synchronize with other threads, but it is risky.
- Create a named pipe or other named object (Windows 2000 only). In Windows 2000, named objects are provided by the Terminal Services DLL. If this DLL is not initialized, calls to the DLL can cause the process to crash.
- Use the memory management function from the dynamic C Run-Time (CRT). If the CRT DLL is not initialized, calls to these functions can cause the process to crash.
- Call functions in User32.dll or Gdi32.dll. Some functions load another DLL, which may not be initialized.
- Use managed code.
You can look at examples of errors detected by the V718 diagnostic. |
V719. The switch statement does not cover all values of the enum.
The analyzer has detected a suspicious 'switch' operator. The choice of an option is made through an enum-variable. While doing so, however, not all the possible cases are considered.
Take a look at the following example:
enum TEnum { A, B, C, D, E, F };
....
TEnum x = foo();
switch (x)
{
case A: Y(11); break;
case B: Y(22); break;
case C: Y(33); break;
case D: Y(44); break;
case E: Y(55); break;
}The TEnum enumeration contains 6 named constants. But inside the 'switch' operator, only 5 of them are used. It's highly probable that this is an error.
This error often occurs as a result of careless refactoring. The programmer added the 'F' constant into 'TEnum' and fixed some of the 'switch' but forgot about the others. It resulted in the 'F' value being processed incorrectly.
The analyzer will warn about the non-used 'F' constant. Then the programmer can fix the mistake:
switch (x)
{
case A: Y(11); break;
case B: Y(22); break;
case C: Y(33); break;
case D: Y(44); break;
case E: Y(55); break;
case F: Y(66); break;
}It's far not always that the analyzer generates the warning for cases when some of the constants of an enum are not used in 'switch'. Otherwise, there would be too many false positives. There are a number of empirical exceptions to the rule. Here are the basic ones:
- A default-branch;
- The enum contains only 1 or 2 constants;
- More than 4 constants are not used in switch;
- The name of the missing constant contains None, Unknown, etc.
- The missing constant is the very last one in the enum and its name contains "end", "num", "count" and the like.
The user can explicitly define a list of names for the last item in an enum. In this case, the analyzer will only use these user-defined names instead of the list of default names such as "num" or "count". The comment to control the behavior of the V719 diagnostic is as follows:
//-V719_COUNT_NAME=ABCD,FOOYou can add this comment into one of the files included into all the other ones - for example StdAfx.h.
Introduced exceptions is a deliberate decision, use-proven in practice. The only thing we should discuss in more detail is the case when warnings are not generated when there is a 'default' branch. This exception is not always good.
On the one hand, the analyzer must not go mad about non-used constants when a 'default' is present in the code. There would be too many false positives otherwise and users would simply turn off this diagnostic. On the other hand, it's quite a typical situation when you need to consider all the options in 'switch' while the 'default' branch is used to catch alert conditions. For example:
enum TEnum { A, B, C, D, E, F };
....
TEnum x = foo();
switch (x)
{
case A: Y(11); break;
case B: Y(22); break;
case C: Y(33); break;
case D: Y(44); break;
case E: Y(55); break;
default:
throw MyException("Ouch! One of the cases is missing!");
}The error can be detected only at runtime. Sure, one would like this issue to be diagnosed by the analyzer as well. In the most crucial code fragments, you may do the following:
enum TEnum { A, B, C, D, E, F };
....
TEnum x = foo();
switch (x)
{
case A: Y(11); break;
case B: Y(22); break;
case C: Y(33); break;
case D: Y(44); break;
case E: Y(55); break;
#ifndef PVS_STUDIO
default:
throw MyException("Ouch! One of the cases is missing!");
#endif
}What is used here is a predefined PVS-Studio macro. This macro is absent during compilation, so when compiling the exe file, the 'default' branch remains where it is and an exception is thrown if an error occurs.
When checking the code with PVS-Studio, the PVS_STUDIO macro is predefined and this prevents the analyzer from noticing the default-branch. Therefore, it will check 'switch', detect the non-used 'F' constant, and generate the warning.
The fixed code:
switch (x)
{
case A: Y(11); break;
case B: Y(22); break;
case C: Y(33); break;
case D: Y(44); break;
case E: Y(55); break;
case F: Y(66); break;
#ifndef PVS_STUDIO
default:
throw MyException("Ouch! One of the cases is missing!");
#endif
}The approach described above doesn't look neat. But if you worry about some of the 'switch' and want to make sure you have protected it, this method is quite applicable.
This diagnostic is classified as:
|
You can look at examples of errors detected by the V719 diagnostic. |
V720. The 'SuspendThread' function is usually used when developing a debugger. See documentation for details.
- Why you should never suspend a thread
- The SuspendThread function suspends a thread, but it does so asynchronously
The analyzer has detected that the SuspendThread() or Wow64SuspendThread() function is used in the program. Calling these functions is in itself not an error. But developers tend to use them inappropriately. It may result in the program's misbehavior.
The SuspendThread() function is designed to assist the development of debuggers and other similar applications. If you use this function in your application for syncing tasks, it's highly probable that your program contains an error.
The problem with the misuse of the SuspendThread() function is discussed in the following articles:
- Why you should never suspend a thread.
- The SuspendThread function suspends a thread, but it does so asynchronously.
Please read them. If you find that the SuspendThread() function is used incorrectly in your code, then you need to rewrite it. If everything is OK, simply turn off the V720 diagnostic in the analyzer's settings.
Articles published on the Internet sometimes disappear or change their location. Therefore, we cite the text of both articles in the documentation, just in case.
Why you should never suspend a thread
It's almost as bad as terminating a thread.
Instead of just answering a question, I'm going to ask you the questions and see if you can come up with the answers.
Consider the following program, in (gasp) C#:
using System.Threading;
using SC = System.Console;
class Program {
public static void Main() {
Thread t = new Thread(new ThreadStart(Program.worker));
t.Start();
SC.WriteLine("Press Enter to suspend");
SC.ReadLine();
t.Suspend();
SC.WriteLine("Press Enter to resume");
SC.ReadLine();
t.Resume();
}
static void worker() {
for (;;) SC.Write("{0}\r", System.DateTime.Now);
}
}When you run this program and hit Enter to suspend, the program hangs. But if you change the worker function to just "for(;;) {}" the program runs fine. Let's see if we can figure out why.
The worker thread spends nearly all its time calling System.Console.WriteLine, so when you call Thread.Suspend(), the worker thread is almost certainly inside the System.Console.WriteLine code.
Q: Is the System.Console.WriteLine method threadsafe?
Okay, I'll answer this one: Yes. I didn't even have to look at any documentation to figure this out. This program calls it from two different threads without any synchronization, so it had better be threadsafe or we would be in a lot of trouble already even before we get around to suspending the thread.
Q: How does one typically make an object threadsafe?
Q: What is the result of suspending a thread in the middle of a threadsafe operation?
Q: What happens if - subsequently - you try to access that same object (in this case, the console) from another thread?
These results are not specific to C#. The same logic applies to Win32 or any other threading model. In Win32, the process heap is a threadsafe object, and since it's hard to do very much in Win32 at all without accessing the heap, suspending a thread in Win32 has a very high chance of deadlocking your process.
So why is there even a SuspendThread function in the first place?
Debuggers use it to freeze all the threads in a process while you are debugging it. Debuggers can also use it to freeze all but one thread in a process, so you can focus on just one thread at a time. This doesn't create deadlocks in the debugger since the debugger is a separate process.
The SuspendThread function suspends a thread, but it does so asynchronously
Okay, so a colleague decided to ignore that advice because he was running some experiments with thread safety and interlocked operations, and suspending a thread was a convenient way to open up race windows.
While running these experiments, he observed some strange behavior.
LONG lValue;
DWORD CALLBACK IncrementerThread(void *)
{
while (1) {
InterlockedIncrement(&lValue);
}
return 0;
}
// This is just a test app, so we will abort() if anything
// happens we don't like.
int __cdecl main(int, char **)
{
DWORD id;
HANDLE thread = CreateThread(NULL, 0, IncrementerThread, NULL, 0,
&id);
if (thread == NULL) abort();
while (1) {
if (SuspendThread(thread) == (DWORD)-1) abort();
if (InterlockedOr(&lValue, 0) != InterlockedOr(&lValue, 0))
{
printf("Huh? The variable lValue was modified by a suspended
thread?\n");
}
ResumeThread(thread);
}
return 0;
}The strange thing is that the "Huh?" message was being printed. How can a suspended thread modify a variable? Is there some way that InterlockedIncrement can start incrementing a variable, then get suspended, and somehow finish the increment later?
The answer is simpler than that. The SuspendThread function tells the scheduler to suspend the thread but does not wait for an acknowledgment from the scheduler that the suspension has actually occurred. This is sort of alluded to in the documentation for SuspendThread which says:
This function is primarily designed for use by debuggers. It is not intended to be used for thread synchronization.
You are not supposed to use SuspendThread to synchronize two threads because there is no actual synchronization guarantee. What is happening is that the SuspendThread signals the scheduler to suspend the thread and returns immediately. If the scheduler is busy doing something else, it may not be able to handle the suspend request immediately, so the thread being suspended gets to run on borrowed time until the scheduler gets around to processing the suspend request, at which point it actually gets suspended.
If you want to make sure the thread really is suspended, you need to perform a synchronous operation that is dependent on the fact that the thread is suspended. This forces the suspend request to be processed since it is a prerequisite for your operation, and since your operation is synchronous, you know that by the time it returns, the suspend has definitely occurred.
The traditional way of doing this is to call GetThreadContext, since this requires the kernel to read from the context of the suspended thread, which has as a prerequisite that the context be saved in the first place, which has as a prerequisite that the thread be suspended.
V721. The VARIANT_BOOL type is used incorrectly. The true value (VARIANT_TRUE) is defined as -1.
The analyzer has detected an incorrect use of the VARIANT_BOOL type. The reason is that the value true (VARIANT_TRUE) is designated as -1. Many programmers are unaware of this detail and tend to use this type incorrectly.
This is how the VARIANT_TRUE type and constants denoting "true" and "false" are declared:
typedef short VARIANT_BOOL;
#define VARIANT_TRUE ((VARIANT_BOOL)-1)
#define VARIANT_FALSE ((VARIANT_BOOL)0)Let's take a look at a few examples when the VARIANT_TRUE type is used incorrectly. In all the cases, the programmer expects the condition to be true, while it is actually always false.
Example 1.
VARIANT_BOOL variantBoolTrue = VARIANT_TRUE;
if (variantBoolTrue == true) //falseIf we substitute the value into the expression, we'll get ((short)(-1) == true). When this expression is evaluated, 'true' will turn into '1'. The condition (-1 == 1) is false.
The correct code:
if (variantBoolTrue == VARIANT_TRUE)Example 2.
VARIANT_BOOL variantBoolTrue = TRUE;
if (variantBoolTrue == VARIANT_TRUE) //falseThe programmer made a mistake here and used TRUE instead of VARIANT_TRUE. It will result in the variantBoolTrue variable being assigned the value 1. This value is illegal for variables of the VARIANT_BOOL type.
If we substitute the value into the expression, we will get (1 == (short)(-1)).
The correct code:
VARIANT_BOOL variantBoolTrue = VARIANT_TRUE;Example 3.
bool bTrue = true;
if (bTrue == VARIANT_TRUE) //falseLet's expand the expression: (true == (short)(-1)). When it is evaluated, 'true' will turn into '1'. The condition (1 == -1) is false.
It's not easy to suggest a correct version of this code as it is just fundamentally incorrect. One can't mix variables of the 'bool' type and values of the 'VARIANT_TRUE' type.
There are numbers of other examples like these to be found in code. For instance, when a function's formal argument is of the VARIANT_BOOL type but it is the 'true' value that will be passed as the actual one. Another example is when a function returns an incorrect value. And so on and so forth.
The most important thing you should keep in mind is that you can't mix the VARIANT_BOOL type with the types BOOL, bool, and BOOLEAN.
References:
- MSDN. VARIANT_BOOL.
- The Old New Thing. BOOL vs. VARIANT_BOOL vs. BOOLEAN vs. bool.
This diagnostic is classified as:
You can look at examples of errors detected by the V721 diagnostic. |
V722. Abnormality within similar comparisons. It is possible that a typo is present inside the expression.
The analyzer found suspicious condition that may contain an error.
The diagnosis is empirical, that is why it is easier to demonstrate it on the example than to explain the working principle of the analyzer.
Consider the real example:
if (obj.m_p == p &&
obj.m_forConstPtrOp == forConstVarOp &&
obj.m_forConstPtrOp == forConstPtrOp)Because of the similarity of the variable names, there is a typo in the code. An error is located on the second line. The variable 'forConstVarOp' should be compared with 'm_forConstVarOp' rather than with 'm_forConstPtrOp'. It is difficult to notice the error even when reading this text. Please, pay attention to 'Var' and 'Ptr' within the variable names.
The right variant:
if (obj.m_p == p &&
obj.m_forConstVarOp == forConstVarOp &&
obj.m_forConstPtrOp == forConstPtrOp)If the analyzer issued the warning V722, then carefully read the corresponding code. Sometimes it is difficult to notice a typo.
This diagnostic is classified as:
|
V723. Function returns a pointer to the internal string buffer of a local object, which will be destroyed.
The analyzer has detected an issue when a function returns a pointer to the internal string buffer of a local object. This object will be automatically destroyed together with its buffer after leaving the function, so you won't be able to use the pointer to it.
The most common and simple code example triggering this message looks like this:
const char* Foo()
{
std::string str = "local";
return str.c_str();
}In this code, the Foo() function returns a C-string stored in the internal buffer of the str object which will be automatically destroyed. As a result, we'll get an incorrect pointer that will cause undefined behavior when we try to use it. The fixed code should look as follows:
const char* Foo()
{
static std::string str = "static";
return str.c_str();
}This diagnostic is classified as:
|
V724. Converting integers or pointers to BOOL can lead to a loss of high-order bits. Non-zero value can become 'FALSE'.
The analyzer has detected an issue when casting pointers or integer variables to the BOOL type may cause a loss of the most significant bits. As a result, a non-zero value which actually means TRUE may unexpectedly turn to FALSE.
In programs, the BOOL (gboolean, UBool, etc.) type is interpreted as an integer type. Any value other than zero is interpreted as true, and zero as false. Therefore, a loss of the most significant bits resulting from type conversion will cause an error in the program execution logic.
For example:
typedef long BOOL;
__int64 lLarge = 0x12300000000i64;
BOOL bRes = (BOOL) lLarge;In this code, a non-zero variable is truncated to zero when being cast to BOOL, which renders it FALSE.
Here are a few other cases of improper type conversion:
int *p;
size_t s;
long long w;
BOOL x = (BOOL)p;
BOOL y = s;
BOOL z = (BOOL)s;
BOOL q = (BOOL)w;To fix errors like these, we need to perform a check for a non-zero value before BOOL conversion.
Here are the various ways to fix these issues:
int *p;
size_t s;
long long w;
BOOL x = p != nullptr;
BOOL y = s != 0;
BOOL z = s ? TRUE : FALSE;
BOOL q = !!w;This diagnostic is classified as:
|
You can look at examples of errors detected by the V724 diagnostic. |
V725. Dangerous cast of 'this' to 'void*' type in the 'Base' class, as it is followed by a subsequent cast to 'Class' type.
The analyzer has detected a dangerous conversion of the "this" pointer to the "void*" type followed by a conversion of "void*" back to the class type. Casting "this" to "void*" is not in itself an error, but in certain cases the reverse conversion (from "void*" to the class pointer) is, which may be dangerous as the resulting pointer may appear incorrect.
The diagnostic description is pretty large and complex, but unfortunately I cannot help it. So please read it carefully to the end.
Let's discuss an example where "this" is cast to "void*" and after that the reverse conversion to the class type takes place:
class A
{
public:
A() : firstPart(1){}
void printFirstPart() { std::cout << firstPart << " "; }
private:
int firstPart;
};
class B
{
public:
B() : secondPart(2){}
void* GetAddr() const { return (void*)this; }
void printSecondPart() { std::cout << secondPart << " "; }
private:
int secondPart;
};
class C: public A, public B
{
public:
C() : A(), B(), thirdPart(3){}
void printThirdPart() { std::cout << thirdPart << " "; }
private:
int thirdPart;
};
void func()
{
C someObject;
someObject.printFirstPart();
someObject.printSecondPart();
someObject.printThirdPart();
void *pointerToObject = someObject.GetAddr();
....
auto pointerC = static_cast<C*>(pointerToObject);
pointerC->printFirstPart();
pointerC->printSecondPart();
pointerC->printThirdPart();
}We would expect to get the following output:
1 2 3 1 2 3But what will be actually printed is something like this:
1 2 3 2 3 -858993460So, we get an incorrect output for all the data after the mentioned conversion sequence. The trouble is that the "pointerC" pointer is now pointing to the memory block allocated for object B, instead of the beginning of the C object as it did before.
This error may seem farfetched and unreal. But it is only obvious because the example above is short and simple. In real-life programs with complex class hierarchies, it may be far more confusing and vague. What makes this issue especially tricky is that when the "GetAddr()" function is stored in class A, everything works right, but if you store it in class B, then it doesn't. That may be quite embarrassing. So let's figure it all out.
To make it easier for you to understand the reason behind the error, we need to find out how objects of classes created through multiple inheritance are constructed and arranged in memory.
A schematic example is shown in Figure 1.

Figure 1 - Arrangement of an object of a class created through multiple inheritance in memory
As you can see from this figure, the object of class C (which is the one created through multiple inheritance) consists of the objects of classes A and B plus a part of object C.
Each of the "this" pointers contains the address of the beginning of the memory block allocated for the corresponding object. Figure 2 shows where "this" pointers point to for all the three objects.

Figure 2 - "this" pointers and memory blocks
Since the C-class object consists of three parts, its "this" pointer will be pointing not to the memory block added to the base classes, but to the beginning of the entire continuous memory block. That is, "this" pointers for classes A and C will coincide in this case.
The "this" pointer for the B-class object points to where the memory block allocated for it starts, but at the same time, the address of the beginning of this memory block is different from that of the memory block allocated for the C-class object.
So, when calling the "GetAddr()" method, we will get the address of object B and then, after casting the resulting pointer back to type "C*", we will get an incorrect pointer.
In other words, if the "GetAddr()" function were stored in class A, the program would work as expected. But when it is stored in B, we get an error.
To avoid errors like this, the programmer should carefully consider if they really need to cast "this" to "void*", and if the answer is certainly yes, then they must carefully check the inheritance hierarchy as well as any further reverse conversions from "void*" to the class pointer type.
References:
- Joost's Dev Blog. Hardcore C++: why "this" sometimes doesn't equal "this".
This diagnostic is classified as:
V726. Attempt to free memory containing the 'int A[10]' array by using the 'free(A)' function.
The analyzer has detected incorrect code, where an attempt is made to delete an array through the free() or other similar function while no corresponding special functions, such as malloc(), have been used to allocate the memory for this array. This issue leads to undefined behavior.
For example:
class A
{
int x;
int a[50];
public:
A(){}
~A(){ free(a); }
};Since the memory hasn't been allocated in any special way, it shouldn't be freed by calling special functions either as it will be freed automatically once the object is destroyed. Therefore, the correct code should look like this:
class A
{
int x;
int a[50];
public:
A(){}
~A(){}
};This diagnostic is classified as:
|
You can look at examples of errors detected by the V726 diagnostic. |
V727. Return value of 'wcslen' function is not multiplied by 'sizeof(wchar_t)'.
The analyzer has detected an expression which it believes to be used for calculating the size (in bytes) of a buffer intended for storing a string. This expression is written with an error.
When solving the task of calculating the size of a char string, the standard solution is to use the "strlen(str) + 1" construct. The strlen() function calculates the length of some string, while 1 is used to reserve one byte for the null character. But when dealing with strings of the types wchar_t, char16_t, or char32_t, always remember to multiply the "strlen(str) + 1" expression by the size of one character, i.e. 'sizeof(T)'.
Let's examine a few synthetic error samples.
Example No. 1:
wchar_t *str = L"Test";
size_t size = wcslen(str) + 1 * sizeof(wchar_t);Because of the missing parentheses, 'sizeof' is multiplied by 1 first and then the resulting value is added to 'strln(str)' function. The correct code should look as follows:
size_t size = (wcslen(str) + 1) * sizeof(wchar_t);Example No. 2:
The expression may be written in a different order, when it is the function result which is multiplied by 'sizeof' first and then the resulting value is added to 1.
.... = malloc(sizeof(wchar_t) * wcslen(str) + 1);It may also happen that you remember in the middle of writing the code that you should multiply the string length by "sizeof(wchar_t)" but add 1 out of habit. It will result in allocating 1 byte less memory than required.
The correct versions of the code look as follows:
.... = malloc(wcslen(str) * sizeof(wchar_t) + 1 * sizeof(wchar_t));
.... = malloc((wcslen(str) + 1) * sizeof(wchar_t));This diagnostic is classified as:
|
V728. Excessive check can be simplified. The '||' operator is surrounded by opposite expressions 'x' and '!x'.
The analyzer has detected code that can be simplified. The left and right operands of the '||' operation are expressions with opposite meanings. This code is redundant and can be simplified by reducing the number of checks.
Here's an example of redundant code:
if (!Name || (Name && Name[0] == 0))In the "Name && Name[0] == 0" expression, the 'Name' check is excessive because before it, the expression '!Name', which is opposite to it, is checked, these expressions being separated by the '||' operation. Consequently, the excessive check in the parentheses can be omitted to simplify the code:
if (!Name || Name[0] == 0)Redundancy may indicate there is an error in the code: it might be that a wrong variable is used in the expression, so the correct version of the code should really look something like this:
if (!Foo || (Name && Name[0] == 0))The analyzer outputs this warning not only for 'x' and '!x' constructs, but for other expressions with opposite meanings as well. For example:
if (a > 5 || (a <= 5 && b))This diagnostic is classified as:
You can look at examples of errors detected by the V728 diagnostic. |
V729. Function body contains the 'X' label that is not used by any 'goto' statements.
The analyzer has detected that a function body contains a label with no 'goto' statement referring to it. It might be the programmer's mistake, resulting in a jump to a wrong label somewhere in the code.
Here's a synthetic example of incorrect code:
string SomeFunc(const string &fStr)
{
string str;
while(true)
{
getline(cin,str);
if (str == fStr)
goto retRes;
else if(str == "stop")
goto retRes;
}
retRes:
return str;
badRet:
return "fail";
}The function body contains the 'badRet' label, which no 'goto' statement refers to, while another label in this function, 'retRes', has an associated 'goto' statement. The programmer made a mistake and duplicated the jump to the 'retRes' label instead of the 'badRet' label.
The correct version of this code can look as follows:
string SomeFunc(const string &fStr)
{
string str;
while(true)
{
getline(cin,str);
if (str == fStr)
goto retRes;
else if(str == "stop")
goto badRet;
}
retRes:
return str;
badRet:
return "fail";
}Here's another example of this error:
int DeprecatedFunc(size_t lhs, size_t rhs, bool cond)
{
if (cond)
return lhs*3+rhs;
else
return lhs*2 + rhs*7;
badLbl:
return -1;
}For this code, the analyzer will output a low-severity-level warning as the 'badLbl' label is a leftover after some changes in the function, while all the 'goto' statements referring to it were deleted.
The analyzer won't output the warning when the function body contains a 'goto' statement referring to the label in question, this statement being commented out or excluded through the '#ifdef' directive.
You can look at examples of errors detected by the V729 diagnostic. |
V730. Not all members of a class are initialized inside the constructor.
The analyzer has detected a constructor that doesn't initialize some of the class members.
Here's a simple synthetic example:
struct MyPoint
{
int m_x, m_y;
MyPoint() { m_x = 0; }
void Print() { cout << m_x << " " << m_y; }
};
MyPoint Point;
Point.Print();When creating the Point object, a constructor will be called that won't initialize the 'm_y' member. Accordingly, when calling the Print function, an uninitialized variable will be used. The consequences of this are unpredictable.
The correct version of the constructor should look like this:
MyPoint() { m_x = 0; m_y = 0; }We have discussed a simple synthetic example, where a bug can be easily spotted. However, in real-life code, things may be much more complicated. Search of uninitialized class members is implemented through a set of empirical algorithms. Firstly, class members can be initialized in a large variety of ways, and it's sometimes difficult for the analyzer to figure out whether or not a class member has been initialized. Secondly, not all the members should be initialized all the time, and the analyzer may output false positive warnings as it doesn't know the programmer's intentions.
Search of uninitialized class members is a difficult and thankless task. This matter is discussed in more detail in the article "In search of uninitialized class members". So please be understanding when you get false positives and use the false positive suppression mechanisms the analyzer provides.
You can suppress a warning by marking the constructor with the comment "//-V730". Another way is to use a special database for false positives. As a last resort, when there are too many of them, consider disabling the V730 diagnostic altogether.
But these are extreme measures. In practice, it might make sense to exclude from analysis individual structure members that don't need to be initialized in the constructor. Here's another synthetic example:
const size_t MAX_STACK_SIZE = 100;
class Stack
{
size_t m_size;
int m_array[MAX_STACK_SIZE];
public:
Stack() : m_size(0) {}
void Push(int value)
{
if (m_size == MAX_STACK_SIZE)
throw std::exception("overflow");
m_array[m_size++] = value;
}
int Pop()
{
if (m_size == 0)
throw std::exception("underflow");
return m_array[--m_size];
}
};This class implements a stack. The 'm_array' array is not initialized in the constructor, and that's correct because the stack is considered originally empty.
The analyzer will output warning V730 as it can't figure out how this class works. You can help it by marking the 'm_array' member with the comment "//-V730_NOINIT" to specify that the 'm_array' array doesn't need to be necessarily initialized.
From that point on, the analyzer won't produce the warning when analyzing this code:
class Stack
{
size_t m_size;
int m_array[MAX_STACK_SIZE]; //-V730_NOINIT
public:
Stack() : m_size(0) {}
.....
};There is a way to disable V730 warnings for all class fields of a certain type.
Let's consider the example:
class Field
{
public:
int f;
};
class Test
{
public:
Test() {}
Field field;
};The following warning will be issued for this code fragment: V730 Not all members of a class are initialized inside the constructor. Consider inspecting: field.
To exclude all warnings of a class field of the type 'Field', one has to add the following comment in the code or settings file:
//+V730:SUPPRESS_FIELD_TYPE, class:FieldThe format of the comment:
//+V730:SUPPRESS_FIELD_TYPE, class:className, namespace:nsNameor
//+V730:SUPPRESS_FIELD_TYPE, class:className.NestedClassName, namespace:nsNameThis diagnostic is classified as:
|
You can look at examples of errors detected by the V730 diagnostic. |
V731. The variable of char type is compared with pointer to string.
The analyzer has detected a comparison of a char variable with a pointer to a string. The reason why the variable is used that way is in using double quotes (") instead of single quotes (') by mistake.
Here's an example for this error pattern:
char ch = 'd';
....
if(ch == "\n")
....The inattentive author of this code wanted to compare the 'ch' variable with a new string's character but used quotes of a wrong type. This resulted in the value of the 'ch' variable being compared to the "\n" string's address. Code like that can compile and execute well in C but usually makes no sense. The correct version of the code sample above should use single quotes instead of double ones:
char ch = 'd';
....
if(ch == '\n')
....The same kind of mistake can be also made when initializing or assigning a value to a variable, causing this variable to store the least significant byte of the address of the string being assigned.
char ch = "d";The correct version of the code should use single quotes.
char ch = 'd';This diagnostic is classified as:
V732. Unary minus operator does not modify a bool type value.
The analyzer has detected an issue when the unary minus operator is applied to a value of type bool, BOOL, _Bool, and the like.
Consider the following example:
bool a;
....
bool b = -a;This code doesn't make sense. The expressions in it are evaluated based on the following logic:
If a == false then 'false' turns into an int value 0. The '-' operator is then applied to this value, without affecting it of course, so it is 0 (i.e. false) that will be written into 'b'.
If a == true then 'true' turns into an int value 1. The '-' operator is then applied to it, resulting in value -1. However, -1 != 0; therefore, we'll still get value 'true' when writing -1 into a variable of the bool type.
So 'false' will remain 'false' and 'true' will remain 'true'.
The correct version of the assignment operation in the code above should use the '!' operator:
bool a;
....
bool b = !a;Consider another example (BOOL is nothing but the int type):
BOOL a;
....
BOOL b = -a;The unary minus can change the numerical value of a variable of type BOOL, but not its logical value. Any non-zero value will stand for 'true', while zero will still refer to 'false'.
Correct code:
BOOL a;
....
BOOL b = !a;Note. Some programmers deliberately use constructs of the following pattern:
int val = Foo();
int s;
s = -(val<0);The analyzer does produce warnings on constructs like that. There's no error here, but we still do not recommend writing your code that way.
Depending on the 'val' value, the 's' variable will be assigned either 0 or -1. Applying the unary minus to a logical expression only makes the code less comprehensible. Using the ternary operator instead would be more appropriate here.
s = (val < 0) ? -1 : 0;This diagnostic is classified as:
|
You can look at examples of errors detected by the V732 diagnostic. |
V733. It is possible that macro expansion resulted in incorrect evaluation order.
The analyzer has detected a potential error that has to do with the use of macros expanding into arithmetic expressions. One normally expects that the subexpression passed as a parameter into a macro will be executed first in the resulting expression. However, it may not be so, and this results in bugs that are difficult to diagnose.
Consider this example:
#define RShift(a) a >> 3
....
y = RShift(x & 0xFFF);If we expand the macro, we'll get the following expression:
y = x & 0xFFF >> 3;
Operation ">>" has higher priority than "&". That's why the expression will be evaluated as "x & (0xFFF >> 3)", while the programmer expected it to be "(x & 0xFFF) >> 3".
To fix this, we need to put parentheses around the 'a' argument:
#define RShift(a) (a) >> 3However, there is one more improvement we should make. It is helpful to parenthesize the whole expression in the macro as well. This is considered good style and can help avoid some other errors. This is what the final improved version of the sample code looks like:
#define RShift(a) ((a) >> 3)Note. This diagnostic is similar to V1003. The latter is less accurate and produces more false positives since it deals with a macro declaration rather than the expanded macro. On the other hand, despite its flaws, diagnostic V1003 can detect errors that V733 cannot.
This diagnostic is classified as:
|
You can look at examples of errors detected by the V733 diagnostic. |
V734. Excessive expression. Examine the substrings "abc" and "abcd".
The analyzer detected a potential bug, connected with the fact that a longer and shorter substrings are searched in the expression. With all that a shorter string is a part of a longer one. As a result, one of the comparisons is redundant or there is a bug here.
Consider the following example:
if (strstr(a, "abc") != NULL || strstr(a, "abcd") != NULL)If substring "abc" is found, the check will not execute any further. If substring "abc" is not found, then searching for longer substring "abcd" does not make sense either.
To fix this error, we need to make sure that the substrings were defined correctly or delete extra checks, for example:
if (strstr(a, "abc") != NULL)Here's another example:
if (strstr(a, "abc") != NULL)
Foo1();
else if (strstr(a, "abcd") != NULL)
Foo2();In this code, function Foo2() will never be called. We can fix the error by reversing the check order to make the program search for the longer substring first and then search for the shorter one:
if (strstr(a, "abcd") != NULL)
Foo2();
else if (strstr(a, "abc") != NULL)
Foo1();You can look at examples of errors detected by the V734 diagnostic. |
V735. Possibly an incorrect HTML. The "</XX>" closing tag was encountered, while the "</YY>" tag was expected.
The analyzer has detected a string literal containing HTML markup with errors: a closing tag required for an element does not correspond with its opening tag.
Consider the following example:
string html = "<B><I>This is a text, in bold italics.</B>";In this code, the opening tag "<I>" must be matched with closing tag "</I>"; instead, closing tag "</B>" is encountered further in the string. This is an error, which renders this part of the HTML code invalid.
To fix the error, correct sequences of opening and closing tags must be ensured.
This is what the fixed version of the code should look like:
string html = "<B><I>This is a text, in bold italics.</I></B>";You can look at examples of errors detected by the V735 diagnostic. |
V736. The behavior is undefined for arithmetic or comparisons with pointers that do not point to members of the same array.
The behavior is undefined if arithmetic or comparison operations are applied to pointers that point to items belonging to different arrays.
Consider the following example:
int a[10], b[20];
fill(a, b);
if (&a[1] > &b[2])There is some bug in this code. For example, it could have been affected by bad "find and replace" in some lines. Assume that the '&' operators are unnecessary here. Then the fixed version should look like this:
if (a[1] > b[2])This diagnostic is classified as:
|
V737. It is possible that ',' comma is missing at the end of the string.
The analyzer suspects that a comma may be missing in the array initialization list.
Consider the following example:
int a[3][6] = { { -1, -2, -3
-4, -5, -6 },
{ ..... },
{ ..... } };A comma was omitted by mistake after the value "-3", followed by "-4". As a result, they form a single expression, "-3-4". This code compiles well, but the array turns out to be initialized incorrectly. The values "-5" and "-6" will be written into wrong positions, and 0 will be written into the last item.
That is, the array will actually be initialized in the following way:
int a[3][6] = { { -1, -2, -7,
-5, -6, 0 },
..............The fixed version of the code (with the missing comma restored) should look like this:
int a[3][6] = { { -1, -2, -3,
-4, -5, -6 },
..............This diagnostic is classified as:
You can look at examples of errors detected by the V737 diagnostic. |
V738. Temporary anonymous object is used.
The analyzer detected that a temporary anonymous object is used which is created as a result of executing the postfix ++ or -- operator. It does make sense sometimes, but it is certainly an error when such temporary object is changed or its address is retrieved.
Consider the following example:
vector<float>::iterator it = foo();
it++ = x;In this code, a temporary copy of an iterator is created. Then the iterator is incremented. After that, the assignment operator is applied to the temporary object. This code doesn't make sense; the author obviously wanted it to do something else. For example, they may have intended to execute the assignment operation first and only then the increment operation.
In that case, the fixed version of the code should look like this:
it = x;
it++;However, postfix operations are not efficient with iterators, and a better version would be the following:
it = x;
++it;An alternative version:
it = x + 1;Here's another example:
const vector<int>::iterator *itp = &it++;The 'itp' pointer can't be used as it points to a temporary unnamed object already destroyed. The correct version:
++it;
const vector<int>::iterator *itp = This diagnostic is classified as:
|
V739. EOF should not be compared with a value of the 'char' type. Consider using the 'int' type.
The analyzer detected that the EOF constant is compared with a variable of type 'char' or 'unsigned char'. Such comparison implies that some of the characters won't be processed correctly.
Let's see how EOF is defined:
#define EOF (-1)That is, EOF is actually but the value '-1' of type 'int'. Let's see what complications may occur. The first example:
unsigned char c;
while ((c = getchar()) != EOF)
{ .... }The unsigned variable 'c' can never refer to the negative value '-1', so the expression ((c = getchar) != EOF) is always true and an infinite loop occurs. An error like that would be noticed and fixed right off in a real program, so there's no need to discuss the 'unsigned char' type further.
Here's a more interesting case:
signed char c;
while ((c = getchar()) != EOF)
{ .... }The getchar() function returns values of type 'int', namely numbers within the range 0 - 255 or the value -1 (EOF). The read value is assigned to a variable of type 'char'. This operation causes the character with the code 0xFF (255) to turn into -1 and be interpreted just the same way as the end of a file (EOF).
Users who use Extended ASCII Codes sometimes face an issue when one of the characters of their alphabet is incorrectly processed by programs.
For example, the last letter of the Russian alphabet is encoded with that very value 0xFF in the Windows-1251 encoding and is interpreted as EOF by some programs.
The fixed version of the code should look like this:
int c;
while ((c = getchar()) != EOF)This diagnostic is classified as:
|
You can look at examples of errors detected by the V739 diagnostic. |
V740. Exception is of the 'int' type because NULL is defined as 0. Keyword 'nullptr' can be used for 'pointer' type exception.
The analyzer detected that an exception of type 'int' will be thrown while the programmer wanted it to be of type 'pointer'.
Consider the following example:
if (unknown_error)
throw NULL;If an unknown error occurs, the programmer wants the program to throw a null pointer. However, they didn't take into account that NULL is actually but an ordinary 0. This is how the NULL macro is defined in C++ programs:
#define NULL 0The value '0' is of type 'int', so the exception to be thrown will also be of type 'int'.
We're not concerned with the fact that using pointers for exception throwing is bad and dangerous for now – suppose one really needs to do it exactly that way. Then the fixed version of the code above should look like this:
if (unknown_error)
throw nullptr;Why one shouldn't use pointers when working with exceptions is very well explained in the following book:
Stephen C. Dewhurst. C++ Gotchas. Avoiding Common Problems in Coding and Design. – Addison-Wesley Professional. – 352 pp.: ill., ISBN-10 0321125185.
V741. Use of the throw (a, b); pattern. It is possible that type name was omitted: throw MyException(a, b);.
The analyzer detected the throw keyword followed by a pair of parentheses with various values inside separated by commas. It is very likely that the programmer forgot to specify the type of the exception to be thrown.
Consider the following example:
throw ("foo", 123);Although the code looks strange, it compiles successfully. In this case, executing the comma operator ',' results in the value 123. Therefore, an exception of type 'int' will be thrown.
In other words, the code above is equivalent to the following:
throw 123;Correct code:
throw MyException("foo", 123);This diagnostic is classified as:
V742. Function receives an address of a 'char' type variable instead of pointer to a buffer.
The analyzer detected an error that has to do with passing the address of a variable of type 'char' to a string-handling function, which expects a pointer to a buffer of characters instead. It may lead to runtime errors since functions working with pointers to buffers of characters expect a number of characters and, sometimes, a null terminator at the end of the buffer.
Consider the following example:
const char a = 'f';
size_t len = strlen(&a);In this code, a function that should return the length of a string receives a pointer to variable 'a'. As a result, the whole memory block following the variable's address until a null terminator is found is treated as a string. The outcome of executing this function is undefined; it may return a random value or raise a memory access error.
This bug pattern is very uncommon and usually results from bad code editing or mass replacement of substrings.
To fix the error, one should use a data set corresponding with a buffer of characters or use functions processing single characters.
The fixed version of the code above should look like this:
const char a[] = "f";
size_t len = strlen(a);This diagnostic is classified as:
|
You can look at examples of errors detected by the V742 diagnostic. |
V743. The memory areas must not overlap. Use 'memmove' function.
The analyzer detected an error that has to do with using function memcpy when dealing with overlapping source and destination memory blocks, in which case the behavior is undefined [1, 2].
Consider the following example:
void func(int *x){
memcpy(x, x+2, 10 * sizeof(int));
}In this case, the source pointer (x+2) is offset from the destination by 8 bytes (sizeof(int) * 2). Copying 40 bytes from the source into the destination will lead to partial overlapping of the source memory block.
To fix this error, one should use a special function, memmove(...), or revise the offset between the source and destination blocks to avoid their overlapping.
Example of correct code:
void func(int *x){
memmove(x, x+2, 10 * sizeof(int));
}References:
- Stack Overflow. What is the difference between memmove and memcpy? Answer.
- Stack Overflow. memcpy() vs memmove().
This diagnostic is classified as:
|
You can look at examples of errors detected by the V743 diagnostic. |
V744. Temporary object is immediately destroyed after being created. Consider naming the object.
The analyzer detected an error that has to do with the programmer forgetting to name a newly created object. In that case, a temporary anonymous object will be created and destroyed right afterwards. Sometimes programmers may want it that way deliberately, and there's nothing bad about this practice; but it's obviously an error when dealing with such classes as 'CWaitCursor' or 'CMultiLock'.
Consider the following example:
void func(){
CMutex mtx;
CSingleLock(&mtx, TRUE);
foo();
}In this code, a temporary anonymous object of type 'CSingleLock' will be created and destroyed right off, even before the foo() function is called. In this example, the programmer wanted to make sure that the execution of the foo() function would be synched, but actually it will be called without synching, and it may cause serious errors.
To avoid bugs like that, make sure you name objects you're creating.
Example of correct code:
void func(){
CMutex mtx;
CSingleLock lock(&mtx, TRUE);
foo();
}This diagnostic is classified as:
|
V745. A 'wchar_t *' type string is incorrectly converted to 'BSTR' type string.
The analyzer detected that a string of type "wchar_t *" is handled as a string of type BSTR. It is very strange, and this code is very likely to be incorrect. To figure out why such string handling is dangerous, let's first recall what the BSTR type is.
Actually, we will quote the article from MSDN. I know, people don't like reading MSDN documentation, but we'll have to. We need to understand the danger behind errors of this type - and diagnostic V745 does indicate serious errors in most cases.
typedef wchar_t OLECHAR;
typedef OLECHAR * BSTR;A BSTR (Basic string or binary string) is a string data type that is used by COM, Automation, and Interop functions. Use the BSTR data type in all interfaces that will be accessed from script.
- Length prefix. A four-byte integer that contains the number of bytes in the following data string. It appears immediately before the first character of the data string. This value does not include the terminating null character.
- Data string. A string of Unicode characters. May contain multiple embedded null characters.
- Terminator. Two null characters.
A BSTR is a pointer. The pointer points to the first character of the data string, not to the length prefix.
BSTRs are allocated using COM memory allocation functions, so they can be returned from methods without concern for memory allocation.
The following code is incorrect:
BSTR MyBstr = L"I am a happy BSTR";This code builds (compiles and links) correctly, but it will not function properly because the string does not have a length prefix. If you use a debugger to examine the memory location of this variable, you will not see a four-byte length prefix preceding the data string.
Instead, use the following code:
BSTR MyBstr = SysAllocString(L"I am a happy BSTR");A debugger that examines the memory location of this variable will now reveal a length prefix containing the value 34. This is the expected value for a 17-byte single-character string that is converted to a wide-character string through the inclusion of the "L" string modifier. The debugger will also show a two-byte terminating null character (0x0000) that appears after the data string.
If you pass a simple Unicode string as an argument to a COM function that is expecting a BSTR, the COM function will fail.
I hope this excerpt from MSDN has explained well enough why one should not mix BSTR strings and ordinary strings of type "wchar_t *".
Also, keep in mind that the analyzer can't tell for sure if there is a real error in the code or not. If an incorrect BSTR string is passed somewhere outside the code, it will cause a failure. But if a BSTR string is cast back to "wchar_t *", all is fine. What is meant here is the code of the following pattern:
wchar_t *wstr = Foo();
BSTR tmp = wstr;
wchar_t *wstr2 = tmp;True, there's no real error here. But this code still "smells" and has to be fixed. When fixed, it won't bewilder the programmer maintaining the code, and neither will it trigger the analyzer's warning. Use proper data types:
wchar_t *wstr = Foo();
wchar_t *tmp = wstr;
wchar_t *wstr2 = tmp;We also recommend reading the sources mentioned at the end of the article: they will help you figure out what BSTR strings are all about and how to cast them to strings of other types.
Here's another example:
wchar_t *wcharStr = L"123";
wchar_t *foo = L"12345";
int n = SysReAllocString(&wcharStr, foo);This is the description of function SysReAllocString:
INT SysReAllocString(BSTR *pbstr, const OLECHAR *psz);Reallocates a previously allocated string to be the size of a second string and copies the second string into the reallocated memory.
As you see, the function expects, as its first argument, a pointer to a variable referring to the address of a BSTR string. Instead, it receives a pointer to an ordinary string. Since the "wchar_t **" type is actually the same thing as "BSTR *", the code compiles correctly. In practice, however, it doesn't make sense and will cause a runtime error.
The fixed version of the code:
BSTR wcharStr = SysAllocString(L"123");
wchar_t *foo = L"12345";
int n = SysReAllocString(&wcharStr, foo);A special case we should discuss is when the 'auto' keyword is used. The analyzer produces a warning on the following harmless code:
auto bstr = ::SysAllocStringByteLen(foo, 3);
ATL::CComBSTR value;
value.Attach(bstr); // Warning: V745True, this is a false positive, but the analyzer is technically correct when issuing the warning. The 'bstr' variable is of type 'wchar_t *'. When deducing the type of the 'auto' variable, the C++ compiler does not take into account that the function returns a value of type 'BSTR'. When deducing 'auto', the 'BSTR' type is simply a synonym of 'whar_t *'. This means that the code above is equivalent to this:
wchar_t *bstr = ::SysAllocStringByteLen(foo, 3);
ATL::CComBSTR value;
value.Attach(bstr);This is why the PVS-Studio analyzer generates the warning: it is a bad practice to store a pointer to a 'BSTR' string in a standard 'wchar_t *' pointer. To eliminate the warning, you should specify the type explicitly rather than use 'auto' here:
BSTR *bstr = ::SysAllocStringByteLen(foo, 3);
ATL::CComBSTR value;
value.Attach(bstr);This is an interesting case when the 'auto' operator loses type information and makes things worse rather than help.
Another way to eliminate the warning is to use one of the false-positive suppression mechanisms described in the documentation.
References:
- MSDN. BSTR.
- StackOverfow. Static code analysis for detecting passing a wchar_t* to BSTR.
- StackOverfow. BSTR to std::string (std::wstring) and vice versa.
- Robert Pittenger. Guide to BSTR and CString Conversions.
This diagnostic is classified as:
You can look at examples of errors detected by the V745 diagnostic. |
V746. Object slicing. An exception should be caught by reference rather than by value.
The analyzer detected a potential error that has to do with catching an exception by value. It is much better and safer to catch exceptions by reference.
Catching exceptions by value causes two types of issues. We'll discuss each of them separately.
Issue No. 1. Slicing.
class Exception_Base {
....
virtual void Print() { .... }
};
class Exception_Ex : public Exception_Base { .... };
try
{
if (error) throw Exception_Ex(1, 2, 3);
}
catch (Exception_Base e)
{
e.Print();
throw e;
}2 classes are declared here: an exception of a base type and an extended exception derived from the first one.
An extended exception is generated. The programmer wants to catch it, print its information, and then re-throw it.
The exception is caught by value. It means that a copy constructor will be used to create a new object, 'e', of type Exception_Base, and it will lead to 2 errors at once.
Firstly, some of the information about the exception will get lost; everything stored in Exception_Ex won't be available anymore. The virtual function Print() will only allow printing the basic information about the exception.
Secondly, what will be re-thrown is a new exception of type Exception_Base. Therefore, the information passed on will be sliced.
The fixed version of that code is as follows:
catch (Exception_Base &e)
{
e.Print();
throw;
}Now the Print() function will print all the necessary information. The "throw" statement will re-throw the already existing exception, and the information won't get lost (sliced).
Issue No. 2. Changing a temporary object.
catch (std::string s)
{
s += "Additional info";
throw;
}The programmer wants to catch the exception, add some information to it, and re-throw it. The problem here is that it is the 's' variable that gets changed instead while the "throw;" statement re-throws the original exception. Therefore, the information about the exception won't be changed.
Correct code:
catch (std::string &s)
{
s += "Additional info";
throw;
}The pros of catching exceptions by reference are discussed in the following topics:
- Stack Overflow. C++ catch blocks - catch exception by value or reference?
- Stack Overflow. Catch exception by pointer in C++.
- Stephen C. Dewhurst. C++ Gotchas. Avoiding Common Problems in Coding and Design. – Addison-Wesley Professional. – 352 pp.: ill., ISBN-10 0321125185.
- Wikipedia. Object slicing.
This diagnostic is classified as:
|
You can look at examples of errors detected by the V746 diagnostic. |
V747. Suspicious expression inside parentheses. A function name may be missing.
The analyzer detected a suspicious expression in parentheses consisting of various variables and values separated by commas. However, it doesn't look like the comma operators ',' are used to reduce the code.
Consider the following example:
if (memcmp(a, b, c) < 0 && (x, y, z) < 0)When writing the program, the author forgot to write the function name, 'memcmp'. However, the code still compiles successfully, although it doesn't work as intended. In the right part, executing two comma operators results in variable 'z'. It is this variable that is compared with zero. So, this code turns out to be equivalent to the following:
if (memcmp(a, b, c) < 0 && z < 0)Correct code:
if (memcmp(a, b, c) < 0 && memcmp(x, y, z) < 0)Note. Sometimes, the ',' operator is used to reduce code. That's why the analyzer doesn't always output the warning about commas inside parentheses. For example, it treats the following code as correct:
if (((std::cin >> A), A) && .....)We do not recommend writing complex expressions like this because it is going to make it difficult for your colleagues to read such code. But there is no apparent error either. It's just that the developer wanted to combine the operations of retrieving a value and checking it in one expression.
Here's another similar example:
if (a)
return (b = foo(), fooo(b), b);This diagnostic is classified as:
|
V748. Memory for 'getline' function should be allocated only by 'malloc' or 'realloc' functions. Consider inspecting the first parameter of 'getline' function.
The analyzer detected an error that has to do with allocating memory for the getline() function without using the function malloc()/realloc(). The getline() function is written in such a way that if the already allocated memory is not enough, getline() will call realloc() to expand the memory block (ISO/IEC TR 24731-2). That's why memory can be allocated only using functions malloc() or realloc().
Consider the following example:
char* buf = new char[count];
getline(&buf, &count, stream);In this code, memory for the function getline() is allocated using the new operator. If getline() needs more storage than that already allocated, it will call the realloc() function. The result of such call is unpredictable.
To fix the code, we need to rewrite it so that only functions malloc() or realloc() are used to allocate memory for the getline() function.
Correct code:
char* buf = (char*)malloc(count * sizeof(char));
getline(&buf, &count, stream);This diagnostic is classified as:
|
V749. Destructor of the object will be invoked a second time after leaving the object's scope.
The analyzer detected an error that has to do with calling a destructor for the second time. When an object is created on the stack, the destructor will be called when the object leaves the scope. The analyzer detected a direct call to the destructor for this object.
Consider the following example:
void func(){
X a;
a.~X();
foo();
}In this code, the destructor for the 'a' object is called directly. But when the 'func' function finished, the destructor for 'a' will be called once again.
To fix this error, we need to remove incorrect code or adjust the code according to the memory management model used.
Correct code:
void func(){
X a;
foo();
}This diagnostic is classified as:
|
You can look at examples of errors detected by the V749 diagnostic. |
V750. BSTR string becomes invalid. Notice that BSTR strings store their length before start of the text.
The analyzer detected that inadmissible operations are executed over a BSTR string. A pointer of type BSTR must always refer to the first character of the string; if you shift the pointer by at least one character, you'll get an invalid BSTR string.
It means that code like the following example is very dangerous:
BSTR str = foo();
str++;'str' can no longer be used as a BSTR string. If you need to skip one character, use the following code instead:
BSTR str = foo();
BSTR newStr = SysAllocString(str + 1);If you don't need the BSTR string, rewrite the code in the following way:
BSTR str = foo();
const wchar_t *newStr = str;
newStr++;Another version:
BSTR str = foo();
const wchar_t *newStr = str + 1;To figure out why one must not change the value of a BSTR pointer, let's see the article form MSDN.
typedef wchar_t OLECHAR;
typedef OLECHAR * BSTR;A BSTR (Basic string or binary string) is a string data type that is used by COM, Automation, and Interop functions. Use the BSTR data type in all interfaces that will be accessed from script.
- Length prefix. A four-byte integer that contains the number of bytes in the following data string. It appears immediately before the first character of the data string. This value does not include the terminating null character.
- Data string. A string of Unicode characters. May contain multiple embedded null characters.
- Terminator. Two null characters.
A BSTR is a pointer. The pointer points to the first character of the data string, not to the length prefix.
BSTRs are allocated using COM memory allocation functions, so they can be returned from methods without concern for memory allocation.
The following code is incorrect:
BSTR MyBstr = L"I am a happy BSTR";This code builds (compiles and links) correctly, but it will not function properly because the string does not have a length prefix. If you use a debugger to examine the memory location of this variable, you will not see a four-byte length prefix preceding the data string.
Instead, use the following code:
BSTR MyBstr = SysAllocString(L"I am a happy BSTR");A debugger that examines the memory location of this variable will now reveal a length prefix containing the value 34. This is the expected value for a 17-byte single-character string that is converted to a wide-character string through the inclusion of the "L" string modifier. The debugger will also show a two-byte terminating null character (0x0000) that appears after the data string.
If you pass a simple Unicode string as an argument to a COM function that is expecting a BSTR, the COM function will fail.
I hope this excerpt has explained well enough why one can't simply change a pointer of type BSTR.
When using code like this:
BSTR str = foo();
str += 3;the BSTR string gets spoiled. The pointer now refers somewhere to the middle of the string instead of its first character. So, if we attempt to read the string length at a negative offset, we'll get a random value. More specifically, the previous characters will be interpreted as the string length.
References:
- MSDN. BSTR.
- StackOverfow. Static code analysis for detecting passing a wchar_t* to BSTR.
- StackOverfow. BSTR to std::string (std::wstring) and vice versa.
- Robert Pittenger. Guide to BSTR and CString Conversions.
V751. Parameter is not used inside function's body.
The analyzer detected a suspicious function where one of the parameters is never used while another parameter is used several times. It may indicate an error in the code.
Consider the following example:
static bool CardHasLock(int width, int height)
{
const double xScale = 0.051;
const double yScale = 0.0278;
int lockWidth = (int)floor(width * xScale);
int lockHeight = (int)floor(width * yScale);
....
}The 'height' parameter is never used in the function body while the 'width' parameter is used twice, including the initialization of the 'lockHeight' variable. There is very likely an error here and the code initializing the 'lockHeight' variable should actually look like this:
int lockHeight = (int)floor(height * yScale);This diagnostic is classified as:
|
You can look at examples of errors detected by the V751 diagnostic. |
V752. Creating an object with placement new requires a buffer of large size.
The analyzer detected an attempt to create an object using 'placement new' while the size of the allocated storage is not large enough to store this object. This issue will result in using additional memory outside the allocated block and may cause a crash or incorrect program behavior.
Consider the following example:
struct T { float x, y, z, q; };
char buf[12];
T *p = new (buf) T;In this code, the programmer is trying to store an object of size 16 bytes in the 'buf' buffer of size 12 bytes. When using this object, the memory outside the buffer bounds will be changed. The result of such change is unpredictable.
To fix this error, we need to adjust the buffer size or make sure that the offset from the beginning of the buffer is specified correctly.
Fixed code:
struct T { float x, y, z, q; };
char buf[sizeof(T)];
T *p = new (buf) T;This diagnostic is classified as:
|
V753. The '&=' operation always sets a value of 'Foo' variable to zero.
The analyzer detected that applying a bitwise "AND" operator to a variable results in setting its value to zero, which is strange because a simpler way to get a null value is by using an assignment operation.
If this operation participates in a series of computations, it is likely to execute incorrectly – for example, it is applied to a wrong variable, or a wrong constant is used as the right operand because of a typo.
There are several scenarios when this warning is triggered.
The first case is when the operator is sequentially applied to a variable with unknown value and the right operand is represented by such constants that lead to the expression evaluating to zero:
void foo(int A)
{
A &= 0xf0;
....
A &= 1;
// 'A' now always equals 0.
}Executing these two operations will result in a null value regardless of the initial value of the 'A' variable. This code probably contains an error, and the programmer needs to check the correctness of the constants used.
The second case deals with applying the operator to a variable whose value is known:
void foo()
{
int C;
....
C = 1;
....
C &= 2;
// C == 0
}In this case, the result is a null value, too. Like in the previous case, the programmer needs to check the correctness of the constants used.
The diagnostic can also be triggered by the following code, which is quite common:
void foo()
{
int flags;
....
flags = 1;
....
flags &= ~flags;
....
}This technique is sometimes used by programmers to reset a set of flags. We believe that this technique is unjustified and may confuse your colleagues. A simple assignment is more preferable:
void foo()
{
int flags;
....
flags = 1;
....
flags = 0;
....
}This diagnostic is classified as:
V754. The expression of 'foo(foo(x))' pattern is excessive or contains an error.
The analyzer detected a function that receives a call to itself as an argument.
Consider the following example:
char lower_ch = tolower(tolower(ch));The second function call is redundant. Perhaps this sample contains a typo and the programmer actually meant to call to some other function instead. If there is no mistake, then the extra call should be removed because expressions like that look suspicious:
char lower_ch = tolower(ch);Another example:
if (islower(islower(ch)))
do_something();The 'islower' function returns a value of type 'int' and can be used as an argument to itself. This expression contains an error and serves no purpose.
V755. Copying from potentially tainted data source. Buffer overflow is possible.
The analyzer detected that data is copied from a possibly tainted source to the buffer.
Such sources can be:
- command line arguments whose length is unknown;
- standard library input streams combined with the C strings (null-terminated strings);
- return value of unsafe functions.
Unsafe work with command line arguments
Here's an example:
int main(int argc, char *argv[])
{
....
const size_t buf_size = 1024;
char *tmp = (char *) malloc(buf_size);
....
strcpy(tmp, argv[0]);
....
}If the copied data size exceeds the buffer size, the buffer overflows. To avoid this, pre-calculate the required amount of memory:
int main(int argc, char *argv[])
{
....
char buffer[1024];
errno_t err = strncpy_s(buffer, sizeof(buffer), argv[0], 1024);
....
}You can also allocate memory when you need it by using the 'realloc' function. In C++, you can use all classes, like 'std::string', to work with strings.
Unsafe work with input streams
Before C++20, you could use a C string as a receiver buffer for standard input streams ('std::cin', 'std::ifstream'):
void BadRead(char *receiver)
{
std::cin >> receiver;
}Fortunately, this feature was removed in C++20. Now you can use the standard library input streams only with arrays of known size. And there's an implicit limit on a maximum number of characters read.
void Exception2Cpp20()
{
char *buffer1 = new char[10];
std::cin >> buffer1; // Won't compile since C++20
char buffer2[10];
std::cin >> buffer2; // no overflow
// max 9 chars will be read
}You can read more about this change (with examples of use) in the P0487R1 proposal to the C++20 standard.
Unsafe return value
Attackers can manipulate the value returned by some functions. If you work with those values, be extremely careful:
void InsecureDataProcessing()
{
char oldLocale[50];
strcpy(oldLocale, setlocale(LC_ALL, nullptr));
....
}In this example, a fixed-size buffer is created. The 'LC_ALL' environment variable is read to this buffer. If an attacker can manipulate it, then reading this variable can lead to the buffer overflow.
Exceptions
The analyzer won't issue a warning if the data source is unknown:
void Exception1(int argc, char *argv[])
{
char *src = GetData();
char *tmp = (char *)malloc(1024);
strcpy(tmp, src);
....
}This diagnostic is classified as:
|
V756. The 'X' counter is not used inside a nested loop. Consider inspecting usage of 'Y' counter.
The analyzer detected a possible error in two or more nested 'for' loops, when the counter of one of the loops is not used because of a typo.
Consider the following synthetic example of incorrect code:
for (int i = 0; i < N; i++)
for (int j = 0; j < M; j++)
sum += matrix[i][i];The programmer wanted to process all the elements of a matrix and find their sum but made a mistake and wrote variable 'i' instead of 'j' when indexing into the matrix.
Fixed version:
for (int i = 0; i < N; i++)
for (int j = 0; j < M; j++)
sum += matrix[i][j];Unlike diagnostics V533, and V534, this one deals with indexing errors only in loop bodies.
You can look at examples of errors detected by the V756 diagnostic. |
V757. It is possible that an incorrect variable is compared with null after type conversion using 'dynamic_cast'.
The analyzer has detected a potential error that may lead to memory access by a null pointer.
The situation that the analyzer detected deals with the following algorithm. A pointer to the base class is first cast to a pointer to the derived class by using the 'dynamic_cast' operator. Then the same pointer is checked for a 'nullptr' value, though it is the pointer received as a result of casting that this check should have been applied to.
Here's an example. In this code, the 'baseObj' pointer will not address an instance of the 'Derived' class, in which case, when calling the 'Func' function, the null pointer will be dereferenced. The analyzer will output a warning pointing out two lines. The first line is the spot where the pointer is checked for 'nullptr'; the second is where the pointer to the base class is cast to a pointer to the derived class.
Base *baseObj;
....
Derived *derivedObj = dynamic_cast<Derived *>(baseObj);
if (baseObj != nullptr)
{
derivedObj->Func();
}In this example before using it is most likely the pointer received as a result of casting that the programmer intended to check for 'nullptr' before using it. This is the fixed version of the code:
Base *baseObj;
....
Derived *derivedObj = dynamic_cast<Derived *>(baseObj);
if (derivedObj != nullptr)
{
derivedObj->Func();
}This diagnostic is classified as:
|
You can look at examples of errors detected by the V757 diagnostic. |
V758. Reference was invalidated because of destruction of the temporary object returned by the function.
The analyzer has detected a reference that may become invalid. This reference points to an object controlled by a smart pointer or container returned from the function by value. When the function returns, the temporary object will be destroyed, and so will the object controlled by it. The reference to that object will become invalid. An attempt to use such a reference leads to undefined behavior.
Consider the following example with smart pointer 'unique_ptr':
std::unique_ptr<A> Foo()
{
std::unique_ptr<A> pa(new A());
return pa;
}
void Foo2()
{
const A &ra = *Foo();
ra.foo();
}The reference points to an object controlled by smart pointer 'unique_ptr'. When the function returns, the temporary object 'unique_ptr' will be destroyed and the reference will become invalid.
To avoid such problems, you should stop using the reference and rewrite the 'Foo2()' function as follows:
void Foo2()
{
A a(*Foo());
a.foo();
}In this revised code, we do not use the reference but create a new object of type 'A'. Note that starting with C++11, you can use a move constructor to initialize the 'a' variable with zero performance loss.
There is also an alternative solution:
void Foo2()
{
std::unique_ptr<A> pa = Foo();
pa->foo();
}This code relies on passing the ownership of the object of type 'A'.
Now let's discuss an example that uses the 'std::vector' container:
std::vector<A> Foo();
void Foo2()
{
const A &ra = Foo()[42];
ra.foo();
}The problem here is just the same as with 'unique_ptr': the temporary object 'vector' is destroyed and the reference to its element becomes invalid.
The same is true for methods that return references to elements inside a container: front(), back(), and others:
void Foo2()
{
const A &ra = Foo().front();
ra.foo();
}This diagnostic is classified as:
|
V759. Violated order of exception handlers. Exception caught by handler for base class.
The analyzer detected multiple exception handlers arranged in a wrong order. The handler for base-class exceptions is placed before the handler for derived-class exceptions; therefore, every exception that must be caught by the derived-class handler will be caught by the base-class handler.
Consider the following example:
class Exception { .... };
class DerivedException : public Exception { ... };
void foo()
{
throw DerivedException;
}
void bar()
{
try
{
foo();
}
catch (Exception&)
{
// Every exception of type DerivedException will get here
}
catch (DerivedException&)
{
// Code of this handler will never execute
}
}Since 'Exception' is the base class for the 'DerivedException' class, all exceptions thrown by the 'foo()' function are caught by the first handler.
To fix this error, we need to swap the handlers:
void bar()
{
try
{
foo();
}
catch (DerivedException&)
{
// Catches exceptions of type DerivedException
}
catch (Exception&)
{
// Catches exceptions of type Exception
}
}With this fix, each handler will catch only those exceptions it was meant to.
This diagnostic is classified as:
|
V760. Two identical text blocks were detected. The second block starts with NN string.
The analyzer detected a code fragment that may contain a typo. It is very likely that this code was written using the Copy-Paste technique. Warning V760 is triggered when the analyzer detects two identical text blocks following one another. This diagnostic basically relies on heuristics and, therefore, may produce false positives.
Consider the following example:
void Example(int *a, int *b, size_t n)
{
....
for (size_t i = 0; i != n; i++)
a[i] = 0;
for (size_t i = 0; i != n; i++)
a[i] = 0;
....
}This code was written using the Copy-Paste technique, and the programmer forgot to change the array name in the second block. This is what the code was meant to look like:
void Example(int *a, int *b, size_t n)
{
....
for (size_t i = 0; i != n; i++)
a[i] = 0;
for (size_t i = 0; i != n; i++)
b[i] = 0;
....
}This message is not generated for more than two identical blocks, for example:
void Foo();
void Example()
{
....
Foo();
Foo();
Foo();
Foo();
....
}Sometimes the reason for generating the warning is not obvious. Consider this example:
switch(t) {
case '!': InvokeMethod(&obj_Sylia, "!", 1); break;
case '~': InvokeMethod(&obj_Sylia, "~", 1); break;
case '+': InvokeMethod(&obj_Sylia, "+", 1); break;
case '-': InvokeMethod(&obj_Sylia, "-", 1); break;
break;
default:
SCRIPT_ERROR(PARSE_ERROR);
}We need to take a closer look: in this example, we are dealing with very short repeated block, the 'break' statement. One of its instances is not necessary. This defect does not cause a real bug, but the extra 'break' should be removed:
switch(t) {
case '!': InvokeMethod(&obj_Sylia, "!", 1); break;
case '~': InvokeMethod(&obj_Sylia, "~", 1); break;
case '+': InvokeMethod(&obj_Sylia, "+", 1); break;
case '-': InvokeMethod(&obj_Sylia, "-", 1); break;
default:
SCRIPT_ERROR(PARSE_ERROR);
}Note
Code duplication is not in itself an error. However, even when there is no real bug, the V760 warning can be treated as a hint that you should put identical code blocks in a function. See also diagnostic V761.
You can look at examples of errors detected by the V760 diagnostic. |
V761. NN identical blocks were found.
The analyzer detected code that could be refactored. This diagnostic looks for three or more identical code blocks. Such repeated code is unlikely to be incorrect, but it is better to factor it out in a separate function.
If your code employs a lot of local variables, use lambda functions to capture data by reference.
This diagnostic can be triggered multiple times by code that uses numerous manual optimizations (for example manual loop unrolling). If you find the V761 diagnostic irrelevant to your project, turn it off.
Consider the following synthetic example:
void process(char *&buf);
void func(size_t n, char *arr)
{
size_t i;
i = n;
while (i--)
arr[i] = 1;
for (i = 0; i != 10; i++)
arr[i] = 'a';
process(arr);
i = n;
while (i--)
arr[i] = 1;
for (i = 0; i != 10; i++)
arr[i] = 'a';
process(arr);
i = n;
while (i--)
arr[i] = 1;
for (i = 0; i != 10; i++)
arr[i] = 'a';
process(arr);
i = n;
while (i--)
arr[i] = 1;
for (i = 0; i != 10; i++)
arr[i] = 'a';
process(arr);
}It is a good solution to factor out the common code in a separate function:
void process(char*& buf);
void func_impl(size_t i, size_t *&arr)
{
while (i--)
arr[i] = 1;
for (i = 0; i != 10; i++)
arr[i] = 'a';
process(arr);
}
void func(size_t n, char *arr)
{
for (size_t i = 0; i < 4; ++i)
func_impl(n, arr);
}See also diagnostic V760.
V762. Consider inspecting virtual function arguments. See NN argument of function 'Foo' in derived class and base class.
This diagnostic detects errors related to overriding of virtual functions and is generated in two situations.
Situation 1. A base class includes a virtual function with a parameter of some type. There is also a derived class with the same function, but its corresponding parameter is of another type. The types involved can be integer, enumerations, or pointers or references to the base and derived classes.
The diagnostic helps detect errors that occur during extensive refactoring, when you change the function type in one of the classes but forget to change it in the other.
Consider the following example:
struct Q { virtual int x(short) { return 1; } };
struct W : public Q { int x(int) { return 2; } };This code should actually look like this:
struct Q { virtual int x(short) { return 1; } };
struct W : public Q { int x(short) { return 2; } };If there are two functions 'x' with arguments 'int' and 'short' in the base class, the analyzer will not generate the V762 warning.
Situation 2. The diagnostic is triggered when an argument has been added to or removed from a function in the base class, while the number of arguments in the function declaration in one of the derived classes is left unchanged.
Consider the following example:
struct Q { virtual int x(int, int=3) { return 1; } };
struct W : public Q { int x(int) { return 2; } };Fixed code:
struct Q { virtual int x(int, int=3) { return 1; } };
struct W : public Q { int x(int, int) { return 2; } };Here is an example of how errors in this scenario can occur. There is a hierarchy of classes. At some point, an argument is added to a function of the base or a derived class, which results in declaring a new function that is not related to the function of the base class in any way.
Such declaration looks strange and might be a sign of an error. Perhaps the programmer forgot to fix one of the classes or did not take into account that the function was virtual. However, the analyzer cannot understand if this code is correct based on the function's logic. If this behavior is intended and is not an error, use one of the false-positive suppression mechanisms to suppress the warning.
Consider the following example:
struct CA
{
virtual void Do(int Arg);
};
struct CB : CA
{
virtual void Do(int Arg1, double Arg2);
};To avoid errors like that when using the C++11 standard and better, use the 'override' keyword, which will help avoid signature mismatch at the compilation stage.
This diagnostic is classified as:
You can look at examples of errors detected by the V762 diagnostic. |
V763. Parameter is always rewritten in function body before being used.
The analyzer detected a potential error in the body of a function: one of the function parameters is overwritten before being used, which results in losing the value passed to the function.
Consider the following example:
void Foo(Node A, Node B)
{
A = SkipParenthesize(A);
B = SkipParenthesize(A); // <=
AnalyzeNode(A);
AnalyzeNode(B);
}The 'A' and 'B' parameters are mixed up because of a typo, which leads to assigning a wrong value to the 'B' variable. The fixed code should look like this:
void Foo(Node A, Node B)
{
A = SkipParenthesize(A);
B = SkipParenthesize(B);
AnalyzeNode(A);
AnalyzeNode(B);
}This diagnostic is classified as:
|
You can look at examples of errors detected by the V763 diagnostic. |
V764. Possible incorrect order of arguments passed to function.
The analyzer detected a suspicious sequence of arguments being passed to a function: some of the arguments' names do not correspond with the names of the parameters they are meant to represent. It may indicate an error when passing values to a function.
Let we have the following declaration of the function:
void SetRGB(unsigned r, unsigned g, unsigned b);Here's an example of incorrect code:
void Foo(){
unsigned R = 0, G = 0, B = 0;
....
SetRGB(R, B, G);
....
}When defining the object color, the programmer accidentally swapped the blue and green color parameters.
The fixed version of the code should look like this:
SetRGB(R, G, B);This diagnostic is classified as:
|
You can look at examples of errors detected by the V764 diagnostic. |
V765. Compound assignment expression 'X += X + N' is suspicious. Consider inspecting it for a possible error.
The analyzer detected a potential error in an arithmetic or logical expression: a variable is used both in the left and the right parts of a compound-assignment expression.
Consider the following example:
void Foo(int x, int y, int z)
{
x += x + y;
....
}This code is likely to contain a typo and was probably meant to look like this:
void Foo(int x, int y, int z)
{
x = x + y;
....
}Or like this:
void Foo(int x, int y, int z)
{
x += z + y;
....
}It is true that programmers use expressions like these as a tricky means to multiply a number by two, but such code is strange and needs to be checked. Such expressions look rather complicated and probably should be rewritten in a simpler and clearer way:
void Foo(int x, int y, int z)
{
x = x * 2 + y;
....
}There are also more suspicious expressions that need to be inspected:
void Foo(int x, int y)
{
x -= x + y;
}This expression can be simplified in the following way:
- x -= x + y;
- x = x - (x + y);
- x = -y;
It is not clear if this behavior is intended or caused by a typo. In any case, this code should be checked.
This diagnostic is classified as:
You can look at examples of errors detected by the V765 diagnostic. |
V766. An item with the same key has already been added.
The analyzer detected the following strange situation: items are being added to a dictionary (containers of type 'map', etc.) or set (containers of type 'set', etc.) while having the same keys that are already present in these containers, which will result in ignoring the newly added items. This issue may be a sign of a typo and result in incorrect filling of the container.
Consider the following example with incorrect dictionary initialization:
map<char, int> dict = map<char, int>{
make_pair('a', 10),
make_pair('b', 20),
make_pair('a', 30) // <=
};The programmer made a typo in the last line of the code performing dictionary initialization, as the 'a' key is already in the dictionary. As a result, this dictionary will contain 2 values, and the 'a' key will have the value 10.
To fix the error, we need to use a correct key value:
map<char, int> dict = map<char, int>{
make_pair('a', 10),
make_pair('b', 20),
make_pair('c', 30)
};A similar error may occur when initializing a set:
set<string> someSet = set<string>{
"First",
"Second",
"Third",
"First", // <=
"Fifth"
};A typo results in an attempt to write string 'First' instead of the 'Fourth' key to the 'someSet' set, but since this key is already in the set, it will be ignored.
To fix this error, we need to fix the initialization list:
set<string> someSet = set<string>{
"First",
"Second",
"Third",
"Fourth",
"Fifth"
};This diagnostic is classified as:
You can look at examples of errors detected by the V766 diagnostic. |
V767. Suspicious access to element by a constant index inside a loop.
The analyzer detected a possible error that has to do with accessing an element of an array or container by the same constant index at each iteration of a 'for' loop.
Consider the following example:
void Foo(vector<size_t> &vect)
{
for (size_t i = 0; i < vect.size(); i++)
vect[0] *= 2;
}The programmer intended this function to change all the values in a vector but made a typo that causes the vector elements to be accessed using the constant value 0 instead of the loop counter 'i'. It will result in changing only one value (unless the vector is empty).
To fix this error, we need to rewrite the line where the container's elements are accessed:
void Foo(vector<size_t> &vect)
{
for (size_t i = 0; i < vect.size(); i++)
vect[i] *= 2;
}You can look at examples of errors detected by the V767 diagnostic. |
V768. Variable is of enum type. It is suspicious that it is used as a variable of a Boolean-type.
The analyzer detected a suspicious code fragment where a named constant from an enumeration or a variable of type 'enum' is used as a Boolean value. It is very likely to be a logic error.
Consider the following example:
enum Offset { left=10, right=15, top=20, bottom=25 };
void func(Offset offset)
{
....
if (offset || i < 10)
{
....
}
}In this code, the 'offset' variable of type 'enum' is used as a Boolean value, but since all the values in the 'Offset' enumeration are non-zero, the condition will always be true. The analyzer warns us that the expression is incorrect and should be fixed, for example like this:
void func(Offset offset)
{
....
if (offset == top || i < 10)
{
....
}
}Here is one more example. Suppose we have the following enumeration:
enum NodeKind
{
NK_Identifier = 64,
....
};And the following class:
class Node
{
public:
NodeKind _kind;
bool IsKind(ptrdiff_t kind) const { return _kind == kind; }
};The error then may look something like this:
void foo(Node node)
{
if (node.IsKind(!NK_Identifier))
return;
....
}The programmer expects the function to return if the current node is not an identifier. However, the '!NK_Identifier' expression evaluates to '0', while no such elements are found in the 'NodeKind' enumeration. As a result, the 'IsKind' method will always return 'false' and the function will continue running no matter if the current node is an identifier or not.
The fixed code should look like this:
void foo(Node node)
{
if (!node.IsKind(NK_Identifier))
return;
....
}This diagnostic is classified as:
You can look at examples of errors detected by the V768 diagnostic. |
V769. The pointer in the expression equals nullptr. The resulting value is meaningless and should not be used.
The analyzer detected a strange operation involving a null pointer and making the resulting pointer meaningless. Such behavior indicates a logic error.
Consider the following example:
void foo(bool isEmpty, char *str)
{
char *begin = isEmpty ? str : nullptr;
char *end = begin + strlen(str);
....
}If the 'begin' pointer equals nullptr, the "nullptr + len" expression does not make sense: you cannot use it anyway. Perhaps the variable will not be used anymore. In that case, the code should be refactored so that this operation is never applied to a null pointer, as the programmer who will be dealing with the code may forget that the variable should not be used and attempt to access the data pointed to by the incorrect pointer, which will lead to errors.
The code above can be modified in the following way:
void foo(bool isEmpty, char *str)
{
char *begin = isEmpty ? str : nullptr;
if (begin != nullptr)
{
char *end = begin + strlen(str);
....
}
....
}This diagnostic is classified as:
|
You can look at examples of errors detected by the V769 diagnostic. |
V770. Possible use of left shift operator instead of comparison operator.
The analyzer detected a potential typo that deals with using operators '<<' and '<<=' instead of '<' and '<=', respectively, in a loop condition.
Consider the following example:
void Foo(std::vector<int> vec)
{
for (size_t i = 0; i << vec.size(); i++) // <=
{
// Something
}
}The "i << vec.size()" expression evaluates to zero, which is obviously an error because the loop body will not execute even once. Fixed code:
void Foo(std::vector<int> vec)
{
for (size_t i = 0; i < vec.size(); i++)
{
// Something
}
}Note. Using right-shift operations (>>, >>=) is considered a normal situation, as they are used in various algorithms, for example computing the number of bits with the value 1, for example:
size_t num;
unsigned short var = N;
for (num = var & 1 ; var >>= 1; num += var & 1);This diagnostic is classified as:
V771. The '?:' operator uses constants from different enums.
The analyzer detected a possible error that has to do with the ternary operator '?:' using constants from different enumerations as its second and third operands.
Consider the following example:
enum OnlyOdd { Not_Odd, Odd };
enum OnlyEven { Not_Even, Even };
int isEven(int a)
{
return (a % 2) == 0 ? Even : Odd;
}This function checks if the number passed as an argument is even, but its return value is evaluated using constants from two different enums (OnlyEven::Even and OnlyOdd::Odd) cast to 'int'. This mistake will cause the function to return 1 (true) all the time regardless of the 'a' argument's actual value. This is what the fixed code should look like:
enum OnlyOdd { Not_Odd, Odd };
enum OnlyEven { Not_Even, Even };
int isEven(int a)
{
return (a % 2) == 0 ? Even : Not_Even;
}Note. Using two different unnamed enumerations is considered a normal practice, for example:
enum
{
FLAG_FIRST = 0x01 << 0,
FLAG_SECOND = 0x01 << 1,
....
};
enum
{
FLAG_RW = FLAG_FIRST | FLAG_SECOND,
....
};
....
bool condition = ...;
int foo = condition ? FLAG_SECOND : FLAG_RW; // no V771
....V772. Calling the 'delete' operator for a void pointer will cause undefined behavior.
The analyzer detected a possible error that has to do with using the 'operator delete' or 'operator delete[]' together with a non-typed pointer (void*). As specified by the C++ standard (subclause $7.6.2.8/3), such use of 'delete' results in undefined behavior.
Consider the following example:
class Example
{
int *buf;
public:
Example(size_t n = 1024) { buf = new int[n]; }
~Example() { delete[] buf; }
};
....
void *ptr = new Example();
....
delete ptr;
....What is dangerous about this code is that the compiler does not actually know the type of the 'ptr' pointer. Therefore, deleting a non-typed pointer may cause various defects, for example, a memory leak, as the 'delete' operator will not call the destructor for the object of type 'Example' pointed to by 'ptr'.
If you really mean to use a non-typed pointer, then you need to cast it to the original type before using 'delete' ('delete[]'), for example:
....
void *ptr = new Example();
....
delete (Example*)ptr;
....Otherwise, it is recommended that you use only typed pointers with 'delete' ('delete[]') to avoid errors:
....
Example *ptr = new Example();
....
delete ptr;
....This diagnostic is classified as:
|
You can look at examples of errors detected by the V772 diagnostic. |
V773. Function exited without releasing the pointer/handle. A memory/resource leak is possible.
The analyzer detected a potential memory leak. This situation occurs when memory allocated by using 'malloc' or 'new' remains unreleased after use.
Consider the following example:
int *NewInt()
{
int *p = new int;
....
return p;
}
int Test()
{
int *p = NewInt();
int res = *p;
return res;
}In this code, memory allocation is put into a call to another function. Therefore, the allocated storage needs to be released accordingly after the call.
This is the fixed code, without the memory leak:
int *NewInt()
{
int *p = new int;
....
return p;
}
int Test()
{
int *p = NewInt();
int res = *p;
delete p;
return res;
}Errors of this kind are often found in error handlers because they are generally poorly tested and treated without due care by programmers when doing code reviews. For example:
int Test()
{
int *p = (int*)malloc(sizeof(int));
int *q = (int*)malloc(sizeof(int));
if (p == nullptr || q == nullptr)
{
std::cerr << "No memory";
return -1;
}
int res = *p + *q;
free(p);
free(q);
return res;
}A situation may occur that the 'p' pointer would point to allocated memory, while 'q' would be 'nullptr'. If this happens, the allocated memory will not be released. By the way, an opposite problem is also possible: in a parallel program, you may encounter a situation when memory allocation fails on the first attempt but succeeds on the second.
Besides the memory leaks, the analyzer is able to find resource leaks: unclosed descriptors, files, etc. Such errors aren't different from each other, that's why everything said above refers to them as well. Here is a small example:
void LoadBuffer(char *buf, size_t len)
{
FILE* f = fopen("my_file.bin", "rb");
fread(buf, sizeof(char), len, f);
}Note. In modern C++, it is better to avoid manual resource management and use smart pointers instead. For example, we recommend using 'std::unique_ptr': it will ensure correct memory release in all the function return points. This solution is also exception-safe.
The static analyzer has less information on pointers than a dynamic one, that's why it can issue false positives, if the memory gets released in a non-trivial way, or far from the point where it was allocated. To suppress such warnings, a special comment exists:
//+V773:SUPPRESS, class:className, namespace:nsNameThe 'namespace' parameter is optional.
Let's consider an example:
void foo()
{
EVENT* event = new EVENT;
event->send();
}The 'EVENT' class instance is not supposed to be released inside this function, and you can suppress all V773 warnings related to this object by using the comment:
//+V773:SUPPRESS, class:EVENTThis diagnostic is classified as:
You can look at examples of errors detected by the V773 diagnostic. |
V774. Pointer was used after the memory was released.
The analyzer detected the use of a pointer that points to released buffer. This is considered undefined behavior and can lead to various complications.
Some possible scenarios:
- writing to memory pointed to by such a pointer can spoil some other object;
- reading from memory pointed to by such a pointer can result in returning random values;
- handling such a pointer will result in a crash.
Consider the following example:
for (node *p = head; p != nullptr; p = p->next)
{
delete p;
}In this code, the 'p' pointer, which gets deleted in the loop body, will be dereferenced when evaluating the 'p = p->next' expression. The expression must be evaluated first, and only then can the storage be released. This is what the fixed code should look like:
node *p = head;
while (p != nullptr)
{
node *prev = p;
p = p->next;
delete prev;
}What makes errors of this kind especially annoying is that programs may appear to work properly for a long time and break after slight refactoring, adding a new variable, switching to another compiler, and so on.
This diagnostic is classified as:
|
You can look at examples of errors detected by the V774 diagnostic. |
V775. It is suspicious that the BSTR data type is compared using a relational operator.
The analyzer detected a suspicious comparison operation involving an element of BSTR-type and relational operators: >, <, >=, <=.
BSTR (basic string or binary string) is a string data type used in COM, Automation, and Interop functions. This data type consists of a length prefix, a data string, and a terminal null.
The BSTR type is a pointer that always points to the first character of the data string, not the length prefix. For this reason, every BSTR object is unique and one BSTR object cannot be part of another, unlike ordinary strings.

However, an ordinary string can be part of a BSTR object (but never vice versa), so comparisons of the "wchar_t* > BSTR" kind are valid.

Consider the following example:
void func(BSTR a, BSTR b)
{
if (a > b)
{
....
}
}This code is incorrect because comparison of the pointers 'a' and 'b' is a meaningless operation.
More about BSTR on MSDN.
This diagnostic is classified as:
V776. Potentially infinite loop. The variable in the loop exit condition does not change its value between iterations.
The analyzer detected a potentially infinite loop with its exit condition depending on a variable whose value never changes between iterations.
Consider the following example:
int Do(int x);
int n = Foo();
int x = 0;
while (x < n)
{
Do(x);
}The loop's exit condition depends on variable 'x' whose value will always be zero, so the 'x < 10' check will always evaluate to "true", causing an infinite loop. A correct version of this code could look like this:
int Do(int x);
int n = Foo();
int x = 0;
while (x < n)
{
x = Do(x);
}Here is another example where the loop exit condition depends on a variable whose value, in its turn, changes depending on other variables that never change inside the loop. Suppose we have the following method:
int Foo(int a)
{
int j = 0;
while (true)
{
if (a >= 32)
{
return j * a;
}
if (j == 10)
{
j = 0;
}
j++;
}
}The loop's exit condition depends on the 'a' parameter. If 'a' does not pass the 'a >= 32' check, the loop will become infinite, as the value of 'a' does not change between iterations. This is one of the ways to fix this code:
int Foo(int a)
{
int j = 0;
while (true)
{
if (a >= 32)
{
return j * a;
}
if (j == 10)
{
j = 0;
a++; // <=
}
j++;
}
}In the fixed version, the local variable 'j' controls how the 'a' parameter's value changes.
This diagnostic is classified as:
V777. Dangerous widening type conversion from an array of derived-class objects to a base-class pointer.
The analyzer detected a possible error that has to do with accessing an array consisting of objects of a derived class by using a pointer to the base class. Attempting to access an element with a nonzero index through a pointer to the base class will result in an error.
Consider the following example:
class Base
{
int buf[10];
public:
virtual void Foo() { ... }
virtual ~Base() { }
};
class Derived : public Base
{
char buf[10];
public:
virtual void Foo() override { ... }
virtual ~Derived() { }
};
....
size_t n = 5;
Base *ptr = new Derived[n]; // <=
....
for (size_t i = 0; i < n; ++i)
(ptr + i)->Foo();
....This code uses a base class "Base" and a class derived from it, "Derived". Each object of these classes occupies 48 and 64 bytes respectively (due to class alignment on an 8-byte boundary; the compiler used is MSVC, 64-bit). When "i >= 1", the pointer has to be offset by "i * 64" bytes each time when accessing an element with a nonzero index, but since the array is accessed through a pointer to the "Base" base class, the offset will actually be "i * 48" bytes.
This is how the pointer's offset was meant to be computed:

This is how it is actually computed:

In fact, the program starts handling objects containing random data.
This is the fixed code:
....
size_t n = 5;
Derived *ptr = new Derived[n]; // <=
....
for (size_t i = 0; i < n; ++i)
(ptr + i)->Foo();
....It is also a mistake to cast a pointer that refers to the pointer to the derived class to a pointer that refers to the pointer to the base class:
....
Derived arr[3];
Derived *pDerived = arr;
Class5 **ppDerived = &pDerived;
....
Base **ppBase = (Derived**)ppDerived; // <=
....To ensure that an array of derived-class objects is properly stored in a polymorphic way, the objects have to be arranged as shown below:

This is what the correct version of this code should look like:
....
size_t n = 5;
Base **ppBase = new Base*[n]; // <=
for (size_t i = 0; i < n; ++i)
ppBase[i] = new Derived();
....If you want to emphasize that you are going to handle one object only, use the following code:
....
Derived *derived = new Derived[n];
Base *base = &derived[i];
....This code is considered safe by the analyzer and does not trigger a warning.
It is also considered a valid practice to use such a pointer to access an array consisting of a single object of the derived class.
....
Derived arr[1];
Derived *new_arr = new Derived[1];
Derived *malloc_arr = static_cast<Base*>(malloc(sizeof(Derived)));
....
Base *base = arr;
base = new_arr;
base = malloc_arr;
....Note. If the base and derived classes are of the same size, it is valid to access an array of derived-class objects though a pointer to the base class. However, this practice is still not recommended for use.
This diagnostic is classified as:
|
V778. Two similar code fragments. Perhaps, it is a typo and 'X' variable should be used instead of 'Y'.
The analyzer detected a possible typo in a code fragment that was very likely written by using the Copy-Paste technique.
The V778 diagnostic looks for two adjacent code blocks with similar structure and different variable names. It is designed to detect situations where a code block is copied to make another block and the programmer forgets to change the names of some of the variables in the resulting block.
Consider the following example:
void Example(int a, int b)
{
....
if (a > 50)
doSomething(a);
else if (a > 40)
doSomething2(a);
else
doSomething3(a);
if (b > 50)
doSomething(b);
else if (a > 40) // <=
doSomething2(b);
else
doSomething3(b);
....
}This code was written by using Copy-Paste. The programmer skipped one of the instances of the 'a' variable that was to be replaced with 'b'. The fixed code should look like this:
void Example(int a, int b)
{
....
if (a > 50)
doSomething(a);
else if (a > 40)
doSomething2(a);
else
doSomething3(a);
if (b > 50)
doSomething(b);
else if (b > 40)
doSomething2(b);
else
doSomething3(b);
....
}The following example is taken from a real project:
....
if(erendlinen>239) erendlinen=239;
if(srendlinen>erendlinen) srendlinen=erendlinen;
if(erendlinep>239) erendlinep=239;
if(srendlinep>erendlinen) srendlinep=erendlinep; // <=
....Unlike the previous example, the problem in this one is not clearly visible. The variables have similar names, which makes it much more difficult to diagnose the error. In the second block, variable 'erendlinep' should be used instead of 'erendlinen'.
Obviously, 'erendlinen' and 'erendlinep' are poorly chosen variable names. An error like that is almost impossible to catch during code review. Well, even with the analyzer pointing at it directly, it is still not easy to notice. Therefore, take your time and make sure to examine the code closely when getting a V778 warning.
This diagnostic is classified as:
You can look at examples of errors detected by the V778 diagnostic. |
V779. Unreachable code was detected. It is possible that an error is present.
The analyzer detected code that will never be executed. It may signal the presence of a logic error.
This diagnostic is designed to find blocks of code that will never get control.
Consider the following example:
void Error()
{
....
exit(1);
}
FILE* OpenFile(const char *filename)
{
FILE *f = fopen(filename, "w");
if (f == nullptr)
{
Error();
printf("No such file: %s", filename);
}
return f;
}The 'printf(....)' function will never print the error message, as the 'Error()' function does not return control. The exact way of fixing this error depends on the logic intended by the programmer. The function could be meant to return control, or maybe the expressions are executed in the wrong order and the code was actually meant to look like this:
FILE* OpenFile(const char *filename)
{
FILE *f = fopen(filename, "w");
if (f == nullptr)
{
printf("No such file: %s", filename);
Error();
}
return f;
}Here is another example:
void f(char *s, size_t n)
{
for (size_t i = 0; i < n; ++i)
{
if (s[i] == '\0')
break;
else
return;
s[i] = toupper(s[i]);
}
}The code after the 'if' statement will be skipped, since neither of the branches returns control. A possible solution is to enclose the code in one of the branches or delete the noreturn expression.
Here is an example of how the code above could be fixed:
void f(char *s, size_t n)
{
for (size_t i = 0; i < n; ++i)
{
if (s[i] == '\0')
break;
s[i] = toupper(s[i]);
}
}When a function implementation is stored in another file, the analyzer needs a clue to understand that the function always terminates the program. Otherwise, it could miss the error. You can use annotations when declaring the function to give the analyzer that clue:
[[noreturn]] void my_abort(); // C++11
__declspec(noreturn) void my_abort(); // MSVC
__attribute__((noreturn)) void my_abort(); // GCCThe analyzer does not output the warning in certain cases even though there is formally an error. For example:
int test()
{
throw 0;
return 0;
}The reason why it skips code like this is that programmers often use it to suppress compiler warnings or messages from other analyzers.
This diagnostic is classified as:
|
You can look at examples of errors detected by the V779 diagnostic. |
V780. The object of non-passive (non-PDS) type cannot be used with the function.
The analyzer detected a dangerous use of composite types. If an object is not a Passive Data Structure (PDS), you cannot use low-level functions for memory manipulation such as 'memset', 'memcpy', etc., as this may break the class' logic and cause a memory leak, double release of the same resource, or undefined behavior.
Classes that cannot be handled that way include std::vector, std::string, and other similar containers.
This diagnostic can sometimes help to detect typos. Consider the following example:
struct Buffer {
std::vector<char>* m_data;
void load(char *buf, size_t len) {
m_data->resize(len);
memcpy(&m_data[0], buf, len);
}
};The 'memcpy' function copies data to the object pointed to by 'm_data' instead of the container. The code must be rewritten in the following way:
memcpy(&(*m_data)[0], buf, len);An alternative version:
memcpy(m_data->data(), buf, len);This error also appears when using memset/memcpy with structures whose fields are non-PDS objects. Consider the following example:
struct Buffer {
std::vector<char> m_data;
....
};
void F() {
Buffer a;
memset(&a, 0, sizeof(Buffer));
....
}We recommend using value initialization to avoid errors like that. This technique works correctly both with POD-data and objects with a non-trivial constructor.
To copy the data, you can use the copy constructor generated by the compiler or write one of your own.
The analyzer also looks for structures that can be dangerous when using memset/memcpy with them because of their logic or the way they are represented in memory. The first case deals with classes that include pointers, constructors, and destructors at once. If a class performs non-trivial pointer handling (for example, memory or resource management), you cannot use memcpy/memset with it. For example:
struct Buffer {
char *buf;
Buffer() : buf(new char[16]) {}
~Buffer() { delete[] buf; }
};
Buffer buf1, buf2;
memcpy(&buf1, &buf2, sizeof(Buffer));The second case deals with classes that are not standard-layout:
struct BufferImpl {
virtual bool read(char *, size_t) { return false; }
};
struct Buffer {
BufferImpl impl;
};
Buffer buf1, buf2;
memcpy(&buf1, &buf2, sizeof(Buffer));This diagnostic is classified as:
|
You can look at examples of errors detected by the V780 diagnostic. |
V781. Value of a variable is checked after it is used. Possible error in program's logic. Check lines: N1, N2.
The analyzer detected the following issue in the code. The value of a variable is first used as the size or index of an array and only then is compared with 0 or the array size. This issue may indicate the presence of a logic error or typo in one of the comparisons.
Consider the following example:
int idx = GetPos(buf);
buf[idx] = 42;
if (idx < 0) return -1;If the value of 'idx' turns out to be less than zero, an attempt to evaluate the 'buf[idx]' expression will result in an error. The analyzer will output a warning for this code pointing at two lines: the first line is where the variable is used and the second is where its value is compared with another value.
This is what the fixed version of the code looks like:
int idx = GetPos(buf);
if (idx < 0) return -1;
buf[idx] = 42;The analyzer also outputs the warning when the variable is compared with the array size:
int buf[10];
buf[idx] = 42;
if (idx < countof(buf)) return -1;Fixed code:
int buf[10];
if (idx < countof(buf)) return -1;
buf[idx] = 42;Besides the indexes, the analyzer also takes into account how variables are used as arguments to functions that work with non-negative values (memset, malloc, etc.). Consider the following example:
bool Foo(char *A, int size_A, char *B, int size_B)
{
if (size_A <= 0)
return false;
memset(A, 0, size_A);
....
if (size_A <= 0) // Error
return false;
memset(B, 0, size_B);
....
}This code contains a typo that will be detected in an indirect way. There are actually no problems with the 'A' array, but the programmer made a mistake checking the size of the 'B' array, which causes 'size_A' to be checked only after the 'A' array has been used.
Fixed code:
bool Foo(char *A, int size_A, char *B, int size_B)
{
if (size_A <= 0)
return false;
memset(A, 0, size_A);
....
if (size_B <= 0) // FIX
return false;
memset(B, 0, size_B);
....
}In addition, the analyser can detect the problem, if the usage of a variable as an array index and its check are in one expression:
void f(int *arr, const int size)
{
for (int i = 0; arr[i] < 10 && i < size; ++i)
arr[i] = 0;
}In this case, at the last loop iteration we'll check the value taken from the outside of the array bound, which is undefined behaviour.
Fixed version:
void f(int *arr, const int size)
{
for (int i = 0; i < size && arr[i] < 10; ++i)
arr[i] = 0;
}This diagnostic is classified as:
You can look at examples of errors detected by the V781 diagnostic. |
V782. It is pointless to compute the distance between the elements of different arrays.
The analyzer detected meaningless code computing the distance between the elements of different arrays.
Consider the following example:
ptrdiff_t offset()
{
char path[9] = "test.txt";
char resources[9] = "resr.txt";
return path - resources;
}Subtracting the addresses of the two arrays allocated on the stack is pointless and very likely to be an error.
To discuss all the suspicious operations involving pointers to arrays, it is convenient to divide pointers into two imaginary groups:
- Group 'A' includes non-shifted pointers to stack-allocated arrays as well as arrays allocated using 'new' or 'malloc()'.
- Group 'B' includes shifted pointers to arrays allocated using 'new' or 'malloc' or pointers that the analyzer has no information about.
Based on this division, we get a table of operations on pointers to arrays evaluation of which makes no sense (Table 1).

Table 1 – Meaningless pointer operations.
This diagnostic is classified as:
|
V783. Possible dereference of invalid iterator 'X'.
The analyzer detected a code fragment that may result in using an invalid iterator.
Consider the following examples that trigger this diagnostic message:
if (iter != vec.end() || *iter == 42) { ... }
if (iter == vec.end() && *iter == 42) { ... }There is a logic error in all the conditions above that leads to dereferencing an invalid iterator. This error usually appears during code refactoring or because of a typo.
The fixed versions:
if (iter != vec.end() && *iter == 42) { ... }
if (iter == vec.end() || *iter == 42) { ... }Of course, these are very simple cases. In practice, the check and the code using the iterator are often found in different lines. If you got the V783 warning, check the code above and try to find out why what made the analyzer treat the iterator as invalid.
Here is an example where the iterator is checked and used in different lines:
if (iter == vec.end()) {
std::cout << "Error: " << *iter << std::endl;
throw std::runtime_error("foo");
}The analyzer will warn you about the issue in the '*iter' expression. Either it is an incorrect condition or some other variable should be used instead of 'iter'.
The analyzer can also detect cases when the iterator is used before being checked.
Consider the following example:
std::cout << "Element is " << *iter << std::endl;
if (iter == vec.end()) {
throw std::runtime_error("");
}The check here is meaningless because the possibly invalid iterator has been already dereferenced. There is a missing check:
if (iter != vec.end()) {
std::cout << "Element is " << *iter << std::endl;
}
if (iter == vec.end()) {
throw std::runtime_error("");
}This diagnostic is classified as:
|
You can look at examples of errors detected by the V783 diagnostic. |
V784. The size of the bit mask is less than the size of the first operand. This will cause the loss of the higher bits.
The analyzer detected a suspicious operation performed on a bit mask: the bit mask is represented by a variable whose size is less than that of the other operand. This guarantees the loss of the value of high-order bits.
Consider a few examples that trigger this warning:
unsigned long long x;
unsigned y;
....
x &= ~y;Let’s see in detail what happens to the bits after each operation using the following expression as an example:
x = 0xffff'ffff'ffff'ffff;
y = 0xff;
x &= ~y;
A result like that is usually different from what the programmer expected:
0xffff’ffff’ffff’ff00 – expected result
0x0000’0000’ffff’ff00 – actual resultThe code can be fixed by explicitly casting the 'y' variable to the type of the 'x' variable:
x &= ~(unsigned long long)y;In this case, the type conversion will be executed first, followed by the negation. After that, all the most significant bits will be set to one. The following table shows how the result of the code above will change with the new order of computations:

The analyzer also outputs the warning for code like this:
unsigned long long x;
unsigned y;
....
x &= y;Even though no additional operations are performed here, this code still looks suspicious. We recommend using explicit type conversion to make the code’s behavior clearer to both the analyzer and your colleagues.
This diagnostic is classified as:
|
You can look at examples of errors detected by the V784 diagnostic. |
V785. Constant expression in switch statement.
The analyzer detected a constant expression in a 'switch' statement. This usually indicates the presence of a logic error in the code.
Consider the following synthetic example:
int i = 1;
switch (i)
{
....
}The condition of the 'switch' statement is represented by a variable whose value can be computed at compilation time. This situation could have resulted from code refactoring: the previous version of the code changed the variable's value but then it was modified and the variable turned out to be no longer assigned any value.
The analyzer does not issue the warning when the variable is constant or when the condition employs macros. Such constructs are usually used deliberately to switch on/off various features of the program at compilation time.
For example, they could perform different actions depending on what operating system the code was compiled for:
switch (MY_PROJ_OS)
{
case MY_PROJ_WINDOWS:
....
case MY_PROJ_LINUX:
....
case MY_PROJ_MACOS:
....
}This diagnostic is classified as:
|
V786. Assigning the value C to the X variable looks suspicious. The value range of the variable: [A, B].
The analyzer detected that a variable is assigned a value that is beyond its value range.
Consider a few examples that trigger this warning:
bool b;
....
b = 100;Assigning the value 100 to a variable of type bool makes no sense. This may be a typo, and some other variable was probably meant to be used instead of 'b'.
Another example:
struct S
{
int flag : 1;
}
....
S s;
s.flag = 1;The 'flag' bit field can take values from the range [-1, 0], not [0, 1], as it might seem at first. The reason is that this variable is signed. If you need a bit field with the range [0, 1], make it 'unsigned':
struct S
{
unsigned flag : 1;
}
....
S s;
s.flag = 1;This diagnostic is classified as:
|
You can look at examples of errors detected by the V786 diagnostic. |
V787. Wrong variable is probably used in the for operator as an index.
The analyzer detected a loop counter used as an index in the loop termination condition. Such code looks suspicious.
Consider the following example:
for (int i = 0; i < n; ++i)
for (int j = 0; j < arr[j]; ++j)
....The programmer must have intended to use the variable 'i' instead of 'j':
for (int i = 0; i < n; ++i)
for (int j = 0; j < arr[i]; ++j)
....V788. Review captured variable in lambda expression.
The analyzer detected a suspicious variable capture in a lambda function.
Consider a few examples of this diagnostic.
Example 1:
int x = 0;
auto f = [x] { };
....
x = 42;
f();
...A variable whose exact value can be calculated at compile time is captured by value in a lambda function. Inside that function, the variable will be referring to the value that it had at the moment when it was captured rather than at the moment when the function call was executed. The variable should probably be captured by reference instead.
int x = 0;
auto f = [&x] { };
....
x = 42;
f();
...Another possible explanation is that the code where the variable used to be assigned some value was removed during refactoring.
int x = 0;
if (condition) x = 42;
else x = 43;
auto f = [x] { };If you need to capture a constant, a better solution would be to explicitly declare the variable's type as 'const' or 'constexpr'.
constexpr int x = 0;
auto f = [x] { };Example 2:
int x;
auto f = [x] { };An uninitialized variable is captured by value. Using it will lead to undefined behavior. If the variable was meant to be initialized by the function call, then it should be captured by reference.
int x;
auto f = [&x] { x = 42; };This diagnostic is classified as:
|
V789. Iterators for the container, used in the range-based for loop, become invalid upon a function call.
The analyzer has detected invalidation of an iterator in a range-based 'for' loop.
Consider the following example:
std::vector<int> numbers;
for (int num : numbers)
{
numbers.push_back(num * 2);
}This code fragment does the same as this one:
for (auto __begin = begin(numbers), __end = end(numbers);
__begin != __end; ++__begin) {
int num = *__begin;
numbers.push_back(num * 2);
}With the code rewritten in that way, it becomes obvious that the iterators '__begin' and '__end' can be invalidated when executing the 'push_back' function if memory is reallocated inside the vector.
If you simultaneously need to modify the container and read values from it, it is better to use functions that return a new iterator after modification, or indexes in the case of the 'std::vector' class.
References:
- https://stackoverflow.com/a/6442829 - iterator invalidation rules for STL containers.
This diagnostic is classified as:
|
You can look at examples of errors detected by the V789 diagnostic. |
V790. It is suspicious that the assignment operator takes an object by a non-constant reference and returns this object.
The analyzer has detected an assignment operator that receives an object by a non-constant reference and returns that same object.
Consider the following example:
class C {
C& operator = (C& other) {
....
return other;
}
};Implementing an assignment operator in a way like that could lead to unexpected and unpleasant side effects. Suppose we write the following code:
(A = B)++;You should not really write the code like that, but just suppose we need it exactly that way. You would probably expect the following sequence of operations:
A = B;
A++;However, because of the incorrect assignment operator, the actual order will be this:
A = B;
B++;To avoid errors like that, pass the argument by a constant reference: code with such an implementation of the assignment operator would simply fail to compile.
Fixed code:
class C {
C& operator = (const C& other) {
....
return *this;
}
};V791. The initial value of the index in the nested loop equals 'i'. Consider using 'i + 1' instead.
The analyzer has detected a faulty or suboptimal loop. A standard pattern is used where some operation is executed for every pair of elements of an array. This operation, however, is usually not required for a pair whose members are the same element, i.e. when 'i == j'.
For example:
for (int i = 0; i < size; i++)
for (int j = i; j < size; j++)
...It is highly possible that a more correct and effective way to traverse the arrays would probably be this:
for (int i = 0; i < size; i++)
for (int j = i + 1; j < size; j++)
...The next example is taken from a real application; the authors implemented their own algorithm to sort devices by priority but it is non-optimal:
/* Simple bubble sort */
for (i = 0; i < n_devices; ++i) {
for (uint32_t j = i; j < n_devices; ++j) {
if (devices[i]->prio > devices[j]->prio) {
struct device_t *tmp;
tmp = devices[i];
devices[i] = devices[j];
devices[j] = tmp;
}
}
}Fixed code:
/* Simple bubble sort */
for (i = 0; i < n_devices - 1; ++i) {
for (uint32_t j = i + 1; j < n_devices; ++j) {
if (devices[i]->prio > devices[j]->prio) {
struct device_t *tmp;
tmp = devices[i];
devices[i] = devices[j];
devices[j] = tmp;
}
}
}This diagnostic is classified as:
You can look at examples of errors detected by the V791 diagnostic. |
V792. The function located to the right of the '|' and '&' operators will be called regardless of the value of the left operand. Consider using '||' and '&&' instead.
The analyzer has detected a possible typo in a logical expression: a bitwise operator (& or |) is used instead of a logical one (&& or ||). This means that the right operand will be evaluated regardless of the result of the left operand.
Consider the following example:
if (foo() | bar()) {}Using bitwise operations is suboptimal from the performance viewpoint when the operands are represented by relatively resource-intensive operations. Besides, such code could cause errors because of different types participating in the expression and different operation precedence. There are also situations where the right operand must not be executed if evaluation of the left one has failed, in which case the program could attempt to access uninitialized resources. Finally, bitwise operations do not guarantee the operand evaluation order.
Fixed code:
if (foo() || bar()) {}This diagnostic is classified as:
You can look at examples of errors detected by the V792 diagnostic. |
V793. It is suspicious that the result of the statement is a part of the condition. Perhaps, this statement should have been compared with something else.
The analyzer has detected a possible typo in a logical expression: an arithmetic operation acts as a condition.
Consider the following example:
int a;
int b;
if (a + b) {}Although the behavior of this code might be clear to its author, it is better to use explicit checks. Its result is the same as that of the expression 'a + b != 0'. Those who will read and maintain it will be wondering if there is a missing comparison of the sum with some value. Perhaps it was to be compared with some constant, say, 42, and then the correct code should look like this:
if (a + b == 42) {}The next example is taken from a real application:
// verify that time is well formed
if ( ( hh / 24 ) || ( mm / 60 ) ) {
return false;
}This code works as intended, but it would have looked much clearer if the author had used comparison operations.
// verify that time is well formed
if ( hh >= 24 || mm >= 60 ) {
return false;
}This diagnostic is classified as:
|
You can look at examples of errors detected by the V793 diagnostic. |
V794. The assignment operator should be protected from the case of 'this == &src'.
The analyzer has detected a dangerous copy/move assignment operator that lacks a check for object self-assignment and at the same time contains operations that could cause memory leaks, use of deallocated pointers, and other problems, in case it receives a reference to '*this' as an argument.
Consider the following example:
class C {
char *p;
size_t len;
public:
C& operator = (const C& other) {
delete p;
len = other.len;
p = new char[len];
std::copy(other.p, other.p + len, p);
return *this;
}
};The error will show if 'this == &other' and, therefore, 'p == other.p'. In that case, the uninitialized array will be copied into itself when the 'std::copy' call is executed.
Fixed code:
C& operator = (const C& other) {
if (this == std::addressof(other))
return *this;
delete p;
len = other.len;
p = new char[len];
std::copy(other.p, other.p + len, p);
return *this;
}If, however, you know that no such situation can occur, i.e. the operator has an implicit contract, it is recommended that you formalize this contract as an 'assert' construct:
C& operator = (const C& other) {
MyAssert(this != std::addressof(other));
....
}Note: It is better to use the 'std::addressof' function instead of the '&' operator to check a class for equality to itself. Then the check will work even if the class has overloaded '&' operator.
You can look at examples of errors detected by the V794 diagnostic. |
V795. Size of the 'time_t' type is not 64 bits. After the year 2038, the program will work incorrectly.
The analyzer has detected that a program uses 32-bit data types to store time. This issue will affect those programs that use data types representing the number of seconds elapsed since January 1-st, 1970. After January 19-th, 2038, such programs will no longer be able to represent dates correctly. It is recommended that you use 64-bit types to store time.
The size of the 'time_t' type is not specified by the C/C++ standard, so it can be defined differently depending on the platform and the project's settings:
typedef /* unspecified */ time_t;In older versions of Visual C++, the 'time_t' type was 32-bit in 32-bit Windows versions. Starting with Visual C++ 2005, it is a 64-bit integer by default. Modern Visual C++ versions allow you to force the use of the 32-bit version of 'time_t' by using the '_USE_32BIT_TIME_T' directive. You should discard this directive wherever possible and use the 64-bit 'time_t' type instead.
In Linux, 'time_t' is 64-bit only in 64-bit versions of the operating system. Sadly, 32-bit Linux systems do not provide any regular means to make it 64-bit at present. If that is your case, consider replacing 'time_t' with third-party solutions.
References:
V796. A 'break' statement is probably missing in a 'switch' statement.
The analyzer has detected a 'switch' statement with a missing 'break' statement in one of its branches. When executing this code, the control flow will move on to the next 'case'. This is probably a typo, and 'break' is needed.
Consider the following example:
for (char c : srcString)
{
switch (c)
{
case 't':
*s++ = '\t';
break;
case 'n':
*s++ = '\n';
break;
case 'f':
*s++ = '\f'; // <=
case '0':
*s++ = '\0';
}
}If it is a mistake, then you should add 'break' statement. If there is no error, then you should leave a hint to the analyzer and your colleagues, who will maintain the code in the future.
There are a number of ways to specify that this behavior is intentional. One way is to add a comment:
case A:
foo();
// fall through
case B:
bar();'fallthrough' attributes are also supported:
__attribute__((fallthrough));
[[fallthrough]];
[[gnu::fallthrough]];
[[clang::fallthrough]];The diagnostic also implements several heuristic rules that reduce false positives. For example, when unrolling a loop:
switch(num) {
case 3:
sum += arr[i + 2];
case 2:
sum += arr[i + 1];
case 1:
sum += arr[i];
}In this case, no diagnostic warning is issued.
If the 'switch' already has comments or 'fallthrough' attributes, it will trigger the diagnostic all the same because such code looks even more suspicious.
The warning is not issued when other statements interrupting execution of the 'switch' are used instead of 'break' (these are 'return', 'throw', and the like).
False positives are possible since the analyzer cannot figure out for sure if a certain fragment is an error or not. To eliminate them, use 'fallthrough' attributes or comments. Such comments will, in the first place, help other developers who will maintain the code in the future; compilers and static analyzers will also be able to recognize them.
If there are too many false positives, you can turn this diagnostic off or use one of the false positive suppression mechanisms.
This diagnostic is classified as:
|
You can look at examples of errors detected by the V796 diagnostic. |
V797. The function is used as if it returned a bool type. The return value of the function should probably be compared with std::string::npos.
The analyzer has detected an error that occurs when searching for substrings or characters in a string.
Consider the following example:
std::string s = foo();
if (s.find("42")) { .... }The 'std::string::find' function returns a value of type 'std::string::size_type'. If no such value has been found, 'std::string::npos' is returned, which is equal to '(size_t)-1'. Therefore, if you want to check for a substring, you need to write the following code:
if (s.find("42") != std::string::npos) { .... }Even though the code 'if (s.find(...))' is compilable and functional, its logic is very suspicious. This code checks if the required substring is absent or is not the beginning of string 's'. If you really need such behavior, it is better to implement it explicitly:
const auto pos = s.find("42");
if (pos == std::string::npos || pos != 0) { .... }You can also use the function 'boost::starts_with' or a function that does the same check.
This diagnostic is classified as:
|
You can look at examples of errors detected by the V797 diagnostic. |
V798. The size of the dynamic array can be less than the number of elements in the initializer.
The analyzer detected a potential error, caused by the fact that the size of the dynamic array may be less than the number of elements in its initializer. In this case, upon the creation of an array, depending on the type of the 'new' operator, an exception 'std::bad_array_new_length' will be thrown, or a null pointer returned.
Consider an example:
int n = 2;
...
int* arr = new int[n] { 1, 2, 3 };The value of the 'n' variable is less than the number of elements in the initializer. The correct code should be:
int n = 3;
...
int* arr = new int[n] { 1, 2, 3 };This diagnostic is classified as:
|
V799. Variable is not used after memory is allocated for it. Consider checking the use of this variable.
The analyzer has detected a situation where memory is dynamically allocated for a variable but the variable is not used after that. Review the code or remove the unused variable.
Consider the following example:
void Func()
{
int *A = new int[X];
int *B = new int[Y];
int *C = new int[Z];
Foo(A, X);
Foo(B, Y);
Foo(B, Z); // <=
delete [] A;
delete [] B;
delete [] C;
}This code contains a typo: the third call of the 'Foo' function uses the 'B' array instead of the intended 'C' array. The analyzer detects an anomaly here since memory is allocated and freed but not used in any way. This is what the fixed code should look like:
void Func()
{
int *A = new int[X];
int *B = new int[Y];
int *C = new int[Z];
Foo(A, X);
Foo(B, Y);
Foo(C, Z); // <=
delete [] A;
delete [] B;
delete [] C;
}You can look at examples of errors detected by the V799 diagnostic. |
V1001. Variable is assigned but not used by the end of the function.
The analyzer detected a potential error related to the fact that before the exit from the function, a local variable is assigned with a value that is not used later.
Perhaps, this variable should be in subsequent operations or returned as a result of a function, but because of a typo another variable is used, or the programmer forgot to write the necessary code. Let's consider several examples.
Example 1.
bool IsFitRect(TPict& pict)
{
TRect pictRect;
...
pictRect = pict.GetRect();
return otherRect.dx >= 16 && otherRect.dy >= 16;
}In this example, in the 'return' operator, the sizes 'otherRect' are used by mistake instead of the sizes 'pictRect', while the variable 'pictRect' isn't used in any other evaluations. The correct code should be as follows:
bool IsFitRect(TPict& pict)
{
TRect pictRect;
...
pictRect = pict.GetRect();
return pictRect.dx >= 16 && pictRect.dy >= 16;
}Example 2.
bool CreateMiniDump()
{
BOOL bStatus = FALSE;
CString errorMsg;
...
if (hDbgHelp == NULL)
{
errorMsg = _T("dbghelp.dll couldn't be loaded");
goto cleanup;
}
...
if (hFile == INVALID_HANDLE_VALUE)
{
errorMsg = _T("Couldn't create minidump file");
return FALSE;
}
...
cleanup:
if (!bStatus)
AddToReport(errorMsg);
return bStatus;
}In this example, in all the 'if' blocks except one, after the error message there is a transit to the end of the function, where this error is added to the report. But when processing one of the conditions, there is an exit from the function immediately without adding the message to the report, which gets lost later. Correct code should look as follows:
bool CreateMiniDump()
{
BOOL bStatus = FALSE;
CString errorMsg;
...
if (hDbgHelp == NULL)
{
errorMsg = _T("dbghelp.dll couldn't be loaded");
goto cleanup;
}
...
if (hFile == INVALID_HANDLE_VALUE)
{
errorMsg = _T("Couldn't create minidump file");
goto cleanup;
}
...
cleanup:
if (!bStatus)
AddToReport(errorMsg);
return bStatus;
}Sometimes, working with cryptographic functions, programmers clean the variables at the end by writing a null value. This is the wrong approach, because the compiler will most likely remove the code during the optimization, if a variable is no longer used. For example:
void ldns_sha256_update(...)
{
size_t freespace, usedspace;
...
/* Clean up: */
usedspace = freespace = 0;
}To clear the memory, you should use special functions that won't be removed by the compiler during the optimization.
void ldns_sha256_update(...)
{
size_t freespace, usedspace;
...
/* Clean up: */
RtlSecureZeroMemory(&usedspace, sizeof(usedspace));
RtlSecureZeroMemory(&freespace, sizeof(freespace));
}More details about this error can be found in the description of the V597 diagnostic.
In some cases, when programmers deal with the compiler warnings about the unused variables, they assign them some values or assign the value to itself. This is not the best method, because upon the absence of the comments, it can mislead those programmer who will work on this code later.
static stbi_uc *stbi__tga_load(...)
{
// read in the TGA header stuff
int tga_palette_start = stbi__get16le(s);
int tga_palette_len = stbi__get16le(s);
int tga_palette_bits = stbi__get8(s);
...
// the things I do to get rid of an error message,
// and yet keep Microsoft's C compilers happy... [8^(
tga_palette_start = tga_palette_len = tga_palette_bits =
tga_x_origin = tga_y_origin = 0;
// OK, done
return tga_data;
}There are more graceful solutions for such cases, for example, you can use the function:
template<class T> void UNREFERENCED_VAR( const T& ) { }
static stbi_uc *stbi__tga_load(...)
{
// read in the TGA header stuff
int tga_palette_start = stbi__get16le(s);
...
UNREFERENCED_VAR(tga_palette_start);
...
// OK, done
return tga_data;
}Another option is to use special macros, declared in the system header files. For example, in Visual C++ such a macro is UNREFERENCED_PARAMETER. In this case the analyzer also won't issue warnings.
This diagnostic is classified as:
|
You can look at examples of errors detected by the V1001 diagnostic. |
V1002. Class that contains pointers, constructor and destructor is copied by the automatically generated operator= or copy constructor.
The analyzer has detected a possible error that has to do with a call of an automatically generated copy constructor or assignment operator.
Here are the conditions when such a call of compiler-generated functions is considered unsafe:
- The class has a non-default constructor.
- The class has a non-default destructor.
- Some of the class members are pointers.
The pointer is very likely to refer to a buffer of memory allocated in the constructor and then freed in the destructor. Such objects should never be copied using such functions as 'memcpy' or automatically generated functions (copy constructor, assignment operator).
Consider the following example:
class SomeClass
{
int m_x, m_y;
int *m_storagePtr;
public:
SomeClass(int x, int y) : m_x(x), m_y(y)
{
m_storagePtr = new int[100];
....
}
....
~SomeClass()
{
delete[] m_storagePtr;
}
};
void Func()
{
SomeClass A(0, 0);
SomeClass B(A); // <=
....
}When copying object 'A' to object 'B' in this example, the pointer 'm_storagePtr' is copied from the 'A' object to the 'B' object. This is not what the programmer expected because they actually intended to copy the data rather than the pointers alone. This is what the fixed code should look like:
class SomeClass
{
int m_x, m_y;
int *m_storagePtr;
public:
SomeClass(int x, int y) : m_x(x), m_y(y)
{
m_storagePtr = new int[100];
....
}
SomeClass(const SomeClass &other) : m_x(other.m_x), m_y(other.m_y)
{
m_storagePtr = new int[100];
memcpy(m_storagePtr, other.m_storagePtr, 100 * sizeof(int));
}
....
~SomeClass()
{
delete[] m_storagePtr;
}
};Similarly, this diagnostic detects errors that have to do with using a default assignment operator.
True, the analyzer may make a mistake and issue a false warning for a correct class, but we still recommend that you examine every V1002 warning carefully. If there is no error, specify explicitly that you intend to use automatically generated functions and that they are safe. To do that, use the keyword 'default':
T(const T &x) = default;
SomeClass &operator=(const T &x) = default;This will make it easier for programmers who will be maintaining the code to see that it is correct, and prevent PVS-Studio from issuing false warnings as well.
This diagnostic is classified as:
You can look at examples of errors detected by the V1002 diagnostic. |
V1003. Macro expression is dangerous or suspicious.
The analyzer has detected a possible error in a macro declaration.
Consider the following example:
#define sqr(x) x * xThis macro should be rewritten in the following way:
#define sqr(x) ((x) * (x))The original implementation has two flaws that make the macro error-prone. First of all, the macro itself should be enclosed in parentheses; otherwise, the following code would execute incorrectly:
double d = 1.0 / sqr(M_PI); // 1.0 / M_PI * M_PI == 1.0For the same reason, the arguments should also be enclosed in parentheses:
sqr(M_PI + 0.42); // M_PI + 0.42 * M_PI + 0.42Because the preprocessor handles the code at the lexeme level, it sometimes fails to build a correct syntax tree relying on the macro's text. For example:
#define FOO(A,B) A * BDepending on the context, this may be both a multiplication of A by B and a declaration of variable B pointing to A. Since a macro declaration provides no information about how the macro will be used, false warnings are possible. In that case, use one of the means described in the documentation to suppress such false positives.
Note. This diagnostic is similar to V733. The latter is more accurate and produces fewer false positives since it deals with an already expanded macro rather than its declaration. On the other hand, V733's diagnostic capabilities are more limited, which makes it unable to recognize many errors.
Other type of found errors can look as follows:
#if A
doA();
#else doB();
#endifWhile code refactoring, line break was deleted by accident, and 'doB()' function couldn't be called. At the same time the code stayed compiled.
Fixed variant of code:
#if A
doA();
#else
doB();
#endifYou can look at examples of errors detected by the V1003 diagnostic. |
V1004. Pointer was used unsafely after its check for nullptr.
The analyzer has detected a possible null-pointer-dereferencing error. The pointer is checked for null before the first use but is then used for the second time without such a check.
Consider the following example:
if (p != nullptr)
{
*p = 42;
}
....
*p += 33;If the 'p' pointer turns out to be null, executing the '*p += 33' expression will result in null-pointer dereferencing. To avoid it, the pointer must be additionally tested against null:
if (p != nullptr)
{
*p = 42;
}
....
if (p != nullptr)
{
*p += 33;
}If the 'p' pointer is always non-null, the check is not needed:
*p = 42;
....
*p += 33;The analyzer may issue a false warning in the following case:
if (p == nullptr)
{
MyExit();
}
....
*p += 42;The reason is that the analyzer cannot determine if the 'MyExit' function returns control or not. To provide such information to it, annotate the function in one of the following ways:
- C++11 attribute: [[noreturn]] void MyExit();
- gcc attribute: __attribute__((noreturn)) void MyExit();
- MSVC attribute: __declspec((noreturn)) void MyExit();
This diagnostic is classified as:
You can look at examples of errors detected by the V1004 diagnostic. |
V1005. The resource was acquired using 'X' function but was released using incompatible 'Y' function.
The analyzer has detected a possible error that has to do with using incompatible functions to acquire and release a resource.
For example, this warning will be issued when a file is opened using the 'fopen_s' function and closed using the 'CloseHandle' function.
Consider the following example.
FILE* file = nullptr;
errno_t err = fopen_s(&file, "file.txt", "r");
...
CloseHandle(file);The result of executing this code is unknown. The 'CloseHandle' function may return the error status and merely cause a resource leak (fail to close the file), but more severe implications are also possible. Incorrect calls of some functions lead to undefined behavior, which means unpredictable results, including a crash.
This is what the fixed code should look like:
FILE* file = nullptr;
errno_t err = fopen_s(&file, "file.txt", "r");
...
fclose(file);This diagnostic is classified as:
You can look at examples of errors detected by the V1005 diagnostic. |
V1006. Several shared_ptr objects are initialized by the same pointer. A double memory deallocation will occur.
The analyzer has detected an error that has to do with several objects of type 'shared_ptr' being initialized by the same pointer. This will result in undefined behavior when the second object of type 'shared_ptr' tries to free the storage already freed by the first object.
Consider the following example of incorrect code:
void func()
{
S *rawPtr = new S(10, 20);
std::shared_ptr<S> shared1(rawPtr);
std::shared_ptr<S> shared2(rawPtr);
....
}When the function returns, the 'shared1' object will delete the 'rawPtr' pointer, and then the 'shared2' object will try to delete it once again, causing undefined behavior of the program.
Fixed code:
void func()
{
std::shared_ptr<S> shared1(new S(10, 20));
std::shared_ptr<S> shared2(new S(10, 20));
....
}This diagnostic is classified as:
|
V1007. Value from the uninitialized optional is used. It may be an error.
The analyzer has detected an issue that has to do with accessing the value of an object of class 'optional', which was not previously initialized, that is, does not store any value. Technically, this issue leads to undefined behavior and gives rise to other errors.
Consider the following example of incorrect code:
std::optional<Value> opt;
if (cond)
{
opt->max = 10;
opt->min = 20;
}
if (opt)
{
....
}In this example, the 'opt' variable was never initialized, which, in its turn, prevents the code in the "if (opt)" branch from executing.
Fixed version:
std::optional<Value> opt;
if (cond)
{
opt = Value(10, 20);
}
if (opt)
{
....
}The analyzer can also detect situations where the value of a potentially uninitialized object of type 'optional' is accessed. For example:
boost::optional<int> opt = boost::none;
opt = interpret(tr);
if (cond)
opt = {};
process(*opt);Fixed version:
boost::optional<int> opt = boost::none;
opt = interpret(tr);
if (!cond)
process(*opt);Note. The diagnostic rule has a special setting that enables it to issue an extended message. The message contains a list of functions that need to be used to check an optional type object before obtaining the value. To display the extended message, add the following comment to the source code file or to the diagnostic rules configuration file (.pvsconfig):
//+V1007 PRINT_CHECKERSThis diagnostic is classified as:
|
You can look at examples of errors detected by the V1007 diagnostic. |
V1008. No more than one iteration of the loop will be performed. Consider inspecting the 'for' operator.
The analyzer has detected a possible error that has to do with using suspicious initial and final values of the counter variable in a 'for' statement. This may break the logic of execution.
Consider the following example of suspicious code:
int c = 0;
if (some_condition)
{
....
c = 1;
}
for (int i = 0; i < c; ++i) {
....
}The loop will iterate either 0 or 1 time; therefore, it can be replaced with an 'if' statement.
int c = 0;
if (some_condition)
{
....
c = 1;
}
if (c != 0)
{
....
}There could also be a mistake in the expression evaluating the value of the variable that the loop counter is compared with. For example, the programmer could have actually meant the following:
int c = 0;
if (some_condition)
{
....
c = 1 + n;
}
for (int i = 0; i < c; ++i)
{
....
}This diagnostic is classified as:
You can look at examples of errors detected by the V1008 diagnostic. |
V1009. Check the array initialization. Only the first element is initialized explicitly.
The analyzer has detected a possible error that has to do with initializing only the first element of an array during declaration. This means that the other elements will be implicitly initialized to zero or by the default constructor.
Consider the following example of incorrect code:
int arr[3] = {1};The programmer probably expected that the 'arr' array would be filled with ones, but this assumption is wrong. The array will contain the elements 1, 0, 0.
Fixed code:
int arr[3] = {1, 1, 1};Mistakes like this may result from confusing this declaration construct with the similarly looking "arr = {0}" construct, which initializes every element of the array to zero.
If such constructs are common in your project, you may want to disable this diagnostic.
It is also recommended that you keep your code clear.
For example, consider the following code defining color codes:
int White[3] = { 0xff, 0xff, 0xff };
int Black[3] = { 0x00 };
int Green[3] = { 0x00, 0xff };Thanks to implicit initialization, all the colors are defined correctly, but it is better to rewrite this code in a more straightforward form:
int White[3] = { 0xff, 0xff, 0xff };
int Black[3] = { 0x00, 0x00, 0x00 };
int Green[3] = { 0x00, 0xff, 0x00 };This diagnostic is classified as:
You can look at examples of errors detected by the V1009 diagnostic. |
V1010. Unchecked tainted data is used in expression.
The analyzer has detected the use of external data without preliminary check. Putting too much trust in such data may have various negative implications, including security issues.
At present, the V1010 diagnostic detects the following error patterns:
- Unchecked tainted data is used in index.
- Unchecked tainted data is used in the argument that is expected to contain verified data.
- Corrupting a pointer by changing its value using unchecked tainted data.
- Division by unchecked tainted data.
Each pattern is discussed in detail below.
Example of suspicious code using unchecked tainted data in index:
size_t index = 0;
....
if (scanf("%zu", &index) == 1)
{
....
DoSomething(arr[index]); // <=
}Executing this code may result in indexing beyond the bounds of the 'arr' array if the user enters a value that is negative or greater than the maximum index valid for this array.
The correct version of this code checks the value passed before indexing into the array:
if (index < ArraySize)
DoSomething(arr[index]);Example of suspicious code using unchecked tainted data as an argument to a function:
char buf[1024];
char username [256];
....
if (scanf("%255s", username) == 1)
{
if (snprintf(buf, sizeof(buf) - 1, commandFormat, username) > 0)
{
int exitCode = system(buf); // <=
....
}
....
}This code is vulnerable as the program passes the user input to the command-line interpreter without checking it. For example, entering "&cmd" in Windows could give the user access to the command-line interpreter.
The correct version of the code must execute an additional check of the data read:
if (IsValid(username))
{
if (snprintf(buf, sizeof(buf) - 1, commandFormat, username) > 0)
{
int exitCode = system(buf);
....
}
....
}
else
{
printf("Invalid username: %s", username);
....
}Example of suspicious code with pointer corruption:
size_t offset = 0;
int *pArr = arr;
....
if (scanf("%zu", &offset) == 1)
{
pArr += offset; // <=
....
DoSomething(pArr);
}In this example, the value of the 'pArr' pointer becomes corrupt because adding the unchecked tainted value 'offset' may cause the pointer to start referencing beyond the array bounds. This poses a risk of corrupting some data (which will be referred to by 'pArr') with unpredictable consequences.
The correct version of the code checks the validity of the offset:
if (offset <= allowableOffset)
{
pArr += offset;
....
DoSomething(pArr);
}The example of suspicious code with division by unchecked tainted data:
if (fscanf(stdin, "%zu", &denominator) == 1)
{
targetVal /= denominator;
}This code may result in division by 0 if a corresponding value is entered by a user.
Correct code performs a check of values validation:
if (fscanf(stdin, "%zu", &denominator) == 1)
{
if (denominator > MinDenominator && denominator < MaxDenominator)
{
targetVal /= denominator;
}
}This diagnostic is classified as:
V1011. Function execution could be deferred. Consider specifying execution policy explicitly.
The analyzer had discovered the use of 'std::async' function, which can behave differently from what the developer had expected. The 'std::async' function receives the following arguments: the function to be executed, its arguments and an optional flag which influences the execution policy of 'std::async'. The function returns an 'std::future' instance, the value of which will be assigned after the function finishes its execution.
The behavior of 'std::async' depends upon the flags it receives in the following way:
1) 'std::launch::async' - an instance of the 'thread' class will be created immediately, using the function and its arguments as the arguments of new thread. It means that 'std::async' will encapsulate the creation of a thread and 'std::future' and provides a way to execute such these actions in a single line of code.
2) 'std::launch::deferred' – the behavior of the function will change - there will be no asynchronous execution. Instead of executing the function in a different thread, it will be saved, together with all of its arguments, to the 'std::future' instance, so it can be called later. This call will happen when someone invokes 'get' or 'wait' methods of this 'future' instance returned by 'std::async'. The execution will be performed in the same thread that called get\wait. This behavior is, in fact, a the deferred execution.
3) The flag is not specified (std::launch::async | std::launch::deferred) - in this case, one of the two execution policies specified above will be selected automatically. Which one? It is unspecified and depends on the implementation.
If the execution policy is not specified when executing the 'std::async' function, the third case is used. To help avoid possible uncertainty in the behavior of this function, analyzer detects such cases.
Future<int> foo = std::async(MyFunction, args...);After this call, there is a possibility that different systems with different implementations of standard libraries will have different behavior.
We recommend taking this into account and solving this potential behavioral uncertainty by explicitly specifying the execution policy with the function's first parameter. Reliable way of explicitly specifying the execution policy is the following:
Future<int> foo = std::async(launch::async, MyFunction, args...)V1012. The expression is always false. Overflow check is incorrect.
The analyzer has detected an incorrect check for an overflow that may occur when adding variables of type 'unsigned short' or 'unsigned char'.
Consider the following example of incorrect code:
bool IsValidAddition(unsigned short x, unsigned short y)
{
if (x + y < x)
return false;
return true;
}When adding two variables of type 'unsigned short', both are cast to type 'int'. The resulting value will also be of type 'int'. Because of that, no matter what values are stored in the variables 'x' and 'y', adding them will never cause an overflow. The comparison operation is executed next, with the right operand (the 'x' variable) promoted to type 'int' again. Therefore, the code above is equivalent to this:
bool IsValidAddition(unsigned short x, unsigned short y)
{
if ((int)(x) + (int)(y) < (int)(x))
return false;
return true;
}The "x + y < x" expression turns out to be always false. The compiler will most likely optimize the function by substituting the 'true' value in every call to it. This means that the function does not actually check anything and does not protect your program from an overflow.
Note: if you use the data model where the types 'short' and 'int' are the same size, the check will work correctly and the analyzer will ignore it.
To fix the check, you have to explicitly cast the sum of the two variables to type 'unsigned short':
if ((unsigned short)(x + y) < x)
{
...
}This diagnostic is classified as:
|
V1013. Suspicious subexpression in a sequence of similar comparisons.
The analyzer has detected a code fragment that is very likely to contain a typo. The fragment is a sequence of similar comparisons of class members, but one of the subexpressions is different from the others in that it compares a pair of members of different names, while the others compare pairs of members of the same name.
Consider the following example:
if (a.x == b.x && a.y == b.y && a.z == b.y)In this code, the 'a.z == b.y' subexpression is different from the other subexpressions in the sequence and is very likely a result of a typo made by the programmer when editing the copied code fragment. This is the correct version, which would not trigger the warning:
if (a.x == b.x && a.y == b.y && a.z == b.z)The analyzer outputs this warning for sequences of three and more comparisons.
This diagnostic is classified as:
You can look at examples of errors detected by the V1013 diagnostic. |
V1014. Structures with members of real type are compared byte-wise.
The analyzer has detected a suspicious comparison of two structures containing members of type float or double.
Consider the following example:
struct Object
{
int Length;
int Width;
int Height;
float Volume;
};
bool operator == (const Object &p1, const Object &p2)
{
return memcmp(&p1, &p2, sizeof(Object)) == 0;
}Since the 'Object' structure contains floating-point numbers, comparing them using the 'memcmp' function could have an unexpected result. For example, the numbers -0.0 and 0.0 are equivalent but have different bit representation. Two NaN's have the same representation, but they are not equivalent. It may make sense to use the == operator or compare those variables to a certain precision.
Suppose we want to compare class members using the == operator. In this case, we could delete the 'operator ==' part entirely as the compiler can handle it on its own by implementing the comparison operator by default. However, suppose we do need to implement it as our custom function to compare the 'Volume' members to a certain precision. The fixed version would then look like this:
bool operator == (const Object &p1, const Object &p2)
{
return p1.Length == p2.Length
&& p1.Width == p2.Width
&& p1.Height == p2.Height
&& fabs(p1.Volume - p2.Volume) <= FLT_EPSILON;
}This diagnostic is classified as:
|
V1015. Suspicious simultaneous use of bitwise and logical operators.
The analyzer has detected a suspicious expression that uses logical and bitwise operations at the same time. One of those operations is probably mistyped.
Consider the following example:
void write(int s);
void write(unsigned char a, unsigned char b,
unsigned char c, unsigned char d)
{
write((a << 24) | (b << 16) || (c << 8) | d);
}This is obviously a typo: the programmer used the '||' operator instead of '|' by mistake. The fixed code:
void write(unsigned char a, unsigned char b,
unsigned char c, unsigned char d)
{
write((a << 24) | (b << 16) | (c << 8) | d);
}This diagnostic is classified as:
|
V1016. The value is out of range of enum values. This causes unspecified or undefined behavior.
The analyzer detected a dangerous cast from a numeric type to an enumeration. The specified number may not be in the range of 'enum' values.
Note 1: This rule is only relevant for the C++ language. The underlying 'enum' type is always 'int' in the C language.
Note 2: This rule is only relevant for C++ compilers that calculate the actual size of 'enum' according to the standard. For example, such compilers are GCC and Clang. MSVC compiler doen't fall into this category, since it calculates the 'enum' size for backward compatibility purposes according to the rules of the C language. It always uses the 'int' type as the underlying type, unless a different type is specified.
The result of casting a number whose value is not in the range of 'enum' elements is unspecified behavior up to C++17 and undefined behavior starting from C++17.
If an underlying type is specified for 'enum', then all values that can fit into this type can be cast to this 'enum' type.
Example 1:
enum class byte : unsigned char {}; // Range: [0; 255]
byte b1 = static_cast<byte>(255); // okThe number 256 no longer fits in the 'char' type, so this code is incorrect:
byte b2 = static_cast<byte>(256); // UBIf an underlying type is not specified, then, according to the standard, the compiler tries to fit the values depending on the initializer into the following types:
int -> unsigned int -> long -> unsigned long ->
long long -> unsigned long longWithin the selected type, the compiler uses the minimum required number of bits (n) that can fit the maximum number in the enumeration. In such an 'enum', you can fit the range of values [- (2^n) / 2; 2^n / 2 - 1] for 'enum' with a signed underlying type and [0; 2^n - 1] for 'enum' with an unsigned underlying type. Bounds violation of this range is unspecified behavior (before C++17) or undefined behavior (since C++17).
Example 2:
enum foo { a = 0, b = UINT_MAX }; // Range: [0; UINT_MAX]
foo x = foo(-1); // UBAt first glance, this code is correct, but in fact it can result in troubles. The underlying 'enum' type is set to 'unsigned int'. The number '-1' does not fall within the range of this type, so such an assignment may lead to unspecified or undefined behavior.
Example 3.
enum EN { low = 2, high = 4 }; // Uses 3 bits, range: [0; 7]
EN a1 = static_cast<EN>(7); // okAccording to the standard, the underlying type for this enum is 'int'. Inside this type, the compiler uses the minimum width of the bit field that can fit all the values of enum constants.
In this case, you will need at least 3 bits to fit all the values (2 = 0b010 and 4 = 0b100), so an EN variable can fit numbers from 0 (0b000) to 7 (0b111) inclusively. The number 8 already occupies four bits (0b1000), so it no longer fits in the EN type:
EN a2 = static_cast<EN>(8); // UBUndefinedBehaviorSanitizer also finds an error in this example: https://godbolt.org/z/GGYo7z.
At the same time, if you specify the underlying type for EN, for example, 'unsigned char', then this will be the correct code version:
enum EN : unsigned char { low = 2, high = 4 }; // Range: [0; 255]
EN a2 = static_cast<EN>(8); // okThis diagnostic is classified as:
|
V1017. Variable of the 'string_view' type references a temporary object, which will be removed after evaluation of an expression.
The analyzer has detected that an instance of class 'std::string_view' is initialized by or assigned a temporary object.
Consider the following example:
std::string hello = "Hello, ";
std::string_view helloWorldPtr = hello + "world\n";
std::cout << helloWorldPtr;In the second line of this code, a temporary object of the type 'std::string' will be created, the pointer to which will be copied when initializing the instance of the 'std::string_view' class. After that, once the initialization expression has been evaluated, the temporary object will be destroyed; therefore, the pointer used in the third line will be referring to a freed memory block.
This is the fixed version:
std::string hello = "Hello, ";
const std::string helloWorld = hello + "world\n";
std::string_view helloWorldPtr = helloWorld;
std::cout << helloWorldPtr;This diagnostic is classified as:
V1018. Usage of a suspicious mutex wrapper. It is probably unused, uninitialized, or already locked.
The analyzer has detected an incorrect use of a mutex wrapper (std::unique_lock, etc).
Consider the following example:
std::unique_lock<std::mutex> lck;
lck.lock();Here, in the second line, an exception 'std::system_error' will be thrown since there is no mutex associated with the wrapper. It should either be passed in the constructor:
std::unique_lock<std::mutex> lck(m, std::defer_lock);
lck.lock();or initialized by the 'swap()' method:
std::unique_lock<std::mutex> lck_global(mtx, std::defer_lock);
....
std::unique_lock<std::mutex> lck;
lck.swap(lck_global);
lck.lock();This diagnostic also detects cases where a critical section is declared but the mutex is not locked for some reason:
std::unique_lock<std::mutex> lck(m, std::defer_lock);
//lck.lock();This diagnostic is classified as:
V1019. Compound assignment expression is used inside condition.
The analyzer has detected a compound assignment operator used inside an expression of type 'bool'.
Consider the following example:
if (adj_number == (size_t)(roving->adj_count - 1) &&
(total_quantity += quantity_delta) < 0)
{
/* ... */
}In this case, the 'total_quantity' variable is changed inside the conditional expression of the 'if' statement. What makes this code even more suspicious is the fact that 'total_quantity' will change only if the condition to the left of the '&&' operator is true. This is probably a typo, and the programmer must have intended to use the addition operator '+' rather than the compound assignment operator '+=':
if (adj_number == (size_t)(roving->adj_count - 1) &&
(total_quantity + quantity_delta) < 0)
{
/* ... */
};Even if the initial snippet is correct, it is still strongly recommended that you avoid writing complex expressions like that. Their logic is quite complicated, and programmers could easily make a mistake when modifying such code.
The analyzer is not always able to tell if the code detected by this diagnostic is really faulty or if the programmer was simply trying to make it shorter. So, we reviewed a lot of open-source projects and singled out a few programming patterns where such constructs are harmless. To reduce the number of false positives, we set the diagnostic to keep silent in the following cases:
- The left operand of the compound assignment operator is a pointer;
- The compound assignment operator is part of a macro;
- The compound assignment operator is inside a loop body.
If you get too many false positives on your project, you can disable this diagnostic or use the false-positive suppression means.
This diagnostic is classified as:
|
V1020. Function exited without performing epilogue actions. It is possible that there is an error.
The analyzer has detected a function body that contains a block of code starting and ending with calls to functions with opposite names, while the code between these calls contains a condition causing the function under analysis to return without calling the epilogue function.
Consider the following example:
int pthread_cond_destroy(pthread_cond_t * cond)
{
EnterCriticalSection(&ptw32_cond_list_lock);
/* ... */
if (sem_wait (&(cv->semBlockLock)) != 0)
{
return errno; // <= V1020 Warning
}
/* ... */
LeaveCriticalSection(&ptw32_cond_list_lock);
return 0;
}There are the calls to 'EnterCriticalSection' and 'LeaveCriticalSection' with the opposite words 'Enter' and 'Leave' at the beginning and end of the function body. The code in between contains a return statement with a missing call to 'LeaveCriticalSection' before it. This is what the fixed code should look like:
int pthread_cond_destroy(pthread_cond_t * cond)
{
EnterCriticalSection(&ptw32_cond_list_lock);
/* ... */
if (sem_wait (&(cv->semBlockLock)) != 0)
{
LeaveCriticalSection(&ptw32_cond_list_lock);
return errno;
}
/* ... */
LeaveCriticalSection(&ptw32_cond_list_lock);
return 0;
}This diagnostic is classified as:
You can look at examples of errors detected by the V1020 diagnostic. |
V1021. The variable is assigned the same value on several loop iterations.
The analyzer has detected a loop with a suspicious assignment operation, which could make that loop infinite.
Consider the following example:
static void f(Node *n)
{
for (Node *it = n; it != nullptr; it = n->next)
....
}This is a typical construct used to traverse lists. When 'n' is not modified, this loop will either never iterate or will iterate infinitely.
Fixed code:
static void f(Node *n)
{
for (Node *it = n; it != nullptr; it = it->next)
....
}This diagnostic is classified as:
V1022. Exception was thrown by pointer. Consider throwing it by value instead.
The analyzer has detected an exception thrown by pointer. A more common practice is to throw exceptions by value and catch them by reference. When thrown by pointer, an exception may never be caught as it is supposed to be caught by reference. In addition, the catching part will have to call the 'delete' operator to destroy the object created to avoid a memory leak.
Consider the following example:
throw new std::runtime_error("error");Fixed code:
throw std::runtime_error("error");Throwing an exception by pointer is not a mistake in itself, of course. Such exceptions can be properly caught and handled. But in practice, this is inconvenient and leads to errors. The arguments against throwing exceptions by pointer are as follows:
- You have to take care of destroying the object yourself by calling the 'delete' operator.
- You cannot use 'catch(...)' since the program does not know how to destroy the object.
- This is a non-standard way of error reporting, and other parts of the program may fail to handle such exceptions properly.
- If you have run out of dynamic memory, an attempt to create a new object using the 'new' operator may fail too.
So, throwing exceptions by pointer can be considered an anti-pattern, which should be rewritten into correct code.
References:
- Deb Haldar. Top 15 C++ Exception handling mistakes and how to avoid them. (Mistake # 6: Not Throwing an exception by value)
- Discussion on Stack Overflow. throw new std::exception vs throw std::exception.
- Discussion on Stack Overflow. C++: Throwing exceptions, use 'new' or not?
- Discussion on Stack Overflow. c++ exception : throwing std::string.
This diagnostic is classified as:
You can look at examples of errors detected by the V1022 diagnostic. |
V1023. A pointer without owner is added to the container by the 'emplace_back' method. A memory leak will occur in case of an exception.
The analyzer has detected code that adds smart pointers to a container using the 'emplace_back(new X)' method. Such code may cause a memory leak.
Consider the following example:
std::vector<std::unique_ptr<int>> pointers;
pointers.emplace_back(new int(42));If the vector needs reallocation and fails to allocate a new array, it will throw an exception, and the pointer will be lost.
Fixed code:
pointers.push_back(std::unique_ptr<int>(new int(42)));
pointers.push_back(std::make_unique<int>(42));Let's examine this type of error in detail.
One cannot simply write 'v.push_back(new X)' to add an element to the end of a container of type 'std::vector<std::unique_ptr<X>>' as there is no implicit cast from 'X*' to 'std::unique_ptr<X>'.
A common solution is to write 'v.emplace_back(new X)' since it compiles successfully: the 'emplace_back' method constructs the element directly from the arguments and, therefore, can use explicit constructors.
However, this is not a safe practice. If the vector is full, the memory is reallocated. Reallocation may fail, causing an 'std::bad_alloc' exception to be thrown. In this case, the pointer will be lost and the object created will never be deleted.
A safer solution is to create a 'unique_ptr', which will own the pointer until the vector attempts to reallocate memory:
v.push_back(std::unique_ptr<X>(new X))Since C++14, 'std::make_unique' can be used too:
v.push_back(std::make_unique<X>())This diagnostic is classified as:
|
You can look at examples of errors detected by the V1023 diagnostic. |
V1024. Potential use of invalid data. The stream is checked for EOF before reading from it but is not checked after reading.
The analyzer has detected code where invalid data may be used during a read operation.
Consider the following example:
while (!in.eof()) {
in >> x;
foo(x);
}If the read operation fails, the 'x' variable will contain invalid data, while the 'foo' function will be called anyway. The solution is to either add another check before using 'x' or rewrite the loop as shown below.
Fixed code:
while (in >> x) {
foo(x);
}References:
- C++ Antipatterns. See section "Testing for istream.eof() in a loop".
- Stackexchange.com. Why does ifstream.eof() not return TRUE after reading the last line of a file?
This diagnostic is classified as:
|
V1025. New variable with default value is created instead of 'std::unique_lock' that locks on the mutex.
The analyzer has detected an incorrect use of the 'std::unique_lock' class potentially leading to a race condition.
Consider the following example:
class C {
std::mutex m_mutex;
void foo() {
std::unique_lock <std::mutex>(m_mutex);
}
};In this code, a new variable called 'm_mutex' is created and initialized to a default value. It means that the mutex will not be locked.
Fixed code:
void foo() {
std::unique_lock <std::mutex> var(m_mutex);
}This diagnostic is classified as:
V1026. The variable is incremented in the loop. Undefined behavior will occur in case of signed integer overflow.
The analyzer has detected a potential signed integer overflow in a loop. Overflowing signed variables leads to undefined behavior.
Consider the following example:
int checksum = 0;
for (....) {
checksum += ....;
}This is an abstract algorithm to calculate a checksum. It implies the possibility of overflowing the 'checksum' variable, but since this variable is signed, an overflow will result in undefined behavior. The code above is incorrect and must be rewritten.
You should use unsigned types whose overflow semantics are well-defined.
Fixed code:
unsigned checksum = 0;
for (....) {
checksum += ...
}Some programmers believe that there is nothing bad about signed overflow and that they can predict their program's behavior. This is a wrong assumption because there are many possible outcomes.
Let's examine how errors of this type occur in real-life programs. One developer left a post on the forum complaining about GCC's acting up and incorrectly compiling his code in optimization mode. He included the code of a string checksum function that he used in his program:
int foo(const unsigned char *s)
{
int r = 0;
while(*s) {
r += ((r * 20891 + *s *200) | *s ^ 4 | *s ^ 3) ^ (r >> 1);
s++;
}
return r & 0x7fffffff;
}His complaint is that the compiler does not generate code for the bitwise AND (&), which makes the function return negative values although it should not.
The developer believes this has to do with some bug in the compiler, but in fact it is his own fault since he wrote incorrect code. The function does not work properly because of undefined behavior occurring in it.
The compiler notices that a certain sum is calculated in the 'r' variable. According to the C and C++ standards, an overflow of the signed variable 'r' cannot occur. Otherwise, the program contains undefined behavior that the compiler should not consider.
So, the compiler considers that since the 'r' variable does not overflow after the end of the loop, it cannot become negative. Therefore, the 'r & 0x7fffffff' operation to reset the signed bit is senseless, and the compiler removes it. It returns the value of the 'r' variable from the function.
The V1026 diagnostic is designed to detect such errors. To fix the code, you should simply use an unsigned variable to calculate the checksum.
Fixed code:
int foo(const unsigned char *s)
{
unsigned r = 0;
while(*s) {
r += ((r * 20891 + *s *200) | *s ^ 4 | *s ^ 3 ) ^ (r >> 1);
s++;
}
return (int)(r & 0x7fffffff);
}References:
- Andrey Karpov. Undefined behavior is closer than you think.
- Will Dietz, Peng Li, John Regehr, and Vikram Adve. Understanding Integer Overflow in C/C++.
This diagnostic is classified as:
|
V1027. Pointer to an object of the class is cast to unrelated class.
The analyzer has detected a suspicious type cast: a pointer to a class is cast to a pointer to another class, neither of which is derived from the other.
Consider the following example:
struct A {};
struct B {};
struct C : B {};
void f(A *a, B *b) {
C *c = (C*)a;
}The programmer could have accidentally cast a wrong variable. Then the fixed code looks like this:
void f(A *a, B *b) {
C *c = (C*)b;
}If, however, that behavior was intended, the developer should use 'reinterpret_cast':
void f(A *a, B *b) {
C *c = reinterpret_cast<C*>(a);
}This modified code will no longer trigger the warning.
Note. In some projects, especially those performing low-level operations, you may find numerous casts between different structures unrelated in terms of inheritance but related logically. In other words, such type casts are intended and necessary. In that case, diagnostic V1027 would only produce noise, so it would be better to turn it off.
This diagnostic is classified as:
V1028. Possible overflow. Consider casting operands, not the result.
The analyzer has detected a suspicious type cast: the result of a binary operation over 32-bit values is cast to a 64-bit type.
Consider the following example:
unsigned a;
unsigned b;
....
uint64_t c = (uint64_t)(a * b);This cast is redundant: type 'unsigned' would have been automatically promoted to type 'uint64_t' anyway when executing the assignment operation.
The developer must have intended to take measures against a possible overflow but failed to do that properly. When multiplying 'unsigned' variables, the overflow will take place anyway, and only then will the meaningless product be explicitly promoted to type 'uint64_t'.
It is one of the operands that should have been cast instead to avoid the overflow. Fixed code:
uint64_t c = (uint64_t)a * b;This diagnostic is classified as:
|
You can look at examples of errors detected by the V1028 diagnostic. |
V1029. Numeric Truncation Error. Return value of function is written to N-bit variable.
The analyzer has detected a situation where the length of a container or string is stored to a 16-bit or 8-bit variable. This is dangerous because even with small data, the size value may not fit into the variable, thus causing an error.
Consider the following example:
std::string str;
....
short len = str.length();We must use type 'size_t' as it guarantees to exactly fit the size of any string/container:
size_t len = str.length();Or, if we want to be meticulous, type 'std::string::size_type':
std::string::size_type len = str.length();Or we could use the 'auto' keyword:
auto len = str.length();This defect might seem harmless. The programmer may assume that the string simply cannot be too long in any reasonable scenario. But what they do not take into account is that such data truncation can be intentionally exploited as a vulnerability. That is, an intruder could find a way to feed invalid input data to get oversized strings. Incorrect handling of such strings by the program could then enable them to manipulate its behavior. In other words, this defect is a potential vulnerability and must be fixed.
Some users say that the analyzer is not correct, issuing a warning for the following code:
size = static_cast<unsigned short>(array->size());They think that if there is 'static_cast', then everything is fine and a developer knows what he is doing. However, it is possible that by using type casting someone was struggling with a compiler warning. By doing so, 'static_cast' only covers up the problem, but does not eliminate it.
If in a project there is a lot of code, where such type castings are used and you trust this code, you can just disable the 1029 diagnostic. Another option is to disable warnings exactly for the cases, where 'static_cast' is used. To do it, you can write in one of global header files or in the diagnostics configuration file (.pvsconfig) the following comment:
//-V:static_cast:1029Note. Diagnostic V1029 ignores cases when the size is stored to a 32-bit variable. These are detected by diagnostics that search for 64-bit related error patterns. See the "Diagnosis of 64-bit errors (Viva64, C++)" diagnostics set in the documentation.
This diagnostic is classified as:
|
V1030. Variable is used after it is moved.
The analyzer has detected a variable that is being used after a move operation.
std::string s1;
std::string s2;
....
s2 = std::move(s1);
return s1.size();When moved, a variable is existing in an unspecified yet valid state, which still allows calling the destructor on it. Assuming that objects in your programs are in this state is unsafe, except for a number of classes such as 'std::unique_ptr' whose behavior is well-defined.
This diagnostic is classified as:
|
V1031. Function is not declared. The passing of data to or from this function may be affected.
The analyzer has detected a function used in a file without being declared first. It is a legitimate practice in the C language, but it is potentially dangerous as it may lead to incorrect program behavior.
Consider the following simple example:
char *CharMallocFoo(int length)
{
return (char*)malloc(length);
}Since the header file <stdlib.h> has not been included, the C compiler assumes that the 'malloc' function will return a value of type 'int'. Incorrect interpretation of the return value may cause run-time errors, including a crash.
If your program is 64-bit, it is very likely that the 32 most significant bits of the return address will be lost. This means that the program will execute correctly for some time, but when the 4 less significant gigabytes of memory are used up or become heavily fragmented, the system will allocate a buffer beyond those 4 gigabytes. Since the most significant bits of the pointer have been lost, the implications will be quite unpleasant and unpredictable. This issue is discussed in detail in the article "A nice 64-bit error in C".
Fixed code:
#include <stdlib.h>
....
char *CharMallocFoo(int length)
{
return (char*)malloc(length);
}This diagnostic is classified as:
|
V1032. Pointer is cast to a more strictly aligned pointer type.
The analyzer has detected a pointer cast from one type to another, which leads to undefined behavior. Objects of different types may be aligned differently, and casting a pointer type may break the alignment. Dereferencing such an incorrect pointer may cause a crash, while performing operations on it may cause data loss.
Consider the following example.
void foo(void) {
char ch = '1';
int *int_ptr = (int *)&ch;
char *char_ptr = (char *)int_ptr;
}Reading the address of the 'ch' variable and writing it to a pointer of type 'int' could result in data loss. When casting back, the alignment may change.
To avoid this, you can, for example, perform operations on objects of the same type:
void func(void) {
char ch = '1';
int i = ch;
int *int_ptr = &i;
}or specify the alignment manually:
#include <stdalign.h>
void func(void) {
alignas(int) char ch = '1';
int *int_ptr = (int *)&ch;
char * char_ptr = (char *)int_ptr;
}Here is another situation that can be seen in real-life code. A buffer of bytes is allocated on the stack, and the programmer intends to use it to store a structure. This practice is common when working with such structures as BITMAPINFO. This is what it looks like:
typedef struct tagBITMAPINFOHEADER {
DWORD biSize;
LONG biWidth;
LONG biHeight;
WORD biPlanes;
WORD biBitCount;
DWORD biCompression;
DWORD biSizeImage;
LONG biXPelsPerMeter;
LONG biYPelsPerMeter;
DWORD biClrUsed;
DWORD biClrImportant;
} BITMAPINFOHEADER, *PBITMAPINFOHEADER;
....
typedef struct tagBITMAPINFO {
BITMAPINFOHEADER bmiHeader;
RGBQUAD bmiColors[1];
} BITMAPINFO, *LPBITMAPINFO, *PBITMAPINFO;As you can see, the structure contains variables of types DWORD, LONG, and so on, which must be properly aligned. Moreover, 'bmiColors' is not actually a one-element array; it will contain as many elements as needed – that is why this structure can be created using an array of bytes. The result is the following dangerous code, which you may occasionally see in applications:
void foo()
{
BYTE buffer[sizeof(BITMAPINFOHEADER) + 3 * sizeof(RGBQUAD)] = {0};
BITMAPINFO *pBMI = (BITMAPINFO*)buffer;
....
}The buffer on the stack is very likely to become 8-byte aligned, and the code will work. However, it is extremely fragile! Adding just one variable to the beginning of the function could break it all.
Incorrect code:
void foo()
{
char x;
BYTE buffer[sizeof(BITMAPINFOHEADER) + 3 * sizeof(RGBQUAD)] = {0};
BITMAPINFO *pBMI = (BITMAPINFO*)buffer;
....
}Now the 'buffer' is very likely to start with an unaligned address. The size of the 'x' variable is the same as the size of the 'buffer' array's elements, so the buffer can be located on the stack right after the 'x' variable without any offset (alignment).
It depends on the compiler, of course, and you may be lucky again to have the program run correctly. But hopefully we have made it clear why this practice is not a good one.
This problem can be overcome by creating an array in dynamic memory. The allocated memory block will always be aligned according to whatever type is stored in it.
Fixed code:
void foo()
{
char x;
BITMAPINFO *pBMI = (BITMAPINFO *)
calloc(sizeof(BITMAPINFOHEADER) + 3 * sizeof(RGBQUAD),
sizeof(BYTE));
....
}This diagnostic is classified as:
|
You can look at examples of errors detected by the V1032 diagnostic. |
V1033. Variable is declared as auto in C. Its default type is int.
The analyzer has detected a variable declared using the 'auto' keyword in C code. Using this keyword could confuse developers accustomed to working with C++11 or higher versions of C++. Instead of deducing the type, the compiler will interpret the 'auto' keyword as type 'int'.
This may have unexpected results, for example, in arithmetic operations. Consider the following simple example:
float d = 3.14f;
int i = 1;
auto sum = d + i;The value of the 'sum' variable will be '4', not the expected '4.14'. In C programs, the variable type must be declared explicitly:
float d = 3.14f;
int i = 1;
float sum = d + i;The original code fragment is absolutely correct from the viewpoint of the C++ language. This diagnostic will help you avoid errors in projects that make use of both languages.
V1034. Do not use real-type variables as loop counters.
The analyzer has detected a real-type variable used as a counter in a 'for' loop. Since floating-point numbers cannot accurately represent all real numbers, the number of iterations may vary for loops relying on such variables.
Consider the following example:
void foo(void) {
for (float A = 0.1f; A <= 10.0f; A += 0.1f) {
....
}
}This loop may iterate 99 or 100 times. The accuracy of operations involving real numbers depends on the compiler, optimization mode, and many other things.
It is better to rewrite the loop as follows:
void foo(void) {
for (int count = 1; count <= 100; ++count) {
float A = count / 10.0f;
}
}Now it is guaranteed to iterate exactly 100 times, while the 'A' variable can be used for the calculations.
This diagnostic is classified as:
|
V1035. Only values returned from fgetpos() can be used as arguments to fsetpos().
As defined by the C standard, calling the 'fsetpos' function with an argument obtained not by the 'fgetpos' function leads to undefined behavior.
Consider the following example:
int foo()
{
FILE * pFile;
fpos_t position;
pFile = fopen("file.txt", "w");
memset(&position, 0, sizeof(position));
fputs("That is a sample", pFile);
fsetpos(pFile, &position);
fputs("This", pFile);
fclose(pFile);
return 0;
}Because the value of the 'position' variable was obtained not by the 'fgetpos' function, further program execution may fail.
Fixed code:
int foo()
{
FILE * pFile;
fpos_t position;
pFile = fopen("file.txt", "w");
fgetpos(pFile, &position);
fputs("That is a sample", pFile);
fsetpos(pFile, &position);
fputs("This", pFile);
fclose(pFile);
return 0;
}This diagnostic is classified as:
|
V1036. Potentially unsafe double-checked locking.
The analyzer has detected a potential error that has to do with unsafe use of the "double-checked locking" pattern. This pattern is used to reduce the overhead of acquiring a lock. First the locking criterion is checked without synchronization, and only if this criterion is met, will the thread attempt to acquire the lock. That is, locking will occur only if the check indicates that locking is required.
Consider the following example:
static std::mutex mtx;
class TestClass
{
public:
void Initialize()
{
if (!initialized)
{
std::lock_guard lock(mtx);
if (!initialized) // <=
{
resource = new SomeType();
initialized = true;
}
}
}
/* .... */
private:
bool initialized = false;
SomeType *resource = nullptr;
};
}In this example, the compiler optimizes the order of assigning values to the variables 'resource' and 'initialized', which could lead to an error. That is, the 'initialized' variable will be assigned the value 'true' first and only then will the memory for an object of type 'SomeType' be allocated and the variable 'resource' initialized.
Because of this inversion, an error may occur when the object is accessed from another thread: the 'resource' variable will not be initialized yet, while the 'intialized' flag will be already set to 'true'.
One of the problems with this type of errors is that the program seems to be running correctly since the described situation will occur only every now and then, depending on the processor's architecture.
Additional links:
- Scott Meyers and Andrei Alexandrescu. C++ and the Perils of Double-Checked Locking.
- Stack Overflow. What the correct way when use Double-Checked Locking with memory barrier in c++?
- Double-Checked Locking is Fixed In C++11.
This diagnostic is classified as:
You can look at examples of errors detected by the V1036 diagnostic. |
V1037. Two or more case-branches perform the same actions.
The analyzer has detected a situation where different case labels of a switch statement contain the same code. Those are often redundant code, which could be improved by merging the labels. On the other hand, identical code fragments may also result from the use of the copy-paste technique, in which case they are errors rather than simply redundant code.
Consider the following example of redundant code:
switch (wParam)
{
case WM_MOUSEMOVE:
::PostMessage(hWndServer, wParam, 0, 0);
break;
case WM_NCMOUSEMOVE:
::PostMessage(hWndServer, wParam, 0, 0);
break;
....
default:
break
}Indeed, different mouse events may trigger the same actions, so the code can be rewritten in a more compact form:
switch (wParam)
{
case WM_MOUSEMOVE:
case WM_NCMOUSEMOVE:
::PostMessage(hWndServer, wParam, 0, 0);
break;
....
default:
break
}The next example is taken from a real application and demonstrates faulty behavior resulting from a typo:
GLOBAL(void)
jpeg_default_colorspace (j_compress_ptr cinfo)
{
switch (cinfo->in_color_space) {
case JCS_GRAYSCALE:
jpeg_set_colorspace(cinfo, JCS_GRAYSCALE);
break;
case JCS_RGB:
jpeg_set_colorspace(cinfo, JCS_YCbCr);
break;
case JCS_YCbCr:
jpeg_set_colorspace(cinfo, JCS_YCbCr);
break;
....
}
....
}The code of the JCS_RGB label contains a typo. The developer should have passed the value JCS_RGB, not JCS_YCbCr.
Fixed code:
GLOBAL(void)
jpeg_default_colorspace (j_compress_ptr cinfo)
{
switch (cinfo->in_color_space) {
case JCS_GRAYSCALE:
jpeg_set_colorspace(cinfo, JCS_GRAYSCALE);
break;
case JCS_RGB:
jpeg_set_colorspace(cinfo, JCS_RGB);
break;
case JCS_YCbCr:
jpeg_set_colorspace(cinfo, JCS_YCbCr);
break;
....
}
....
}This diagnostic is classified as:
You can look at examples of errors detected by the V1037 diagnostic. |
V1038. It is suspicious that a char or string literal is added to a pointer.
The analyzer has detected an operation of adding a pointer to a char literal. This is likely an error.
In the following example, the programmer wants to append a character to a string of type 'const char*':
const char* Foo()
{
return "Hello world!\n";
}
int main()
{
const char* bar = 'g' + Foo();
printf("%s", bar);
return 0;
}Executing this code will result in adding the numerical value of the 'g' character to the pointer, potentially resulting in going beyond the bounds of the string. To fix this error, you should use a special class, 'std::string', if possible, or memory handling operations:
const char* Foo()
{
return "Hello world!\n";
}
int main()
{
std::string bar = 'g' + std::string(Foo());
printf("%s", bar.c_str());
return 0;
}This diagnostic is classified as:
V1039. Character escape is used in multicharacter literal. This causes implementation-defined behavior.
The analyzer has detected a multicharacter literal containing both characters and character escapes.
Multicharacter literals are implementation-defined, so different compilers handle them differently. For example, GCC and Clang evaluate them based on the order of characters in the literal, while MSVC moves the characters around depending on their type (ordinary or escape).
Consider the following example. The code below will behave differently when complied with different compilers:
#include <stdio.h>
void foo(int c)
{
if (c == 'T\x65s\x74') // <= V1039
{
printf("Compiled with GCC or Clang.\n");
}
else
{
printf("It's another compiler (for example, MSVC).\n");
}
}
int main(int argc, char** argv)
{
foo('Test');
return 0;
}The program could output different messages depending on what compiler it has been compiled with.
This will not affect a project that uses one particular compiler, but you may encounter problems when trying to port it. For this reason, multicharacter literals should be replaced with simple numeric constants. For example, 'Test' should be changed to '0x54657374'.
The variation across compilers in how they treat multicharacter literals can be shown using sequences of 3 and 4 characters, for example, 'GHIJ' and 'GHI', and having the program output their representation in memory after compilation.
Output after compilation with Visual C++:
Hex codes are: G(47) H(48) I(49) J(4A)
'GHIJ' : JIHG
'\x47\x48\x49\x4A' : GHIJ
'G\x48\x49\x4A' : HGIJ
'GH\x49\x4A' : JIHG
'G\x48I\x4A' : JIHG
'GHI\x4A' : JIHG
'GHI' : IHG
'\x47\x48\x49' : GHI
'GH\x49' : IHG
'\x47H\x49' : HGI
'\x47HI' : IHGOutput after compilation with GCC or Clang:
Hex codes are: G(47) H(48) I(49) J(4A)
'GHIJ' : JIHG
'\x47\x48\x49\x4A' : JIHG
'G\x48\x49\x4A' : JIHG
'GH\x49\x4A' : JIHG
'G\x48I\x4A' : JIHG
'GHI\x4A' : JIHG
'GHI' : IHG
'\x47\x48\x49' : IHG
'GH\x49' : IHG
'\x47H\x49' : IHG
'\x47HI' : IHGV1040. Possible typo in the spelling of a pre-defined macro name.
The analyzer has detected a potentially misspelled name of a pre-defined macro.
Non-compliant example:
#if defined (__linux__) || defined (__APPLE_)The same expression fixed:
#if defined (__linux__) || defined (__APPLE__)Another example demonstrating a typo:
#ifdef __WLN32__Correct version:
#ifdef __WIN32__You can look at examples of errors detected by the V1040 diagnostic. |
V1041. Class member is initialized with dangling reference.
This diagnostic detects cases when class members are initialized with a "bad" pointer or reference.
Consider the following example:
class Foo {
int *x;
int &y;
Foo(int a, int b);
};
Foo::Foo(int a, int b) :
x(&a), // <=
y(b) // <=
{};The 'x' variable is a pointer initialized to the address of the 'a' variable. The 'a' variable is an argument and it is local to the constructor, so its scope is narrower than that of 'x'. As a result, after execution leaves the constructor, the 'x' variable will be storing an incorrect pointer.
The same is true for the reference 'y'.
This is what the correct version looks like:
class Foo {
int *x;
int &y;
Foo(int *a, int &b) :
x(a),
y(b)
{}
};
Foo::Foo(int *a, int &b) :
x(a),
y(b),
{}
};Now the address and the reference are passed directly to the constructor; their scope is still limited to that of the constructor, while their values' scope is not.
This diagnostic is classified as:
|
V1042. This file is marked with copyleft license, which requires you to open the derived source code.
The analyzer has detected a file marked with a copyleft license, which requires you to open the rest of the source code. This may be unacceptable for many commercial projects.
If you develop an open-source project, you can simply ignore this warning and turn it off.
Here is an example of a comment that will cause the analyzer to issue the warning:
/* This program is free software: you can redistribute it and/or modify
* it under the terms of the GNU General Public License as published by
* the Free Software Foundation, either version 3 of the License, or
* (at your option) any later version.
*
* This program is distributed in the hope that it will be useful,
* but WITHOUT ANY WARRANTY; without even the implied warranty of
* MERCHANTABILITY or FITNESS FOR A PARTICULAR PURPOSE. See the
* GNU General Public License for more details.
*
* You should have received a copy of the GNU General Public License
* along with this program. If not, see <https://www.gnu.org/licenses/>.
*/For proprietary projects
If you include a file with this type of license (GPL3 in this case) into a proprietary project, you will be required to open the rest of your source code due to the specifics of this license.
Such copyleft licenses are called "viral license" because of their tendency to affect other project files. The problem is that using at least one such file in a proprietary project automatically renders the entire source code open and compels you to distribute it along with the binary files.
This diagnostic detects the following viral licenses:
- AGPL-3.0
- GPL-2.0
- GPL-3.0
- LGPL-3.0
If you discover that your proprietary project uses files with a copyleft license, you have one of the following options:
- Exclude this code (library) from your project;
- Replace the library;
- Make your project open-source.
For open-source projects
We understand that this diagnostic is irrelevant to open-source projects. The PVS-Studio team contributes to the development of open-source software by helping to fix bugs found in such software and offering free license options to open-source developers. However, our product is a B2B solution, so this diagnostic is enabled by default.
If your code is distributed under one of the copyleft licenses from the list above, you can turn this diagnostic off in one of the following ways:
- If you're using the PVS-Studio plugin for Visual Studio, you can disable this diagnostic display in the analyzer output window by going to Options > PVS-Studio > Detectable Errors > 1.General Analysis > V1042. The downside of this method is that the error will still be written in the analyzer's log while saving it (or if the analysis was run from the command line). Therefore, when you open such a log on another machine or convert the analysis results to another format, the messages that were disabled in this way may reappear.
- If you're not using the plugin, want to block the rule for the entire team, or remove it from the analyzer's report, you can add the comment "//-V::1042" to the configuration file (.pvsconfig) or to one of the global header files. For developers, who use Visual C++, a good option would be to add this comment in the "stdafx.h" file. This comment tells the analyzer to disable the V1042 diagnostic. To learn more about using comments to disable diagnostics, see the documentation.
- If you use the Plog Converter utility to convert analysis reports between different formats, you can disable the diagnostic by specifying the "-d" option.
Adding to the list of unsafe licenses
If you know of some other types of viral licenses that our tool does not yet detect, you can inform us about them using the feedback form so that we could add detection of those in the next release.
References
- GNU General Public License
- Viral license
- Ways to Get a Free PVS-Studio License
- Suppression of false alarms
This diagnostic is classified as:
V1043. A global object variable is declared in the header. Multiple copies of it will be created in all translation units that include this header file.
The analyzer has detected a declaration of a constant object in a header file. Including this file using the 'include' directive will result in creating multiple copies of that object. If the class has a constructor, it will be called each time the header is included, which may have undesirable side effects.
For example:
//some_header.h
class MyClass
{
int field1;
int field2;
MyClass (int a, int b)
{
// ....
}
};
// ....
const MyClass object{1, 2}; // <=The diagnostic ignores classes and structures with no constructors defined. The following code snippet will not trigger the warning:
//some_header.h
struct MyStruct
{
int field1;
int field2;
};
// ....
const MyStruct object{1, 2};You can also avoid this error by declaring the variable as 'inline' (starting with C++17) or 'extern'. With this fix, the variable initialization and constructor call will be performed only once.
Fixed version:
//some_header.h
class MyClass
{
// ....
};
// ....
inline const MyClass object{1, 2};Note: using the 'constexpr' keyword instead of 'const' in the variable declaration doesn't change this behavior. According to the C++17 standard, only constexpr functions and static constexpr class/structure fields are implicitly declared as inline.
This issue is discussed in detail in the article "What Every C++ Developer Should Know to (Correctly) Define Global Constants".
You can look at examples of errors detected by the V1043 diagnostic. |
V1044. Loop break conditions do not depend on the number of iterations.
The analyzer has detected a loop whose termination conditions do not depend on the number of iterations. Such a loop may execute 0 or 1 times or become an infinite loop.
Example of incorrect loop:
void sq_settop(HSQUIRRELVM v, SQInteger newtop)
{
SQInteger top = sq_gettop(v);
if(top > newtop)
sq_pop(v, top - newtop);
else
while(top < newtop) sq_pushnull(v); // <=
}The error is found in the while loop: the values of the variables participating in the conditional expression do not change, so the loop will never terminate or start at all (if the variables are equal).
The loop can always execute only once if its condition is changed during the first iteration:
while (buf != nullptr && buf != ntObj)
{
ntObj = buf;
}If this behavior is deliberate, it is better to rewrite the loop as an if-statement:
if (buf != nullptr && buf != ntObj)
{
ntObj = buf;
}Another example:
#define PEEK_WORD(ptr) *((uint16*)(ptr))
....
for(;;)
{
// Verify the packet size
if (dwPacketSize >= 2)
{
dwMsgLen = PEEK_WORD(pbytePacket);
if ((dwMsgLen + 2) == dwPacketSize)
break;
}
throw CString(_T("invalid message packet"));
}Executing any branch of this loop causes it to terminate, and the variables handled inside it will never change. This loop must be incorrect or is simply unnecessary and should be removed.
This diagnostic is classified as:
You can look at examples of errors detected by the V1044 diagnostic. |
V1045. The DllMain function throws an exception. Consider wrapping the throw operator in a try..catch block.
The analyzer has detected a block of code that throws an exception inside the body of the DllMain function but does not catch it.
When loading and attaching a dynamic library to the current process, this function takes the value DLL_PROCESS_ATTACH for the 'fwdReason' parameter. If DllMain terminates with an error, it must return the value FALSE. The loader then calls it again with the value DLL_PROCESS_DETACH for 'fwdReason', thus causing the DLL library to unload. If DllMain terminates as a result of throwing an exception, the library remains attached to the processed.
Example of non-compliant code:
BOOL WINAPI DllMain(HINSTANCE hinstDLL, DWORD fdwReason, LPVOID lpvReserved)
{
....
throw 42;
....
}The program should handle the exception in a try...catch block and return FALSE correctly.
Fixed version:
BOOL __stdcall DllMain(HINSTANCE hinstDLL, DWORD fdwReason, LPVOID lpvReserved)
{
try
{
....
throw 42;
....
}
catch(...)
{
return FALSE;
}
}An exception can also occur when calling the 'new' operator. If memory allocation fails, a 'bad_alloc' exception will be raised, for example:
BOOL WINAPI DllMain(HINSTANCE hinstDLL, DWORD fdwReason, LPVOID lpvReserved)
{
....
int *localPointer = new int[MAX_SIZE];
....
}An exception can also occur when handling references using dynamic_cast<Type>. If type cast is impossible, a 'bad_cast' exception will be raised, for example:
BOOL WINAPI DllMain(HINSTANCE hinstDLL, DWORD fdwReason, LPVOID lpvReserved)
{
....
UserType &type = dynamic_cast<UserType&>(baseType);
....
}To fix errors like that, rewrite the code so that 'new' or 'dynamic_cast' are wrapped in a try...catch block.
The analyzer also detects calls to functions that could potentially throw an exception in 'DllMain', for example:
BOOL WINAPI DllMain(HINSTANCE hinstDLL, DWORD fdwReason, LPVOID lpvReserved)
{
....
potentiallyThrows();
....
}If no operations capable of throwing an exception are found in the callee's code, the analyzer will not report this call.
Similarly, calls to functions that could throw an exception should be wrapped in a try...catch block.
This diagnostic is classified as:
V1046. Unsafe usage of the 'bool' and integer types together in the operation '&='.
The analyzer has detected a bitwise AND operation where the types 'bool' and integer are used together in an unsafe way. The problem is that the bitwise AND will return 'false' for even numbers since the least significant bit is always set to zero. On the other hand, casting the integer value to 'bool' explicitly will make this operation safe.
Consider the following synthetic example:
int foo(bool a)
{
return a ? 0 : 2;
}
....
bool var = ....;
var &= foo(false);No matter the initial value of the 'var' variable, it will have the value 'false' after evaluating the '&=' operation. Suppose the 'foo' function returns the value 2. In that case, the 'var & 2' operation will always return 0 as the only valid values of 'var' are 0 and 1.
This code can be fixed in the following way:
var &= foo(false) != 0;Another way to fix it is to modify the function's return statement:
int foo(bool a)
{
return a ? 0 : 1;
}If you have the function return only values within the range [0;1], the code will work correctly because we will be able to cast that value to 'bool' without losing it.
The following example is taken from a real project:
template<class FuncIterator>
bool SetFunctionList( FuncIterator begin, FuncIterator end) {
bool ret = true;
for (FuncIterator itr = begin; itr != end; ++itr) {
const ROOT::Math::IMultiGenFunction *f = *itr;
ret &= AddFunction(*f);
}
return ret;
}
int AddFunction(const ROOT::Math::IMultiGenFunction & func) {
ROOT::Math::IMultiGenFunction *f = func.Clone();
if (!f) return 0;
fFunctions.push_back(f);
return fFunctions.size();
}The 'SetFunctionList' function checks the validity of the iterators passed to it as arguments and return 'false' if at least one of them is invalid or 'true' otherwise. But the programmer made a mistake when writing the '&=' operation. The right operand is a function that returns an integer value within the range from 0 up to SIZE_MAX. Each time 'AddFunction' returns an even number, the 'ret' variable will be set to zero, even though it was meant to do so only in case of invalid iterators.
The 'SetFunctionList' function can be fixed by explicitly casting the 'AddFunction' function's return result to 'bool' first:
template<class FuncIterator>
bool SetFunctionList( FuncIterator begin, FuncIterator end) {
bool ret = true;
for (FuncIterator itr = begin; itr != end; ++itr) {
const ROOT::Math::IMultiGenFunction *f = *itr;
ret &= (bool)AddFunction(*f);
}
return ret;
}This diagnostic is classified as:
|
You can look at examples of errors detected by the V1046 diagnostic. |
V1047. Lifetime of the lambda is greater than lifetime of the local variable captured by reference.
The analyzer has detected a suspicious variable capture in a lambda function.
The warning is issued in the following situations:
Example 1:
function lambda;
{
auto obj = dummy<int>{ 42 };
lambda = [&obj]() { .... };
}The variable, which will be destroyed when execution leaves the block, is captured by reference. The lifetime of the lambda function is greater than that of the object. Consequently, calling the lambda function will lead to using the reference to the already destroyed object.
The object should apparently be captured by value:
function lambda;
{
auto obj = dummy<int>{ 42 };
lambda = [obj]() { .... };
}Example 2:
function lambda;
{
auto obj1 = dummy<int>{ 42 };
auto obj2 = dummy<int>{ 42 };
lambda = [&]() { .... };
}In this example, the diagnostic finds that both variables are captured by reference and generates the warning twice – one warning per variable.
Another scenario is when a function returns a lambda that has captured a local variable by reference.
Example 3:
auto obj = dummy<int>{ 42 };
return [&obj]() { .... };In this case, the caller will get a lambda a call to which will result in using an invalid reference.
This diagnostic is classified as:
|
V1048. Variable 'foo' was assigned the same value.
The analyzer has detected a case where a variable is assigned the value already stored in it. Such an assignment is very likely to be a logic error.
Consider the following example:
int i = foo();
if (i == 0)
{
i = 0; // <=
}The reported assignment does not change the value of the variable, and the code is apparently faulty.
The analyzer can also detect cases where exact values of variables are unknown:
void foo(int x, int y)
{
if (x == y)
{
x = y; // <=
}
}Even though the variables 'x' and 'y' can take any values, the assignment is still meaningless because of the earlier condition checking these variables for equality.
This diagnostic is classified as:
You can look at examples of errors detected by the V1048 diagnostic. |
V1049. The 'foo' include guard is already defined in the 'bar1.h' header. The 'bar2.h' header will be excluded from compilation.
The analyzer has found that the same include guard is declared in different header files included into one translation unit. As a result, the contents of only one file – the one included first – will be added to the resulting file.
This diagnostic rule applies to projects written in C.
The following example uses a header file called header1.h:
// header1.h
#ifndef _HEADER_H_
#define _HEADER_H_
....
#endifAnd a header file called header2.h:
// header2.h
#ifndef _HEADER_H_
#define _HEADER_H_ // <=
....
#endifThe second header file was created by copying the contents of the first one, with the name of the '_HEADER_H_' macro left unchanged.
As a consequence, when compiling the following snippet, the code from header2.h will not be included into the resulting file:
....
#include "header1.h"
#include "header2.h"
...This might not seem a problem because you would normally expect compilation errors to occur. In reality, however, the file can still compile without errors.
The C language allows you to call functions without declaring them. It is implied that the arguments and the return value of such functions are of type 'int'. If the header file containing function declarations was not included at compilation, the project may still build successfully, but the program will not be working correctly when executed. One such example is described in the article "A nice 64-bit error in C".
To avoid the bug, the include guards used in header files must have unique names.
Also see a related diagnostic: V1031. Function is not declared. The passing of data to or from this function may be affected.
V1050. Uninitialized class member is used when initializing the base class.
The analyzer has found that the base class constructor is called in the initializer list using uninitialized fields of a child class.
Consider the following example:
struct C : public Base
{
C(int i) : m_i(i), Base(m_i) {};
....
int m_i;
};The standard specifies that base classes are initialized first in the same order that they are declared. At the moment of calling the 'Base' constructor, the 'm_i' variable is not initialized yet. The code can be fixed as follows:
struct C : public Base
{
C(int i) : m_i(i), Base(i) {};
....
int m_i;
};The analyzer can also detect the use of uninitialized variables not only inside a class but also inside the base classes:
struct Base1
{
Base1(int i) : m_base1(i) { };
virtual ~Base1() = default;
....
int m_base1;
};
struct Base2
{
Base2(int i) : m_base2(i) { };
virtual ~Base2() = default;
....
int m_base2;
};
struct C : public Base1, public Base2
{
C(int i) : m_i(i), Base1(m_base2), Base2(i) {};
....
int m_i;
};If you need to initialize one base class with a field of another, make sure they are initialized in the right order:
struct C : public Base2, public Base1
{
C(int i) : m_i(i), Base1(m_base2), Base2(i) {};
....
int m_i;
};The V670 diagnostic is used to detect similar issues, but it focuses on bugs that have to do with the initialization order of fields of one class, when the variables are initialized in the same order that they are declared in the class.
This diagnostic is classified as:
|
V1051. It is possible that an assigned variable should be checked in the next condition. Consider checking for typos.
The analyzer has detected a situation where a variable is initialized or assigned a new value and is expected to be checked in the condition of a subsequent 'if' statement but another variable is checked instead.
This error is demonstrated by the following example:
int ret = syscall(....);
if (ret != -1) { .... }
....
int ret2 = syscall(....);
if (ret != -1) { .... } // <=Programmers often need to check the value returned by a function but use a wrong variable name in the condition of the 'if' statement. This mistake is typically made when you clone a code fragment but forget to modify the name of the variable in the condition. In the example above, the programmer forgot to change the name 'ret' to 'ret2'.
Fixed version:
int ret2 = syscall(....);
if (ret2 != -1) { .... }The following example also demonstrates this mistake:
obj->field = ....;
if (field) ....;Both the variable and the class member have the same name, which makes it easy to confuse one with the other.
This diagnostic is heuristic; it splits the names of variables into individual strings and compares the respective parts to conclude if there is a typo. It also performs a basic type check, aiming at reducing the number of false positives.
The diagnostic may often be triggered by code like this:
var->m_abc = ....;
var->m_cba = ....;
if (var->m_abc) // <=
{
....
}Fragments like this are usually correct. You can either suppress such warnings or swap the assignments so that the variable to be checked is assigned a value immediately before the 'if' statement:
var->m_cba = ....;
var->m_abc = ....;
if (var->m_abc)
{
....
}Keeping the assignment and the check close to each other also makes the code more readable.
This diagnostic is classified as:
You can look at examples of errors detected by the V1051 diagnostic. |
V1052. Declaring virtual methods in a class marked as 'final' is pointless.
The analyzer has detected a virtual method in a class marked as 'final'.
After refactoring or due to poor class design, you may have a class declared as 'final', while it still contains non-overridden virtual methods.
Such class structure has no practical use, so it is recommended that you check if the class' inheritance logic is intact. In addition, creating such a class results in having to store an extra pointer to the virtual method table and performance drop.
The following example class will trigger the warning:
struct Cl final // <= V1052
{
virtual ~Cl() {}
};
struct BaseClass
{
virtual void foo(int);
};
struct DerivedClass final : BaseClass // <= V1052
{
virtual void bar(float);
};If the virtual method / destructor of the final class overrides the virtual method / destructor of the base class, no warning will be issued:
struct BaseClass
{
virtual void foo();
virtual ~BaseClass();
};
struct DerivedClass final : BaseClass // ok
{
virtual void foo() override;
virtual ~DerivedClass();
};V1053. Calling the 'foo' virtual function in the constructor/destructor may lead to unexpected result at runtime.
The analyzer has detected a call of a virtual function in a class constructor or destructor.
Consider the following example:
struct Base
{
Base()
{
foo();
}
virtual ~Base() = default;
virtual void foo() const;
};Calling the virtual method 'foo' in the constructor of the 'Base' class is in itself not necessarily a problem, but problems may arise in derived classes.
struct Child : Base
{
Child() = default;
virtual ~Child() = default;
virtual void foo() const override;
};When creating an object of type 'Child', the 'Base::foo()' method from the constructor of the base class will be called rather than the overridden method 'Child::foo()' of the derived class.
To fix the problem, we need to explicitly specify which method we want to call. This is what it will look like in the case of the 'Base' class:
struct Base
{
Base()
{
Base::foo();
}
virtual ~Base() = default;
virtual void foo() const;
};Now by simply looking at the code, you can tell which method exactly will be called.
Note that the usage of 'this' pointer at oneself when calling the virtual method doesn't solve the initial problem. When using 'this' it is still needed to specify what class the virtual function has to be called from:
struct Base
{
Base()
{
this->foo(); // bad
this->Base::foo(); // good
}
virtual ~Base() = default;
virtual void foo() const;
};This diagnostic is classified as:
|
You can look at examples of errors detected by the V1053 diagnostic. |
V1054. Object slicing. Derived class object was copied to the base class object.
The analyzer has detected a potential object slicing problem, where a derived class object is copied to a base class object.
If both the base and derived classes are polymorphic (i.e. contain virtual functions), such copying will result in losing information about the virtual functions overridden in the derived class. This may break the polymorphic behavior.
Another problem is that the object of the base class will lose information about the derived class's fields if the copy constructor was generated by the compiler in an implicit way (even if defined by the user).
Consider the following example:
struct Base
{
int m_i;
Base(int i) : m_i { i } { }
virtual int getN() { return m_i; }
};
struct Derived : public Base
{
int m_j;
Derived(int i, int j) : Base { m_i }, m_j { j } { }
virtual int getN() { return m_j; }
};
void foo(Base obj) { std::cout << obj.getN() << "\n"; }
void bar()
{
Derived d { 1, 2 };
foo(d);
}When passing the 'd' variable to 'foo', it will be copied to the base class object, and the 'getN' function will be called from the 'Base' class.
To avoid the slicing problem, use pointers/references:
void foo(Base &obj) { std::cout << obj.getN() << "\n"; }No copying will take place in this case, and 'getN' will be called from the 'Derived' class.
If you still want slicing, it is recommended that you define an explicit operation for that purpose to make it clear to anyone who will be reading your code in the future:
struct Base
{
....
};
struct Derived : public Base
{
....
Base copy_base();
....
};
void foo(Base obj);
void bar()
{
Derived d { .... };
foo(d.copy_base());
}The analyzer does not generate the warning if there are no virtual functions in the class hierarchy and all the non-static fields are located in the base class:
struct Base
{
int m_i;
int m_j;
Base(int i, int j) : m_i { i }, m_j { j } { }
int getI() { return m_i; }
int getJ() { return m_j; }
};
struct Derived : public Base
{
Derived(int i, int j) : Base(i, j) { }
virtual int getN() { return m_j; }
};This diagnostic is classified as:
|
V1055. The 'sizeof' expression returns the size of the container type, not the number of elements. Consider using the 'size()' function.
The analyzer has detected a variable of type "STL-like container" passed as an argument to the 'sizeof' operator.
Consider the following example:
#include <string>
void foo(const std::string &name)
{
auto len = sizeof(name) / sizeof(name[0]);
....
}The 'sizeof(name)' expression yields the size of the container type used for implementation rather than the total size of elements in bytes in that container (or simply the number of elements). For example, the typical 'std::string' implementation can contain 3 pointers (libc++ standard library, 64-bit system), i.e. 'sizeof(name) == 24'. However, the size of the real string stored in it is usually different.
Errors of this type can be caused by refactoring old code:
#define MAX_LEN(str) ( sizeof((str)) / sizeof((str)[0]) - 1 )
typedef char MyString[256];
void foo()
{
MyString str { .... };
....
size_t max_len = MAX_LEN(str);
}Changing the type of the 'MyString' alias from 'char[256]' to 'std::string' will cause the expression evaluating the maximum string length to return an incorrect result.
To get the real size of STL-like containers, use the public member function '.size()':
#include <string>
void foo(const std::string &name)
{
auto len = name.size();
}If it is indeed the size of the container implementation itself that you want to evaluate, a better decision would be to pass the type of the container as the operand of 'sizeof' – either directly or using the 'decltype' (C++11) operator for variables. This way, your intention will be clear to others. For example:
#include <string>
void foo(const std::string &str)
{
auto string_size_impl1 = sizeof(std::string);
auto string_size_impl2 = sizeof(decltype(str));
}The diagnostic also knows of the 'std::array' container and does not issue the warning on it when that container is used as the operand of 'sizeof':
template <typename T, size_t N>
void foo(const std::array<T, N> &arr)
{
auto size = sizeof(arr) / sizeof(arr[0]); // ok
}Starting with the C++17 standard, it is recommended that you use the free 'std::size()' function, which can handle both the built-in arrays and all types of containers that have the public member function '.size()':
#include <vector>
#include <string>
#include <set>
#include <list>
void foo()
{
int arr[256] { .... };
std::vector vec { .... };
std::string str { .... };
std::set set { .... };
std::list list { .... };
auto len1 = std::size(arr);
auto len2 = std::size(vec);
auto len3 = std::size(str);
auto len4 = std::size(set);
auto len5 = std::size(list);
}This diagnostic is classified as:
V1056. The predefined identifier '__func__' always contains the string 'operator()' inside function body of the overloaded 'operator()'.
The analyzer has detected the '__func__' identifier in the body of the overloaded '()' operator.
Consider the following example:
class C
{
void operator()(void)
{
std::cout << __func__ << std::endl;
}
};
void foo()
{
C c;
c();
}This code will output the string 'operator()'. This behavior may seem reasonable in code like this, so let's take a look at a less trivial example:
void foo()
{
auto lambda = [] () { return __func__; };
std::cout << lambda() << std::endl;
}It is important to remember that '__func__' is not a typical variable, so the following versions will not work as intended and the program will be still outputting the string 'operator()':
void fooRef()
{
auto lambda = [&] () { return __func__; };
std::cout << lambda() << std::endl;
}
void fooCopy()
{
auto lambda = [=] () { return __func__; };
std::cout << lambda() << std::endl;
}In the case of lambdas, this can be fixed by passing '__func__' explicitly using a capture list:
void foo()
{
auto lambda = [func = __func__] () { return func; };
std::cout << lambda() << std::endl;
}To get full-fledged output of the function name even inside the overloaded 'operator()' or lambdas, you can use the platform/compiler-specific macros. The MSVC compiler provides three such macros:
- '__FUNCTION__' – outputs the function name including its namespace. For example, this is what we will get for a lambda inside the main function: 'main::<lambda_....>::operator ()';
- '__FUNCSIG__' – outputs the full function signature. Similarly, it can be helpful when combined with a lambda: 'auto __cdecl main::<lambda_....>::operator ()(void) const';
- '__FUNCDNAME__' – outputs the decorated name of the function. This information is quite specific, so it cannot fully replace '__func__'.
Clang and GCC provide the following macros:
- '__FUNCTION__' – outputs the same name that the standard '__func__' does;
- '__PRETTY_FUNCTION__' – outputs the full function signature. For example, you will get the following output for a lambda: 'auto main()::(anonymous class)::operator()() const'.
V1057. Pseudo random sequence is the same at every program run. Consider assigning the seed to a value not known at compile-time.
The analyzer has detected suspicious code initializing the pseudorandom number generator to a constant value.
// C
srand(0);
// C++
std::mt19937 engine(1);When initialized in such a way, the generator will be producing a predictable sequence of numbers or the same number at every run.
To avoid this, assign the seed to some random number such as the current system time:
srand(time(0));However, this approach may lead to issues in multithreaded applications: 'time(0)' may return identical values in different threads. Also, keep in mind that the user could change the time settings.
Starting with C++11, the 'std::random_device' generator is available, which implements an interface to the true-random number generator:
std::random_device rd;
std::mt19937 engine(rd());However, if your system lacks such a generator, the regular pseudorandom number generator will be used.
This diagnostic is classified as:
|
V1058. Nonsensical comparison of two different functions' addresses.
The analyzer has detected a suspicious comparison of two functions' addresses.
Consider the following example:
namespace MyNamespace
{
int one() noexcept;
int two() noexcept;
}
using namespace MyNamespace;
void SomeFunction()
{
if (one != two)
{
// do something
}
....
}In this code, the comparison will be always returning 'true' because 'one' and 'two' are names of functions with compatible signatures declared in the 'MyNamespace' namespace. The programmer must have intended to compare their return values but forgot to add parentheses to the functions' names:
namespace MyNamespace
{
int one() noexcept;
int two() noexcept;
}
using namespace MyNamespace;
void SomeFunction()
{
if (one() != two())
{
// do something
}
}Code like that could also be a result of poorly done refactoring. If the function contained a comparison of two local variables, which were later removed from the code while the condition itself was left intact, it could well result in comparing functions of the same names.
Example of code before refactoring:
namespace MyNamespace
{
int one() noexcept;
int two() noexcept;
}
using namespace MyNamespace;
void SomeFunction(int one, int two)
{
if (one != two)
{
// do something
}
}This diagnostic is classified as:
|
V1059. Macro name overrides a keyword/reserved name. This may lead to undefined behavior.
The analyzer has detected a macro whose name overrides a keyword or reserved identifier.
Example:
#define sprintf std::printfBecause of the name collision here, calls to the standard function 'sprintf' will be replaced with calls to 'printf' after preprocessing. Such replacement will lead to incorrect work of the program.
This diagnostic also informs the developer when overridden macros get deleted.
Example:
#undef assertThe diagnostic ignores overridden keywords if their semantics is unchanged.
Examples:
#define inline __inline
#define inline __forceinline
#define template extern templateThis diagnostic is classified as:
|
V1060. Passing 'BSTR ' to the 'SysAllocString' function may lead to incorrect object creation.
The analyzer has detected the passing of a string of type 'BSTR' to the 'SysAllocString' function.
BSTR FirstBstr = ....;
BSTR SecondBstr = SysAllocString(FirstBstr);Copying a 'BSTR' string by passing it to the 'SysAllocString' function may result in a logic error.
BSTR (basic string or binary string) is a string data type that is used by COM, Automation, and Interop functions. BSTR is represented in the following way:
- Length prefix. A four-byte integer that contains the number of bytes in the following data string. It appears immediately before the first character of the data string and does not include the terminator.
- Data string. A string of Unicode characters. May contain multiple embedded null characters.
- Terminator. Two null characters.
A BSTR is a pointer that points to the first character of the string, not to the length prefix.
The 'SysAllocString' function handles 'BSTR' strings in the same way as it does regular wide C strings. It means that if the string contains multiple embedded null characters, 'SysAllocString' will return a truncated string. To avoid unexpected behavior, rewrite the code using wrapper classes over 'BSTR' such as 'CComBSTR' or '_bstr_t'.
For example, you can use the following pattern to correctly copy one 'BSTR' string to another:
CComBstr firstBstr(L"I am a happy BSTR.");
BSTR secoundBstr = firstBstr.Copy();This is another way to do it:
_bstr_t firstBstr(L"I am a happy BSTR too.");
BSTR secoundBstr = firstBstr.copy();V1061. Extending 'std' or 'posix' namespace may result in undefined behavior.
The analyzer has detected an extension of the 'std' or 'posix' namespace. Even though such a program compiles and runs successfully, modifying namespaces' data may result in undefined behavior if the standard does not state otherwise.
The contents of the 'std' namespace is defined solely by the standardization committee, and the standard prohibits adding the following to it:
- variable declarations;
- function declarations;
- class/structure/union declarations;
- enumeration declarations;
- function/class/variable template declarations (C++14);
The standard does allow adding the following specializations of templates defined in the 'std' namespace given that they depend on at least one program-defined type:
- full or partial specialization of a class template;
- full specialization of a function template (up to C++20);
- full or partial specialization of a variable template not located in the '<type_traits>' header (up to C++20);
However, specializations of templates located inside classes or class templates are prohibited.
The most common scenarios when the user extends the 'std' namespace are adding an overload of the 'std::swap' function and adding a full/partial specialization of the 'std::hash' class template.
The following example illustrates adding an overload of the 'std::swap' function:
template <typename T>
class MyTemplateClass
{
....
};
class MyClass
{
....
};
namespace std
{
template <typename T>
void swap(MyTemplateClass<T> &a, MyTemplateClass<T> &b) noexcept // UB
{
....
}
template <>
void swap(MyClass &a, MyClass &b) noexcept // UB since C++20
{
....
};
}The first function template is not a specialization of 'std::swap', so a declaration like that will lead to undefined behavior. The second function template is a specialization, and the program's behavior is defined up to the C++20 standard. However, there is another way: we could move both functions out of the 'std' namespace and place them to the one where classes are defined:
template <typename T>
class MyTemplateClass
{
....
};
class MyClass
{
....
};
template <typename T>
void swap(MyTemplateClass<T> &a, MyTemplateClass<T> &b) noexcept
{
....
}
void swap(MyClass &a, MyClass &b) noexcept
{
....
};Now, when you need to write a function template that uses the swap function on two objects of type T, you can write the following:
template <typename T>
void MyFunction(T& obj1, T& obj2)
{
using std::swap; // make std::swap visible for overload resolution
....
swap(obj1, obj2); // best match of 'swap' for objects of type T
....
}Now the compiler will select the required overload based on argument-dependent lookup (ADL): the user-defined 'swap' functions for the 'MyClass' class and for the 'MyTemplateClass' class template, and the standard 'std::swap' function for all other types.
The next example demonstrates adding a specialization of the class template 'std::hash':
namespace Foo
{
class Bar
{
....
};
}
namespace std
{
template <>
struct hash<Foo::Bar>
{
size_t operator()(const Foo::Bar &) const noexcept;
};
}From the standard's point of view, this code is valid, and so the analyzer does not issue the warning here. But starting with C++11, there is also another way to do this, namely by writing the class template specialization outside the 'std' namespace:
template <>
struct std::hash<Foo::Bar>
{
size_t operator()(const Foo::Bar &) const noexcept;
};Unlike the 'std' namespace, the C++ standard prohibits any modification of the 'posix' namespace at all:
namespace posix
{
int x; // UB
}More detail here:
- C++17 (working draft N4659), 20.5.4.2.1
- C++20 (working draft N4860), 16.5.4.2.1
This diagnostic is classified as:
|
You can look at examples of errors detected by the V1061 diagnostic. |
V1062. Class defines a custom new or delete operator. The opposite operator must also be defined.
This diagnostic rule is based on the R.15 CppCoreGuidelines rule.
A class defines a custom 'new' or 'delete' operator but does not define the opposite operator.
Example:
class SomeClass
{
....
void* operator new(size_t s);
....
};Objects of this class will be dynamically allocated using the overloaded 'new' operator and deleted using the default 'delete' operator.
For symmetry of allocation/deallocation operations, define the 'delete' operator as well:
class SomeClass
{
....
void* operator new(size_t s);
void operator delete(void*);
....
};You can also mark operators as deleted ('= delete') if for some reason you need to prevent allocation or deallocation of objects of this class. Try to prevent both allocation and deallocation at the same time, so that calling either of these operators would cause a compile-time error rather than a hard-to-see bug:
#include <cstddef>
class AutoTransaction
{
public:
/// Mark 'operator new' as deleted to prevent heap allocation
void* operator new (std::size_t) = delete;
};
void foo()
{
auto ptr = new AutoTransaction; // code doesn't compile
}
void bar()
{
AutoTransaction obj;
delete &obj; // code compiles, but contains an error
}If you prevent the deallocation in the same way, the compiler will not let the error occur:
class SomeClass
{
....
void* operator new(size_t s) = delete;
void operator delete(void*) = delete;
....
};
void foo()
{
auto ptr = new AutoTransaction; // code doesn't compile
}
void bar()
{
AutoTransaction obj;
delete &obj; // code doesn't compile
}You can look at examples of errors detected by the V1062 diagnostic. |
V1063. The modulo by 1 operation is meaningless. The result will always be zero.
The analyzer has detected a strange expression with a modulo by 1 operation. Such an expression will always evaluate to 0.
A common pattern of this error is checking if no remainder is left after dividing a value by another value. To do this, you use the modulo operation and compare the result with 0 or 1. Making a typo at this point is easy because since you anticipate the value 1, you may accidentally divide by 1 too. For example:
if (x % 1 == 1)
{
....
}A modulo by 1 operation was applied to the 'x' variable, which will result in the 'x % 1' expression always evaluating to 0 no matter the value of 'x'. Therefore, the condition will always be false. The programmer must have intended to use the modulo by '2' operation:
if (x % 2 == 1)
{
....
}The following example is taken from a real application (stickies):
void init (....)
{
srand(GetTickCount() + rand());
updateFreq1 = (rand() % 1) + 1;
updateFreq2 = (rand() % 1) + 1;
updateFreq3 = (rand() % 1) + 1;
updateFreq4 = (rand() % 1) + 1;
waveFreq1 = (rand() % 15);
waveFreq2 = (rand() % 3);
waveFreq3 = (rand() % 16);
waveFreq4 = (rand() % 4);
// ....
}The variables 'updateFreq1', 'updateFreq2', 'updateFreq3', and 'updateFreq4' will always be initialized to the value 1. Each of these variables was probably meant to be initialized to some pseudorandom value, which most likely falls within the range [1..2]. In that case, the correct version should look like this:
updateFreq1 = (rand() % 2) + 1;
updateFreq2 = (rand() % 2) + 1;
updateFreq3 = (rand() % 2) + 1;
updateFreq4 = (rand() % 2) + 1;This diagnostic is classified as:
You can look at examples of errors detected by the V1063 diagnostic. |
V1064. The left operand of integer division is less than the right one. The result will always be zero.
The analyzer has detected a suspicious expression that contains an integer division operation, with the left operand always being less than the right operand. Such an expression will always evaluate to zero.
Consider the following example:
if ( nTotal > 30 && pBadSource->m_nNegativeVotes / nTotal > 2/3 )
{
....
}Since both literals '2' and '3' are of integer type, the quotient will also be integer and, therefore, zero. It means the expression above is equivalent to the following one:
if ( nTotal > 30 && pBadSource->m_nNegativeVotes / nTotal > 0 )
{
....
}A correct way to fix this error is to explicitly cast one of the operands to a floating-point type, for example:
if ( nTotal > 30 && pBadSource->m_nNegativeVotes / nTotal >
static_cast<float>(2)/3 )
{
....
}Or:
if ( nTotal > 30 && pBadSource->m_nNegativeVotes / nTotal > 2.0f/3 )
{
....
}The analyzer also issues a warning, if it detects a suspicious expression that contains the modulo operation, with the dividend always being less than the divisor. Such an expression will always evaluate to the dividend value.
Let's take a look at the following example:
void foo()
{
unsigned int r = 12;
const unsigned int r3a = (16 + 5 - r) % 16;
}Here the expression '16+5-r' evaluates to 9. This value is less than the divisor '16'. Therefore, the modulo operation, in this case, does not make sense. The result will be 9.
Consider a more complex example:
int get_a(bool cond)
{
return cond ? 3 : 5;
}
int get_b(bool cond)
{
return cond ? 7 : 9;
}
int calc(bool cond1, bool cond2)
{
return get_a(cond1) % get_b(cond2);
}The 'calc' function contains the modulo operation. The dividend receives the values 3 or 5. The divisor receives the values 7 or 9. Thus, there are four variants to evaluate the modulo operation: '3 % 7', '5 % 7', '3 % 9', '5 % 9'. In each variant, the dividend is less than the divisor. So, the operation is meaningless.
If the analyzer has issued a warning on your code, we recommend checking this code fragment for logical errors. Perhaps one of the operands of the modulo operation occurs in an unexpected way. Or perhaps another operation must be used instead of the modulo operation.
This diagnostic is classified as:
You can look at examples of errors detected by the V1064 diagnostic. |
V1065. Expression can be simplified: check similar operands.
The analyzer has detected a suspicious expression that can be simplified by removing identical operands. Such expressions may indicate the presence of a logic error or typo.
Consider a simple contrived example:
void Foo(int A, int B, int C)
{
if (A - A + 1 < C)
Go(A, B);
}A typo makes this expression redundant and, therefore, reducible to '1 < C'. But in reality, the expression was meant to look, for example, like this:
void Foo(int A, int B, int C)
{
if (A - B + 1 < C)
Go(A, B);
}In other cases, such redundant expressions are technically correct, but the code will still benefit from simplifying them as it will help make them more concise. For example:
if ((rec.winDim.left + (rec.winDim.right - rec.winDim.left)) < inset) // <=
{
rec.winDim.left = -((rec.winDim.right – rec.winDim.left) - inset);
rec.winDim.right = inset;
}
if ((rec.winDim.top + (rec.winDim.bottom – rec.winDim.top)) < inset) // <=
{
rec.winDim.top = -((rec.winDim.bottom – rec.winDim.top) - inset);
rec.winDim.bottom = inset;
}In both conditions, the expressions can be simplified by removing, respectively, the operands 'rec.winDim.left' and 'rec.winDim.top'. Simplified version:
if (rec.winDim.right < inset)
{
rec.winDim.left = -((rec.winDim.right – rec.winDim.left) - inset);
rec.winDim.right = inset;
}
if (rec.winDim.bottom < inset)
{
rec.winDim.top = -((rec.winDim.bottom – rec.winDim.top) - inset);
rec.winDim.bottom = inset;
}Note. In certain cases, redundancy improves readability rather than hinders it. For example, it may help make mathematical formulas clearer. In such cases, suppressing false positives using one of the provided mechanisms is preferable to simplifying the expression.
This diagnostic is classified as:
You can look at examples of errors detected by the V1065 diagnostic. |
V1066. The 'SysFreeString' function should be called only for objects of the 'BSTR' type.
The analyzer has detected a call of the 'SysFreeString' function on an object whose type is different from 'BSTR'.
The 'SysFreeString' function is supposed to work only with the type 'BSTR'. Breaking this rule may lead to memory deallocation issues.
Consider a simple synthetic example:
#include <atlbase.h>
void foo()
{
CComBSTR str { L"I'll be killed twice" };
// ....
SysFreeString(str); //+V1066
}An object of type 'CComBSTR' is passed to the 'SysFreeString' function. This class is a wrapper over the 'BSTR' type and has an overloaded implicit-conversion operator 'operator BSTR()' that returns a pointer to the wrapped BSTR string. Because of that, the code above will compile correctly.
However, this code is incorrect. After the 'SysFreeString' function has freed the resource owned by the 'str' object, the object will go out of scope and its destructor will be invoked. The destructor will re-release the already freed resource, thus causing undefined behavior.
Such behavior sometimes occurs even when an object of the 'BSTR' type itself is passed to the 'SysFreeString' function. For example, PVS-Studio will report the following code:
#include <atlbase.h>
void foo()
{
CComBSTR str = { L"a string" };
BSTR bstr = str;
str.Empty();
SysFreeString(bstr); //+V1066
}Since 'CComBSTR::operator BSTR()' returns a pointer to its own field, both objects will be owning the same resource after the 'BSTR bstr = str;' assignment. The 'str.Empty();' call will free this resource, and the subsequent call 'SysFreeString(bstr)' will attempt to free it once again.
One of the ways to avoid shared ownership is to create a copy or to use the 'CComBSTR::Detach()' method. For example, the analyzer will not report the following code:
#include <atlbase.h>
void foo()
{
CComBSTR ccombstr = { L"I am a happy CComBSTR" };
BSTR bstr1 = ccombstr.Copy();
SysFreeString(bstr1); // OK
BSTR bstr2;
ccombstr.CopyTo(&bstr2);
SysFreeString(bstr2); // OK
BSTR bstr3 = ccombstr.Detach();
SysFreeString(bstr3); // OK
}This diagnostic is classified as:
|
V1067. Throwing from exception constructor may lead to unexpected behavior.
The analyzer has detected an exception constructor that may throw another exception. Using such a class may cause the program to behave unexpectedly when handling exceptions.
Consider the following synthetic example:
#include <stdexcept>
class divide_by_zero_error : public std::invalid_argument
{
public:
divide_by_zero_error() : std::invalid_argument("divide_by_zero")
{
....
if (....)
{
throw std::runtime_error("oops!"); // <=
}
}
};
void example(int a, int b)
{
try
{
if (b == 0)
throw divide_by_zero_error ();
....
}
catch (const divide_by_zero_error &e)
{
....
}
// my_exception thrown and unhandled
}In the code of the 'example' function, the programmer intends the raised 'divide_by_zero_error' exception to be handled, but instead of it, an 'std::runtime_error' exception will be thrown, which will not be caught by the subsequent 'catch' block. As a result, the exception will leave the 'example' function, thus causing one of the following situations:
- the exception will be handled by another exception handler higher on the call stack, which may also be an undesired behavior;
- there could be no appropriate exception handler higher on the call stack, in which case the program will crash by calling the 'std::terminate' function as soon as the exception leaves the 'main' function.
Write and use custom exception classes with particular care because their constructors may throw exceptions at unexpected points – for example, when calling other functions. In the following example, when creating a logging exception, a second exception may be thrown by the 'Log' function:
#include <ios>
static void Log(const std::string& message)
{
....
// std::ios_base::failure may be thrown by stream operations
throw std::ios_base::failure("log file failure");
}
class my_logging_exception : public std::exception
{
public:
explicit my_logging_exception(const std::string& message)
{
Log(message); // <=
}
};This diagnostic is classified as:
V1068. Do not define an unnamed namespace in a header file.
The analyzer detected an anonymous namespace declared in the header file. Such a header file creates copies of symbols with internal linkage in each translation unit that includes this header file. This leads to object files bloat, which may be unwanted behavior.
Consider a simple example of a header file with an anonymous namespace:
// utils.hpp
#pragma once
#include <iostream>
namespace
{
int global_variable;
void set_global_variable(int v)
{
std::cout << global_variable << std::endl;
global_variable = v;
}
}When the 'utils.hpp' header file is included, each translation unit will receive its own instance of the 'global_variable' variable. The variable will not relate to other instances and will not be accessible from other translation units. Several redundant 'set_global_variable' functions will also be generated. Before the C++17 standard, such code could occur in header-only libraries in order not to violate the One Definition Rule when including header files in multiple translation units. Also, such code may appear due to careless refactoring, for example, when moving an anonymous namespace from a compiled file to a header file.
it is worth mentioning that this rule also applies to unnamed namespaces nested in other namespaces:
namespace my_namespace
{
int variable1; // namespace-scope non-const variable
// 'variable1' has external linkage
namespace // <=
{
int variable2; // unnamed namespace applies 'static'
// 'variable2' has internal linkage
}
}If you need to create exactly one instance of a symbol for the header-only library, you can use the 'inline' specifier. Starting with C++17, it applies to variables as well:
// utils.hpp
#pragma once
#include <iostream>
inline int global_variable; // ok since C++17
inline void set_global_variable(int v)
{
std::cout << global_variable << std::endl;
global_variable = v;
}If an earlier version of the standard is used, but the library is not header-only, then you can declare the symbols as 'extern' in the header file and define them in one of the translation units:
// utils.hpp
#pragma once
extern int global_variable;
void set_global_variable(int v); // functions implicitly
// have external linkage ('extern')// utils.cpp
#include "utils.hpp"
#include <iostream>
int global_variable;
void set_global_variable(int v)
{
std::cout << global_variable << std::endl;
global_variable = v;
}In the case when an older version of the standard is used, but the library must be header-only, the warning can be suppressed with a comment:
// utils.hpp
#pragma once
#include <iostream>
namespace //-V1068
{
int global_variable;
void set_global_variable(int v)
{
std::cout << global_variable << std::endl;
global_variable = v;
}
}This diagnostic is classified as:
|
You can look at examples of errors detected by the V1068 diagnostic. |
V1069. Do not concatenate string literals with different prefixes.
The analyzer found a code fragment where two concatenated strings have different encoding prefixes.
Take a look at this example:
// Until C99/C++11
L"Hello, this is my special "
"string literal with interesting behavior";Prior to the C11/C++11 standards, C and C++ provided only two kinds of string literals:
- a "narrow" string literal - " s-char-sequence "
- a "wide" string literal - L" s-char-sequence "
In languages prior to C99 or C++11, concatenating string literals with different prefixes leads to undefined behavior. This triggers the analyzer to issue a first-level warning. Below is the correct code:
// Until C99/C++11
L"Hello, this is my special "
L"string literal with defined behavior";Starting with C99 and C++11 this behavior is defined. If one of string literals has a prefix, and the second one does not, the resulting string literal has the first string's prefix. In this case the analyzer issues no warnings:
// Since C99/C++11
L"Hello, this is my special "
"string literal with "
"defined behavior";C11/C++11 and newer language versions provide three more prefixed string literals:
- UTF-8 string literal - u8" s-char-sequence "
- 16-bit wide string literal - u" s-char-sequence "
- 32-bit wide string literal - U" s-char-sequence "
Concatenating UTF-8 and any "wide" string literal leads to a compile-time error. In this case the analyzer does not issue a warning.
L"Hello, this is my special "
u8"string literal that won't compile"; // compile-time errorAny other combinations of prefixed string literals lead to undefined behavior. In these cases, the analyzer issues second-level warnings:
// Until C11/C++11
L"Hello, this is my special "
u"string literal with implementation-defined behavior";
L"Hello, this is my special "
U"string literal with implementation-defined behavior";
u"Hello, this is my special "
U"string literal with implementation-defined behavior";When one "narrow" string literal is concatenated with two or more prefixed string literals, the analyzer issues third-level warnings:
template <typename T>
void foo(T &&val) { .... }
....
void bar()
{
foo("This" L"is" "strange");
foo(L"This" "is" L"strange");
}Though in modern standards this behavior is defined, such code cultivates errors and we recommend refactoring.
V1070. Signed value is converted to an unsigned one with subsequent expansion to a larger type in ternary operator.
This diagnostic rule applies to ternary operators whose second and third operands are integer types with different type modifiers - signed and unsigned. The warning is triggered when the ternary operator's result is saved as a larger unsigned type. If such conversion takes place, negative values become positive.
Take a look at the example below:
long long foo(signed int a, unsigned int b, bool c)
{
return c ? a : b;
}The compiler will process the code above according to C++ conversion rules. The ternary operator's second and third operands contain different types and the unsigned operand's size is no less than the signed one's - this is why the compiler will convert them to an unsigned type.
Thus, a signed variable with a negative value (for example, -1) will be cast to an unsigned type. In case of the 32-bit 'int' type, the resulting value is '0xFFFFFFFF'. Then this result will be converted to a larger integer type (the 64-bit 'long long' type). However, by then, the value will have lost its negative sign and will remain a positive number.
The problem also arises in cases when a ternary operator's result is converted to a larger-sized unsigned type:
unsigned long long f(signed int i, unsigned int ui, bool b)
{
return b ? i : ui;
}If the 'i' variable has a negative value (for example, -1), the ternary operator's result is '0xFFFFFFFF'. Then it will be cast to a larger unsigned type and the value will be '0x00000000FFFFFFFF'. Most likely, the developer expected to see '0xFFFFFFFFFFFFFFFF' as the result.
This diagnostic is classified as:
|
V1071. Return value is not always used. Consider inspecting the 'foo' function.
The analyzer found that the return value of a function is ignored. In most cases, the result of the function is used in some way.
The diagnostic is designed to help in cases where a function or its return type is not marked with the standard attribute '[[nodiscard]]' (C23/C++17) or its analogs. If in most cases the result of the function was used in some way, and in certain situations, it is ignored, then this may indicate a possible error.
Consider a synthetic example:
int foo();
....
auto res = foo();
....
if (foo() == 42) { .... }
....
while (foo() != 42) { .... }
....
return foo();
....
foo();
....Here, the result of the 'foo' function is used in four different ways, and then it is ignored in one. If the result is not used in less than 10% of the total number of calls, the analyzer will issue a warning.
In some situations, this code may have been written intentionally. For example, if the function contains some side effects - operations with a stream, reading/writing 'volatile' variables, etc., and the result can be ignored.
To help a programmer to understand that this behavior was intended, it is recommended to explicitly ignore the return value by casting it to the 'void' type:
....
(void) foo(); // or static_cast<void>(foo());
....The analyzer does not issue warnings for the following cases:
- constructors;
- overloaded operators.
V1072. Buffer needs to be securely cleared on all execution paths.
The analyzer detected a potential error. A buffer containing secure information will not be cleared.
Consider a synthetic example:
int f()
{
char password[size];
if (!use1(password))
return -1;
use2(password);
memset_s(password, sizeof(password), 0, sizeof(password));
return 0;
}This situation is similar to a memory leak. Despite the fact that the buffer is cleared using the safe function 'memset_s', if the function exits under the condition, the data will remain in memory.
To avoid the error, the buffer should be cleared on all execution paths.
A fixed example:
int f()
{
char password[size];
if (use1(password))
{
use2(password);
memset_s(password, sizeof(password), 0, sizeof(password));
return 0;
}
return -1;
}A similar situation will occur if a function throws an exception before the buffer is cleared.
Example:
int f()
{
char password[size];
if (!use1(password))
throw Exception{};
RtlSecureZeroMemory(password, size);
return 0;
}A possible fixed version:
int f()
{
char password[size];
if (use1(password))
{
RtlSecureZeroMemory(password, size);
return 0;
}
throw Exception{};
}This diagnostic is classified as:
|
V1073. Check the following code block after the 'if' statement. Consider checking for typos.
The analyzer found a possible error related to the fact that the code block ('{ .... }'), coming after the 'if' statement, does not apply to it.
Consider the first synthetic example:
if (a == 1) nop(); // <=
{
nop2();
}At first glance, it may seem that the block will be executed if the condition is true, but in fact, it is not. The block will always be executed, regardless of the condition. This may mislead the programmer.
Let's consider some other code examples that will trigger the analyzer:
if (a == 2) nop(); else nop2(); // <=
{
nop3();
}
if (a == 3) nop();
else nop2(); // <=
{
nop3();
}It is worth noting that such a pattern itself may not be an error, it may appear in the code. Therefore, the analyzer filters cases when the 'if' statement is written in a single line, and one of the following statements is executed in its body: 'return', 'throw', 'goto'. For example:
if (a == 4) return; // ok
{
nop();
}
if (a == 5) throw; // ok
{
nop();
}
....
label:
....
if (a == 6) goto label; // ok
{
nop();
}Also, the analyzer will not issue a warning if the lines with the 'if' statement and the code block that is not associated with it are not contiguous:
if (a == 7) nop();
// this is a block for initializing MyClass fields
{
....
}If you get such a warning, and it is false, you can tell the analyzer about it by adding an empty line between the 'if' and the block.
Also, the diagnostic will not issue a warning when the 'if' body contains an empty statement (';'). The diagnostic rule V529 is responsible for this.
This diagnostic is classified as:
V1074. Boundary between numeric escape sequence and string is unclear. The escape sequence ends with a letter and the next character is also a letter. Check for typos.
The analyzer has detected a suspicious situation inside a string or character literal. Here, the escape sequence with a letter at the end is not separated from the next printed letter. Such entry can lead to confusion. Perhaps, it's a typo and the literal is written incorrectly.
Look at the example:
const char *str = "start\x0end";The null terminal, assumedly, separates the characters inside the string. However, in fact, the character with the '0xE' code follows 'start'. The 'nd' characters follow '0xE'.
To fix the problem, you can:
- divide the string literal into several parts;
- end a numeric escape sequence with another escape sequence.
For example, you can rewrite the code above like this:
const char *str = "start\x0" "end";You can separate escape sequence from other parts of the string:
const char *str = "start" "\x0" "end";Or limit it to another special character, like tab:
const char *str = "start\x0\tend";V1075. The function expects the file to be opened in one mode, but it was opened in different mode.
The analyzer detected a situation: a file was opened in one mode, but the called function expects it to be in the other.
For example, a file was opened in write-only mode, but it is used for reading:
bool read_file(void *ptr, size_t len)
{
FILE *file = fopen("file.txt", "wb"); // <=
if (file != NULL)
{
bool ok = fread(ptr, len, 1, file) == 1;
fclose(file);
return ok;
}
return false;
}Most likely it's a typo. Use the correct mode to fix it:
bool read_file(void *ptr, size_t len)
{
FILE *file = fopen("file.txt", "rb"); // <=
if (file != NULL)
{
bool ok = fread(ptr, len, 1, file) == 1;
fclose(file);
return ok;
}
return false;
}There also may be a situation when the fprintf function writes data into a closed file:
void do_something_with_file(FILE* file)
{
// ....
fclose(file);
}
void foo(void)
{
FILE *file = fopen("file.txt", "w");
if (file != NULL)
{
do_something_with_file(file);
fprintf(file, "writing additional data\n");
}
}You should check the correctness of such use of resources in the program and fix the problem.
You can look at examples of errors detected by the V1075 diagnostic. |
V1076. Code contains invisible characters that may alter its logic. Consider enabling the display of invisible characters in the code editor.
The analyzer has detected characters in code that may confuse the developer. These characters may be invisible and change the code representation in IDEs. Such character sequences may lead to the fact that the developer and the compiler would interpret the code differently.
This can be done on purpose. This type of attack is called Trojan Source. To learn more:
- Trojan Source attack for introducing invisible vulnerabilities;
- Trojan Source: Invisible Vulnerabilities.
The analyzer issues a warning if it finds one of the following characters:
|
Character |
Code |
Definition |
Description |
|---|---|---|---|
|
LRE |
U+202A |
LEFT-TO-RIGHT EMBEDDING |
The text after the LRE character is interpreted as inserted and displayed left-to-right. The action of LRE is interrupted by the PDF character or a newline character. |
|
RLE |
U+202B |
RIGHT-TO-LEFT EMBEDDING |
The text after the RLE character is interpreted as inserted and displayed right-to-left. The action of the RLE character is interrupted by the PDF character or a newline character. |
|
LRO |
U+202D |
LEFT-TO-RIGHT OVERRIDE |
The text after the LRO character is forcibly displayed left-to-right. The action of the LRO character is interrupted by the PDF character or a newline character. |
|
RLO |
U+202E |
RIGHT-TO-LEFT OVERRIDE |
The text after the RLO character is forcibly displayed right-to-left. The action of the RLO character is interrupted by the PDF character or a newline character. |
|
|
U+202C |
POP DIRECTIONAL FORMATTING |
The PDF character interrupts the action of one of the LRE, RLE, LRO or RLO characters encountered earlier. Interrupts exactly one last character encountered. |
|
LRI |
U+2066 |
LEFT‑TO‑RIGHT ISOLATE |
The text after the LRI symbol is displayed left-to-right and interpreted as isolated. This means that other control characters do not affect the display of this text fragment. The action of the LRI character is interrupted by the PDI character or a newline character. |
|
RLI |
U+2067 |
RIGHT‑TO‑LEFT ISOLATE |
The text after the RLI symbol is displayed right-to-left and interpreted as isolated. This means that other control characters do not affect the display of this text fragment. The RLI action is interrupted by the PDI symbol or the newline symbol. |
|
FSI |
U+2068 |
FIRST STRONG ISOLATE |
The direction of the text after the FSI character is set by the first control character not included in this text fragment. Other control characters do not affect the display of this text. The action of the FSI character is interrupted by the PDI character or a newline character. |
|
PDI |
U+2069 |
POP DIRECTIONAL ISOLATE |
The PDI symbol interrupts the action of one of the LRI, RLI or FSI symbols encountered earlier. Interrupts exactly one last character encountered. |
|
LRM |
U+200E |
LEFT-TO-RIGHT MARK |
The text after the LRM character is displayed left-to-right. The LRM action is interrupted by a newline character. |
|
RLM |
U+200F |
RIGHT-TO-LEFT MARK |
The text after the RLM character is displayed right-to-left. The RLM action is interrupted by a newline character. |
|
ALM |
U+061C |
ARABIC LETTER MARK |
The text after the ALM character is displayed right-to-left. The ALM action is interrupted by a newline character. |
|
ZWSP |
U+200B |
ZERO WIDTH SPACE |
An invisible space character. The use of ZWSP character causes different strings to be displayed the same way. For example, 'str[ZWSP]ing' is displayed as 'string'. |
Look at the following code fragment:
#include <iostream>
int main()
{
bool isAdmin = false;
/*[RLO] } [LRI] if (isAdmin)[PDI] [LRI] begin admins only */ // (1)
std::cout << "You are an admin.\n";
/* end admins only [RLO]{ [LRI]*/ // (2)
return 0;
}Let's look closer at line (1).
[LRI] if (isAdmin)[PDI]Here the [LRI] character has effect up to the [PDI] character. The 'if (isAdmin)' string is displayed left-to-right and is isolated. We get 'if (isAdmin)'.
[LRI] begin admins only */Here the [LRI] character has effect up to the end of the string. We get an isolated string: 'begin admins only */'
[RLO] {space1}, '}', {space2}, 'if (isAdmin)', 'begin admins only */'Here the [RLO] character has effect up to the end of the string and displays the text right-to-left. Each of the isolated strings obtained in the previous paragraphs is treated as a separate indivisible character. We get the following sequence:
'begin admins only */', 'if (isAdmin)', {space2}, '{', {space1}Note that the closing brace character is now displayed as '{' instead of '}'.
The final view of line (1) that can be displayed in the editor:
/* begin admins only */ if (isAdmin) {Similar transformations affect line (2), which is displayed like this:
/* end admins only */ }The code fragment that can be displayed in the editor:
#include <iostream>
int main()
{
bool isAdmin = false;
/* begin admins only */ if (isAdmin) {
std::cout << "You are an admin.\n";
/* end admins only */ }
return 0;
}The reviewer may think that the code is checked before displaying the message. They will ignore the comments and think that the code should be executed like this:
#include <iostream>
int main()
{
bool isAdmin = false;
if (isAdmin) {
std::cout << "You are an admin.\n";
}
return 0;
}However, there is no check. For the compiler, the code above looks like this:
#include <iostream>
int main()
{
bool isAdmin = false;
std::cout << "You are an admin.\n";
return 0;
}Now let's look at a simple and at the same time dangerous example where non-displayed characters are used:
#include <string>
#include <string_view>
enum class BlockCipherType { DES, TripleDES, AES, /*....*/ };
constexpr BlockCipherType
StringToBlockCipherType(std::string_view str) noexcept
{
if (str == "AES[ZWSP]")
return BlockCipherType::AES;
else if (str == "TripleDES[ZWSP]")
return BlockCipherType::TripleDES;
else
return BlockCipherType::DES;
}The 'StringToBlockCipherType' function converts a string to one of the values of the 'BlockCipherType' enumeration. You may think that the function returns three different values, but it doesn't. Since a invisible space character [ZWSP] is added at the end of each string literal, the check for equality with strings 'AES' and 'TriplesDES' will be false. As a result, out of three expected returned values, the function returns only 'BlockCipherType::DES'. At the same time, the code editor may display the code like this:
#include <string>
#include <string_view>
enum class BlockCipherType { DES, TripleDES, AES, /*....*/ };
constexpr BlockCipherType
StringToBlockCipherType(std::string_view str) noexcept
{
if (str == "AES")
return BlockCipherType::AES;
else if (str == "TripleDES")
return BlockCipherType::TripleDES;
else
return BlockCipherType::DES;
}If the analyzer issued the warning about invisible characters in code, turn on the display of invisible characters. Make sure they don't change the logic of the program execution.
This diagnostic is classified as:
V1077. Constructor contains potentially uninitialized members.
The analyzer has detected a constructor that may contain potentially uninitialized class fields after execution.
Here's a simple synthetic example:
struct Cat
{
int age;
Cat(bool isKitten)
{
if (isKitten)
{
age = 3;
}
}
};If, when constructing an object of the 'Cat' type, the 'false' value is passed as an actual parameter, the non-static field of the 'age' class will not be initialized. Subsequent access to this field results in undefined behavior:
#include <iostream>
void Cat()
{
Cat instance { false };
std::cout << instance.x << std::endl; // UB
}The correct version of the constructor should look like this:
Cat(bool isKitten) : age { 0 }
{
if (isKitten)
{
age = 3;
}
}If it's allowed that any class member may remain uninitialized after executing the constructor, then you can suppress warnings for these members with the special comment "//-V1077_NOINIT":
struct Cat
{
int age; //-V1077_NOINIT
Cat(bool isKitten)
{
if (isKitten)
{
age = 3; // ok
}
}
};You can suppress a warning by marking the constructor with the comment "//-V1077". You can also use the mass suppression mechanism to exclude false positives.
There is also a way to disable the diagnostic warnings for all class fields of a certain type. Use the same comment as in the V730 diagnostic (the search for uninitialized class members in constructors).
The format of the comment:
//+V730:SUPPRESS_FIELD_TYPE, class:className, namespace:nsNameIf you specify the class with the 'className' name as the argument of the 'class' parameter, then fields of this type will be considered as exceptions in V1077 and V730 diagnostics. Code example:
//+V730:SUPPRESS_FIELD_TYPE, class:Field
struct Field
{
int f;
};
class Test
{
Field someField;
public:
Test(bool cond, int someValue)
{
if (cond)
{
someField.f = someValue; // ok
}
}
};When using a special comment, the analyzer does not issue a warning for fields that have the 'Field' type (in our case - 'someField').
The following syntax is used for nested classes:
//+V730:SUPPRESS_FIELD_TYPE, class:className.NestedClassName,
namespace:nsNameEach nested class is separated by a dot: "className.NestedClassName".
We did not introduce a separate comment for V1077 for the following reasons. If the type is marked with a comment for V730 diagnostic, it is intended that the type instances may not be initialized at all, which means it's pointless to issue V1077 diagnostic for it as well. In addition, if you already have markup for V730, it works for V1077 as well.
This diagnostic is classified as:
V1078. An empty container is iterated. The loop will not be executed.
The analyzer has detected an attempt to iterate an empty container. As a result, not a single iteration of the loop will occur. This may indicate an error.
Let's look at the example that may be the result of unsuccessful refactoring:
#include <vector>
#include <string_view>
std::vector<std::string_view> GetSystemPaths()
{
std::vector<std::string_view> paths;
#ifdef _WIN32
paths.emplace_back("C:/Program files (x86)/Windows Kits");
paths.emplace_back("C:/Program Files (x86)/Microsoft Visual Studio");
#elif defined(__APPLE__)
paths.emplace_back("/Applications");
paths.emplace_back("/Library");
paths.emplace_back("/usr/local/Cellar");
#elif defined(__linux__)
// TODO: Don't forget to add some specific paths
#endif
return paths;
}
bool IsSystemPath(std::string_view path)
{
static const auto system_paths = GetSystemPaths();
for (std::string_view system_path : system_paths)
{
if (system_path == path)
{
return true;
}
}
return false;
}The content of the 'system_paths' container depends on the operating system for which the application is compiled. For Linux and all other systems except Windows and macOS, an empty container is obtained as a result of the preprocessor directives expansion.
In the context of this example, this is an undesirable behavior of the 'GetSystemPaths' function. In the case of Linux, to fix the warning, a developer needs to add the necessary paths. When compiling to a new operating system (for example, FreeBSD) a developer may need to handle an error with static_assert. Here is the example of safe code:
#include <vector>
#include <string_view>
std::vector<std::string_view> GetSystemPaths()
{
std::vector<std::string_view> paths;
#ifdef _WIN32
....
#elif defined(__APPLE__)
....
#elif defined(__linux__)
paths.emplace_back("/usr/include/");
paths.emplace_back("/usr/local/include");
#else
static_assert(false, "Unsupported OS.");
#endif
return paths;
}In general, if an empty container iteration was the programmer's intent, then the warning can be suppressed.
V1079. Parameter of 'std::stop_token' type is not used inside function's body.
This diagnostic rule implies that the function takes the parameter of the 'std::stop_token' type and never uses it. Such code can potentially lead to problems.
The C++20 standard introduced a new class in the standard library — 'std::jthread'. This is an alternative to the 'std::thread' class, and it has two new features. First, the 'std::jthread' object automatically joins by calling functions 'request_stop' and 'join' in the destructor. Second, the execution of a function in another thread can be interrupted via an object of the 'std::stop_token' type. Here's a synthetic example:
#include <thread>
#include <vector>
struct HugeStruct { .... };
HugeStruct LoadHugeData(std::string_view key);
void worker(std::stop_token st, ....)
{
auto keys = ....;
for (auto key : keys)
{
auto data = LoadHugeData(key);
// Do something with data
}
}
void foo()
{
using namespace std::literals;
std::jthread thread { worker };
// ....
}The function subsequently loads large data. The implementation allows interrupting such an operation. However, the 'st' parameter is not used to receive a stop signal. Such code looks suspicious and is marked by the analyzer as a place of a potential error.
Below is an option to correct this fragment:
#include <thread>
#include <vector>
struct HugeStruct { .... };
HugeStruct LoadHugeData(std::string_view key);
void worker(std::stop_token st, ....)
{
auto keys = ....;
for (auto key : keys)
{
if (st.stop_requested())
{
// Stop execution here
}
auto data = LoadHugeData(key);
// Do something with data
}
}
void foo()
{
using namespace std::literals;
std::jthread thread { worker };
// ....
}Now the subsequent load can be interrupted. The 'worker' function stops loading the elements if it receives a request to cancel the operation (the 'request_stop' function) from another thread.
V1080. Call of 'std::is_constant_evaluated' function always returns the same value.
The diagnostic rule warns that the 'std::is_constant_evaluated' function's return value has no ability to ever change. This may lead to unreachable code.
This rule covers two cases:
- The function is called in the context, that is always the compile-time context, and returns 'true'.
- The function is called in the context, that is always the runtime context, and returns 'false'.
Example: we need to write a function that would contain two versions of one algorithm - one version for compile-time, the other version for runtime. We'll use the 'std::is_constant_evaluated' function to differentiate between these two implementations.
#include <type_traits>
constexpr void foo()
{
constexpr auto context = std::is_constant_evaluated();
//....
if (context)
{
// compile-time logic
}
else
{
// runtime logic
}
}Here the 'std::is_constant_evaluated' function always returns 'true'. The 'else' branch contains unreachable code.
The opposite situation may happen if we remove the 'costexpr' specifier from the 'context' variable and from the 'foo' function.
#include <type_traits>
void foo()
{
auto context = std::is_constant_evaluated();
//....
if (context)
{
// compile-time logic
}
else
{
// runtime logic
}
}Here the 'context' variable is always 'false'. The code becomes unreachable as early as the 'then' branch.
The 'std::is_constant_evaluated' always returns 'true' if called in one of the following locations:
- inside 'static_assert';
- inside the 'consteval' function;
- inside the 'if constexpr' condition.
The 'std::is_constant_evaluated' always returns 'true' if called here:
- inside a function that is not marked with the 'constexpr' / 'consteval' specifiers.
This diagnostic is classified as:
V1081. Argument of abs() function is minimal negative value. Such absolute value can't be represented in two's complement. This leads to undefined behavior.
The smallest negative value of a signed integer type has no corresponding positive value. When 'abs', 'labs', and 'llabs' functions evaluate this integer's absolute value, a signed integer overflow happens. This causes undefined behavior.
Example:
#include <iostream>
#include <cmath>
#include <limits.h>
int main()
{
int min = INT_MIN;
// error: abs(-2147483648) = -2147483648
std::cout << "abs(" << min << ") = "
<< abs(min); // <=
return 0;
}The minimum value of the 32-bit signed int type is 'INT_MIN' which equals -2147483648. At the same time, this type's maximum value - 'INT_MAX' - is 2147483647. This number is one less than the absolute value of 'INT_MIN'. In this case, calculating the absolute value yielded a negative number equal to the argument's original value. This can lead to an error in the corner case when the code is not intended to process negative numbers, because this code does not expect numbers to be negative after an absolute value is calculated.
For the remaining numbers, the function calculates absolute values as expected:
int main()
{
int notQuiteMin = INT_MIN + 1;
// ok: abs(-2147483647) = 2147483647
std::cout << "abs(" << notQuiteMin << ") = "
<< abs(notQuiteMin);
return 0;
}Before calculating the absolute value, you could add a special argument check. It would help you avoid the corner case we discussed earlier:
void safe_abs_call(int value)
{
if (value == INT_MIN)
return;
std::cout << "abs(" << value << ") = " << abs(value);
}You can suppress the diagnostic if the de facto range of values supplied to 'abs', 'labs' and 'llabs' cannot reach the minimum value.
This diagnostic is classified as:
|
V1082. Function marked as 'noreturn' may return control. This will result in undefined behavior.
The analyzer has detected a function marked as 'noreturn'. One or more execution branches of this function nevertheless may return control flow.
First, let's look at the correct example:
[[ noreturn ]] void q() {
throw "error"; // OK
}The 'q' function throws an exception and then terminates. Further, the program execution is passed to the exception handler, and doesn't return to the 'q' function's caller. At the same time, the compiler understands that the code following the call of the 'q' function is unreachable and it can be optimized.
[[ noreturn ]] void f(int i) { // behavior is undefined
// if called with an argument <= 0
if (i > 0)
throw "positive";
}The same thing happens when the 'f' function is called with a positive argument value. However, if a negative value or zero is passed to the 'f' function during the program execution, an undefined behavior will occur according to the C++ standard:
9.12.9 Noreturn attribute [dcl.attr.noreturn]
2. If a function f is called where f was previously declared with the noreturn attribute and f eventually returns, the behavior is undefined.
This diagnostic is classified as:
|
V1083. Signed integer overflow in arithmetic expression. This leads to undefined behavior.
The analyzer has detected an arithmetic expression in which a signed integer overflow may occur.
Example:
long long foo()
{
long longOperand = 0x7FFF'FFFF;
long long y = longOperand * 0xFFFF;
return y;
}According to the C and C++ rules, the resulting type of the 'longOperand * 0xFFFF' expression will be 'long'. When you use the MSVC compiler on Windows, the size of 'long' type is 4 bytes. The maximum value that can be represented by this type is 2'147'483'647 in decimal or 0x7FFF'FFFF in hexadecimal. When multiplying the 'longOperand' variable by 0xFFFF (65,535), the 0x7FFF'7FFF'0001 result is expected. However, according to the C standard (see the C18 standard section 6.5 paragraph 5) and C++ (see standard C++20 section 7.1 paragraph 4), signed integer overflow leads to undefined behavior.
There are several ways to fix this code — it depends on the developer's intent.
If you need to make correct calculations, you need to use types whose sizes will be sufficient to fit a value. If the value does not fit a word, you can use one of the libraries for arbitrary-precision arithmetic. For example, GMP, MPRF, cnl.
The code fragment above can be corrected as follows:
long long foo()
{
long longOperand = 0x7FFF'FFFF;
long long y = static_cast<long long>(longOperand) * 0xFFFF;
return y;
}If the signed integer overflow is an unexpected behavior, and it needs to be handled in some way, you can use special libraries to work with integers safely. For example, boost::safe_numerics or Google Integers.
If you need to implement wraparound arithmetic for signed integers with standard-defined behavior, you can use unsigned integers for calculations. In case of unsigned integer overflow, the integer is "wrapped" modulo '2 ^ n', where n is the number of bits of the integer.
Let's look at one of the possible solutions based on 'std::bit_cast' (C++20):
#include <concepts>
#include <type_traits>
#include <bit>
#include <functional>
namespace detail
{
template <std::signed_integral R,
std::signed_integral T1,
std::signed_integral T2,
std::invocable<std::make_unsigned_t<T1>,
std::make_unsigned_t<T2>> Fn>
R safe_signed_wrapper(T1 lhs, T2 rhs, Fn &&op)
noexcept(std::is_nothrow_invocable_v<Fn,
std::make_unsigned_t<T1>,
std::make_unsigned_t<T2>>)
{
auto uLhs = std::bit_cast<std::make_unsigned_t<T1>>(lhs);
auto uRhs = std::bit_cast<std::make_unsigned_t<T2>>(rhs);
auto res = std::invoke(std::forward<Fn>(op), uLhs, uRhs);
using UR = std::make_unsigned_t<R>;
return std::bit_cast<R>(static_cast<UR>(res));
}
}The 'std::bit_cast' function converts 'lhs' and 'rhs' to the corresponding unsigned representations. Next, some arithmetic operation is performed on the two converted operands. Then the result expands or narrows to the needed resulting type and turns into a signed one.
With this approach, signed integers repeat the semantics of unsigned ones in arithmetic operations. This does not lead to undefined behavior.
For example, by clicking this link, you can see that the compiler may optimize the code if it detects that a signed integer overflow may occur. Let's take a closer look at the code fragment:
bool is_max_int(int32_t a)
{
return a + 1 < a;
}If 'a' equals 'MAX_INT', the condition 'a + 1 < a' will be 'false'. This is a way to check whether an overflow has occurred. However, the compiler generates the following code:
is_max_int(int): # @is_max_int(int)
xor eax, eax
retThe assembly 'xor eax, eax' instruction resets the result of the 'is_max_int' function execution. As a result, the latter function always returns 'true', no matter what the value 'a' has. In this case, this is the result of undefined behavior due to overflow.
In the case of an unsigned representation, the undefined behavior does not happen:
is_max_int(int): # @is_max_int(int)
cmp edi, 2147483647
sete al
retThe compiler has generated code that does check the condition.
This diagnostic is classified as:
|
V1084. The expression is always true/false. The value is out of range of enum values.
The analyzer detected a suspicious comparison. The enumeration variable is compared with a number. This number is out of the enumeration values range, so the comparison does not make any sense.
If the enumeration has an underlying type, values that fit into this type should be compared with a variable of this enumeration.
Look at the following example:
enum byte : unsigned char {}; // Range: [0; 255]
void foo(byte b1)
{
if (b1 == 256) // logic error : always false
{
//....
}
}The 'byte' enumeration has the underlying 'unsigned char' type. Number 256 is out of the 'unsigned char' type range, so the 'b1 == 256' comparison is always false.
Here's an example of a correct comparison:
enum byte : unsigned char {}; // Range: [0; 255]
void foo(byte b1)
{
if (b1 == 255) // ok
{
//....
}
}A more complicated case is when an enumeration doesn't have explicitly specified underlying type.
In the C language, a compiler always uses the 'int' type as an underlying type. The whole 'int' range will be the enumeration values range.
In the C++ language, a compiler uses 'int' as an underlying type for scoped enumerations. The whole 'int' range will also be the values range.
For unscoped enumerations whose underlying type isn't fixed, the values range and the underlying type are evaluated in a special way. According to the C++ standard, the compiler outputs the underlying type basing on the enumerators' values. The compiler tries to fit them into the following types:
int -> unsigned int -> long -> unsigned long ->
long long -> unsigned long longIn the selected type, the compiler uses the smallest bit field (n) large enough to hold all enumerators. Such enumerations will be able to handle the [- (2 ^ n) / 2; (2 ^ n) / 2 - 1] range of values for the signed and [0; (2 ^ n) - 1] for the unsigned underlying type, respectively.
That's why the following fragment in the C++ language will have an error if a compiler other than MSVC is used (for example, GCC or Clang):
enum EN { low = 2, high = 4 }; // Uses 3 bits, range: [0; 7]
void foo(EN en1)
{
if (en1 != 8) // logic error : always true
{
//....
}
}According to the C++ standard, the underlying type for this enumeration is 'int'. In this type, the compiler uses the smallest bit field that can fit all the values of enumerators.
In this case, at least 3 bits are needed to fit all values (2 = 0b010 and 4 = 0b100), so a variable of the 'EN' type can fit numbers from 0 (0b000) to 7 (0b111). 8 occupies four bits (0b1000), so it no longer fits into the 'EN' type. To fix the error, you can explicitly specify the underlying type:
enum EN : int32_t { low = 2, high = 4 };
// Now range is: [−2 147 483 648, 2 147 483 647]
void foo(EN en1)
{
if (en1 != 8) // ok
{
//....
}
}Not all C++ compilers evaluate the actual size of the enumeration according to the standard. For example, MSVC when compiling code, doesn't follow the standard. It evaluates the enumeration size for backward compatibility according to the C language. Therefore, MSVC always uses the 'int' type as the underlying type, unless a different type is specified. In this case, the range of enumeration values is the 'int' range. That's why there's no error in the example above, if you use MSVC:
enum EN { low = 2, high = 4 };
// MSVC will use int as underlying type
// range is: [−2 147 483 648, 2 147 483 647]
void foo(EN en1)
{
if (en1 != 8) // no logic error
{
//....
}
}However, don't write such code because it's non-portable to other compilers. You should explicitly specify 'int' as the underlying type.
If you're using the MSVC compiler and you are not interested in portability to other compilers, you can write the following comment. It disables diagnostics that warn about the non-portable code:
//-V1084_TURN_OFF_ON_MSVCThe V1084 warnings relevant to MSVC will remain.
This diagnostic is classified as:
|
V1085. Negative value is implicitly converted to unsigned integer type in arithmetic expression.
The analyzer has detected a negative value converted to an unsigned type in an arithmetic expression. According to implicit conversion rules in C/C++, a signed integer that has the same size as an unsigned one turns into an unsigned one. When a negative number is converted to an unsigned type, it is wrapped modulo '(2 ^ n) + 1', where n is the number of bits in the integer. This situation does not lead to undefined behavior, but it can provoke unexpected results.
Consider an example:
void foo()
{
char *p = (char *) 64;
int32_t a = -8;
uint32_t b = 8;
p = p + a * b;
}On a 32-bit system, the pointer is 0x0. On 64-bit, it is 0x0000'0001'0000'0000. This may be unexpected for a programmer. Let's figure out why this is happening.
The 'a' variable has the signed type 'int32_t'. This means that its size is 4 bytes, and it can receive values in the range from -2'147'483'648 to 2'147'483'647. The 'b' variable has the 'uint32_t' type. It also has a size of 4 bytes but, unlike the 'a' variable, it can take values in the range from 0 to 4'294'967'295. This happens because the highest bit in the signed integer is preserved for the sign. Because of this limitation, the maximum value of a signed integer is half of the value of an unsigned one.
According to C++ language rules, if operands have types with the same rank in a binary operation and one of the operands has a signed type while the other is unsigned, the operand that has a signed type is implicitly converted to unsigned.
In the 'a * b' expression, the operand types ('int32_t' and 'uint32_t') have the same rank. Therefore, the 'a' operand that stores the '-8' value is implicitly converted to an unsigned type 'uint32_t'. As a result of this conversion, its value becomes 4'294'967'288. Next, it is multiplied by the 'b' variable that stores the '8' value. The result obtained is 34'359'738'304. It is outside the range of the 'uint32_t' type variable. It will be wrapped modulo '2 ^ 32'. Thus, the result of the 'a * b' expression will be 34'359'738'304 % 4'294'967'296 = 4'294'967'232.
The addition operator 'p + a * b' has the following operand types: 'char *' and 'uint32_t', respectively. According to the C++ standard, the resulting type is 'char *', and the result is the sum of the left and right operands. When 64 and 4'294'967'232 are added, the result is 4'294'967'296.
On a 32-bit platform, the pointer size is 4 bytes. Therefore, its maximum value is 4'294'967'295. Since 4'294'967'296 is greater, the result is wrapped modulo '2 ^ 32' as in the previous addition operation. The result will be 4'294'967'296 % 4'294'967'296 = 0. So, 'p + a * b' equals zero.
On a 64-bit platform, the pointer size is 8 bytes. And unlike a 32-bit platform, its maximum value is much greater than 4'294'967'296. Since there will be no wrapping, the result of 'p + a * b' is 4'294'967'296 in the decimal system or 0x0000'0001'0000'0000 in the hexadecimal system.
We can fix the above example by using signed types:
void foo()
{
char *p = (char *) 64;
int32_t a = -8;
uint32_t b = 8;
p = p + a * static_cast<int32_t>(b);
}Not all signed types conversions to unsigned will trigger the diagnostic. It will issue a warning only for expressions whose result will be different from the result obtained when only signed types are used. Consider an example:
void foo()
{
unsigned num = 1;
unsigned res1 = num + (-1); // ok
unsigned res5 = num + (-2); //+V1085
unsigned res2 = num - (-1); // ok
unsigned res3 = num * (-1); //+V1085
unsigned res4 = num / (-1); //+V1085
unsigned res6 = num / (-2); // ok
unsigned num2 = 2;
unsigned res7 = num2 / (-1); //+V1085
}Lines containing the 'ok' comment will not trigger the V1085 warning. Here are the results of each expression with signed and unsigned variants:
num + (signed)(-1) => 1 + (-1) => 0
num + (unsigned)(-1) => 1 + 4294967295 = 0
num + (signed)(-2) => 1 + (-2) => -1
num + (unsigned)(-2) => 1 + 4294967294 = 4294967295
num - (signed)(-1) => 1 – (-1) => 2
num - (unsigned)(-1) => 1 – (4294967295) => 2
num * (signed)(-1) => 1 * (-1) => -1
num * (unsigned)(-1) => 1 * (4294967295) => 4294967295
num / (signed)(-1) => 1 / (-1) => -1
num / (unsigned)(-1) => 1 / 4294967295 => 0
num / (signed)(-2) => 1 / (-2) => 0
num / (unsigned)(-2) => 1 / 4294967294 => 0
num2 / (signed)(-2) => 2 / (-2) => -1
num2 / (unsigned)(-2) => 2 / 4294967294 => 0The analyzer will not issue a warning in places where the results match.
Note. The considered problems overlap with the topic of porting applications from 32-bit to 64-bit systems. See the following article: "A collection of examples of 64-bit errors in real programs."
This diagnostic is classified as:
|
V1086. Call of the 'Foo' function will lead to buffer underflow.
The analyzer has detected a potential error related to filling, copying or comparing memory buffers. The error can lead to buffer underflow.
Note: previously this diagnostic rule was a part of another diagnostic – V512, but later we decided to divide them. You can read more about causes and consequences of this decision in the special note.
This is a common type of errors caused, for example, by typos or inattention. The error can lead to incomplete data clearing and as a result, to using uninitialized or damaged memory. Although the program can run without problems for a long time. That's the main trouble of such errors.
Let's look at two examples from the real applications.
Example N1:
MD5Context *ctx;
....
memset(ctx, 0, sizeof(ctx));Here, zeros do not fill the entire structure, but only part of it, because of a typo. The error is that the pointer's size is calculated, not the 'MD5Context' structure's size. The correct code variant is as follows:
MD5Context *ctx;
....
memset(ctx, 0, sizeof(*ctx));Example N2:
#define CONT_MAP_MAX 50
int _iContMap[CONT_MAP_MAX];
memset(_iContMap, -1, CONT_MAP_MAX);In this example, the size of the buffer is specified incorrectly. The correct code variant is:
#define CONT_MAP_MAX 50
int _iContMap[CONT_MAP_MAX];
memset(_iContMap, -1, CONT_MAP_MAX * sizeof(int));Older versions compatibility
Previously this diagnostic rule was a part of another diagnostic —V512. For backward compatibility, we still provide the option to disable this diagnostic with a special comment:
//-V512_UNDERFLOW_OFFYou can add this comment into the header file, included into all the other files. For instance, it can be the "stdafx.h" file. If you add this comment into the "*.cpp" file, it will affect only this particular file.
This diagnostic is classified as:
You can look at examples of errors detected by the V1086 diagnostic. |
V1087. Upper bound of case range is less than its lower bound. This case may be unreachable.
The analyzer detected a situation where the upper bound of range in the 'case' label is less than its lower bound. Perhaps, this is a typo, and the part of code may become unreachable.
The GCC and Clang compilers have the Case Ranges extension which allows you to specify a range of constant values instead of a single value for the 'case' label. Such a range will be similar to the sequence of 'case' labels, including boundary values:
switch (....)
{
case 1 ... 3:
// Do something
break;
}
// Similar to the previous 'switch' statement
switch (....)
{
case 1:
case 2:
case 3:
// Do something
break;
}However, if the upper bound of the specified range is less than its lower bound, this range will be treated as empty. If you specify such a range, then during the condition check control can never be passed to the label. Therefore, the code branch can become unreachable.
Look at the synthetic example:
void foo(int i)
{
switch (i)
{
case 1 ... 3:
// First case
break;
case 6 ... 4: // <=
// Second case
break;
case 7 ... 9:
// Third case
break;
}
}In the second label, the '4' and '6' constants were mixed up in places, which is why control will never be transferred to the label. Correct example:
void foo(int i)
{
switch (i)
{
case 1 ... 3:
// First case
break;
case 4 ... 6: // <=
// Second case
break;
case 7 ... 9:
// Third case
break;
}
}An error of this kind can occur when named constants or values returned by 'constexpr' functions are incorrectly used. Look at the synthetic example:
constexpr int for_yourself_min() noexcept { return 1; }
constexpr int for_yourself_max() noexcept { return 3; }
constexpr int for_neighbors_min() noexcept { return 4; }
constexpr int for_neighbors_max() noexcept { return 6; }
void distributeCats(int count)
{
switch (count)
{
case for_yourself_min() ... for_yourself_max():
// Keep for yourself
break;
case for_neighbors_max() ... for_neighbors_min(): // <=
// Give cats to neighbors
break;
default:
// Give cats to a cattery
break;
}
}There's a typo in the second label. Because of this, function calls are mixed up in places, and control will never be passed to the label. Correct example:
constexpr int for_yourself_min() noexcept { return 1; }
constexpr int for_yourself_max() noexcept { return 3; }
constexpr int for_neighbors_min() noexcept { return 4; }
constexpr int for_neighbors_max() noexcept { return 6; }
void distributeCats(int count)
{
switch (count)
{
case for_yourself_min() ... for_yourself_max():
// Keep for yourself
break;
case for_neighbors_min() ... for_neighbors_max(): // <=
// Give cats to neighbors
break;
default:
// Give cats to a cattery
break;
}
}However, incorrect range doesn't always lead to unreachable code. If there is no 'break' in the 'case' label above, then after its branch is executed, control will be passed to 'case' with an empty range. Synthetic example:
void foo(int i)
{
switch (i)
{
case 0: // no break
case 3 ... 1:
// First and second case
break;
case 4:
// Third case
default:
// Do something
}
}Despite the code is reachable, an empty range looks strange and meaningless. This may be a typo or incorrect macro expansion. Therefore, the absence of 'break' in the label above is not an exception for the diagnostic, and the analyzer will issue a warning.
This diagnostic is classified as:
V1088. No objects are passed to the 'std::scoped_lock' constructor. No locking will be performed. This can cause concurrency issues.
The analyzer has detected a problem. An object of the 'std::scoped_lock' type is constructed without arguments passed to it — i.e., without lockable objects. This can lead to problems in a multithreaded application: race condition, data race, etc.
Since C++17, the standard library has 'std::scoped_lock' class template. It was implemented as a convenient alternative to 'std::lock_guard'. We can use 'std::scoped_lock' when we need to lock an arbitrary number of lockable objects at a time. The class provides an algorithm that prevents deadlocks.
However, the new design has certain disadvantages. Let's see how we can declare one of its constructors:
template <class ...MutexTypes>
class scoped_lock
{
// ....
public:
explicit scoped_lock(MutexTypes &...m);
// ....
};The constructor receives an arbitrary number of arguments of the 'MutexTypes' (parameter pack) type. The parameter pack 'MutexTypes' can be empty. As a result, we can get a RAII object without locks:
void bad()
{
// ....
std::scoped_lock lock;
// ....
}To fix this, we should initialize 'std::scoped_lock' with a lockable object:
std::mutex mtx;
void good()
{
// ....
std::scoped_lock lock { mtx };
// ....
}This diagnostic is classified as:
|
V1089. Waiting on condition variable without predicate. A thread can wait indefinitely or experience a spurious wake-up.
This diagnostic rule is based on the CP.42 CppCoreGuidelines.
The analyzer has detected one of the non-static member functions of the 'std::condition_variable' class template — 'wait', 'wait_for' or 'wait_until' — is called without a predicate. This can lead to a spurious wakeup of a thread or a thread hanging.
Let's consider the example N1 leading to a potential hanging:
#include <iostream>
#include <thread>
#include <mutex>
#include <condition_variable>
std::mutex mtx;
std::condition_variable cond;
void consumer()
{
std::unique_lock<std::mutex> lck { mtx };
std::cout << "Waiting... " << std::endl;
cond.wait(lck); // <=
std::cout << "Working..." << std::endl;
}
void producer()
{
{
std::lock_guard<std::mutex> _ { mtx };
std::cout << "Preparing..." << std::endl;
}
cond.notify_one();
}
int main()
{
std::thread c { consumer };
std::thread p { producer };
c.join();
p.join();
}The example contains a race condition. The program can hang if it runs in the following order:
- the 'p' thread wins the race, acquires the mutex first, prints the message to the 'std::cout' and releases the mutex;
- the 'c' thread acquires the mutex, but does not have time to block on the conditional variable 'cond';
- the 'p' thread notifies about the event by calling the 'cond.notify_one()' call;
- the 'c' thread waiting for notification blocks on the conditional variable 'cond'.
To fix this, we should modify the code as follows:
- The notifying thread should acquire a mutex and change some shared state while the lock is held. For example, a Boolean variable.
- The waiting thread should call the overload of 'std::condition_variable::wait' that accepts the predicate. Inside the predicate we need to check whether the shared state changed or not.
Here is the fixed example:
#include <iostream>
#include <thread>
#include <mutex>
#include <condition_variable>
std::mutex mtx;
std::condition_variable cond;
bool pendingForWorking = false; // <=
void consumer()
{
std::unique_lock<std::mutex> lck { mtx };
std::cout << "Waiting... " << std::endl;
cond.wait(lck, [] { return pendingForWorking; }); // <=
std::cout << "Working..." << std::endl;
}
void producer()
{
{
std::lock_guard<std::mutex> _ { mtx };
pendingForWorking = true; // <=
std::cout << "Preparing..." << std::endl;
}
cond.notify_one();
}
int main()
{
std::thread c { consumer };
std::thread p { producer };
c.join();
p.join();
}Let's consider the example N2 where a spurious wakeup can happen:
#include <iostream>
#include <fstream>
#include <sstream>
#include <queue>
#include <thread>
#include <mutex>
#include <condition_variable>
std::queue<int> queue;
std::mutex mtx;
std::condition_variable cond;
void do_smth(int);
void consumer()
{
while (true)
{
int var;
{
using namespace std::literals;
std::unique_lock<std::mutex> lck { mtx };
if (cond.wait_for(lck, 10s) == std::cv_status::timeout) // <=
{
break;
}
var = queue.front();
queue.pop();
}
do_smth(var);
}
}
void producer(std::istream &in)
{
int var;
while (in >> var)
{
{
std::lock_guard<std::mutex> _ { mtx };
queue.push(var);
}
cond.notify_one();
}
}
void foo(std::ifstream &fin, std::istringstream &sin)
{
std::thread p1 { &producer, std::ref(fin) };
std::thread p2 { &producer, std::ref(sin) };
std::thread p3 { &producer, std::ref(std::cin) };
std::thread c1 { &consumer };
std::thread c2 { &consumer };
std::thread c3 { &consumer };
p1.join(); p2.join(); p3.join();
c1.join(); c2.join(); c3.join();
}A spurious wakeup happens when a waiting thread wakes up and discovers that the condition it was expecting has not been met. This can occur in two scenarios:
- The notifying thread changes the shared state and sends a notification. One thread wakes up, processes the shared state, and falls asleep. After that another thread also wakes up from the notification but finds that the shared state has already been processed.
- The waiting thread is woken up even if the notifying thread has not yet sent a notification. This can happen in some implementations of multithreaded APIs, for example, WinAPI, POSIX Threads, etc.
In the example N2, a spurious wakeup can occur in threads 'c1', 'c2', and 'c3'. As a result of such a wakeup, the queue may be empty — accessing it, we can get an undefined behavior.
To fix this, we should also call the 'std::condition_variable::wait_for' overload that accepts the predicate. Inside the predicate, we need to check whether the queue is empty or not:
void consumer()
{
while (true)
{
int var;
{
using namespace std::literals;
std::unique_lock<std::mutex> lck { mtx };
bool res = cond.wait_for(lck,
10s,
[] { return !queue.empty(); }); // <=
if (!res)
{
break;
}
// no spurious wakeup
var = queue.front();
queue.pop();
}
do_smth(var);
}
}You can look at examples of errors detected by the V1089 diagnostic. |
V1090. The 'std::uncaught_exception' function is deprecated since C++17 and is removed in C++20. Consider replacing this function with 'std::uncaught_exceptions'.
The analyzer detected the 'std::uncaught_exception' function call. The use of this function may lead to incorrect program logic. Since C++17, this function has been deprecated and should be replaced with the 'std::uncaught_exceptions' function.
The 'std::uncaught_exception' function is usually used to understand whether the code is called when the stack unwinding takes place. Let's look at the following example:
constexpr std::string_view defaultSymlinkPath = "system/logs/log.txt";
class Logger
{
std::string m_fileName;
std::ofstream m_fileStream;
Logger(const char *filename)
: m_fileName { filename }
, m_fileStream { m_fileName }
{
}
void Log(std::string_view);
~Logger()
{
fileStream.close();
if (!std::uncaught_exception())
{
std::filesystem::create_symlink(m_fileName, defaultSymlinkPath);
}
}
};
class Calculator
{
public:
int64_t Calc(const std::vector<std::string> ¶ms);
// ....
~Calculator()
{
try
{
Logger logger("log.txt");
Logger.Log("Calculator destroyed");
}
catch (...)
{
// ....
}
}
}
int64_t Process(const std::vector<std::string> ¶ms)
{
try
{
Calculator calculator;
return Calculator.Calc(params);
}
catch (...)
{
// ....
}
}Inside the 'Logger' class destructor, the 'std::filesystem::create_symlink' function is called. This function may throw an exception, for example, if a program doesn't have permissions to use the 'system/logs/log.txt' path. If the 'Logger' destructor is called directly as a result of the stack unwinding, then, it is impossible to throw exceptions from this destructor — the program will be aborted via 'std::terminate'. Therefore, before the function is called, a developer makes an extra check - 'if (!std::uncaught_exception())'.
However, such code contains an error. Suppose the 'Calc' function throws an exception. Then, before the catch-clause is executed, the 'Calculator' destructor will be called. An instance of the 'Logger' class will be created inside this call, and the message will be written to the log. After that, the 'Logger' destructor will be called. Then, the 'std::uncaught_exception' function will be called inside the destructor. This function will return 'true' because the exception thrown by the 'Calc' function has not been caught yet. Therefore, a symbolic link to the log file will not be created.
However, in this case, you can try to create the symbolic link. The fact is that the 'Logger' destructor will not be called directly as a result of the stack unwinding — it will be called from the 'Calculator' destructor. Therefore, you can throw an exception from the 'Logger' destructor — you only need to catch this exception before it exits from the 'Calculator' destructor.
To fix this, you need to use the 'std::uncaught_exceptions' function from C++17:
class Logger
{
std::string m_fileName;
std::ofstream m_fileStream;
int m_exceptions = std::uncaught_exceptions(); // <=
Logger(const char *filename)
: m_fileName { filename }
, m_fileStream { m_fileName }
{
}
~Logger()
{
fileStream.close();
if (m_exceptions == std::uncaught_exceptions())
{
std::filesystem::create_symlink(m_fileName, defaultSymlinkPath);
}
}
};Now, when you create the 'Logger' instance, the current number of uncaught exceptions will be saved in the 'm_exceptions' field. If no new exceptions were thrown between creating the object and calling its destructor, the condition will be true. Therefore, the program will try to create the symbolic link to the log file. If an exception is thrown, it will be caught and processed in the 'Calculator' destructor, and the program will continue execution.
This diagnostic is classified as:
V1091. The pointer is cast to an integer type of a larger size. Casting pointer to a type of a larger size is an implementation-defined behavior.
The analyzer has detected that a pointer is cast to an integer type of a larger size. The result may differ from a programmer's expectation.
According to C and C++ standards, the result of such an expression is implementation-defined. In most implementations the programmer will get the expected result when a pointer is cast to an integer type of the same size.
Consider the following synthetic example:
void foo()
{
const void *ptr = reinterpret_cast<const void *>(0x80000000);
uint64_t ui64 = reinterpret_cast<uint64_t>(ptr); // <=
}The 'ptr' pointer is converted to the 'uint64_t' type with size of 8 bytes. On 32-bit platforms, the size of pointers is 4 bytes. The result of such casting depends on the implementation of the compiler.
So, if the GCC or MSVC compiler is used, the value 0xffff'ffff'8000'0000 will be written to the 'ui64' variable. Meanwhile, Clang will write the value 0x0000'0000'8000'0000.
To convert a 32-bit pointer to a 64-bit integer and avoid the implementation-defined behavior, do the following:
- Convert a 32-bit pointer to a 32-bit integer
- Convert the resulting 32-bit integer to a 64-bit integer
To fix the code above, we first convert the pointer to the 'uintptr_t' type. This is the unsigned integer type whose size is always equal to the pointer size. Then we convert the resulting 32-bit integer to the 64-bit integer. Here's the corrected code:
void foo()
{
const void *ptr = reinterpret_cast<const void *>(0x80000000);
uint64_t ui64 = static_cast<uint64_t>(reinterpret_cast<uintptr_t>(ptr));
}This diagnostic is classified as:
|
V1092. Recursive function call during the static/thread_local variable initialization might occur. This may lead to undefined behavior.
The analyzer detected a suspicious code fragment where initialization of a variable with static storage duration or thread storage duration starts a chain of calls, leading to recursion. According to the C++ standard, this results in undefined behavior.
Look at the example:
int foo(int i)
{
static int s = foo(2*i); // <= undefined behavior
return i + 1;
}When the 's' variable is initialized, the 'foo' function is called recursively. In this case, the analyzer issues the V1092 warning.
More often a chain of calls as in the example below can lead to recursion:
int foo(int i);
int bar(int i)
{
return foo(i); // <=
}
int foo(int i)
{
static int s = bar(2*i); // <= V1092
return i + 1;
}The chain of calls that leads to recursion goes through 'foo -> bar -> foo'.
The analyzer won't issue a warning if a chain of calls goes through the unreachable code. Look at this example:
int foo();
int bar()
{
if (false)
{
return foo(); // <= unreachable
}
return 0;
}
int foo()
{
static int x = bar(); // <= ok
return x;
}The chain of calls also goes through 'foo -> bar -> foo'. However, the path from 'bar' to 'foo' is unreachable.
V1093. The result of the right shift operation will always be 0. The right operand is greater than or equal to the number of bits in the left operand.
The analyzer detected a pointless action: the left operand is shifted bitwise to the right. The shift is done by so many bits that the result is always zero.
Look at the example:
void Metazone_Get_Flag(unsigned short* pFlag, int index)
{
unsigned char* temp = 0;
unsigned char flag = 0;
if (index >= 8 && index < 32)
{
temp = (u8*)pFlag;
flag = (*temp >> index) & 0x01; // <=
}
// ....
}If you look closely at the 'if' statement's condition, you can notice that the value of the 'index' variable always stays within the range [8 .. 31]. The 'temp' pointer points to an object of the 'unsigned char' type. During the shift operation, the left operand of the 'unsigned char' type is converted to 'int' due to integral promotion. The higher bits are filled with zero values. Therefore, if you shift to the to the right by more bits than there were before the conversion, the result of the operation will be 0.
The code above is meaningless and most likely contains a logic error or a typo.
Note
This warning may be issued for macros that are expanded for corner cases. In other words, such macros don't have an error, and 0 will be the expected result of an expression. If you write such code and don't want the analyzer to issue warnings on it, you can suppress them with a special comment. The comment should contain the name of your macro and the number of the diagnostic rule:
//-V:YOUR_MACRO_NAME:1093Additional links:
V1094. Conditional escape sequence in literal. Its representation is implementation-defined.
The analyzer has detected a character or string literal that contains conditional escape sequence. In the conditional escape sequence, the backslash character ('\') is followed by a character that does not belong to the set of other escape sequences.
Example:
FILE* file = fopen("C:\C\Names.txt", "r");The developer intends to open file "C:\C\Names.txt". However, the unescaped backslash is used to separate directories and also initiates the escape sequences '\C' and '\N'. In C++23, the representation of these characters depends on the implementation of the compiler. For example, the escape character '\' can be ignored, and then the character next to it is used. As a result, path "C:CNames.txt" is incorrect.
We need to duplicate the backslash to fix this code:
FILE* file = fopen("C:\\C\\Names.txt", "r");Other sequences may have a special meaning depending on the compiler. They can also cause warnings during the build process, for example, in Clang and GCC:
warning: unknown escape sequence: '\C'This implementation-defined behavior can cause problems with code portability and was not described in the standard before C++23.
It is hard to notice these sequences, and at the same time, it is easy to misprint them when copy-pasting.
....
{ARM_EXT_V6, 0x06500f70, ...., "uqsubaddx%c\t%12-15r, %16-19r, %0-3r"},
{ARM_EXT_V6, 0x06500ff0, ...., "usub16%c\t%12-15r, %16-19r, %0-3r"},
{ARM_EXT_V6, 0x06500f50, ...., "usub8%c\t%12-15r, %16-19r, %0-3r"},
{ARM_EXT_V6, 0x06500f50, ...., "usubaddx%c\t%12-15r, %16-19r, %0-3r"},
{ARM_EXT_V6, 0x06bf0f30, ...., "rev%c\t\%12-15r, %0-3r"}, // <=
{ARM_EXT_V6, 0x06bf0fb0, ...., "rev16%c\t\%12-15r, %0-3r"}, // <=
{ARM_EXT_V6, 0x06ff0fb0, ...., "revsh%c\t\%12-15r, %0-3r"}, // <=
{ARM_EXT_V6, 0xf8100a00, ...., "rfe%23?id%24?ba\t\%16-19r%21'!"}, // <=
{ARM_EXT_V6, 0x06bf0070, ...., "sxth%c\t%12-15r, %0-3r"},
{ARM_EXT_V6, 0x06bf0470, ...., "sxth%c\t%12-15r, %0-3r, ror #8"},
....In the above example, there are '\%' sequences.
You can look at examples of errors detected by the V1094 diagnostic. |
V1095. Usage of potentially invalid handle. The value should be non-negative.
The analyzer has detected that an invalid descriptor with a negative value is passed to the called function. This diagnostic is used only on POSIX-compatible platforms, because descriptors are pointers in Windows, and V575 diagnostics is used for them.
Here's a synthetic code example:
void Process()
{
int fd = open("path/to/file", O_WRONLY | O_CREAT | O_TRUNC);
char buf[32];
size_t n = read(fd, buf, sizeof(buf)); // <=
// ....
}A programmer forgot to check the result of the 'open' function. If the file cannot be opened, the 'open' function will return the -1 value, and this incorrect descriptor's value will be passed to the 'read' function.
Fixed code:
void Process()
{
int fd = open("path/to/file", O_WRONLY | O_CREAT | O_TRUNC);
if (fd < 0)
{
return;
}
char buf[32];
size_t n = read(fd, buf, sizeof(buf));
// ....
}Here's another example:
static intoss_setformat(ddb_waveformat_t *fmt)
{
// ....
if (fd)
{
close (fd);
fd = 0;
}
fd = open (oss_device, O_WRONLY);
// ....
}An incorrect handle may be passed to the 'close' function due to a poor check. In this case, a descriptor with the value of 0 can also be valid and should be released. Here we close the descriptor if the value of 'fd' is not zero. Such an error can occur, for example, after code refactoring or when the programmer is unaware that the wrong descriptor has the '-1' value, not the '0' value.
Let's fix the code fragment:
static intoss_setformat(ddb_waveformat_t *fmt)
{
// ....
if (fd >= 0)
{
close (fd);
fd = -1;
}
fd = open (oss_device, O_WRONLY);
// ....
}This diagnostic is classified as:
V1096. Variable with static storage duration is declared inside the inline function with external linkage. This may lead to ODR violation.
The analyzer has detected a situation in which a static variable is declared inside the 'inline' function defined in the header file. This may lead to the ODR violation.
Example:
// sample.h
class MySingleton
{
public:
static MySingleton& GetInstance()
{
static MySingleton Instance; // <=
return Instance;
}
};The 'MySingleton' class contains the 'GetInstance' member function, which returns an instance of the 'Instance' static variable. Since the function is defined in the same place where it is declared, the compiler will implicitly mark it as 'inline'. In this case, the linker will combine the 'GetInstance' function definitions in all translation units.
However, this will not happen if definitions are combined between an executable program module and a dynamic library. As a result, when executing the program, two instances of the 'Instance' static variable will already be created. This violates the ODR.
To fix this situation, the declaration and method definition need to be separated between the header file and the source code file.
Fixed code:
// sample.h
class MySingleton
{
public:
static MySingleton& GetInstance();
};
// sample.cpp
MySingleton& MySingleton::GetInstance()
{
static MySingleton Instance;
return Instance;
}V1097. Line splice results in a character sequence that matches the syntax of a universal-character-name. Using this sequence lead to undefined behavior.
The analyzer has detected a line splicing of the source code (the '\' character at the end of the line) that forms a Unicode character using the syntax of a universal-character-name. According to the standard, such code leads to undefined behavior.
Example:
void error()
{
auto p = "\\
u0041"; // maybe const char[2] "A" ?
}A string literal is assigned to the 'p' pointer. This string literal forms the capital Latin character 'A', using the \u0041 sequence. At the same time, there is line splicing between the '\' and 'u' characters that is combined with another '\' character.
As a result of the second phase of translation the lines of the source code that terminated by the '\' character should be combined into one. This can be used to improve the readability of the code if it is necessary to split a macro or a long string literal across multiple lines. As a result of combining, strings can form escape sequences. However, the standard explicitly declares that using the universal-character-name in this way leads to undefined behavior:
Except for splices reverted in a raw string literal, if a splice results in a character sequence that matches the syntax of a universal-character-name, the behavior is undefined.
To avoid this, the sequence must be completely placed on one line, or moved to another:
void ok1()
{
auto p = "\u0041"; // const char[2] "A"
}
void ok2()
{
auto p = "\
\u0041";
}V1098. The 'emplace' / 'insert' function call contains potentially dangerous move operation. Moved object can be destroyed even if there is no insertion.
- The 'try_emplace' function for 'std::map' / 'std::unordered_map'
- The 'lower_bound' and 'emplace_hint' functions for 'std::set' / 'std::map'
- Note N1
- Note N2
The analyzer has detected a potentially dangerous move operation. An object is moved into an associative container 'std::set' / 'std::map' / 'std::unordered_map' by calling the 'emplace' / 'insert' function. If an element with the specified key already exists in the container, the moved object may cause premature release of resources.
Let's take a look at an example:
using pointer_type = std::unique_ptr<void, void (*)(void *)>;
std::unordered_map<uintmax_t, pointer_type> Cont;
// Unique pointer should be moved only if
// there is no element in the container by the specified key
bool add_entry(uintmax_t key, pointer_type &&ptr)
{
auto [it, inserted] = Cont.emplace(key, std::move(ptr));
if (!inserted)
{
// dereferencing the potentially null pointer 'ptr' here
}
return inserted;
}In the example, the 'add_entry' function receives a smart pointer to some resource and its corresponding key. According to the programmer's intention, a smart pointer should be moved into an associative container only if there was no insertion with the same key before. If the insertion did not happen, the resource will be handled by a smart pointer.
However, such code contains two problems:
- If no insertion has occurred, the resource from the 'ptr' pointer can still be moved. This will cause the premature release of resource.
- The 'ptr' pointer can turn null, and its dereference will lead to undefined behavior.
Let's consider the possible ways to fix these issues.
The 'try_emplace' function for 'std::map' / 'std::unordered_map'
Since the C++17 standard, the 'try_emplace' function has been added for the 'std::map' and 'std::unordered_map' containers. The function ensures that if an element with the specified key already exists, the function arguments will not be copied or moved. Therefore, it is recommended to use the 'try_emplace' function instead of 'emplace' and 'insert' for 'std::map' and 'std::unordered_map' containers.
Here's the fixed code:
using pointer_type = std::unique_ptr<void, void (*)(void *)>;
std::unordered_map<uintmax_t, pointer_type> Cont;
bool add_entry(uintmax_t key, pointer_type &&ptr)
{
auto [it, inserted] = Cont.try_emplace(key, std::move(ptr));
if (!inserted)
{
// dereferencing the 'ptr' here
// 'ptr' is guaranteed to be non-null
}
return inserted;
}The 'lower_bound' and 'emplace_hint' functions for 'std::set' / 'std::map'
If the 'try_emplace' function is unavailable, you can split finding and inserting operations for sorted associative containers ('std::set', 'std::map'):
- the 'lower_bound' function will find either an element by a given key, or the insertion position for a new element;
- the 'emplace_hint' function will effectively insert an element.
Let's replace the container with 'std::map' and use the 'lower_bound' and 'emplace_hint' functions for the previous example:
using pointer_type = std::unique_ptr<void, void (*)(void *)>;
std::map<uintmax_t, pointer_type> Cont;
// Unique pointer should be moved only if
// there is no element in the container by the specified key
bool add_entry(uintmax_t key, pointer_type &&ptr)
{
bool inserted;
auto it = Cont.lower_bound(key);
if (it != Cont.end() && key == it->first)
{
// key exists
inserted = false;
}
else
{
// key doesn't exist
it = Cont.emplace_hint(it, key, std::move(ptr));
inserted = true;
}
if (!inserted)
{
// dereferencing the 'ptr' here
// 'ptr' is guaranteed to be non-null
}
return inserted;
}Note N1
The analyzer can issue warnings to the similar code:
using pointer_type = std::unique_ptr<void, void (*)(void *)>;
std::map<uintmax_t, pointer_type> Cont;
// Unique pointer should be moved only if
// there is no element in the container by the specified key
bool add_entry(uintmax_t key, pointer_type &&ptr)
{
bool inserted;
auto it = Cont.find(key);
if (it == Cont.end())
{
std::tie(it, inserted) = Cont.emplace(key, std::move(ptr)); // <=
}
else
{
inserted = false;
}
if (!inserted)
{
// dereferencing the 'ptr' here
// 'ptr' is guaranteed to be non-null
}
return inserted;
}There is no error in the example: if the element with the specified key does not exist, the insertion will surely happen. However, the code is unoptimized: first, the element is searched by the key, then the search is repeated to find the insertion position inside the 'emplace' function. Therefore, it is recommended to optimize the code using one of the methods described above.
Note N2
The diagnostic has two certainty levels. The first level is issued for move-only objects, i.e. when the user-defined type has no copy constructors/operators. This means that, in case of an unsuccessful insertion, the premature release of resources may happen. This is true for 'std::unique_ptr' and 'std::unique_lock', for example. Otherwise, the second certainty level is issued.
The diagnostic does not handle types that don't have the move constructor, because, in this case, the objects are copied.
This diagnostic is classified as:
V1099. Using the function of uninitialized derived class while initializing the base class will lead to undefined behavior.
The analyzer has detected the use of a non-static member function of a derived class while initializing the base class. According to the standard, such code leads to undefined behavior.
Example:
struct Base
{
Base(int);
};
struct Derived : public Base
{
int FuncFromDerived();
Derived() : Base(FuncFromDerived()) {} // <=
};The constructor of the 'Derived' structure calls the constructor of the 'Base' base class in the initialization list. At the same time, the result of the 'FuncFromDerived' function, which belongs to the derived structure, is passed as the constructor's argument. When an object of the'Derived' type is created, the initialization will be performed in the following order:
- The 'Derived::FuncFromDerived()' function call;
- The 'Base' constructor call;
- The 'Derived' constructor call.
As a result, a function will be called from a structure that has not been initialized. This violates the standard's rule:
Member functions (including virtual member functions, [class.virtual]) can be called for an object under construction.
Similarly, an object under construction can be the operand of the typeid operator ([expr.typeid]) or of a dynamic_cast ([expr.dynamic.cast]).
However, if these operations are performed in a ctor-initializer (or in a function called directly or indirectly from a ctor-initializer) before all the mem-initializers for base classes have completed, the program has undefined behavior.
This diagnostic is classified as:
|
V1100. Unreal Engine. Declaring a pointer to a type derived from 'UObject' in a class that is not derived from 'UObject' is dangerous. The pointer may start pointing to an invalid object after garbage collection.
The analyzer has detected a non-static class data member that was declared as a pointer to a type derived from 'UObject' inside a class/structure that is not derived from the 'UObject' type. The Unreal Engine garbage collector may destroy an object addressed by this pointer.
Here's a code example:
Class SomeClass
{
UObject *ptr;
};One of the key tools for memory management in Unreal Engine is automatic garbage collection based on reference counting. To do this, the Unreal Engine Reflection System monitors all classes derived from the 'UObject' class for strong references.
Strong references in Unreal Engine are:
- a pointer to a type derived from 'UObject', marked with the 'UPROPERTY()' attribute;
- a container of pointers to a type derived from 'UObject', marked with the 'UPROPERTY()' attribute;
- an instance of the 'TSharedObjectPtr' class template.
If a class that is not derived from 'UObject' contains a pointer to a type derived from 'UObject', then the garbage collector will not treat it as a strong reference and may delete the object at the wrong moment. In this case, the garbage collector will not update the pointer, and the pointer will become dangling.
To fix the problem, you need to determine the type of relationship between objects – ownership or observation – and select the right data member type.
Ownership. If the class can be derived from 'UObject', mark the pointer with the 'UPROPERTY()' attribute or use the 'TSharedObjectPtr' class template. Otherwise, replace the pointer with an object of the 'TSharedObjectPtr<....>' type:
// Approach N1
class SomeClass : public UObject
{
UPROPERTY()
UObject *ptr;
};
// Approach N2
Class SomeClass
{
TSharedObjectPtr<UObject> ptr;
};Observation. If the relationship does not imply ownership, replace the pointer with an object of the 'TWeakObjectPtr<....>' type:
Class SomeClass
{
TWeakObjectPtr<UObject> ptr;
};This diagnostic is classified as:
V1101. Changing the default argument of a virtual function parameter in a derived class may result in unexpected behavior.
The analyzer has detected a virtual function that has a parameter with a default argument. Default arguments are defined in the base and derived classes; their values are different. Changing the default argument of a virtual function parameter in this way is not an error, but it can lead to unexpected results when using these classes.
Take a look at the example:
struct Base
{
virtual void foo(int i = 0) const noexcept
{
std::cout << "Base::foo() called, i = " << i << std::endl;
}
};
struct Derived : Base
{
void foo(int i = 10) const noexcept override
{
std::cout << "Derived::foo() called, i = " << i << std::endl;
}
};In the 'Base' class, the 'foo' virtual function is defined with one 'i' parameter that has a default argument of '0'. In the 'Derived' class, which is derived from 'Base', the 'foo' virtual function is overridden and the default argument of the 'i' parameter is changed to '10'.
Let's see what issues such overriding may cause. Let's say we use the code as follows:
int main()
{
Derived obj;
Base *ptr = &obj;
ptr->foo();
}The 'main' function will return an unexpected string — "Derived::foo() called, i = 0". When forming the 'foo' function call, a compiler takes the static type of an object under the 'ptr' pointer — 'Base'. Therefore, the default argument of '0' from the base class is substituted in the function call. At the same time, the 'ptr' variable actually points to an object of the 'Derived' type. So, the virtual function from the derived class is executed.
To avoid this kind of behavior, we recommend using one of the following strategies:
- don't use default arguments in virtual functions;
- define the default argument of the virtual function parameter only in the base class.
Here's the correct example:
struct Base
{
virtual void foo(int i = 0) const noexcept
{
std::cout << "Base::foo() called, i = " << i << std::endl;
}
};
struct Derived : Base
{
void foo(int i) const noexcept override
{
std::cout << "Derived::foo() called, i = " << i << std::endl;
}
};Note. The analyzer does not issue any warnings for the following code:
struct Base
{
virtual void foo(int i = 0) const noexcept
{
std::cout << "Base::foo() called, i = " << i << std::endl;
}
};
struct Derived : Base
{
void foo(int i = 0) const noexcept override
{
std::cout << "Derived::foo() called, i = " << i << std::endl;
}
};However, we do not recommend writing such code because it is more difficult to maintain.
This diagnostic is classified as:
V1102. Unreal Engine. Violation of naming conventions may cause Unreal Header Tool to work incorrectly.
The analyzer has detected a declaration that does not comply with Naming Conventions for Unreal Engine projects. Compliance with the conventions is required for the correct operation of the Unreal Header Tool.
Note. The analyzer applies the diagnostic rule only to the analyzed files that include Unreal Engine header files. If you want to enforce the rule on an arbitrary file, use the mechanism.
The following is a list of conventions supported by the diagnostic rule.
Classes that inherit from 'UObject' are prefixed by 'U':
class USomeClass : public UObject
{
....
};Classes that inherit from 'AActor' are prefixed by 'A':
class ASomeActor : public AActor
{
....
};Classes that inherit from 'SWidget' are prefixed by 'S':
class SSomeWidget : public SWidget
{
....
};Classes that are abstract interfaces are prefixed by 'I':
class IAbstractClass
{
public:
virtual void DoSmth() = 0;
};Enumerations are prefixed by 'E':
enum class ESomeEnum
{
....
};Template classes are prefixed by 'T':
template <typename T>
class TClassTemplate
{
....
};Other classes are prefixed by 'F':
class FSimpleClass
{
....
};Typedefs should be prefixed by whatever is appropriate for that type. A typedef to a template instantiation should be prefixed as a particular entity:
// usings
using UGameUIPolicy = USomeClass;
using AAIController = ASomeActor;
using SActorCanvas = SSomeWidget;
using EColorBits = ESomeEnum;
using FArrowSlot = FSimpleClass;
template <typename T>
using TMyArray = TClassTemplate<T>;
using FMyArrayFloat = TClassTemplate<float>;
using FMyArrayInt = TMyArray<int>;
// typedefs
typedef USomeClass UGameUIPolicy;
typedef ASomeActor AAIController;
typedef SSomeWidget SActorCanvas;
typedef ESomeEnum EColorBits;
typedef FSimpleClass FArrowSlot;
typedef TClassTemplate<int> FMyArrayInt;
typedef TClassTemplate<float> FMyArrayFloat;The analyzer issues a warning for each violation of the above-listed conventions:
class GameUIPolicy: public UObject { .... };
class BoxActor : public AActor { .... };
class WidgetButton : public SWidget { .... };
class Weapon
{
public:
virtual void Shoot() = 0;
};
enum class Texture { .... };
class Enemy { .... };
template <typename T>
class DoubleLinkedList { .... };
typedef DoubleLinkedList<Enemy> EnemyList;The fixed code:
class UGameUIPolicy: public UObject { .... };
class ABoxActor : public AActor { .... };
class SWidgetButton : public SWidget { .... };
class IWeapon
{
public:
virtual void Shoot() = 0;
};
enum class ETexture { .... };
class FEnemy { .... };
template <typename T>
class TDoubleLinkedList { .... };
typedef DoubleLinkedList<Enemy> FEnemyList;V1103. The values of padding bytes are unspecified. Comparing objects with padding using 'memcmp' may lead to unexpected result.
The analyzer has detected a code fragment where structure objects containing padding bytes are compared.
Take a look at a synthetic example:
struct Foo
{
unsigned char a;
int i;
};
void bar()
{
Foo obj1 { 2, 1 };
Foo obj2 { 2, 1 };
auto result = std::memcmp(&obj1, &obj2, sizeof(Foo)); // <=
}Let's consider the memory layout of 'C' class objects to understand the core of the issue:
[offset 0] unsigned char
[offset 1] padding byte
[offset 2] padding byte
[offset 3] padding byte
[offset 4] int, first byte
[offset 5] int, second byte
[offset 6] int, third byte
[offset 7] int, fourth byteTo handle objects in memory correctly and efficiently, the compiler applies data alignment. For typical data models, the 'unsigned char' type alignment is 1 and the 'int' type alignment is 4. So, the address of the 'Foo::i' data member should be a multiple of 4. To do this, the compiler adds 3 padding bytes after the 'Foo::a' data member.
The C and C++ standards do not specify whether the padding bytes are zeroed out when the object is initialized. Therefore, if you try to compare two objects with the same data member values byte by byte using the 'memcmp' function, the result may not always be 0.
There are several ways to fix the issue.
Method N1 (preferred). Write a comparator and use it to compare objects.
For C:
struct Foo
{
unsigned char a;
int i;
};
bool Foo_eq(const Foo *lhs, const Foo *rhs)
{
return lhs->a == rhs->a && lhs->i == rhs->i;
}For C++:
struct Foo
{
unsigned char a;
int i;
};
bool operator==(const Foo &lhs, const Foo &rhs) noexcept
{
return lhs.a == rhs.a && lhs.i == rhs.i;
}
bool operator!=(const Foo &lhs, const Foo &rhs) noexcept
{
return !(lhs == rhs);
}Starting with C++20, we can simplify the code by requesting the compiler to generate the comparator itself:
struct Foo
{
unsigned char a;
int i;
auto operator==(const Foo &) const noexcept = default;
};Method N2. Zero out objects beforehand.
struct Foo
{
unsigned char a;
int i;
};
bool Foo_eq(const Foo *lhs, const Foo *rhs)
{
return lhs->a == rhs->a && lhs->i == rhs->i;
}
void bar()
{
Foo obj1;
memset(&obj1, 0, sizeof(Foo));
Foo obj2;
memset(&obj2, 0, sizeof(Foo));
// initialization part
auto result = Foo_eq(&obj1, &obj2);
}However, this method has disadvantages.
- Calling 'memset' introduces the overhead for zeroing out the entire memory area.
- Before calling 'memcmp', we should make sure that the memory for the object is zeroed out. This is easy to forget in a project with a complex control flow.
This diagnostic is classified as:
|
V1104. Priority of the 'M' operator is higher than that of the 'N' operator. Possible missing parentheses.
The analyzer has detected a potential error: the priority of bitwise shift operations is higher than the priority of '&', '|', and '^' bitwise operations. As a result, the expression may yield a completely different result than a programmer expected.
Let's take a look at an erroneous code example:
unsigned char foo(unsigned char byte2, unsigned char disp)
{
disp |= byte2 & 0b10000000 >> 6;
return disp;
}According to the operator precedence rules in C and C++, the expression is evaluated as follows:
( disp |= ( byte2 & ( 0b10000000 >> 6 ) ) )The bitwise shift of the '0b10000000' mask to the right looks suspicious in this case. Most likely, the programmer expected the result of the bitwise AND to shift by 6.
Here's the correct code:
unsigned char f(unsigned char byte2, unsigned char disp)
{
disp |= (byte2 & 0b10000000) >> 6;
return disp;
}The general recommendation: If the operator precedence in a complex expression is not clear, it is better to wrap part of the expression in parentheses (CERT EXP00-C, ES.41 CppCoreGuidelines). Even if the parentheses turn out to be redundant, it's okay. The code will be easier to understand and less prone to errors.
If you think the analyzer issued a false positive, you can either suppress it with the '//-V1104' comment or wrap the expression in parentheses:
// first option
disp |= byte2 & 0b10000000 >> 6; //-V1104
// second option
disp |= byte2 & (0b10000000 >> 6);This diagnostic is classified as:
|
V1105. Suspicious string modification using the 'operator+='. The right operand is implicitly converted to a character type.
The analyzer has detected a suspicious code fragment: a string variable of the 'std::basic_string' type is modified using the '+=' operator. At the same time, the right operand is an expression of arithmetic type. Due to implicit modifications that occur before the operator is called, the result may be unexpected.
Look at the example:
void foo()
{
std::string str;
str += 1000; // N1
str += ' ';
str += 4.5; // N2
str += ' ';
str += 400.52; // N3
}A developer wanted to build a string containing three numbers. However, the execution of this code results in the following:
- In the line N1, there is an implicit conversion from the 'int' to 'char' type. The result of this conversion depends on the signedness of the 'char' type and the version of the C++ standard. For example, there is an option to convert the '1000' constant to the '-24' value, which matches a character from the extended ASCII table.
- In the line N2, there is an implicit conversion from the 'double' to 'char' type. At first, the fractional part of the '4.5' number is discarded. Since the resulting value of '4' fits in the range of values of the 'char' type, the conversion results in a character with the ASCII code 4, which is a non-printable character.
- The line N3 contains undefined behavior. After discarding the fractional part of '400.52', the result doesn't fit in the range of values of the 'char' type (even if it's unsigned).
Note: despite the fact that both values, 1000 and 400.52, don't fit in 'char', the consequences of their conversion will be different. In the case of 1000 we are dealing with a narrow conversion. This code compiles but can be incorrect. While converting a floating-point number (400.52) to the 'char' type is undefined behavior according to the language standard.
In all such cases, it's necessary to use the appropriate functions for explicit conversion. For example, use the 'std::to_string' function to convert numbers to strings:
void foo()
{
std::string str;
str += std::to_string(1000);
str += ' ';
str += std::to_string(4.5);
str += ' ';
str += std::to_string(400.52);
}If a developer intends to add a character to a string using its numerical representation, the readability of such code definitely decreases. It's better to rewrite such code using a character literal containing either the required character or an escape sequence:
void foo()
{
std::string str;
// first option
str += '*';
// second option
str += '\x2A';
}The analyzer issues the following messages:
- the warning of High level, when the right operand is of real type;
- the warning of Medium level, when the right operand of integer type is discarded as a result of implicit conversion;
- the warning of Low level, when the right operand of the integer type, due to implicit conversion, remains with the same value and fits in the range of [0 ... 127] (characters from the non-expanded ASCII table).
V1106. Qt. Class inherited from 'QObject' should contain at least one constructor that takes a pointer to 'QObject'.
The analyzer has detected a class inherited from 'QObject' that does not contain any constructors that take a pointer to 'QObject' as a parameter.
Objects inherited from the 'QObject' type are organized in trees with parent-child relations. When another object is created, a pointer to the parent object is passed. In a parent object, the inherited object is added to the list of children. This ensures that when the parent object is deleted, all of its child objects are also deleted.
So, when writing your classes based on the Qt library, add an overload that takes a pointer to 'QObject' — that's a good coding practice. The analyzer issues a warning if it does not find a constructor that takes such a pointer.
Let's look at an example:
class MyCounter : public QObject
{
Q_OBJECT;
public:
MyCounter (int startValue);
};The 'MyCounter' class has no constructors that take pointers to 'QObject'. The fixed code may look like this:
class MyCounter : public QObject
{
Q_OBJECT;
public:
MyCounter (int startValue, QObject *parent = nullptr); // ok
};Note. Due to peculiarities of some projects, the analyzer does not issue the warning if it detects at least one constructor that takes a pointer to a parent object.
V1107. Function was declared as accepting unspecified number of parameters. Consider explicitly specifying the function parameters list.
The analyzer has detected a function declaration with an unspecified number of parameters and a call to it with a non-zero number of arguments. Such a call may indicate an error in code. Developers may have intended to call another function with a similar name.
In C, you can declare a function with an unspecified number of parameters:
void foo();It may appear that a function that takes no parameters is declared, as in C++. However, this is not the case. The following code compiles successfully:
void foo();
void bar()
{
foo("%d %d %d", 1, 2, 3); // No compiler checks
}When declaring the 'foo' function, the programmer could have expected one of the following behavior options.
Option N1. The 'foo' function was not supposed to take parameters, and the compiler should have issued an error. In such a case, if you work with standards prior to C23, the function declaration should contain the explicitly specified 'void' in the parameter list:
void foo(void);
void bar()
{
foo("%d %d %d", 1, 2, 3); // Compile-time error
}Option N2. The 'foo' function is variadic and can take a variable number of parameters. In such a case, explicitly specify an ellipsis ('...') when declaring the function.
void foo1(const char *, ...); // since C89
void foo2(...); // since C23
void bar()
{
foo1("%d %d %d", 1, 2, 3); // ok since C89
foo2("%d %d %d", 1, 2, 3); // ok since C23
}Note. Starting with C23, compilers should treat the following declarations as declarations of functions that do not take any parameters:
void foo(); // Takes no parameters
void bar(void); // Takes no parametersThe analyzer is aware of such behavior and does not issue warnings for such declarations since C23.
V801. Decreased performance. It is better to redefine the N function argument as a reference. Consider replacing 'const T' with 'const .. &T' / 'const .. *T'.
The analyzer detected a construct that can be optimized. An object of type class or structure is passed to a function. This object is passed by value but is not modified because there is the key word const. Perhaps you should pass this object using a constant reference in the C++ language or a pointer in the C language.
For example:
bool IsA(const std::string s)
{
return s == A;
}When calling this function, the copy constructor will be called for the std::string class. If objects are often copied this way, this may significantly reduce the application's performance. You may easily optimize the code by adding the reference:
bool IsA(const std::string &s)
{
return s == A;
}The analyzer doesn't output the message if it is a plain old data (POD) structure whose size is not larger than that of the size of pointer. Passing such a structure by reference won't give any performance gain.
References:
- Wikipedia. Reference (C++).
- Bjarne Stroustrup. The C++ Programming Language (Third Edition and Special Edition). 11.6 - Large Objects.
V802. On 32-bit/64-bit platform, structure size can be reduced from N to K bytes by rearranging the fields according to their sizes in decreasing order.
The analyzer detected a construct which can be optimized. There is a data structure in program code that might cause inefficient use of memory.
Let's examine a sample of such a structure the analyzer considers inefficient:
struct LiseElement {
bool m_isActive;
char *m_pNext;
int m_value;
};This structure occupies 24 bytes in 64-bit code because of data alignment. But if you change the field sequence, its size will be only 16 bytes. This is the optimized structure:
struct LiseElement {
char *m_pNext;
int m_value;
bool m_isActive;
};Of course, field rearrangement is not always possible or necessary. But if you use millions of such structures, it is reasonable to optimize memory being consumed. Additional reduction of structures' sizes may increase the application's performance because fewer memory accesses will be needed at the same number of items.
Note that the structure described above always occupies 12 bytes in a 32-bit program regardless of the field sequence. That is why the V802 message will not be shown when checking the 32-bit configuration.
Surely there might be opposite cases when you can optimize a structure's size in the 32-bit configuration and cannot do that in the 64-bit configuration. Here is a sample of such a structure:
struct T_2
{
int *m_p1;
__int64 m_x;
int *m_p2;
}This structure occupies 24 bytes in the 32-bit program because of the alignment. If we rearrange the fields as shown below, its size will be only 16 bytes.
struct T_2
{
__int64 m_x;
int *m_p1;
int *m_p2;
}It does not matter how fields are arranged in the 'T_2' structure in the 64-bit configuration: it will occupy 24 bytes anyway.
The method of reducing structures' sizes is rather simple. You just need to arrange fields in descending order of their sizes. In this case, fields will be arranged without unnecessary gaps. For instance, take this structure of 40 bytes in a 64-bit program:
struct MyStruct
{
int m_int;
size_t m_size_t;
short m_short;
void *m_ptr;
char m_char;
};By simply sorting the sequence of fields in descending order of their sizes:
struct MyStructOpt
{
void *m_ptr;
size_t m_size_t;
int m_int;
short m_short;
char m_char;
};we get a structure with the size of 24 bytes.
The analyzer does not always generate messages about inefficient structures because it tries to make unnecessary warnings fewer. For instance, the analyzer does not generate this warning for complex descendant classes since there are usually rather few of such objects. For example:
class MyWindow : public CWnd {
bool m_isActive;
size_t m_sizeX, m_sizeY;
char m_color[3];
...
};This structure's size may be reduced but it does not give your practical benefit.
V803. Decreased performance. It is more effective to use the prefix form of ++it. Replace iterator++ with ++iterator.
The analyzer detected a construct which may be optimized. An iterator is changed in the program code by the increment/decrement postfix operator. Since the previous iterator's value is not used, you may replace the postfix operator with the prefix one. In some cases, the prefix operator will work faster than the postfix one, especially in Debug-versions.
Example:
std::vector<size_t>::const_iterator it;
for (it = a.begin(); it != a.end(); it++)
{ ... }This code is faster:
std::vector<size_t>::const_iterator it;
for (it = a.begin(); it != a.end(); ++it)
{ ... }The prefix increment operator changes the object's state and returns itself already changed. The prefix operator in the iterator's class to handle std::vector might look as follows:
_Myt& operator++()
{ // preincrement
++_Myptr;
return (*this);
}The situation with the postfix increment operator is more complicated. The object's state must change but it is the previous state which is returned. So an additional temporary object is created:
_Myt operator++(int)
{ // postincrement
_Myt _Tmp = *this;
++*this;
return (_Tmp);
}If we want only to increment the iterator's value, it appears that the prefix version is preferable. So here you are one of the tips on micro-optimization of software: write "for (it = a.begin(); it != a.end(); ++it)" instead of "for (it = a.begin(); it != a.end(); it++)". In the latter case, an unnecessary temporary object is created, which reduces performance.
To study all these questions in detail, refer to the book by Scott Meyers "Efficient use of C++. 35 new recommendations on improving your programs and projects" (Rule 6. Distinguish between prefix increment and decrement operators) [1].
You may also study the results of speed measurements in the post "Is it reasonable to use the prefix increment operator ++it instead of postfix operator it++ for iterators?" [2].
References
- Meyers, Scott. More Effective C++: 35 New Ways to Improve Your Programs and Designs. Addison-Wesley, Reading, Mass., 1996. ISBN-10: 020163371X. ISBN-13: 9780201633719.
- Andrey Karpov. Is it reasonable to use the prefix increment operator ++it instead of postfix operator it++ for iterators? http://www.viva64.com/en/b/0093/
V804. Decreased performance. The 'Foo' function is called twice in the specified expression to calculate length of the same string.
The analyzer detected a construct which can be potentially optimized. Length of one and the same string is calculated twice in one expression. For length calculation such functions as strlen, lstrlen, _mbslen, etc. are used. If this expression is calculated many times or strings have large lengths, this code fragment should be optimized.
For optimization purposes, you may preliminary calculate the string length and place it into a temporary variable.
For example:
if ((strlen(directory) > 0) &&
(directory[strlen(directory)-1] != '\\'))Most likely, this code processes only one string and it does not need optimization. But if the code is called very often, we should rewrite it. This is a better version of the code:
size_t directoryLen = strlen(directory);
if ((directoryLen > 0) && (directory[directoryLen-1] != '\\'))Sometimes the V804 warning helps to detect much more crucial errors. Consider this sample:
if (strlen(str_1) > 4 && strlen(str_1) > 8)An incorrect variable name is used here. This is the correct code:
if (strlen(str_1) > 4 && strlen(str_2) > 8)V805. Decreased performance. It is inefficient to identify an empty string by using 'strlen(str) > 0' construct. A more efficient way is to check: str[0] != '\0'.
The analyzer detected a construct that can be optimized. To determine whether a code string is empty or not, the strlen function or some other identical function is used.
For example:
if (strlen(strUrl) > 0)This code is correct, but if it is used inside a long loop or if we handle long strings, such a check might be inefficient. To check if a string is empty or not, we just have to compare the first character of the string with 0. This is an optimized code:
if (strUrl[0] != '\0')Sometimes the V805 warning helps to detect excessive code. In one application we have found a code fragment like the following one:
string path;
...
if (strlen(path.c_str()) != 0)Most likely, this code appeared during careless refactoring when the type of the path variable had been changed from a simple pointer to std::string. This is a shorter and faster code:
if (!path.empty())V806. Decreased performance. The expression of strlen(MyStr.c_str()) kind can be rewritten as MyStr.length().
Analyzer found a construct which potentially can be optimized. The length of a string located in the container is calculated by using the strlen() function or by function similar to it. This operation is excessive, as the container possesses a special function for string length calculation.
Let's review this example:
static UINT GetSize(const std::string& rStr)
{
return (strlen(rStr.c_str()) + 1 );
}This code belongs to a real-life application. Usually such funny code fragments are created during careless refactoring. This code is slow and, even more, quite possibly even unnecessary. When it is required you can just write "string::length() + 1".
Nevertheless, if you are willing to create a special function for calculating the size of a null-terminated string, it should appear as follows:
inline size_t GetSize(const std::string& rStr)
{
return rStr.length() + 1;
}Remark
One should remember that "strlen(MyString.c_str())" and "MyString.length()" operations will not always generate the same result. The differences will appear in case a string contains null characters besides the terminal one. However such situations can be viewed as a very bad design practice, so the V806 warning message is a great reason to consider the possibility of refactoring. Even if the developer who created this code understands its' operational principles quite well, nevertheless it will be hard to understand this code for his colleagues. They will wonder about the purpose of such a style and could potentially replace the call to "strlen()" function with "length()", thus creating a bug in the program. So one should not be lazy and should replace it with such a code in which operational principles are clear and intelligible to even an outsider developer. For instance, if the string contains null characters, than there is a high probability that it is not a string at all but an array of bytes. An in such a case the std::vector or your own custom classes should be used instead.
V807. Decreased performance. Consider creating a pointer/reference to avoid using the same expression repeatedly.
The analyzer has detected code which can be optimized. The code contains homogeneous message chains intended to get access to some object.
The following constructs are understood by a message chain:
- Get(1)->m_point.x
- X.Foo().y
- next->next->Foo()->Z
If a message chain is repeated more than twice, perhaps you should consider code refactoring.
Look at this example:
Some->getFoo()->doIt1();
Some->getFoo()->doIt2();
Some->getFoo()->doIt3();If the 'getFoo()' function works slowly or if this code is placed inside a loop, you should rewrite this code. For example, you may create a temporary pointer:
Foo* a = Some->getFoo();
a->doIt1();
a->doIt2();
a->doIt3();Of course, it is not always possible to write it in this way. And moreover, such refactoring does not always give you a performance gain. There exist too many various alternatives, so we cannot give you any general recommendations.
But presence of message chains usually indicates careless code. To improve such code you can use several methods of refactoring:
V808. An array/object was declared but was not utilized.
The analyzer has detected a code that can be simplified. A function code contains local variables which are not used anywhere.
The analyzer generates this warning in the following cases:
- An object array is created but not used. It means that the function uses more stack memory than necessary. First, it may lead to a stack overflow. Second, it may reduce the efficiency of the microprocessor cache.
- Class objects are created but not used. The analyzer doesn't warn about all such objects, but only about those which certainly don't need to be created without using them. For instance, these are std::string or CString. Creation and destruction of such objects is just a waste of processor time and stack memory.
The analyzer doesn't generate the warning if variables of built-in types are created: the compiler handles this very well. It also helps to avoid a lot of false positives.
Consider this sample:
void Foo()
{
int A[100];
string B[100];
DoSomething(A);
}The array of items of the 'string' type is declared but not used, while it still requires memory to be allocated for it and calling constructors and destructors. To optimize this code, we just need to delete the declaration of the unused local variable or array. This is the fixed code:
void Foo()
{
int A[100];
DoSomething(A);
}V809. Verifying that a pointer value is not NULL is not required. The 'if (ptr != NULL)' check can be removed.
The analyzer has detected a code fragment that can be simplified. The 'free()' function and 'delete' operator handle the null pointer correctly. So we can remove the pointer check.
Here's an example:
if (pointer != 0)
delete pointer;The check is excess in this case, as the 'delete' operator processes the null pointer correctly. This is how to fix the code:
delete pointer;We cannot call this fix a true optimization, of course. But it allows us to delete an unnecessary string to make the code shorter and clearer.
There's only one case when the pointer check does have sense: when the 'free()' function or 'delete' operator are called VERY many times, and the pointer, at the same time, ALMOST ALWAYS equals zero. If user code contains the check, system functions won't be called. It will even reduce the run time a bit.
But in practice, a null pointer almost always indicates some error. If the program works normally, pointers won't equal zero in 99.99% of cases. That's why the check can be removed.
Note that this warning applies to other functions that correctly process the null pointer they received as an argument, for example, the 'CoTaskMemFree' function.
V810. Decreased performance. The 'A' function was called several times with identical arguments. The result should possibly be saved to a temporary variable, which then could be used while calling the 'B' function.
The analyzer has found some code that can be optimized. The code contains a call of a function which accepts as its arguments several calls of one and the same function with identical arguments.
Consider the following sample:
....
init(cos(-roty), sin(-roty),
-sin(-roty), cos(-roty));
....The call of such a function works slowly, while this effect will be intensified if this code fragment is placed inside a loop. You'd better rewrite this code. For instance, you may create a temporary variable:
....
double cos_r = cos(-roty);
double sin_r = sin(-roty);
init(cos_r, sin_r, -sin_r, cos_r);
....You cannot always change the code that way, of course. Moreover, this refactoring doesn't always guarantee that you get a performance gain. But such optimizations may be very helpful sometimes.
V811. Decreased performance. Excessive type casting: string -> char * -> string.
The analyzer has detected a code that can be optimized: the code contains an excessive operation when a 'std::string' object is created, and we can eliminate this.
We use the 'c_str()' function to take a pointer to a character array from the 'std::string' object. Then we construct a new object of the 'std::string' type from these characters. For instance, it can happen if the non-optimal expression is:
- a function call argument;
- an assignment operation operand;
- a 'return' operation operand.
Here is a sample for the case with a function call:
void foo(const std::string &s)
{
....
}
....
void bar()
{
std::string str;
....
foo(str.c_str());
}The code is very easy to improve: you just need to remove the call of the 'c_str()' method:
....
void bar()
{
std::string str;
....
foo(str);
}This is a sample of incorrect code for the case with an assignment operator:
std::string str;
....
std::string s = str.c_str();And this is an incorrect code for the 'return' operator:
std::string foo(const std::string &str)
{
....
return str.c_str();
}The errors in the last two cases are fixed in the same way as with the function call.
V812. Decreased performance. Ineffective use of the 'count' function. It can possibly be replaced by the call to the 'find' function.
The analyzer has detected a construct that can be optimized: a call of the 'count' or 'count_if' function from the standard library is compared to zero. A slowdown may occur here, as these functions need to process the whole container to count the number of the necessary items. If the value returned by the function is compared to zero, we are interested to know if there is at least 1 item we look for or if there are no such items at all. This operation may be done in a more efficient way by using calls of the 'find' or 'find_if' functions.
Here's an example of non-optimal code:
void foo(const std::multiset<int> &ms)
{
if (ms.count(10) != 0)
{
....
}
}To make it faster we need to replace the non-optimal expression with a similar one using a more appropriate function - 'find' in this case. This is the optimized code:
void foo(const std::multiset<int> &ms)
{
if (ms.find(10) != ms.end())
{
....
}
}The following code sample is also non-optimal:
void foo(const std::vector<int> &v)
{
if (count(v.begin(), v.end(), 10) != 0)
{
....
}
}Optimization can be done in the same way as in the previous example. This is what the optimized code will look like:
void foo(const std::vector<int> &v)
{
if (find(v.begin(), v.end(), 10) != v.end())
{
....
}
}V813. Decreased performance. The argument should probably be rendered as a constant pointer/reference.
The analyzer has detected a construct that can be optimized: an argument, which is a structure or a class, is passed into a function by value. The analyzer checks the body function and finds out that the argument is not modified. For the purpose of optimization, it can be passed as a constant reference. It may enhance the program's performance, as it is only the address that will be copied instead of the whole class object when calling the function. This optimization is especially noticeable when the class contains a large amount of data.
For example:
void foo(Point p)
{
float x = p.x;
float y = p.y;
float z = p.z;
float k = p.k;
float l = p.l;
.... 'p' argument is not used further in any way....
}This code is very easy to fix - you just need to change the function declaration:
void foo(const Point &p)
{
float x = p.x;
float y = p.y;
float z = p.z;
float k = p.k;
float l = p.l;
.... 'p' argument is not used further in any way....
}The analyzer doesn't generate the warning if structures are very small.
Note N1. The user can specify the minimal structure size starting with which the analyzer should generate its warnings.
For example, to prevent it from generating messages for structures whose size is equal to or less than 32 bytes, you can add the following comment into the code:
//-V813_MINSIZE=33The number 33 determines the structure size starting with which the analyzer will generate messages.
You can also write this comment in one of the global files (for example in StdAfx.h) so that it affects the whole project.
Default value: 17.
Note N2. The analyzer may make mistakes when trying to figure out whether or not a variable is being modified inside the function body. If you have noticed an obvious false positive, please send us the corresponding code sample for us to study it.
If the code is correct, you can turn off the false warning by adding the comment "//-V813".
V814. Decreased performance. The 'strlen' function was called multiple times inside the body of a loop.
The analyzer has detected a construct which can be optimized. Each loop's iteration calls the function strlen(S) or other similar function. The string 'S' is not changed; therefore, its length can be calculated beforehand. Sometimes you may get a significant performance boost due to this optimization.
Example 1.
for (;;) {
{
....
segment = next_segment + strlen("]]>");
....
}The length of the "]]>" string is being calculated multiple times in the loop. Though the string is short and the function strlen() works fast, you risk getting a slow-down for no obvious reason if the loop iterates millions of times. You can fix the defect in the following way:
const size_t suffixLen = strlen("]]>");
for (;;) {
{
....
segment = next_segment + suffixLen;
....
}Or rather use a macro like this:
#define LiteralStrLen(S) (sizeof(S) / sizeof(S[0]) - 1)
....
segment = next_segment + LiteralStrLen("]]>");If you work with C++, create a templated function:
template <typename T, size_t N>
char (&ArraySizeHelper(T (&array)[N]))[N];
template <typename T, size_t N>
size_t LiteralStrLen(T (&array)[N]) {
return sizeof(ArraySizeHelper(array)) - 1;
}
....
segment = next_segment + LiteralStrLen("]]>");Example 2.
for(j=0; j<(int)lstrlen(text); j++)
{
if(text[j]=='\n')
{
lines++;
}
}This code fragment counts the number of lines in a text and is taken from one real application.
If the text is large enough, the algorithm becomes quite inefficient. With each loop iteration, the program calculates the text length to compare it to the variable 'j'.
This is the optimized code:
const int textLen = lstrlen(text);
for(j=0; j<textLen; j++)
{
if(text[j]=='\n')
{
lines++;
}
}V815. Decreased performance. Consider replacing the expression 'AA' with 'BB'.
The analyzer has detected a construct that can be optimized: in string classes, operators are implemented that allow more efficient string clearing or checking a string for being empty.
For example:
bool f(const std::string &s)
{
if (s == "")
return false;
....
}This code can be improved a bit. The object of the 'std::string' class knows the length of the string it is storing, but it is unknown which string it is intended to be compared to. That's why a loop is called for string comparing. A much easier and better way is to simply check that the string length is 0 - it can be done with the help of the 'empty()' function:
if (s.empty())
return false;A similar situation: we need to clear a string in the code fragment below, and it can be improved:
wstring str;
...
str = L"";The better version:
wstring str;
...
str.clear();Note. The recommendations given are arguable. Such optimizations give little benefit, while the risk is increasing of making a typo and using a wrong function. The reason for that is poor function naming. For example, the 'empty()' function in the 'std::string' class checks the string for being empty. In the class 'CString', the 'Empty()' function clears the string. The same name for both but these functions do different things. That's why you may use the constructs = "", == "", != "" to make the code more comprehensible.
The choice is up to you. If you don't like the V815 diagnostic rule, you can turn it off in the settings.
V816. It is more efficient to catch exception by reference rather than by value.
The analyzer detected a construct that can be optimized. It is more efficient to catch exceptions by reference rather than by value: it will help avoid copying objects.
Consider the following example:
catch (MyException x)
{
Dump(x);
}This code can be improved a bit. In its original form, a new object of type MyException is created when catching the exception. It can be avoided by catching the exception by reference. It makes even more sense when the object is "heavy".
The fixed version of the code:
catch (MyException &x)
{
Dump(x);
}Catching exceptions by reference is good not only from the optimization's viewpoint; it helps avoid some other issues as well – for example slicing. However, discussion of these issues is beyond the scope of this diagnostic's description. Errors related to slicing are detected by diagnostic V746.
The pros of catching exceptions by reference are discussed in the following sources:
- Stack Overflow. C++ catch blocks - catch exception by value or reference?
- Stack Overflow. Catch exception by pointer in C++.
This diagnostic is classified as:
|
V817. It is more efficient to search for 'X' character rather than a string.
The analyzer detected a function that looks for a character in a string and can be optimized.
Consider the following example of inefficient code:
bool isSharpPresent(const std::string& str)
{
return str.find("#") != std::string::npos;
}In this code, it is better to use an overridden version of the 'find()' function that receives a character instead of a string.
Optimized code:
bool isSharpPresent(const std::string& str)
{
return str.find('#') != std::string::npos;
}The following example also uses inefficient code that can be optimized:
const char* GetSharpSubStr(const char* str)
{
return strstr(str, "#");
}In this code, it is better to use the function 'strchr()' to search for a character instead of a string:
const char* GetSharpSubStr(const char* str)
{
return strchr(str, '#');
}V818. It is more efficient to use an initialization list rather than an assignment operator.
The analyzer has detected that there is a constructor implemented in a suboptimal way and that the code performing member initialization could be optimized.
Consider the following example:
class UserInfo
{
std::string m_name;
public:
UserInfo(const std::string& name)
{
m_name = name;
}
};The 'm_name' member is first initialized as an empty string and only then is the string from the 'name' variable copied into it. In C++03, this will lead to additional memory allocation for the empty string. The least you can do to improve this code is to call the copy constructor immediately using an initialization list.
UserInfo(const std::string& name) : m_name(name)
{
}In C++11, you could go even farther. The next example shows how object UserInfo could be constructed:
std::string name = "name";
UserInfo u1(name); // 1 copy
UserInfo u2("name"); // 1 ctor, dtor + 1 copy
UserInfo u3(GetSomeName()); // 1 copyIf the strings are long enough to avoid Small String Optimization, this code will perform unnecessary memory allocation and copy operations. To avoid this, pass the argument by value:
UserInfo(std::string name) : m_name(std::move(name))
{
}After that, no unnecessary copies will be created by temporary values thanks to the move constructor.
std::string name = "name";
UserInfo u1(name); // 1 copy + 1 move
UserInfo u2("name"); // 1 ctor, dtor + 1 move
UserInfo u3(GetSomeName()); // 2 move
UserInfo u4(std::move(name)); // 2 moveV819. Decreased performance. Memory is allocated and released multiple times inside the loop body.
The analyzer has detected a construct that could be optimized. A memory block of the same size is allocated and released multiple times inside a loop body. To increase the program's performance, take the code performing memory allocation and release out of the loop into a separate code block.
Consider the following example:
for (int i = 0; i < N; i++)
{
int *arr = new int[1024 * 1024];
SetValues(arr);
val[i] = GetP(arr);
delete [] arr;
}Memory allocation and release can be taken out of the loop and implemented as a separate code block.
Improved code:
int *arr = new int[1024 * 1024];
for (int i = 0; i < N; i++)
{
SetValues(arr);
val[i] = GetP(arr);
}
delete [] arr;Similarly, the analyzer may suggest optimizing code where memory is allocated using function 'malloc' and the like.
V820. The variable is not used after copying. Copying can be replaced with move/swap for optimization.
The analyzer has detected a variable that is copied to another variable but is never used after that. Such code can be optimized by removing the unnecessary copy operation.
We will discuss a few examples of such code. Example 1:
class UserInfo
{
std::string m_name;
public:
void SetName(std::string name)
{
m_name = name;
}
};In this code, two copy operations take place: the first is executed when calling the 'SetName()' function; the second when copying 'name' to 'm_name'. You can eliminate the unnecessary copy operation by using a move assignment operator:
void SetName(std::string name)
{
m_name = std::move(name);
}If the object is not move assignable, change the signature of the 'SetName()' function by making the 'name' variable a constant reference. In this case, copying will be performed only when the assignment operation is executed.
void SetName(const std::string &name)
{
m_name = name;
}Example 2:
bool GetUserName(int id, std::string &outName)
{
std::string tmp;
if (db->GetUserName(id, tmp))
{
outName = tmp;
return true;
}
return false;
}This code contains local variable 'tmp', which is copied to 'outName' and is not used after that. From the performance viewpoint, using 'move' or 'swap' is more preferable.
bool GetName(int id, std::string &outName)
{
std::string tmp;
if (db->GetUserName(id, tmp))
{
outName = std::move(tmp);
return true;
}
return false;
}Example 3:
void Foo()
{
std::vector<UserInfo> users = GetAllUsers();
{
std::vector<UserInfo> users1 = users;
DoSomethingWithUsers1(users1);
}
{
std::vector<UserInfo> users2 = users;
DoSomethingWithUsers2(users2);
}
}Copying can sometimes be replaced with a reference if the previous solution (swap/move) is not available to some class. This might not be the neatest solution, but it is certainly a faster one.
void Foo()
{
std::vector<UserInfo> users = GetAllUsers();
{
std::vector<UserInfo> users1 = users;
DoSomethingWithUsers1(users1);
}
{
std::vector<UserInfo> &users2 = users;
DoSomethingWithUsers2(users2);
}
}V821. The variable can be constructed in a lower level scope.
The analyzer has detected a variable that could be created in a lower level scope. By changing the scope of an object, you can optimize the code's performance and memory consumption.
For example, when you allocate memory for a large array or create a "heavy" class object, and want this variable to be used only when a certain condition is met, it is better to place it in the block of a conditional statement.
Consider the following example:
void SetToolInfoText(ToolInfo &info, int nResource, int nItem)
{
Text data(80); // <=
if (nResource)
{
info.text = GetResource(nResource);
}
else
{
GetDataForItem(data, nItem);
info.text = data.text();
}
}It is better to construct the 'data' object only in the 'else' branch.
Improved code:
void SetToolInfoText(ToolInfo &info, int nResource, int nItem)
{
if (nResource)
{
info.text = GetResource(nResource);
}
else
{
Text data(80); // <=
GetDataForItem(data, nItem);
info.text = data.test();
}
}This diagnostics also detects cases of dynamic memory allocation that could be optimized by moving it to a lower level scope, for example:
void func(bool condition)
{
int *arr = new int[1000];
if (condition)
{
use(arr);
}
delete[] arr;
}It is better to allocate (and free) memory only if the condition is true.
Improved code:
void func(bool condition)
{
if (condition)
{
int *arr = new int[1000];
use(arr);
delete[] arr;
}
}Note that the analyzer tries to issue this warning only when moving a variable to a lower level scope gives a significant performance or memory gain. For this reason, the warning is not triggered by single variables of base types and objects created by the constructor without arguments (as tests show, this diagnostic almost always produces false positives in these cases).
This diagnostic is classified as:
|
V822. Decreased performance. A new object is created, while a reference to an object is expected.
The analyzer has detected an issue where a new object is created instead of a reference to an already existing object. The creation of an unnecessary object takes up some amount of time and memory.
Consider the following example, where a variable is cast to a reference in the right part of the expression while it is not declared as a reference in the left part:
auto test = static_cast<NotPOD &>(npod);The right part of this expression contains a cast to a reference of type NotPOD, but no such cast is found in the left part. This results in copying the object instead of passing it by reference.
There are two ways to fix this code. The first is to replace auto with decltype(auto):
decltype(auto) test = static_cast<NotPOD &>(npod);The '&' qualifier will now be deduced according to the right part, but this solution is too lengthy, so it would be better to just add the qualifier manually:
auto &test = static_cast<NotPOD &>(npod);If you really wanted the object to be copied, you should remove the qualifier from the right part to make the code easier to read:
auto test = static_cast<NotPOD>(npod);V823. Decreased performance. Object may be created in-place in a container. Consider replacing methods: 'insert' -> 'emplace', 'push_*' -> 'emplace_*'.
The analyzer has detected a potentially inefficient method. When inserting a temporary object into a container using the methods 'insert' / 'push_*', the object is constructed outside the container and then moved/copied into the container.
On the other hand, the 'emplace' / 'emplace_*' methods allow you to eliminate the extra call of the move/copy constructor and create the object "in place" inside the container instead, perfectly passing the function's parameters to the constructor.
The analyzer suggests the following replacements:
- insert -> emplace
- insert_after -> emplace_after
- push_back -> emplace_back
- push_front -> emplace_front
Example of inefficient code:
std::string str { "Hello, World" };
std::vector<std::string> vec;
std::forward_list<std::string> forward_list;
std::list<std::string> list;
std::map<std::string, std::string> map;
....
vec.push_back(std::string { 3, 'A' });
forward_list.push_front(std::string { str.begin(), str.begin() + 6 });
list.push_front(str.substr(7));
list.push_back(std::string { "Hello, World" });
map.insert(std::pair<std::string, std::string> { "Hello", "World" });Optimized version:
std::vector<std::string> vec;
std::forward_list<std::string> forward_list;
std::list<std::string> list;
std::map<std::string, std::string> map;
....
vector.emplace_back(3, 'A');
forward_list.emplace_front(string.begin(), string.begin() + 6);
list.emplace_front(str.begin() + 7, str.end());
list.emplace_back("Hello, World");
map.emplace("Hello", "World");In some cases such a replacement can lead to the loss of the base guarantee of exceptions security. Let's consider the example:
std::vector<std::unique_ptr<int>> vectUniqP;
vectUniqP.push_back(std::unique_ptr<int>(new int(0)));
auto *p = new int(1);
vectUniqP.push_back(std::unique_ptr<int>(p));In this case, the 'push_back' replacement for 'emplace_back' can lead to memory leak if 'emplace_back' throws the exception due to memory absence. The analyzer doesn't issue warnings for such cases and doesn't suggest a replacement. If the code is changed for the erroneous one, the analyzer will issue the V1023 warning.
Sometimes replacing calls to 'insert' / 'push_*' with their 'emplace' / 'emplace_*' counterparts is not optimizing:
std::string foo()
{
std::string res;
// doing some heavy stuff
return res;
}
std::vector<std::string> vec;
....
vec.push_back(foo());In this example, the 'emplace_back' method will be as efficient as inserting the element using 'push_back'. However, the warning will be still issued for the sake of consistency. In all such cases, it will be sensible to make the replacement to keep the code consistent and avoid the reviewer's having to decide if 'emplace*' should be used or not each time they read the code. If you do not agree with this approach, you can view such warnings as false positives and suppress them.
Note. The recommendation described here should be approached reasonably, not formally. For example, replacing
widgets.push_back(Widget(foo, bar, baz));
// with
widgets.emplace_back(Widget(foo, bar, baz));does not give any gain in the speed of the program. Moreover, using 'emplace_back' can slow down the code compilation speed. For more information, see the article "Don't blindly prefer emplace_back to push_back". Our team would like to thank Arthur O'Dwyer for this publication.
V824. It is recommended to use the 'make_unique/make_shared' function to create smart pointers.
The analyzer recommends that you create a smart pointer by calling the 'make_unique' / 'make_shared' function rather than by calling a constructor accepting a raw pointer to the resource as a parameter.
Using these functions has the following advantages:
- the code is made clearer by removing explicit calls of the 'new' operator for dynamic allocations (smart pointers in themselves remove explicit calls of the 'delete' operator);
- better security in case of exception;
- optimized object allocation.
Consider the following example:
void foo(std::unique_ptr<int> a, std::unique_ptr<int> b)
{
....
}
void bar()
{
foo( std::unique_ptr<int> { new int { 0 } },
std::unique_ptr<int> { new int { 1 } });
}Since the standard does not define a evaluation order of function arguments, the compiler may choose the following order for the sake of optimization:
- Call 'new int { 0 }'
- Call 'new int { 1 }'
- The first call of the 'std::unique_ptr<int>' constructor
- The second call of the 'std::unique_ptr<int>' constructor
Now, if the second call of 'new' throws an exception, a memory leak will occur as the resource allocated by the first call of 'new' will never be freed. Using the 'make_unique' function to create the pointer helps solve this problem by guaranteeing the freeing of memory if an exception occurs.
Optimized version:
void foo(std::unique_ptr<int> a, std::unique_ptr<int> b)
{
....
}
void bar()
{
foo( std::make_unique<int>(0), std::make_unique<int>(1));
}The C++17 standard, while still not specifying the exact evaluation order for arguments, provides additional guarantees. All side effects of a function argument must be evaluated before the next argument is evaluated. This helps mitigate the risk in case of exceptions, but it is still preferable to use 'make_unique'.
One thing should be noted about the 'make_shared' function. When it is used, the pointer's control block is allocated next to the managed object. This helps reduce the number of dynamic allocations and optimize the use of the CPU cache.
The object gets deleted when the reference counter reaches zero, but the control block exists as long as there are existing weak references to the pointer. If both the control block and the managed object were created using the 'make_shared' function (i.e. allocated in the same memory block), the program will not be able to deallocate that memory as long as the reference counter is at zero and there is at least one 'weak_ptr' to the object. This may be unwanted behavior with large objects. If you intentionally avoid using the 'make_shared' function to avoid having both the control block and the object getting allocated in the same memory block, you can suppress the warning.
There is a restriction concerning the use of different versions of the C++ standard: as the functionality of 'make_unique' and 'make_shared' has changed several times since C++11, the diagnostic's behavior depends on the standard's version as follows:
- C++11: the analyzer suggests replacing object allocation and subsequent passing to the 'shared_ptr' constructor with the 'make_shared' function.
- C++14 or higher: the analyzer additionally suggests replacing allocation of a single object or array of objects with the 'make_unique' function.
- C++20 or higher: the analyzer additionally suggests replacing the 'shared_ptr' constructor with the 'make_shared' function for arrays of objects as well.
V825. Expression is equivalent to moving one unique pointer to another. Consider using 'std::move' instead.
The analyzer has detected a code fragment where the functions 'std::unique_ptr::reset' and 'std::unique_ptr::release' are used together.
Consider the following simple example:
void foo()
{
auto p = std::make_unique<int>(10);
....
std::unique_ptr<int> q;
q.reset(p.release());
....
}Technically, this call is equivalent to moving a smart pointer:
void foo()
{
auto p = std::make_unique<int>(10);
....
auto q = std::move(p);
....
}Here, replacing the call chain 'q.reset(p.release())' with the 'q = std::move(p) ' expression, as suggested by the analyzer, would make the code more transparent. However, sometimes moving a smart pointer is necessary – for example, when using a user-defined deleter:
class Foo { .... };
struct deleter
{
bool use_free;
template<typename T>
void operator()(T *p) const noexcept
{
if (use_free)
{
p->~T();
std::free(p);
}
else
{
delete p;
}
}
};Here are two examples. The first one demonstrates using the 'reset' – 'release' pattern to move a smart pointer with a user-defined deleter:
void bar1()
{
std::unique_ptr<Foo, deleter> p { (int*) malloc(sizeof(Foo)),
deleter { true } };
new (p.get()) Foo { .... };
std::unique_ptr<Foo, deleter> q;
q.reset(p.release()); // 1
}The second example demonstrates doing the same operation using the 'std::move' function:
void bar2()
{
std::unique_ptr<Foo, deleter> p { (int*) malloc(sizeof(Foo)),
deleter { true } };
new (p.get()) Foo { .... };
std::unique_ptr<Foo, deleter> q;
q = std::move(p); // 2
}In the second example, while moving the 'p' pointer to 'q', the 'std::move' function allows moving the deleter as well. This would not be possible using the 'q.reset(p.release())' call chain in the first example. Instead, the source object of type 'Foo' allocated on the heap by calling 'malloc' and constructed by the 'placement new' operator would be incorrectly freed by calling the 'delete' operator. That would inevitably result in undefined behavior.
V826. Consider replacing standard container with a different one.
The analyzer has detected a standard C++ library container that can be replaced with another one for optimization.
To determine which container type will suit better in a given case, heuristics are used based on what operations are performed on the container. The analyzer also calculates algorithmic complexity of all the operations and suggests a container whose algorithmic complexity is lowest.
The warning message will briefly describe the reason for suggesting the replacement:
- "The size is known at compile time" – the container's size is known at compile time, so it can be replaced with a static array (std::array).
- "Elements are added, read and erased only from front/back" – the container implements a LIFO queue, so it can be replaced with 'std::stack'.
- "Elements are added to front/back, read and erased from the opposite side" – the container implements a FIFO queue, so it can be replaced with 'std::queue'.
- "Insertion and removal of elements occur at either side of the container" – elements are added or removed at either head or tail of the container. In this case, 'std::deque' or 'std::list' will be an efficient substitute.
- "Insertions occur at the front side, and the container is traversed forward" – elements are added only to the beginning of the container and the container is traversed forward. In this case, it is used as 'std::forward_list'.
- "Insertions occur at the back side, and the container is traversed" – elements are added only to the end of the container and the container is traversed in any direction. In this case, 'std::vector' will be the most efficient substitute.
- "Contiguous placement of elements in memory can be more efficient" – using 'std::vector' may enhance performance due to contiguous placement of elements in memory without increasing algorithmic complexity.
- "Increased overall efficiency of operations" – the container type was chosen based on statistical analysis.
Consider the following example:
void f()
{
std::vector<int> v;
v.push_back(1);
v.push_back(2);
v.push_back(3);
for (auto value : v)
{
std::cout << value << ' ';
}
}The analyzer issues the following message:
V826. Consider replacing the 'v' std::vector with std::array. The size is known at compile time.
The vector's size is known at compile time. We can use 'std::array' instead to avoid dynamic allocation. Optimized version:
void f()
{
std::array a{1, 2, 3};
}The analyzer will not suggest the replacement if the total size of the vector's elements exceeds 16 Kbytes or if the vector is passed to the function or returned from it or passed as an argument to another function.
In the following example, the analyzer will keep silent even though the container's size is known at compile time:
std::vector<int> f()
{
std::vector<int> v;
v.push_back(1);
v.push_back(2);
v.push_back(3);
return v;
}Another example of code that can be optimized:
void f(int n)
{
std::vector<int> v;
for (int i = 0; i < n; ++i)
{
v.push_back(i);
}
for (int i = 0; i < n; ++i)
{
std::cout << v.back() << ' ';
v.pop_back();
}
}The analyzer issues the following message:
V826. Consider replacing the 'v' std::vector with std::stack. Elements are added, read and erased only from front/back.
In this case, elements are added at the end of the vector, then read sequentially and removed. The vector is used as 'std::stack', so it can be replaced with this type of container. Optimized version:
void f(int n)
{
std::stack<int> v;
for (int i = 0; i < n; ++i)
{
v.push(i);
}
for (int i = 0; i < n; ++i)
{
std::cout << v.top() << ' ';
v.pop();
}
}Another example of code that can be optimized:
void f(int n)
{
std::deque<int> d;
for (int i = 0; i < n; i++)
{
d.push_back(i);
}
for (auto value : d)
{
std::cout << value << ' ';
}
}The analyzer issues the following message:
V826. Consider replacing the 'd' std::deque with std::vector. Contiguous placement of elements in memory can be more efficient.
In this case, 'std::deque' and 'std::vector' are equivalent substitutes in terms of algorithmic complexity. However, in a vector, the elements will be placed sequentially, which may help increase performance since sequential memory access enables more efficient use of the CPU cache. Optimized version:
void f(int n)
{
std::vector<int> d;
for (int i = 0; i < n; i++)
{
d.push_back(i);
}
for (auto value : d)
{
std::cout << value << ' ';
}
}V827. Maximum size of a vector is known at compile time. Consider pre-allocating it by calling reserve(N).
The analyzer has detected an 'std::vector' whose maximum size is known at compile time and the 'reserve' method is not called before filling it.
Consider the following example:
void f()
{
std::vector<int> v;
v.push_back(1);
v.push_back(2);
v.push_back(3);
v.push_back(4);
v.push_back(5);
v.push_back(6);
}In this case, the calls to 'push_back' may lead to reallocating the vector's internal buffer and moving the elements to a new memory block.
To reduce the overhead, we could have a buffer of an appropriate size pre-allocated:
void testVectOK()
{
std::vector<int> v;
v.reserve(6);
v.push_back(1);
v.push_back(2);
v.push_back(3);
v.push_back(4);
v.push_back(5);
v.push_back(6);
}The analyzer's warning includes the number of elements to pass to the 'reserve' method.
It is sometimes impossible for the analyzer to calculate the exact size of the container. This happens, for example, when elements are added based on a condition:
void f(bool half)
{
std::vector<int> v;
v.push_back(1);
v.push_back(2);
v.push_back(3);
if (!half)
{
v.push_back(4);
v.push_back(5);
v.push_back(6);
}
}Here, the number of elements in the container can be either 3 or 6 depending on the condition. In cases like that, the analyzer will suggest the maximum size possible.
V828. Decreased performance. Moving an object in a return statement prevents copy elision.
The analyzer has detected an issue where a local variable, a function parameter or a temporary object is returned from a function by calling 'std::move'.
Consider the following contrived example:
struct T { .... };
T foo()
{
T t;
// ....
return std::move(t);
}This code may seem better optimized as the move constructor is guaranteed to be called first, but this is really a misconception. The use of 'std::move' in the context of the return expression will prevent the analyzer from deleting the call to the copy / move constructor (copy elision, C++17) and applying the RVO/NRVO to local objects.
Before the move semantics was introduced (in C++11), compilers would try to do the so called [Named] Return Value Optimization (RVO/NRVO) without calling the copy constructor so that the return object was created directly on the stack of the caller function and then initialized by the callee function.
The compiler can do this optimization only if the return type of the function is a non-reference while the operand of the 'return' statement is the name of a local non-'volatile' variable and its type is the same as the return type of the function (ignoring the 'const' / 'volatile' qualifier).
Starting with C++11, when returning a local non-'volatile' variable, the compiler will try to apply the RVO/NRVO, then the move constructor, and only then the copy constructor. Therefore, the following code is slower than expected:
struct T { .... };
T foo()
{
T t;
// ....
return std::move(t); // <= V828, pessimization
}In the case of a non-'volatile' formal parameter, the compiler cannot apply the RVO/NRVO due to technical reasons, but it will try to call the move constructor first and then the copy constructor. Therefore, the following code contains a redundant 'std::move' function call, which can be omitted:
struct T { .... };
T foo(T param)
{
T t;
// ....
return std::move(param); // <= V828, redundant 'std::move' call
}Also, starting with C++17, if the return expression is a prvalue (for example, the result of calling a function that returns a non-reference value), the compiler must optimize the code by deleting the call to the copy / move constructor (copy elision). Therefore, the following code is slower than expected:
struct T { .... };
T bar();
T foo()
{
return std::move(bar()); // <= V828, pessimization
}In all cases presented, it's recommended to remove the 'std::move' function call in order to optimize the code, or to omit the redundant one.References:
- C++20 (working draft N4860), 11.10.5
- C++ Core Guidelines F.48: Do not return std::move(local)
V829. Lifetime of the heap-allocated variable is limited to the current function's scope. Consider allocating it on the stack instead.
This diagnostic rule is based on the R.5 CppCoreGuidelines rule (Prefer scoped objects, don't heap-allocate unnecessarily).
Storage for a local variable is allocated dynamically and deallocated before execution leaves the function. In this case, it is better to stack-allocate the variable to avoid the overhead due to memory allocation and deallocation.
Consider the following example:
class Object { .... };
void DoSomething()
{
auto obj = new Object;
....
delete obj;
}Since the variable exists only within the current scope, allocation can be avoided in most cases.
Fixed version:
void DoSomething()
{
Object obj;
....
}The warning is not issued if the previously allocated storage is not deallocated or if the address leaks outside. The following snippet demonstrates returning a pointer using a function's output parameter:
void DoSomething(Object** ppObj)
{
auto obj = new Object;
if (obj->good())
{
*ppObj = obj;
return;
}
delete obj;
}V830. Decreased performance. Consider replacing the use of 'std::optional::value()' with either the '*' or '->' operator.
The analyzer has detected a block of code where the 'std::optional::value()' method is used to access the contents of an 'std::optional' object that is known to have been initialized.
Consider the following contrived example:
inline void LuaBlockLoader::loadColorMultiplier(
BlockState &state, const sol::table &table) const
{
std::optional<sol::table> colorMultiplier = table["color_multiplier"];
if (colorMultiplier != std::nullopt) {
state.colorMultiplier(gk::Color{
colorMultiplier.value().get<u8>(1),
colorMultiplier.value().get<u8>(2),
colorMultiplier.value().get<u8>(3),
colorMultiplier.value().get<u8>(4)
});
}
}This method adds an overhead for checking the contents: if an object of class 'std::optional' is found to be equal to 'std::nullopt', an 'std::bad_optional_access' exception will be thrown. If the object is known to be already initialized, the code can be simplified and speeded up by using the overloaded operator 'std::optional::operator*' or 'std::optional::operator->':
inline void LuaBlockLoader::loadColorMultiplier(
BlockState &state, const sol::table &table) const
{
std::optional<sol::table> colorMultiplier = table["color_multiplier"];
if (colorMultiplier != std::nullopt) {
state.colorMultiplier(gk::Color{
colorMultiplier->get<u8>(1),
colorMultiplier->get<u8>(2),
colorMultiplier->get<u8>(3),
colorMultiplier->get<u8>(4)
});
}
}V831. Decreased performance. Consider replacing the call to the 'at()' method with the 'operator[]'.
The analyzer has detected a block of code where an element of a sequence container (std::array, std::vector, or std::deque) is accessed using the 'at' method, with the index known to be valid.
The 'at' method returns a reference to the container element specified by the index. Before doing so, the method checks if the index is within the container's bounds and generates an 'std::out_of_range' exception if it is not. If the index is already known to be within the container's bounds, the call to the 'at' method can be safely replaced with a call to 'operator[]', which does not perform such additional checks. Removing the unnecessary check will help increase the code's performance.
Consider the following example:
std::vector<std::string> namelessIds;
....
if (!namelessIds.empty()) {
LIST<char> userIds(1);
for (std::string::size_type i = 0; i < namelessIds.size(); i++) {
userIds.insert(mir_strdup(namelessIds.at(i).c_str())); // <=
}
....
}When iterating over the vector elements in the loop, the incrementing index cannot become larger than the number of the last element. Thus, the code can be simplified by replacing 'at' with square brackets:
std::vector<std::string> namelessIds;
....
if (!namelessIds.empty()) {
LIST<char> userIds(1);
for (std::string::size_type i = 0; i < namelessIds.size(); i++) {
userIds.insert(mir_strdup(namelessIds[i].c_str()));
}
....
}V832. It's better to use '= default;' syntax instead of empty body.
If special functions are declared with '= default', a class can be trivially copied. This might help to copy and initialize such a class in a more optimized way.
Rules for forming special functions are complicated. Therefore, when writing classes/structures it's best to explicitly define some of them for better understanding of code. Here are examples of such special functions: default constructor, copy constructor, copy operator, destructor, move constructor, move operator.
struct MyClass
{
int x;
int y;
MyClass() {}
~MyClass() {}
};or this way:
// header
struct MyClass
{
int x;
int y;
};
// cpp-file
MyClass::MyClass() {}
MyClass::~MyClass() {}In the example, we see a default constructor and destructor. A developer defines such functions with an empty body. However, this way a class can become nontrivially copied. Due to this, the compiler will not always be able to generate more optimized code. Therefore, C++11 introduces '= default' for special functions.
struct MyClass
{
int x;
int y;
MyClass() = default;
~MyClass() = default;
};The compiler will generate both bodies of special functions and deduce 'constexpr' and 'noexcept' specifiers for them automatically.
Note that when you move special functions from the class body, the compiler considers them user-defined. This might lead to pessimization, so it's best to add '= default' directly in the class body if possible.
You will not get the warning if:
- the standard used is below C++11;
- the constructor has an initialization list;
- the class does not contain non-static fields.
Note about the PIMPL idiom
Large class definitions inside a header file can multiply the project compilation time. To shorten it, you can put the class implementation in a separate compiled file. This means only the method declarations and a pointer to the class implementation will remain in the header file. This approach is called PIMPL. Here is an example of such a class:
#include <memory>
// header
class MyClass
{
class impl;
std::unique_ptr<impl> pimpl;
public:
void DoSomething();
~MyClass();
};
// cpp-file
class MyClass::impl
{
public:
impl()
{
// does nothing
}
~impl()
{
// does nothing
}
void DoSomething()
{
// ....
}
};
void MyClass::DoSomething()
{
pimpl->DoSomething();
}
MyClass::~MyClass() {}The destructor of the 'MyClass::impl' class is needed for 'std::unique_ptr', but is unknown at this stage. So if you add '= default' to the destructor in the class body, you will get compilation errors. With this approach, special functions will be implemented in a compiled file.
When you move the definition of special functions from the class body, their empty bodies can also be replaced with '= default'. This will not increase performance, but it will make the code cleaner and easier to understand:
MyClass::~MyClass() = default;V833. Using 'std::move' function's with const object disables move semantics.
The analyzer detected a situation when move semantics does not work. Such code slows down the performance.
- The 'std::move' function may have received an lvalue reference to a const object as an argument.
- The 'std::move' function's result may have been passed to a function that takes an lvalue reference to a const as a parameter.
Example:
#include <string>
#include <vector>
void foo()
{
std::vector<std::string> fileData;
const std::string alias = ....;
....
fileData.emplace_back(std::move(alias));
....
}This code does not work as the developer expects. Move semantics is impossible for const-qualified objects. As a result, the compiler calls a copy constructor for 'std::string' and the expected optimization does not happen.
To fix this code, you can remove the 'const' keyword from the 'alias' local variable:
#include <string>
#include <vector>
void foo()
{
std::vector<std::string> fileData;
std::string alias = ....;
....
fileData.emplace_back(std::move(alias));
....
}The diagnostic also issues a warning when 'std::move' is used on a function's formal parameter:
#include <string>
void foo(std::string);
void bar(const std::string &str)
{
....
foo(std::move(str));
....
}There's no universal way to fix such code, but the approaches below could help.
Approach 1
Add a function overload that takes an rvalue reference:
#include <string>
void foo(std::string);
void bar(const std::string &str)
{
....
foo(str); // copy here
....
}
void bar(std::string &&str) // new overload
{
....
foo(std::move(str)); // move here
....
}Approach 2
Rewrite the function to make it a function template that takes a forward reference. Limit the template parameter to the required type. Then apply the 'std::forward' function to the template argument:
#include <string>
#include <type_traits> // until C++20
#include <concepts> // since C++20
void foo(std::string);
// ------------ Constraint via custom trait (since C++11) ------------
template <typename T>
struct is_std_string
: std::bool_constant<std::is_same<std::decay_t<T>,
std::string>::value>
{};
template <typename T,
std::enable_if_t<is_std_string<T>::value, int> = 0>
void bar(T &&str)
{
....
foo(std::forward<T>(str));
....
}
// -------------------------------------------------------------------
// ------------ Constraint via custom trait (since C++14) ------------
template <typename T>
static constexpr bool is_std_string_v =
std::is_same<std::decay_t<T>, std::string>::value;
template <typename T, std::enable_if_t<is_std_string_v<T>, int> = 0>
void bar(T &&str)
{
....
foo(std::forward<T>(str));
....
}
// -------------------------------------------------------------------
// ------------------ Constraint via C++20 concept -------------------
template <typename T>
void bar(T &&str) requires std::same_as<std::remove_cvref_t<T>,
std::string>
{
....
foo(std::forward<T>(str));
....
}
// -------------------------------------------------------------------Approach 3
If the above - or any other - approaches are not applicable, remove the 'std::move' call.
The diagnostic rule also fires when the 'std::move' function's result is passed to a function that takes an lvalue reference to a const. Example:
#include <string>
std::string foo(const std::string &str);
void bar(std::string str, ....)
{
....
auto var = foo(std::move(str));
....
}Although 'std::move' is executed and returns an xvalue object, that object is still copied and not moved. This happens because the function's formal parameter is an lvalue reference to a const. In this case, the result of the 'std::move' call falls within the context where a move constructor call is impossible. However, if you write a new function overload, that takes an rvalue reference, or a function template with a forwarding reference - the compiler will choose that entity and will execute the code as you expect:
#include <string>
std::string foo(const std::string &str);
std::string foo(std::string &&str);
void bar(std::string str, ....)
{
....
auto var = foo(std::move(str));
....
}Now let's examine the case when 'std::move' can be applied to a reference to a const and works correctly:
template <typename T>
struct MoC
{
MoC(T&& rhs) : obj (std::move(rhs)) {}
MoC(const MoC& other) : obj (std::move(other.obj)) {}
T& get() { return obj; }
mutable T obj;
};The code above is the MoC (Move on Copy) idiom implementation. The copy constructor moves the object. In this case, it is possible because the non-static data member 'obj' has the 'mutable' specifier and tells the compiler explicitly to process this object as a non-const object.
V834. Incorrect type of a loop variable. This leads to the variable binding to a temporary object instead of a range element.
The analyzer detected implicit copying of container elements at each iteration of the loop. The developer assumed that the loop variable of the reference type would bind to the elements of the container without copying. This happens because loop variable types don't match container elements.
Look at the example:
void foo(const std::unordered_map<int, std::string>& map)
{
for (const std::pair<int, std::string> &i : map)
{
std::cout << i.second;
}
}In this fragment, the developer wanted to go through all elements of the 'std::unordered_map' container in the loop and print the values to the output stream. However, the elements don't have the 'std::pair<int, std::string>', types as expected, but have the 'std::pair<const int, std::string>' types. If arguments of the 'std::pair' template don't match them, each element of the container will be implicitly converted to a temporary object of type 'std::pair<const int, std::string>'. Then the reference will be bound to it.
You can solve this problem in two ways:
The first way. Use the correct type of a loop variable. In general, you just need to see what value type the iterator of the used container returns when dereferencing (operator *).
void foo(const std::unordered_map<int, std::string> map)
{
for (const std::pair<const int, std::string> &i : map)
{
std::cout << i.second;
}
}The second way. Use the 'auto' type to automatically output the type of container elements.
void foo(const std::unordered_map<int, std::string> map)
{
for (const auto &i : map)
{
std::cout << i.second;
}
}Obviously, the second method is more convenient, since it reduces the amount of code and eliminates the possibility of writing the wrong type.
V835. Passing cheap-to-copy argument by reference may lead to decreased performance.
The analyzer detected that function argument is passed by reference to const. But it is better to pass the argument by copy.
Let's look at two examples for 64-bit systems.
In the first example, an object of the 'std::string_view' type is passed by reference to const:
uint32_t foo_reference(const std::string_view &name) noexcept
{
return static_cast<uint32_t>(8 + name.size()) + name[0];
}Assembly code:
foo_reference(std::basic_string_view<char, std::char_traits<char> > const&):
mov eax, dword ptr [rdi] // <= (1)
mov rcx, qword ptr [rdi + 8] // <= (2)
movsx ecx, byte ptr [rcx]
add eax, ecx
add eax, 8
retHere, every time data is read from the object of type 'const std::string_view &', a dereference occurs. You can see this in instructions 'mov eax, dword ptr [rdi]' (1) and 'mov rcx, qword ptr [rdi + 8] ' (2).
In the second example, the object is passed by copy:
uint32_t foo_value(std::string_view name) noexcept
{
return static_cast<uint32_t>(8 + name.size()) + name[0];
}Assembly code:
foo_value(std::basic_string_view<char, std::char_traits<char> >):
movsx eax, byte ptr [rsi]
add eax, edi
add eax, 8
retThe compiler generated less code for the second example. This happens because the object is placed in the CPU registers and there is no need for addressing to access this object.
Let's investigate what objects to pass by copy and what object to pass by reference.
To do this, we need to read "System V Application Binary Interface AMD64 Architecture Processor Supplement". This document describes the calling conventions for the Unix-like OSs. Paragraph 3.2.3 describes how the parameters are passed. For each parameter, a separate class is defined. If a parameter has the MEMORY class, then it will be passed through the stack. Otherwise, the parameter is passed through the CPU registers, as in the example above. According to subparagraph 5 (C), if the object's size exceeds 16 bytes, then it has the MEMORY class. The exception is aggregate types up to 64 bytes in size, the first field of which is SSE, and all other fields are SSEUP. This means objects with a larger size will be placed on the function call stack. To access them, you need addressing.
Let's look at two more examples for 64-bit systems.
In the third one, a 16-byte object is passed by a copy.
struct SixteenBytes
{
int64_t firstHalf; // 8-byte
int64_t secondHalf; // 8-byte
}; // 16-bytes
uint32_t foo_16(SixteenBytes obj) noexcept
{
return obj.firstHalf + obj.secondHalf;
}Assembly code:
foo_16(SixteenBytes): # @foo_16(SixteenBytes)
lea eax, [rsi + rdi]
retThe compiler generated efficient code by placing a structure in two 64-bit registers.
In the second example, a 24-byte structure is passed by the copy:
struct MoreThanSixteenBytes
{
int64_t firstHalf; // 8-byte
int64_t secondHalf; // 8-byte
int32_t yetAnotherStuff; // 4-byte
}; // 24-bytes
uint32_t foo_more_than_16(MoreThanSixteenBytes obj) noexcept
{
return obj.firstHalf + obj.secondHalf + obj.yetAnotherStuff;
}Assembly code:
foo_more_than_16(MoreThanSixteenBytes):
mov eax, dword ptr [rsp + 16]
add eax, dword ptr [rsp + 8]
add eax, dword ptr [rsp + 24]
retAccording to the calling convention, the compiler must place the structure on the stack. This leads to the fact that the structure is accessed indirectly, through the address, which is calculated with the 'rsp' register. In such a case, the V813 warning will be issued.
Windows has similar calling convention. You can read more in the documentation.
The diagnostic is disabled on a 32-bit x86 platform since the calling conventions are different — there are not enough CPU registers to pass arguments.
The diagnostic may issue false positives. References to const may have unusual ways of use. For example, a function to which such a reference is passed can save it to the global storage. And the object to which the reference refers may change.
Look at the example:
struct RefStorage
{
const int &m_value;
RefStorage(const int &value)
: m_value { value }
{}
RefStorage(const RefStorage &value)
: m_value { value.m_value }
{}
};
std::shared_ptr<RefStorage> rst;
void SafeReference(const int &ref)
{
rst = std::make_shared<RefStorage>(ref);
}
void PrintReference()
{
if (rst)
{
std::cout << rst->m_value << std::endl;
}
}
void foo()
{
int value = 10;
SafeReference(value);
PrintReference();
++value;
PrintReference();
}The 'foo' function calls the 'SafeReference' function and passes it the 'value' variable as a parameter by reference to const. Then this reference is saved to the global 'rst' storage. In this case, the variable 'value' can change since it is not a const itself.
The code above is rather unnatural and poorly written. Real projects may have more complex cases. If you know what you're doing, you can suppress the diagnostics with a special comment: '//-V835'.
If your project has a lot of such places, you can completely disable diagnostics by adding '//-V::835' to the precompiled header or '.pvsconfig' file. You can read more about suppressing false positives in the documentation.
V836. Expression's value is copied at the variable declaration. The variable is never modified. Consider declaring it as a reference.
The analyzer detected a situation where a redundant copying may occur when a variable is declared.
Look at the example:
void foo(const std::vector<std::string> &cont)
{
for (auto item : cont) // <=
{
std::cout << item;
}
}In the 'for' loop, a container containing elements of the 'std::string' type is traversed. According to the template argument deduction, the resulting type of the 'item' variable is 'std::string'. Because of that, the container element is copied at each iteration. You can also see that the 'item' variable is not modified in the loop's body. Thus, you can avoid redundant copying. Just replace the 'auto' type with 'const auto &'.
The correct code fragment:
void foo(const std::vector<std::string> &containter)
{
for (const auto &item : containter) // <=
{
std::cout << item;
}
}Look at another example:
void use(const std::string &something);
void bar(const std::string &name)
{
auto myName = name;
use(myName);
}In this case, it's better to replace 'auto' with 'const auto &' since 'myName" is not modified in the function's body. The correct code fragment:
void use(const std::string &something);
void bar(const std::string &name)
{
const auto &myName = name;
use(myName);
}V837. The 'emplace' / 'insert' function does not guarantee that arguments will not be copied or moved if there is no insertion. Consider using the 'try_emplace' function.
The analyzer has detected the use of the 'emplace' / 'insert' function from the standard library's associative container ('std::map', 'std::unordered_map'), while the 'try_emplace' function is available. The 'emplace' / 'insert' function can cause arguments to be copied or moved, even if there is no insertion (the element with the same key has already been added to the container). This can reduce performance and, if the argument is moved, can result in the premature release of resources.
Depending on the implementation of the standard library, the 'emplace' / 'insert' function may create a temporary object of the 'std::pair' type before checking for the element with the key value. The function's arguments will be copied or moved into 'std::pair'. Since C++17, the 'try_emplace' function has been introduced to the 'std::map' and 'std::unordered_map' containers. If the element with the key value exists, the function guarantees that the function arguments will not be copied or moved.
Here is a code example:
class SomeClass
{
std::string name, surname, descr;
public:
// User-defined constructor
SomeClass(std::string name, std::string surname, std::string descr);
// ....
};
std::map<size_t, SomeClass> Cont;
bool add(size_t id,
const std::string &name,
const std::string &surname,
const std::string &descr)
{
return Cont.emplace(id, SomeClass { name, surname, descr })
.second;
}In the example, the object of the 'SomeClass' type is inserted into the 'Cont' container by the 'id' key. If the object has already been added by that key, the following unnecessary operations may be performed:
- The copy constructor of the string is called 3 times when creating a temporary object of the 'SomeClass' type;
- The move constructor of the string is called 3 times when a temporary object of the 'SomeClass' type is perfectly forwarded to a temporary object of the 'std::pair<const size_t, SomeClass>' type.
If you use the 'try_emplace' function instead of 'emplace', you can avoid creating an unnecessary temporary object of the 'std::pair<const size_t, SomeClass>' type:
bool add(size_t id,
const std::string &name,
const std::string &surname,
const std::string &descr)
{
return Cont.try_emplace(id, SomeClass { name, surname, descr })
.second;
}Using 'try_emplace' also enables you to create objects in-place, inside an associative container. In the example, the 'SomeClass' type is not an aggregate and contains a user-declared constructor. So, you can also avoid calling the copy constructors of the string 3 times:
bool add(size_t id,
const std::string &name,
const std::string &surname,
const std::string &descr)
{
return Cont.try_emplace(id, name, surname, descr)
.second;
}Since C++20, the 'try_emplace' function also works with aggregate types:
struct SomeClass
{
std::string name, surname, descr;
};
bool add(size_t id,
const std::string &name,
const std::string &surname,
const std::string &descr)
{
return Cont.try_emplace(id, name, surname, descr)
.second;
}V838. Temporary object is constructed during lookup in ordered associative container. Consider using a container with heterogeneous lookup to avoid construction of temporary objects.
The analyzer has detected a call to the lookup function in an ordered associative container ('std::set', 'std::multiset', 'std::map', or 'std::multimap') with an argument whose type differs from the container's key type. This call results in the creation of a temporary object with the key type from the passed argument.
If type conversion is an expensive operation (for example, 'const char *' to 'std::string'), it may affect application performance.
Starting with C++14, you can avoid creating a temporary object. This requires the comparator of the ordered associative container to support the heterogeneous lookup. For this to happen, the following conditions must be met:
- The comparator is able to compare the argument type with the key type.
- The 'is_transparent' alias is declared in the comparator.
The analyzer issues a warning if the 'is_transparent' name is not declared in the comparator.
Let's take a look at the example:
void foo(const char *str)
{
static std::set<std::string> cont;
auto it = cont.find(str); // <=
if (it != cont.end())
{
// do smth
}
}In the example above, the 'cont' container is declared with the comparator of the 'std::less<std::string>' type by default. This comparator does not support heterogeneous lookup. Therefore, each call to the 'find' function creates a temporary 'std::string' object from 'const char *'.
To avoid creating a temporary object of the 'std::string' type, use a container with a comparator that supports heterogeneous lookup and can compare 'std::string' with 'const char *'. For example, you can use 'std::set' with the 'std::less<>' comparator:
void foo(const char *str)
{
static std::set<std::string, std::less<>> cont;
auto it = cont.find(str);
if (it != cont.end())
{
// do smth
}
}Now, when calling the 'find' function, a temporary object of the 'std::string' type is not created, and an argument of the 'const char *' type is directly compared with the keys.
V839. Function returns a constant value. This may interfere with move semantics.
This diagnostic rule is based on the F.49 CppCoreGuidelines rule.
The analyzer has detected a function declaration that returns values of constant type. Although the 'const' qualifier is intended to prevent modification of temporary objects, such behavior may interfere with move semantics. Costly copying of large objects results in decreased performance.
Here is a synthetic example:
class Object { .... };
const std::vector<Object> GetAllObjects() {...};
void g(std::vector<Object> &vo)
{
vo = GetAllObjects();
}Due to the 'const' qualifier at the return type of the 'GetAllObjects' function, the compiler does not invoke the move assignment operator but chooses the copy assignment operator when selecting the 'operator=' overload. In fact, it copies the vector of objects returned by the function.
To optimize the code, simply delete the 'const' qualifier.
class Object { .... };
std::vector<Object> GetAllObjects() {...};
void g(std::vector<Object> &vo)
{
vo = GetAllObjects();
}Now, when the 'GetAllObjects' function is called, the return vector of objects is moved.
Note that this diagnostic rule applies only to code written in C++11 or newer versions. This behavior is based on move semantics that was introduced in C++11.
Let's look at the following code (custom type implementation for long arithmetic):
class BigInt
{
private:
....
public:
BigInt& operator++();
BigInt& operator++(int);
BigInt& operator--();
BigInt& operator--(int);
friend const BigInt operator+(const BigInt &,
const BigInt &) noexcept;
// other operators
};
void foo(const BigInt &lhs, const BigInt &rhs)
{
auto obj = ++(lhs + rhs); // compile-time error
// can't call operator++()
// on const object
}This approach was used in the past when move semantics was not yet implemented in C++, and one wanted to prevent accidental access to a temporary object.
If you return a non-constant object from the overloaded 'operator+', you can call the overloaded prefix increment operator on a temporary object. Such semantics is forbidden for built-in arithmetic types.
Starting with C++11, the code can be fixed using ref-qualifiers of non-static member functions, and the compiler can be allowed to apply move semantics:
class BigInt
{
....
public:
BigInt& operator++() & noexcept;
BigInt& operator++(int) & noexcept;
BigInt& operator--() & noexcept;
BigInt& operator--(int) & noexcept;
friend BigInt operator+(const BigInt &,
const BigInt &) noexcept;
// other operators
};
void foo(const BigInt &lhs, const BigInt &rhs)
{
auto obj = ++(lhs + rhs); // compile-time error
// can't call BigInt::operator++()
// on prvalue
}V2001. Consider using the extended version of the 'foo' function here.
This diagnostic rule was added at users' request.
The analyzer allows you to detect calls of functions that have "extended" analogues. By the term "extended functions" we understand functions that have the Ex suffix. Some of these extended functions are: VirtualAllocEx, SleepEx, GetDCEx, LoadLibraryEx, FindResourceEx.
Consider the following source code:
void foo();
void fooEx(float x);
void foo2();
...
void test()
{
foo(); // V2001
foo2(); // OK
}In the fragment where the "foo" function is called, the V2001 diagnostic message will be produced since there is another function with the same name but ending with "Ex". The "foo2" function does not have an alternative version and therefore no diagnostic message will be generated concerning it.
The V2001 message will be also generated in the following case:
void fooA(char *p);
void fooExA(char *p, int x);
...
void test()
{
fooA(str); // V2001
}V2002 is a related diagnostic message.
This diagnostic is classified as:
|
V2002. Consider using the 'Ptr' version of the 'foo' function here.
This diagnostic rule was added at users' request.
The analyzer allows you to detect calls of functions that have 'Ptr' analogues. By this term we mean functions whose name has the Ptr suffix. Some of these extended functions are: SetClassLongPtr, DSA_GetItemPtr.
Consider the following source code:
void foo(int a);
void fooPtr(int a, bool b);
void foo2();
...
void test()
{
foo(1); // V2002
foo2(); // OK
}In the fragment where the "foo" function is called, the V2002 diagnostic message will be produced since there is another function with the same name but ending with "Ptr". The "foo2" function does not have an alternative version and therefore no diagnostic message will be generated concerning it.
The V2002 message will be also generated in the following case:
void fooA(char *p);
void fooPtrA(char *p, int x);
...
void test()
{
fooA(str); // V2002
}V2001 is a related diagnostic message.
This diagnostic is classified as:
|
V2003. Explicit conversion from 'float/double' type to signed integer type.
This diagnostic rule was added at users' request.
The analyzer allows you to detect all the explicit floating-point type conversions to integer signed types.
Consider some examples of constructs the analyzer will generate this diagnostic message on:
float f;
double d;
long double ld;
int i;
short s;
...
i = int(f); // V2003
s = static_cast<short>(d); // V2003
i = (int)ld; // V2003V2004 is a related diagnostic message.
This diagnostic is classified as:
|
V2004. Explicit conversion from 'float/double' type to unsigned integer type.
This diagnostic rule was added at users' request.
The analyzer allows you to detect all the explicit floating-point type conversions to integer unsigned types.
Consider some examples of constructs the analyzer will generate this diagnostic message on:
float f;
double d;
long double ld;
unsigned u;
size_t s;
...
u = unsigned(f); // V2004
s = static_cast<size_t>(d); // V2004
u = (unsigned)ld; // V2004V2003 is a related diagnostic message.
This diagnostic is classified as:
|
V2005. C-style explicit type casting is utilized. Consider using: static_cast/const_cast/reinterpret_cast.
This diagnostic rule was added at users' request.
The analyzer allows you to detect explicit type conversions written in the old C language style in a C++ program. It is safer in the C++ language to convert types using operators static_cast, const_cast and reinterpret_cast.
The V2005 diagnostic rule helps to perform code refactoring and replace the old type conversion style with a new one. Sometimes it helps to detect errors.
Here are examples of constructs that will trigger this diagnostic message:
int i;
double d;
size_t s;
void *p;
...
i = int(p); //V2005
d = (double)d; //V2005
s = (size_t)(i); //V2005The V2005 diagnostic message is not generated in three cases.
1. This is a C program.
2. The conversion target type is void. This type conversion is safe and is used to emphasize that there is a result which is not used anyhow. For example:
(void)fclose(f);3. The type conversion is located inside a macro. If the analyzer generated the warning for macros, there would be a lot of reports when different system constants and macros are used. And you cannot fix them anyway. Here you are some examples:
#define FAILED(hr) ((HRESULT)(hr) < 0)
#define SRCCOPY (DWORD)0x00CC0020
#define RGB(r,g,b)\
((COLORREF)(((BYTE)(r)|((WORD)((BYTE)(g))<<8))\
|(((DWORD)(BYTE)(b))<<16)))The V2005 diagnostic's levels of certainty
By default, all warnings issued by the V2005 diagnostic rule have the second (Medium) level of certainty. If a suspicious code fragment is in a template and there's a casting to a type template parameter, then the level of certainty downgrades to the third (Low).
Look at the synthetic example:
template <typename TemplateParam>
void foo(const std::vector<SomeType>& vec)
{
auto a = (TemplateParam)(vec[0]); //+V2005 //3rd level
auto b = TemplateParam(vec[3]); //+V2005 //3rd level
// ....
auto i = (int)a; //+V2005 //2 level
auto i = int(a); //+V2005 //2 level
// ....
}Without instantiating the template it's hard to understand what's hiding behind 'TemplateParam'. If there's casting to the known type within a template, then the analyzer will still issue the Medium-level warnings. If the Low-level warnings are pointless to you, you can suppress them with a following comment:
//-V::2005:3Special settings of the V2005 diagnostic
On an additional request of our users, we have implemented the feature allowing you to manage the V2005 diagnostic's behavior. In the general header file or pvsconfig-file you should write a special comment. Here is an example of usage:
//+V2005 ALLThree modes are available:
a) Default mode: each type conversion in the C style triggers a warning prompting you to use such constructs as static_cast, const_cast and reinterpret_cast instead of a type conversion.
b) ALL: each type conversion in the C style causes the analyzer to display a recommendation about what keyword(s) should be used instead. In rare cases, generating single wrong recommendations is possible due to conversion of complex template types. Another rare situation is also possible that the analyzer fails to detect the conversion type and displays an ordinary warning without specifying the exact conversion type.
//+V2005 ALLc) NO_SIMPLE_CAST: this mode is similar to the previous one, but in this case warning is generated only when at least one type in conversion is pointer or when conversion type predicted is more complex than static_cast.
//+V2005 NO_SIMPLE_CASTReferences:
- Terminology. Explicit type conversion.
- Wikipedia. Type conversion.
V2006. Implicit type conversion from enum type to integer type.
This diagnostic rule was added at users' request.
The analyzer allows you to detect all implicit conversions of enum to integer types.
The V2006 diagnostic rule helps you refactor your code and, in some cases, detect errors.
Here is an example of a construction that the analyzer will issue this diagnostic message to:
enum Orientation {
Horizontal = 0x1,
Vertical = 0x2
};
Orientation orientation = Horizontal;
int pos = orientation; // V2006The V2006 diagnostic message is not issued in the following cases.
First. The analyzer does not warn you when an enumerator is compared with a variable of type, such as 'int'. Although the constant is implicitly cast to the 'int' type before the comparison, this case is too common to issue a warning.
int pos = foo();
if (pos == Vertical) // Ok
{
....
}Second. Two enumerators of the enumerated type are compared:
enum E
{
ZERO, ONE, TWO
};
void foo(E e1, E e2)
{
if (e1 == e2) // ok
....
else if (e1 > e2) // ok
....
else if (e1 != e2) // ok
....
}Third. An implicit type conversion occurs when an enumerator is shifted to initialize another enumerator or array elements:
enum E
{
FIRST_BIT = 1,
SECOND_BIT = FISRT_BIT << 1, // ok
THIRD_BIT = FISRT_BIT << 2, // ok
....
};
int A[3] = {
FIRST_BIT,
FIRST_BIT << 1, // ok
FIRST_BIT << 2 // ok
};V2007. This expression can be simplified. One of the operands in the operation equals NN. Probably it is a mistake.
This diagnostic rule was added at users' request.
The analyzer allows you to detect some strange binary operations where code can be simplified.
Suspicious binary operations are:
- operations '^', '+', '-', '<<', '>>' where one of the operands equals 0;
- the '&' operation where one of the operands equals -1;
- operations '*', '/', '%' where one of the operands equals 1;
The V2007 diagnostic rule helps to perform code refactoring and sometimes detect errors.
These are examples of constructs that cause this diagnostic message to appear:
int X = 1 ^ 0;
int Y = 2 / X;This code can be simplified. For example:
int X = 1;
int Y = 2;To reduce the number of false positives, we have added several exceptions. For example, the V2007 diagnostic message is not generated when the strange expression is located inside a macro or is an array index.
This diagnostic is classified as:
V2008. Cyclomatic complexity: NN. Consider refactoring the 'Foo' function.
This diagnostic rule was added at users' request.
The analyzer calculates and displays the "Cyclomatic complexity" values for functions. The cyclomatic complexity is one of the metrics for source code used to estimate the complexity of a program.
The extremely high significance of the cyclomatic complexity parameter indicates that you should pay special attention to the function that has caused the diagnostic message to be shown. It's highly probable that these functions need refactoring.
Messages are generated only for those functions whose cyclomatic complexity exceeds the threshold value. It is set at 50 by default.
You can change the threshold value through adding the comment
//-V2008_CYCLOMATIC_COMPLEXITY=N
into your code, where N is the new threshold value of the cyclomatic complexity. The value must be higher than 1. The comment affects the code within the bounds of the compilation unit. That's why if you want to specify the threshold value for the whole project, write this comment in one of the base header files, for example, stdafx.h.
There is one more additional option enabling the modified method of cyclomatic complexity calculation:
//-V2008_MODIFIED_CYCLOMATIC_COMPLEXITY
This comment sets the analyzer to take the cyclomatic complexity of the switch() operator as one. The number of "case x:" does not matter.
This diagnostic is classified as:
V2009. Consider passing the 'Foo' argument as a pointer/reference to const.
This diagnostic rule was added at users' request.
The analyzer suggests that a function argument should be made a constant one.
This warning is generated in the following cases:
- The argument is an instance of a structure or a class which is passed into the function by reference but not modified inside the function body;
- The argument is a pointer to non-constant type, but it is used only for data reading.
This diagnostic may help you in code refactoring or preventing software errors in the future.
Consider the following sample:
void foo(int *a)
{
int b = a[0] + a[1] + a[2];
.... 'a' variable is not used anymore
}It is better to make the 'a' argument to point on a constant value. Therefore, it makes it clear that the argument is used for data reading only.
This is the fixed code:
void foo(const int *a)
{
int b = a[0] + a[1] + a[2];
.... 'a' variable is not used anymore
}Note. The analyzer may make mistakes when trying to figure out whether or not a variable is being modified inside the function body. If you have noticed an obvious false positive, please send us the corresponding code sample for us to study it.
Messages generated by the analyzer may sometimes seem pretty strange. Let's discuss one of these cases in detail:
typedef struct tagPOINT {
int x, y;
} POINT, *PPOINT;
void foo(const PPOINT a, const PPOINT b) {
a->x = 1; // Data can be changed
a = b; // Compilation error
}The analyzer suggests rendering the type referenced by the pointer as constant one. It seems strange, since there is the keyword 'const' in the code. But 'const' actually indicates that the pointer is constant, while the objects that the pointers refer to are available for modification.
To make the objects themselves constant, we should do the following thing:
....
typedef const POINT *CPPOINT;
void foo(const CPPOINT a, const CPPOINT b) {
a->x = 1; // Compilation error
a = b; // Compilation error
}V2010. Handling of two different exception types is identical.
This diagnostic rule was added at users' request.
The analyzer has detected an issue when handlers for different exception types do the same job. It may be an error or it may signal that the code can be reduced.
For example:
try
{
....
}
catch (AllocationError &e)
{
WriteLog("Memory Allocation Error");
return false;
}
catch (IOError &e)
{
WriteLog("Memory Allocation Error");
return false;
}This code fragment was written using the Copy-Paste method, which leads to writing an incorrect error message into the log in case of a reading from file error. The code should actually look something like this:
try
{
....
}
catch (AllocationError &e)
{
WriteLog("Memory Allocation Error");
return false;
}
catch (IOError &e)
{
WriteLog("IO Error: %u", e.ErrorCode());
return false;
}Here is another example. The code below is correct but can be reduced:
try
{
....
}
catch (std::exception &)
{
Disconnect();
}
catch (CException &)
{
Disconnect();
}
catch (...)
{
Disconnect();
}Since all the handlers are identical and catch exceptions of all types, the code can be shortened:
try
{
....
}
catch (...)
{
Disconnect();
}Another example.
class DBException : public std::exception { ... };
class SocketException : public DBException { ... };
class AssertionException : public DBException { ... };
....
try
{
....
}
catch (SocketException& e){
errorLog.push_back(e.what());
continue;
}
catch (AssertionException& e) {
errorLog.push_back(e.what());
continue;
}
catch(std::exception& e){
errorLog.push_back(e.what());
continue;
}There are a few classes inherited from the 'std::exception' class. All the exception handlers are identical. Notice that they also catch exceptions of the 'std::exception' type among others. This code is redundant. We may leave only one handler for 'std::exception', and it will catch and handle all the rest exceptions alike as they are inherited from 'std::exception'. The 'what()' method is virtual, so a correct error message will be saved into 'errorLog'.
The simplified code:
try
{
....
}
catch(std::exception& e){
errorLog.push_back(e.what());
continue;
}V2011. Consider inspecting signed and unsigned function arguments. See NN argument of function 'Foo' in derived class and base class.
This diagnostic rule was added at users' request.
The analyzer has detected the following issue: the base class has a virtual function with one of the arguments of the signed type. The derived class contains the same function but with an unsigned argument. Or you may get a reverse situation: the base class contains an unsigned argument while the derived contains a signed one.
This diagnostic rule is used to detect errors when – during a large refactoring – the programmer changes the function type in one of the classes but forgets to change it in the other class.
For example:
struct Q { virtual int x(unsigned) { return 1; } };
struct W : public Q { int x(int) { return 2; } };The code should actually look like this:
struct Q { virtual int x(unsigned) { return 1; } };
struct W : public Q { int x(unsigned) { return 2; } };If your base class has two 'x' functions with the arguments of the 'int' and "unsigned' types, the analyzer won't generate the V2011 warning.
V2012. Possibility of decreased performance. It is advised to pass arguments to std::unary_function/std::binary_function template as references.
This diagnostic rule was added at users' request.
The analyzer has detected a class inherited from 'std::unary_function' or 'std::binary_function', its template's parameters containing classes passed by value. It is obvious that passing a class object by value (especially a "heavy" object, with many fields or complex constructor) may cause additional time and memory expenses. Of course, passing an object by value is not always bad. It may make sense when you need to save an original object and work with an altered copy. But sometimes the code where an object is passed by value appears through a mistake and therefore is a bad solution.
Let's check an example. The functor we have in it will copy two objects of the 'std::string' type each time it is called instead of passing them by value:
class example : public std::binary_function
<std::string, std::string, bool>
{
public:
result_type operator()(
first_argument_type first,
second_argument_type second)
{
return first == second;
};
};The simplest solution in this case is of course to pass the template parameters by reference instead of value:
class example : public std::binary_function
<const std::string &, const std::string &, bool> ....Another case when the analyzer won't generate the warning is when all the arguments not passed by reference are changed in the function body:
class example : public std::binary_function
<std::string, std::string, bool>
{
public:
result_type operator()(
first_argument_type first,
second_argument_type second)
{
std::replace(first.begin(), first.end(), 'u', 'v');
std::replace(second.begin(), second.end(), 'a', 'b');
return first == second;
};
};V2013. Consider inspecting the correctness of handling the N argument in the 'Foo' function.
This diagnostic rule was added at users' request. It is quite specific and was implemented to solve one particular task that is hardly of interest to a wide audience.
It can be sometimes useful to find all the calls of COM-interfaces where a pointer to a certain class is explicitly cast to an integer pointer or just an integer type. Some of our users wish to have a means to check if passed data are processed correctly on the COM-server's part.
Assume we have a container containing an array of items of the unsigned type. It is passed into a function that interprets it as an array of 'size_t' items. The data in such code will be interpreted correctly in the 32-bit system and incorrectly in the 64-bit one. For example:
MyVector<unsigned> V;
pInterface->Foo((unsigned char *)(&V));
....
void IMyClass::Foo(unsigned char *p)
{
MyVector<size_t> *V = (V *)(p);
....
}This is in fact a 64-bit error. We decided not to include it into the set of 64-bit diagnostic rules as it is just too specific. This diagnostic allows you to find potentially dangerous calls and it is then up to you to manually review all the methods accepting the data and figure out if there is an error in your code or not.
This diagnostic is classified as:
V2014. Don't use terminating functions in library code.
This diagnostic rule was added at users' request. It is fairly ad-hoc and was designed for checking library code.
There are functions that terminate or may terminate program execution. Using them in your program is not a good practice but it is still legitimate since you, as the author of the program, know what result you want to achieve and what you are doing.
But you cannot use such functions in libraries! You never know where and how a library will be used, and it will be bad if the library terminates the program, causing the user to lose their data. If an error occurs, libraries should return an error status or throw an exception but never terminate the program.
Consider the following example:
char *CharMallocFoo(size_t length)
{
char *result = (char*)malloc(length);
if (!result)
abort();
return result;
}The 'CharMallocFoo' function will terminate execution if the attempt to allocate dynamic memory fails. As a way out, have the function return a null pointer for the library user to handle it.
This diagnostic is classified as:
|
V2015. An identifier declared in an inner scope should not hide an identifier in an outer scope.
This diagnostic rule was added at users' request.
An identifier declared in an inner scope and an identifier declared in an outer scope should have different names. Otherwise, an identifier declared in the inner scope hides the one from the outer scope. This can lead to confusion or a software error.
Such a name collision can result in a logical error as in the example below:
int foo(int param)
{
int i = 0;
if (param > 0)
{
int i = var + 1;
}
return i;
}The 'foo' function receives a positive parameter value. At first glance the function seems to return this value increased by '1'. However, that does not happen. In fact, the function always returns '0'. To prove that let's change the identifiers names:
int foo(int param)
{
int i_outer = 0;
if (param > 0)
{
int i_inner = var + 1;
}
return i_outer;
}Now it is clear that the value of the 'i' variable in the 'if' branch does not affect the result of the 'foo' function. The 'i' identifier ('i_inner') in the inner scope hides the 'i' identifier ('i_outer') from the outer scope. An error occurs.
This diagnostic is classified as:
|
V2016. Consider inspecting the function call. The function was annotated as dangerous.
This diagnostic rule was added at users' request.
The analyzer has detected a call to a function that is marked by a user as dangerous/forbidden.
Some functions are often not allowed in a project. For example, when they do not follow the coding style of the project. The analyzer can detect such functions if they have been marked by a custom annotation of the following type:
//+V2016, function:foo
//+V2016, class:SomeClass, function:foo
//+V2016, namespace:SomeNamespace, class:SomeClass, function:fooFor example, a user marked the 'malloc' function as follows:
//+V2016, function:mallocIf the analyzer encounters the 'malloc' function call, it will issue a level 1 warning:
struct SomeStruct { .... };
void foo()
{
struct SomeStruct *p = (SomeStruct *) malloc(....);
}A user can annotate a function of any namespace and/or class:
class A
{
// ....
void a(int);
// ....
};
namespace BN
{
class B
{
// ....
void b(double);
// ....
};
}
//+V2016, class:A, function:a
//+V2016, namespace:BN, class:B, function:b
void foo()
{
A a;
a.a(); // <=
BN::B b;
b.b(); // <=
}Note. Custom annotations are not applied to virtual functions by default. You can read about how to enable this feature here.
This diagnostic is classified as:
V2017. String literal is identical to variable name. It is possible that the variable should be used instead of the string literal.
This diagnostic rule was added at users' request.
The analyzer has detected a suspicious expression with a string literal which text matches the name of the string type variable. Such an expression may contain a typo, which is difficult to identify both at the code review stage and during compilation.
Look at the synthetic example:
bool CheckCredentials(const std::string& username,
const std::string& password)
{
return users[username].password == "password";
}This function should check if the passed password matches the one in the user data store. When you work with the string type data, you can accidentally type extra quotation marks. Since this comparison is syntactically correct, it is compiled successfully. However, the function doesn't work as planned. If such code is surrounded by the same type of expressions that check other data, then reviewer may consider it too trivial and not pay attention to it.
Another example of a typo found in a real project:
qboolean QGL_Init( const char *dllname ) {
....
// NOTE: this assumes that 'dllname' is lower case (and it should be)!
if ( strstr( dllname, _3DFX_DRIVER_NAME ) ) {
if ( !GlideIsValid() ) {
ri.Printf( PRINT_ALL,
"...WARNING: missing Glide installation, assuming no 3Dfx available\n" );
return qfalse;
}
}
if ( dllname[0] != '!' && strstr( "dllname", ".dll" ) == NULL ) { // <=
Com_sprintf( libName, sizeof( libName ), "%s\\%s", systemDir, dllname );
} else
{
Q_strncpyz( libName, dllname, sizeof( libName ) );
}
....
}Fragment of the 'strstr( "dllname", ".dll" ) == NULL' expression will always be true because the "dllname" string doesn't have the ".dll" substring. In fact, the code author wanted to check the 'dllname' variable's contents.
Unfortunately, this diagnostic often gives false positives, because it is difficult to determine the logic of processing certain variables. For example, variables and text literals often overlap when you work with key-value containers designed to bind data to their names. However, such warnings do not take much time when you view the report. The code can be quickly refactored, and unnecessary warnings can be suppressed.
V2018. Cast should not remove 'const' qualifier from the type that is pointed to by a pointer or a reference.
This diagnostic rule was added at users' request.
The analyzer has detected a situation where the 'const' qualifier was removed. Modifying an object, which was declared with the 'const' qualifier, through a pointer/reference to non-'const' type leads to undefined behavior. Besides, such code often indicates poor application design.
Look at the example:
void read_settings(const char *buf);
const char* get_settings_file_name();
bool settings_present();
// ....
void init_settings()
{
const char name[MAX_PATH] = "default.cfg";
if (settings_present())
{
strcpy((char *)name, get_settings_file_name());
}
read_settings(name);
}To avoid undefined behavior, abandon constancy when declaring a local variable:
void read_settings(const char *buf);
const char* get_settings_file_name();
bool settings_present();
// ....
void init_settings()
{
char name[MAX_PATH] = "default.cfg";
if (settings_present())
{
strcpy(name, get_settings_file_name());
}
read_settings(name);
}V2019. Cast should not remove 'volatile' qualifier from the type that is pointed to by a pointer or a reference.
This diagnostic rule was added at users' request.
The analyzer has detected the situation where the 'volatile' qualifier was removed. Accessing an object, which was declared with the 'volatile' qualifier, through a pointer/reference to a non-'volatile' type leads to undefined behavior.
Example of the code for which the analyzer will issue a warning:
int foo(int &value)
{
while (value)
{
// do some stuff...
}
return 0;
}
int main()
{
volatile int value = 1;
return foo((int &) value);
}Another example of the code for which the analyzer will issue a warning:
#include <utility>
int foo()
{
int x = 30;
volatile int y = 203;
using std::swap;
swap(x, const_cast<int &>(y)); // <=
return x;
}V2020. The loop body contains the 'break;' / 'continue;' statement. This may complicate the control flow.
This diagnostic rule was added at users' request.
The diagnostic detects the use of 'break;' and 'continue;' statements inside loop bodies. The diagnostic also aids in code refactoring and prevents errors when legacy code inside a loop is changed to a new one.
Here is a synthetic example:
namespace fs = std::filesystem;
std::vector<fs::path> existingPaths;
void SaveExistingPaths(const std::vector<fs::path> &paths)
{
for (auto &&path: paths)
{
if (!fs::exists(path))
{
break; // <=
}
existingPaths.emplace_back(path);
}
}In the above code snippet, all existing paths were supposed to be stored in a separate container. If the path doesn't exist, the loop will break since 'break;' is used. In this case, the 'continue;' statement should have been used instead. However, removing the 'break;' and 'continue;' statements from the loop would be even better.
namespace fs = std::filesystem;
std::vector<fs::path> existingPaths;
void SaveExistingPaths(const std::vector<fs::path> &paths)
{
for (auto &&path: paths)
{
if (fs::exists(path))
{
existingPaths.emplace_back(path);
}
}
}Note. This diagnostic is disabled by default in order to prevent issuing too many warnings.
You can enable this diagnostic rule for the analyzed file by the following comment:
//+V::2020You can also add this comment to the standard header file. This will enable the diagnostic rule for all files that include this header file. For example, you can add the comment in 'stdafx.h'.
You can use the '#pragma pvs' directive to enable the diagnostic for a certain block of code.
namespace fs = std::filesystem;
std::vector<fs::path> existingPaths;
#pragma pvs(push)
#pragma pvs(enable: 2020)
void SaveExistingPaths(const std::vector<fs::path> &paths)
{
for (auto &&path: paths)
{
if (!fs::exists(path))
{
break; // <= V2020
}
existingPaths.emplace_back(path);
}
}
#pragma pvs(pop)V4001. Unity Engine. Boxing inside a frequently called method may decrease performance.
The analyzer detected boxing inside a frequently called method. Boxing is an expensive operation that requires memory allocation in a managed heap. Thus, boxing inside a frequently called method can cause performance issues.
Here's a code example:
Vector3 _value;
....
void OnGUI()
{
GUILayout.Label(string.Format(...., _value));
}In Unity projects, the 'OnGUI' function is called for rendering a graphical user interface and handling GUI events. The function is called at least once per frame, so the code is executed frequently.
In this example, the 'string.Format' method is called, its last argument is a value type field ('Vector3'). When the method is called, the 'string.Format(string, object)' overload is used. Since an argument of the 'object' type is expected, '_value' is boxed.
We can avoid boxing if we call the 'ToString' method of the '_value' field:
Vector3 _value;
....
void OnGUI()
{
GUILayout.Label(string.Format(...., _value.ToString()));
}Here is another example:
struct ValueStruct { int a; int b; }
ValueStruct _previousValue;
void Update()
{
....
ValueStruct newValue = ....
....
if (CheckValue (newValue)
....
}
bool CheckValue(ValueStruct value)
{
....
if(_previousValue.Equals(value))
....
}The 'Update' method is widely used in Unity projects. Its code is executed every frame.
The 'CheckValue' method is called in the 'Update' method. There is implicit boxing, since 'value' is passed to the 'Equals' method (the parameter of the standard 'Equals' method is of the 'object' type).
This can be fixed by adding the 'Equals' method to the 'ValueStruct' type, the method takes in a parameter of the 'ValueStruct' type:
struct ValueStruct
{
int a;
int b;
public bool Equals(ValueStruct other)
{
....
}
}In this case, the 'CheckValue' method will use the 'Equals(ValueStruct)' overload to avoid boxing.
This diagnostic is classified as:
V4002. Unity Engine. Avoid storing consecutive concatenations inside a single string in performance-sensitive context. Consider using StringBuilder to improve performance.
The analyzer has detected the opportunity to optimize concatenation operations inside a frequently called method.
The concatenation causes the creation of a new string object. As a result, extra memory is allocated in a managed heap. To improve performance, you need to avoid concatenations inside frequently executed code. If you need to repeatedly add various fragments to a string value, the Unity developers recommend to use the 'StringBuilder' type instead of concatenation.
Consider the example:
[SerializeField] Text _stateText;
....
void Update()
{
....
string stateInfo = ....;
....
stateInfo += ....;
stateInfo += ....;
....
stateInfo += ....;
_stateText.text = stateInfo;
....
}Here the construction of the 'stateInfo' string is implemented by several concatenation operations. Executing the code in the 'Update' method (which is called several dozen times per second), you will get rapid accumulation of 'garbage' in memory and that's why the garbage collector is frequently called to clean it up. Calling the garbage collector lots of times can have a negative impact on the performance. You can avoid extra memory allocation by using the 'StringBuilder' object:
[SerializeField] Text _stateText;
....
StringBuilder _stateInfo = new StringBuilder();
void Update()
{
_stateInfo.Clear();
....
_stateInfo.AppendLine(....);
_stateInfo.AppendLine(....);
....
_stateInfo.AppendLine(....);
_stateText.text = _stateInfo.ToString();
....
}The 'Clear' method clears the 'StringBuilder' content, but does not release the allocated memory. Thus, the extra memory allocation will be required only if the already used memory is insufficient to store the new text.
Consider another example:
[SerializeField] Text _text;
....
List<string> _messages = new();
....
void LateUpdate()
{
....
string message = BuildMessage();
_text.text = message;
_messages.Clear();
}
string BuildMessage()
{
string result = "";
foreach (var msg in _messages)
result += msg + "\n";
return result;
}In this example, the 'BuildMessage' method helps generate the message displayed on the interface. Since this method is called inside 'LateUpdate' (as often as inside 'Update'), it's worth optimizing too:
StringBuilder _message = new StringBuilder();
string BuildMessage()
{
_message.Clear();
foreach (var msg in _messages)
_message.AppendLine(msg);
return _message.ToString();
}V4003. Unity Engine. Avoid capturing variable in performance-sensitive context. This can lead to decreased performance.
The analyzer has detected a variable capture in a lambda expression inside a frequently executed method. The variable capture can lead to decreased performance due to additional memory allocation.
Let's look at the example:
void Update()
{
....
List<int> numbers = GetNumbers();
int divisor = GetDivisor();
var result = numbers.Select(x => x / divisor);
....
}'Update' is a Unity method that performs a frame-by-frame update. The 'Update' method is often called, so it is not recommended to overload it with unnecessary operations.
The given example uses a lambda expression with capturing the 'divisor' variable. As mentioned earlier, capturing a variable from an external context leads to an additional creation of an object.
Thus, the demonstrated code fragment creates an additional load on the GC.
The optimal method implementation may look like this:
void Update()
{
....
List<int> numbers = GetNumbers();
int divisor = GetDivisor();
var result = new List<int>(numbers.Count);
for (int i = 0; i < numbers.Count; i++)
{
result.Add(numbers[i]/divisor);
}
....
}Using a custom implementation similar to 'Select', you can get rid of additional memory allocation and thus reduce the load on the GC.
Take a look at another example:
void Update()
{
....
List<int> numbers = GetNumbers();
int divisor = GetDivisor();
if (AreAllMultipleOf(numbers, divisor))
....
}
bool AreAllMultipleOf(List<int> lst, int divisor)
{
return lst.All(elem => elem % divisor == 0);
}The 'AreAllMultipleOf' method is called from the 'Update' method. 'AreAllMultipleOf' determines whether all the received numbers are multiples of the 'divisor' value. Just as before: 'Update' is a frequently called method that performs frame-by-frame update in Unity.
In this case, the 'AreAllMultipleOf' method is regularly executed within 'Update', which means it is also often called.
The 'AreAllMultipleOf' method uses a lambda expression with variable capture to perform the check. This leads to additional memory allocation, which can negatively affect the performance of the application.
The optimal method implementation may look like this:
void Update()
{
....
List<int> numbers = GetNumbers();
int divisor = GetDivisor();
if (AreAllMultipleOf(numbers, divisor))
....
}
bool AreAllMultipleOf(List<int> lst, int divisor)
{
foreach (int num in lst)
{
if (num % divisor != 0)
return false;
}
return true;
}Here we once again use our custom implementation, which helps avoid additional memory allocation and reduce the load on the garbage collector.
V4004. Unity Engine. New array object is returned from method or property. Using such member in performance-sensitive context can lead to decreased performance.
The PVS-Studio analyzer has detected that the frequently executed code contains accesses to properties or methods. These properties or methods create a new array.
All Unity APIs that return arrays create a new collection each time they are accessed. This causes memory allocation in a managed heap. If we access these properties and methods often, this can lead to decreased performance.
Take a look at this example:
void Update()
{
for (int i = 0; i < Camera.allCameras.Length; i++)
{
SetDepth(Camera.allCameras[i].depth);
SetName(Camera.allCameras[i].name);
SetMask(Camera.allCameras[i].eventMask);
....
}
}Values are written in the 'Update' method. These values correspond to a specific camera. This method is called for each frame. When the 'Camera.allCameras' property is accessed, a new array is created. As a result, a new collection will be created four times on each 'for' iteration (once when checking the loop condition, three times in the body).
We can avoid multiple creation of new collections, if we get the 'Camera.allCameras' value before the loop:
void Update()
{
var cameras = Camera.allCameras;
for (int i = 0; i < cameras.Length; i++)
{
SetDepth(cameras[i].depth);
SetName(cameras[i].name);
SetMask(cameras[i].eventMask);
....
}
}In this case, 'Camera.allCameras' is accessed once. The value of this property is assigned to the 'cameras' variable. Later, this variable is used instead of the 'Camera.allCameras' property to write camera parameters.
Take a look at another example:
void Update()
{
SetNecessaryGameObjectParameters();
}
void SetNecessaryGameObjectParameters()
{
for (int i = 0; i < GameObject.FindGameObjectsWithTag("Enemy").Length; i++)
{
SetName(GameObject.FindGameObjectsWithTag("Enemy")[i].name);
SetTag(GameObject.FindGameObjectsWithTag("Enemy")[i].tag);
....
}
}The information about the objects of the 'GameObject' type is written to the 'SetNecessaryGameObjectParameters' method. We get these objects via calling the 'GameObject.FindGameObjectsWithTag' method. Each time this method is called, a new collection is created. 'SetNecessaryGameObjectParameters' is used in the 'Update' method, which is a frequently called method.
If we want to avoid creating new collections, we can take the method call out of the loop:
void Update()
{
SetNecessaryGameObjectParameters();
}
void SetNecessaryGameObjectParameters()
{
var enemies = GameObject.FindGameObjectsWithTag("Enemy");
for (int i = 0; i < enemies.Length; i++)
{
SetName(enemies[i].name);
SetTag(enemies[i].tag);
....
}
}Now 'GameObject.FindGameObjectsWithTag' is called once. The return value of this method is written into the 'enemies' variable. Further, we get information about the objects of the 'GameObject' type with the help of this variable, instead of calling 'GameObject.FindGameObjectsWithTag'.
V4005. Unity Engine. The expensive operation is performed inside method or property. Using such member in performance-sensitive context can lead to decreased performance.
The PVS-Studio analyzer has detected that the frequently executed code contains accesses to expensive properties or methods.
According to the Unity documentation, when some methods and properties from the Unity API are accessed, they perform expensive operations. If we access these properties and methods frequently, this can lead to decreased performance.
Take a look at this example:
public void Update()
{
foreach (var cameraHandler in CameraHandlers)
{
cameraHandler(Camera.main);
}
....
}The camera is handled in the 'Update' method. This method is called for each frame. When the 'Camera.main' property is accessed, a cache lookup is performed, which overloads a CPU. As a result, the expensive operation is performed on each loop iteration.
We can avoid accessing the 'Camera.main' property multiple times by writing its value into a variable.
public void Update()
{
var camera = Camera.main;
foreach (var cameraHandler in CameraHandlers)
{
cameraHandler(camera);
}
....
}In this case, 'Camera.main' is accessed once. The value of this property is assigned to the 'camera' variable. Then this variable is used instead of the 'Camera.main' property to handle the camera.
Take a look at another example:
public void Update()
{
ProcessCamera();
....
}
private void ProcessCamera()
{
if (GetComponent<Camera>() == null)
return;
var cameraDepth = GetComponent<Camera>().depth;
var cameraName = GetComponent<Camera>().name;
var cameraEvent = GetComponent<Camera>().eventMask;
}The information about the camera is written to the 'ProcessCamera' method. We get the camera by calling 'GetComponent<Camera>'. This method searches for the object of the 'Camera' type. This operation is expensive. Each time the 'ProcessCamera' method is called, the 'GetComponent<Camera>' method is executed four times. 'ProcessCamera' is used in the 'Update' method, which is a frequently called method.
If we want to avoid multiple execution of the expensive operation, we can write the result of 'GetComponent<Camera>' to the variable.
private void ProcessCamera()
{
var camera = GetComponent<Camera>();
if (camera == null)
return;
var cameraDepth = camera.depth;
var cameraName = camera.name;
var cameraEvent = camera.eventMask;
....
}Now 'GetComponent<Camera>' is called once. The return value of this method is written to the 'camera' variable. Further, we get information about the camera with the help of this variable instead of calling 'GetComponent<Camera>'.
V2501. MISRA. Octal constants should not be used.
This diagnostic rule is based on the software development guidelines developed by MISRA (Motor Industry Software Reliability Association).
This diagnostic rule varies for C and C++. In the C language, octal numeric literals should not be used. In the C++ language, octal numeric literals and escape sequences should not be used.
The use of octal literals could hinder code readability, especially when skimming through it. Misinterpreting numeric values may result in various mistakes.
Here is an example of code triggering this warning:
if (val < 010)
{
....
}When skimming through the code, you may overlook the actual value of the numeric literal, which is 8, not 10. To eliminate this warning, rewrite the literal in decimal or hexadecimal form:
if (val < 8)
{
....
}This diagnostic is classified as:
|
V2502. MISRA. The 'goto' statement should not be used.
This diagnostic rule is based on the software development guidelines developed by MISRA (Motor Industry Software Reliability Association).
This diagnostic rule is relevant only to C-programs. The use of 'goto' statements could mar the program structure and obscure the code. This diagnostic detects code fragments that use 'goto' statements.
Here is an example of code triggering this warning:
int foo(int value)
{
....
if (value==0)
goto bad_arg;
....
return OK;
bad_arg:
return BAD_ARG;
}This diagnostic is classified as:
|
V2503. MISRA. Implicitly specified enumeration constants should be unique – consider specifying non-unique constants explicitly.
This diagnostic rule is based on the software development guidelines developed by MISRA (Motor Industry Software Reliability Association).
This diagnostic rule is relevant only to C-programs. The analyzer has detected a non-unique value among implicitly initialized enumeration elements, which leads to creation of duplicate constant values.
Here is an example of incorrect code:
enum Suits
{
SUITS_SPADES = 1,
SUITS_CLUBS,
SUITS_DIAMONDS,
SUITS_HEARTS,
SUITS_UNKNOWN = 4
};The way the constants are initialized here results in assigning the same values to the elements 'SUITS_HEARTS' and 'SUITS_UNKNOWN'. It is not clear if this was done on purpose or by mistake.
To avoid errors like that, make sure you explicitly initialize all enumeration elements that have non-unique values:
enum Suits
{
SUITS_SPADES = 1,
SUITS_CLUBS,
SUITS_DIAMONDS,
SUITS_HEARTS = 4,
SUITS_UNKNOWN = 4
};This diagnostic is classified as:
|
V2504. MISRA. Size of an array is not specified.
This diagnostic rule is based on the software development guidelines developed by MISRA (Motor Industry Software Reliability Association).
Explicitly specifying the array size makes code clearer and helps to prevent mistakes leading to an array overrun due to its exact size being unknown to the programmer.
The analyzer issues this warning when it detects a declaration of an array with the 'extern' specifier, provided that the array size is not specified explicitly. For example:
extern int arr[];To eliminate the warning, specify the array size explicitly.
extern int arr[12];If the array size can be inferred from the initializer, the warning is not issued.
int arr1[] = {1, 2, 3};This diagnostic is classified as:
|
V2505. MISRA. The 'goto' statement shouldn't jump to a label declared earlier.
This diagnostic rule is based on the software development guidelines developed by MISRA (Motor Industry Software Reliability Association).
The use of a 'goto' statement that jumps to a previously declared label obscures the code and, therefore, makes it harder to maintain.
Here is an example of code that will trigger this warning:
void init(....)
{
....
again:
....
if (....)
if (....)
goto again;
....
}To eliminate the warning, delete the 'goto' statement or rewrite the code so that the 'goto' statement is followed, rather than preceded, by the label it refers to.
This diagnostic is classified as:
|
V2506. MISRA. A function should have a single point of exit at the end.
This diagnostic rule is based on the software development guidelines developed by MISRA (Motor Industry Software Reliability Association).
A function should have only one 'return' statement, which must come after all the other statements in the function's body. Multiple 'return' statements could obscure the code and make it harder to maintain.
Here is an example of code triggering this warning.
obj foo (....)
{
....
if (condition) {
return a;
}
....
if (other_condition) {
return b;
}
....
}The fixed version of the function has only one point of exit at the end of its body:
obj foo (....)
{
....
if (condition) {
result = a;
} else {
....
if (other_condition) {
result = b;
}
}
....
return result;
}This code will also be easier to maintain if you need to add some new features, such as caching of the return value, since you will have to add the new code only in once place:
obj foo (....)
{
....
return cache(result);
}This diagnostic is classified as:
|
V2507. MISRA. The body of a loop\conditional statement should be enclosed in braces.
This diagnostic rule is based on the software development guidelines developed by MISRA (Motor Industry Software Reliability Association).
The bodies of the statements 'while', 'do-while', 'for', 'if', 'if-else', and 'switch' should be enclosed in braces.
Braces clearly define which of the statements belong to the body, make the code clearer, and help to prevent certain errors. For example, with braces absent, the programmer could misinterpret indentation or overlook the ';' character written accidentally after the statement.
Example 1:
void example_1(....)
{
if (condition)
if (otherCondition)
DoSmt();
else
DoSmt2();
}The format of this code does not match its execution logic and may confuse the programmer. Adding the braces makes the code unambiguous:
void example_1(....)
{
if (condition)
{
if (otherCondition)
{
DoSmt();
}
else
{
DoSmt2();
}
}
}Example 2:
void example_2(....)
{
while (count < 10)
DoSmt1(); DoSmt2();
}The format of this code does not match its execution logic either since only the 'DoSmt1()' expression belongs to the loop.
Fixed version:
void example_2(....)
{
while (count < 10)
{
DoSmt1();
DoSmt2();
}
}Note: an 'if' statement immediately following an 'else' statement does not have to be enclosed in braces. For example, the analyzer will keep silent about this code:
if (condition1)
{ .... }
else if (condition2)
{ .... }This diagnostic is classified as:
|
V2508. MISRA. The function with the 'atof/atoi/atol/atoll' name should not be used.
This diagnostic rule is based on the software development guidelines developed by MISRA (Motor Industry Software Reliability Association).
The analyzer issues the warning when it detects the following functions: 'atof', 'atoi', 'atol', 'atoll'.
Incorrect use of these functions may result in undefined behavior. This could happen when a function argument is not a valid C-string or if the resulting value does not fit into the return type.
Here is an example of code triggering this warning:
void Foo(const char *str)
{
int val = atoi(str);
....
}The warning is also issued in C programs whenever a macro declaration with one of these names is detected.
This diagnostic is classified as:
|
V2509. MISRA. The function with the 'abort/exit/getenv/system' name should not be used.
This diagnostic rule is based on the software development guidelines developed by MISRA (Motor Industry Software Reliability Association).
The analyzer issues the warning when it detects the following functions: 'abort', 'exit', 'getenv', 'system'.
The behavior of these functions is implementation-dependent. Besides, using such functions as 'system' may cause vulnerabilities.
Here is an example of code triggering this warning:
void Foo(FILE *pFile)
{
if (pFile == NULL)
{
abort();
}
....
}The warning is also issued in C programs whenever a macro declaration with one of these names is detected.
This diagnostic is classified as:
|
V2510. MISRA. The function with the 'qsort/bsearch' name should not be used.
This diagnostic rule is based on the software development guidelines developed by MISRA (Motor Industry Software Reliability Association).
This diagnostic rule is relevant only to C programs. The analyzer issues the warning when it detects one of the following functions: 'qsort', 'bsearch'.
Incorrect use of these functions may result in undefined behavior. To learn more about this, see the documentation on 'qsort' and 'bsearch'.
Here is an example of code triggering this warning:
qsort(arr, cnt, sizeof(int), comp);The warning is also issued in C programs whenever a macro declaration with one of these names is detected.
This diagnostic is classified as:
|
V2511. MISRA. Memory allocation and deallocation functions should not be used.
This diagnostic rule is based on the software development guidelines developed by MISRA (Motor Industry Software Reliability Association).
The analyzer issues the warning when it detects the following dynamic memory allocation/deallocation functions and operators: 'malloc', 'realloc','calloc', 'free', 'new', 'delete'.
Functions used for dynamic memory handling are a potential source of trouble since misusing them could result in memory leaks, undefined behavior, and other problems. Besides, this may cause vulnerabilities.
Here is an example of code triggering this warning:
int* imalloc(size_t cnt)
{
return (int*)malloc(cnt * sizeof(int));
}The warning is also issued in C programs whenever a macro declaration with one of these names is detected.
This diagnostic is classified as:
|
V2512. MISRA. The macro with the 'setjmp' name and the function with the 'longjmp' name should not be used.
This diagnostic rule is based on the software development guidelines developed by MISRA (Motor Industry Software Reliability Association).
The analyzer issues the warning when it detects the 'setjmp' macro or 'longjmp' function because misusing them may result in undefined behavior.
Here is an example of code triggering this warning:
jmp_buf j_buf;
void foo()
{
setjmp(j_buf);
}
int main()
{
foo();
longjmp(j_buf, 0);
return 0;
}The 'longjmp' function is called after the function calling 'setjmp' returns. The result is undefined.
This diagnostic is classified as:
|
V2513. MISRA. Unbounded functions performing string operations should not be used.
This diagnostic rule is based on the software development guidelines developed by MISRA (Motor Industry Software Reliability Association).
This diagnostic rule is relevant only to C++ programs. The analyzer issues the warning when it detects the following functions: 'strcpy', 'strcmp', 'strcat', 'strchr', 'strspn', 'strcspn', 'strpbrk', 'strrchr', 'strstr', 'strtok', 'strlen'.
Incorrect use of these functions may result in undefined behavior since they do not perform bound checking when reading from or writing to the buffer.
Here is an example of code triggering this warning:
int strcpy_internal(char *dest, const char *source)
{
int exitCode = FAILURE;
if (source && dest)
{
strcpy(dest, source);
exitCode = SUCCESS;
}
return exitCode;
}This diagnostic is classified as:
|
V2514. MISRA. Unions should not be used.
This diagnostic rule is based on the software development guidelines developed by MISRA (Motor Industry Software Reliability Association).
The analyzer issues the warning when it detects a union declaration.
Incorrect use of unions may cause various problems, such as reading incorrect values or undefined behavior.
For example, in C++, undefined behavior occurs when attempting to read from a member other than the one that the latest write operation was performed on.
Here is an example of code triggering this warning:
union U
{
unsigned char uch;
unsigned int ui;
} uni;
....
uni.uch = 'w';
int ui = uni.ui;This diagnostic is classified as:
|
V2515. MISRA. Declaration should contain no more than two levels of pointer nesting.
This diagnostic rule is based on the software development guidelines developed by MISRA (Motor Industry Software Reliability Association).
The analyzer issues the warning when it detects a declaration that contains a nested pointer more than two levels deep. Such pointers obscure the code and, therefore, may lead to various mistakes.
Here is an example of code triggering this warning:
void foo(int **ppArr[])
{
....
}This diagnostic is classified as:
|
V2516. MISRA. The 'if' ... 'else if' construct should be terminated with an 'else' statement.
This diagnostic rule is based on the software development guidelines developed by MISRA (Motor Industry Software Reliability Association).
Every 'if ... else if' series must end with an 'else' branch. The analyzer issues the warning when the ending 'else' is missing. An 'else' statement at the end indicates that all the possible cases have been considered, thus making the code clearer.
Here is an example of code triggering this warning:
if (condition)
{
....
}
else if (other_condition)
{
....
}To eliminate the warning and indicate to the programmer maintaining the code that none of the previous conditions is true, add the ending 'else' branch. In this branch, you should include the necessary operations or comments.
if (condition)
{
....
}
else if (other_condition)
{
....
}
else
{
// No action needed
}This diagnostic is classified as:
|
V2517. MISRA. Literal suffixes should not contain lowercase characters.
This diagnostic rule is based on the software development guidelines developed by MISRA (Motor Industry Software Reliability Association).
This diagnostic varies for C and C++. In the C language, the suffix 'L' should be used instead of 'l'. In the C++ language, all literal suffixes should be uppercase.
Using lowercase suffixes obscures the code. For example, you may confuse an 'l' suffix with the numeral one (1), which could cause various mistakes.
Here are examples of literals triggering this warning:
12l; 34.0f; 23u;The warning is not issued when the literals are written in the following form:
12L; 34.0F; 23U;This diagnostic is classified as:
|
V2518. MISRA. The 'default' label should be either the first or the last label of a 'switch' statement.
This diagnostic rule is based on the software development guidelines developed by MISRA (Motor Industry Software Reliability Association).
This diagnostic rule is relevant only to C programs. The 'default' label should be either the first or the last label of a 'switch' statement. Following this rule makes the code clearer.
Here is an example of code triggering this warning:
void example_1(int cond)
{
switch (cond)
{
case 1:
DoSmth();
break;
default:
DoSmth2();
break;
case 3:
DoSmth3();
break;
}
}To eliminate the warning, rewrite the code. For example:
void example_1(int cond)
{
switch (cond)
{
case 1:
DoSmth();
break;
case 3:
DoSmth3();
break;
default:
DoSmth2();
break;
}
}This diagnostic is classified as:
|
V2519. MISRA. Every 'switch' statement should have a 'default' label, which, in addition to the terminating 'break' statement, should contain either a statement or a comment.
This diagnostic rule is based on the software development guidelines developed by MISRA (Motor Industry Software Reliability Association).
This diagnostic rule is relevant only to C programs. Every 'switch' statement should contain a 'default' label.
Following this rule guarantees that any possible case where none of the labels matches the value of the control variable will be handled.
Since such situations have to be dealt with somehow, every 'default' label should contain (in addition to 'break') an expression or comment explaining why no actions are carried out.
Example 1:
enum WEEK
{
SUNDAY, MONDAY, TUESDAY, WEDNESDAY, THURSDAY, FRIDAY, SATURDAY
} weekDay;
void example_1()
{
int isWorkday;
switch (weekDay)
{
case MONDAY:
case TUESDAY:
case WEDNESDAY:
case THURSDAY:
case FRIDAY:
isWorkday = 1;
break;
case SATURDAY:
case SUNDAY:
isWorkday = 0;
break;
}Even though the 'weekDay' variable has been checked against every value of the 'WEEK' enumeration, it is not guaranteed to be limited only to these cases. To eliminate the warning, rewrite the code. For example:
enum WEEK
{
SUNDAY, MONDAY, TUESDAY, WEDNESDAY, THURSDAY, FRIDAY, SATURDAY
} weekDay;
void example_1()
{
int isWorkday;
switch (weekDay)
{
case MONDAY:
case TUESDAY:
case WEDNESDAY:
case THURSDAY:
case FRIDAY:
isWorkday = 1;
break;
case SATURDAY:
case SUNDAY:
isWorkday = 0;
break;
default:
assert(false);
break;
}This diagnostic is classified as:
|
V2520. MISRA. Every switch-clause should be terminated by an unconditional 'break' or 'throw' statement.
This diagnostic rule is based on the software development guidelines developed by MISRA (Motor Industry Software Reliability Association).
This diagnostic varies for C and C++. Each label of a 'switch' statement should end with a 'break' statement placed outside the condition. In C++, 'throw' can also be the last statement.
Adding the ending statements guarantees that the execution flow will not "fall through" to the next label and also helps avoid mistakes when adding new labels.
The only exception to this rule is a series of empty labels.
Here is an example of code triggering this warning:
void example_1(int cond, int a)
{
switch (cond)
{
case 1:
case 2:
break;
case 3: // <=
if (a == 42)
{
DoSmth();
}
case 4: // <=
DoSmth2();
default: // <=
;
}
}Fixed code:
void example_1(int cond, int a)
{
switch (cond)
{
case 1:
case 2:
break;
case 3:
if (a == 42)
{
DoSmth();
}
break;
case 4:
DoSmth2();
break;
default:
/* No action required */
break;
}
}Note that labels should not end with a 'return' statement as it violates the rule V2506.
This diagnostic is classified as:
|
V2521. MISRA. Only the first member of enumerator list should be explicitly initialized, unless all members are explicitly initialized.
This diagnostic rule is based on the software development guidelines developed by MISRA (Motor Industry Software Reliability Association).
This diagnostic rule is relevant only to C++ programs. The analyzer has detected an enumeration whose members are initialized in a mixed way (explicitly and implicitly). This may result in duplicating their values.
Here is an example of incorrect code:
enum Suits
{
SUITS_SPADES = 1,
SUITS_CLUBS,
SUITS_DIAMONDS,
SUITS_HEARTS,
SUITS_UNKNOWN = 4
};The way the elements are initialized here results in assigning the same value to the members 'SUITS_HEARTS' and 'SUITS_UNKNOWN'. It is not clear if this was done on purpose or by mistake.
The warning is not issued in the following cases:
- only the first enumeration element is initialized explicitly;
- all enumeration elements are initialized implicitly;
- all enumeration elements are initialized explicitly.
This diagnostic is classified as:
|
V2522. MISRA. The 'switch' statement should have 'default' as the last label.
This diagnostic rule is based on the software development guidelines developed by MISRA (Motor Industry Software Reliability Association).
This diagnostic rule is relevant only to C++ programs. A 'switch' statement should have 'default' as the last label.
Adding a 'default' label at the end of every 'switch' statement makes the code clearer and guarantees that any possible case where none of the labels matches the value of the control variable will be handled. Since such situations have to be dealt with somehow, every 'default' label should contain (in addition to 'break' or 'throw') an expression or comment explaining why no actions are carried out.
Example 1:
void example_1(int i)
{
switch (i)
{
case 1:
DoSmth1();
break;
default: // <=
DoSmth42();
break;
case 3:
DoSmth3();
break;
}
}Fixed code:
void example_1(int i)
{
switch (i)
{
case 1:
DoSmth1();
break;
case 3:
DoSmth3();
break;
default:
DoSmth42();
break;
}
}Example 2:
enum WEEK
{
SUNDAY, MONDAY, TUESDAY, WEDNESDAY, THURSDAY, FRIDAY, SATURDAY
} weekDay;
void example_2()
{
int isWorkday;
switch (weekDay)
{
case MONDAY:
case TUESDAY:
case WEDNESDAY:
case THURSDAY:
case FRIDAY:
isWorkday = 1;
break;
case SATURDAY:
case SUNDAY:
isWorkday = 0;
break;
default: // <=
break;
}Fixed code:
enum WEEK
{
SUNDAY, MONDAY, TUESDAY, WEDNESDAY, THURSDAY, FRIDAY, SATURDAY
} weekDay;
void example_2()
{
int isWorkday;
switch (weekDay)
{
case MONDAY:
case TUESDAY:
case WEDNESDAY:
case THURSDAY:
case FRIDAY:
isWorkday = 1;
break;
case SATURDAY:
case SUNDAY:
isWorkday = 0;
break;
default:
assert(false);
break;
}This diagnostic is classified as:
|
V2523. MISRA. All integer constants of unsigned type should have 'u' or 'U' suffix.
This diagnostic rule is based on the software development guidelines developed by MISRA (Motor Industry Software Reliability Association).
The analyzer has detected an unsigned integer literal without a 'U' / 'u' suffix ('U' in C++). Such literals obscure the code as their type is ambiguous. Besides, the same literals can be of different types in various data models.
Using suffixes to explicitly specify the type helps to avoid ambiguity when reading numeric literals.
Here is an example of code triggering the warning (provided that the literal is of unsigned type on the platform under analysis):
auto typemask = 0xffffffffL;This diagnostic is classified as:
|
V2524. MISRA. A switch-label should only appear at the top level of the compound statement forming the body of a 'switch' statement.
This diagnostic rule is based on the software development guidelines developed by MISRA (Motor Industry Software Reliability Association).
A label's scope should be a compound statement forming the body of the 'switch' statement. It means that the label should not be nested in any block other than the body of the 'switch', and that body should be a compound statement.
Therefore, all labels of one 'switch' should belong to the same scope. Following this rule helps to keep the code clear and well-structured.
Example 1:
void example_1(int param, bool b)
{
switch (param)
{
case 1:
DoSmth1();
if (b)
{
case 2: // <=
DoSmth2();
}
break;
default:
assert(false);
break;
}
}This code is not clear enough. To eliminate the warning, rewrite the code as follows:
void example_1(int param, bool b)
{
switch (param)
{
case 1:
DoSmth1();
if (b)
{
DoSmth2();
}
break;
case 2:
DoSmth2();
break;
default:
assert(false);
break;
}
}The following example will also trigger the warning because the body of the 'switch' statement is not compound:
void example_2(int param)
{
switch (param)
default:
DoDefault();
}Fixed code:
void example_2(int param)
{
switch (param)
{
default:
DoDefault();
break;
}
}This diagnostic is classified as:
|
V2525. MISRA. Every 'switch' statement should contain non-empty switch-clauses.
This diagnostic rule is based on the software development guidelines developed by MISRA (Motor Industry Software Reliability Association).
This diagnostic varies for C and C++. In the C language, every 'switch' statement should have at least two non-empty labels, such as 'case' or 'default'. In the C++ language, every 'switch' statement should have at least one non-empty label 'case'.
'switch' constructs that do not meet these requirements are redundant and may indicate a programming mistake.
Example 1:
void example_1(int param)
{
switch(param)
{
case 0:
default:
Func();
break;
}
}This 'switch' is redundant and meaningless. No matter the value of 'param', only the body of the 'default' label will be executed.
The following example does not trigger the warning:
void example_2(int param)
{
switch(param)
{
case 0:
DoSmth1();
break;
case 1:
DoSmth2();
break;
....
default:
Func();
break;
}
}Here is an example where the analyzer issues the warning only when using a C compiler:
void example_3(int param)
{
switch(param)
{
case 10:
case 42:
DoMath();
break;
}
}This diagnostic is classified as:
|
V2526. MISRA. The functions from time.h/ctime should not be used.
This diagnostic rule is based on the software development guidelines developed by MISRA (Motor Industry Software Reliability Association).
The analyzer issues this warning when it detects the following functions: 'clock', 'time', 'difftime', 'ctime', 'asctime', 'gmtime', 'localtime', 'mktime'.
These functions have unspecified or implementation-dependent behavior, so they may return time and date in different formats (depending on the environment, implementation of the standard library, and so on).
Here is an example of code triggering this warning:
const char* Foo(time_t *p)
{
time_t t = time(p);
return ctime(t);
}The warning is also issued in C programs whenever a macro declaration with one of these names is detected.
This diagnostic is classified as:
|
V2527. MISRA. A switch-expression should not have Boolean type. Consider using of 'if-else' construct.
This diagnostic rule is based on the software development guidelines developed by MISRA (Motor Industry Software Reliability Association).
A Boolean value can be cast to an integer and, therefore, can be used as a control variable in a 'switch' statement. However, it is preferable to use an 'if-else' construct in such cases as it conveys the developer's intentions in a clearer and more explicit way.
Original code:
int foo(unsigned a, unsigned b)
{
while (a != 0 && b != 0)
{
switch (a > b) // <=
{
case 0:
a -= b;
break;
default:
b -= a;
break;
}
}
return a;
}Better version:
int foo(unsigned a, unsigned b)
{
while (a != 0 && b != 0)
{
if (a > b)
{
b -= a;
}
else
{
a -= b;
}
}
return a;
}This diagnostic is classified as:
|
V2528. MISRA. The comma operator should not be used.
This diagnostic rule is based on the software development guidelines developed by MISRA (Motor Industry Software Reliability Association).
Avoid using the 'comma' operator as it may be confusing to code maintainers.
Look at the following example:
int foo(int x, int y) { .... }
foo( ( 0, 3), 12 );This code could be confusing to a programmer who is not familiar with the function's signature. They could think that the function is called with three arguments, but it is not so: the 'comma' operator in the '(0, 3)' expression will evaluate the left and right arguments and return the latter. As a result, the function call will actually look like this:
foo( 3, 12 );This warning is issued in other cases as well, for example:
int myMemCmp(const char *s1, const char *s2, size_t N)
{
for (; N > 0; ++s1, ++s2, --N) { .... }
}This diagnostic is classified as:
|
V2529. MISRA. Any label should be declared in the same block as 'goto' statement or in any block enclosing it.
This diagnostic rule is based on the software development guidelines developed by MISRA (Motor Industry Software Reliability Association).
Excessive use of 'goto' statements complicates the code structure and obscures the code.
To make the code clearer, it is recommended that you discard jumps to nested blocks or between blocks of the same level.
Example 1:
void V2532_pos1()
{
...
goto label;
...
{
label:
...
}
}The 'goto' statement here refers control to a nested block, which makes this code non-compliant.
No warning will be produced on the following code:
void V2532_neg1()
{
...
label:
...
{
goto label;
...
}
}Note: the bodies of switch labels are considered composite statements even if they are not enclosed in braces. For this reason, jumps to the body of a switch label from outer code and jumps between different switch labels do not comply with the rule.
Consider the following examples.
Jumping to a switch label from outer code (non-compliant):
void V2532_pos2(int param)
{
goto label;
switch (param)
{
case 0:
break;
default:
label:;
break;
}
}Jumping between switch labels (non-compliant):
void V2532_pos3(int param)
{
switch (param)
{
case 0:
goto label;
break;
default:
label:
break;
}
}Jumping from a switch label to outer code (OK):
void V2532_neg2(int param)
{
label:
switch (param)
{
case 0:
goto label;
break;
default:
break;
}
}Jumping within the bounds of one switch label (OK):
void neg3(int param)
{
switch (param)
{
case 0:
{
...
{
goto label;
}
}
label:
break;
default:
break;
}
}This diagnostic is classified as:
|
V2530. MISRA. Any loop should be terminated with no more than one 'break' or 'goto' statement.
This diagnostic rule is based on the software development guidelines developed by MISRA (Motor Industry Software Reliability Association).
The limitation of the number of loop exit points allows significantly reducing visual complexity of the code.
Here's an example which triggers this warning:
int V2534_pos_1(vector<int> ivec)
{
int sum = 0;
for (auto i = ivec.cbegin(); i != ivec.cend(); ++i)
{
if (*i < 0)
break;
sum += *i;
if (sum > 42)
break;
}
return sum;
}In the following example, the loop is exited via both 'break', and 'goto':
short V2534_pos_2(string str)
{
short count = 0;
for (auto &c : str)
{
if (isalnum(c))
{
count++;
}
else if (isspace(c))
{
break;
}
else
{
goto error;
}
}
return count;
error:
...
}This diagnostic is classified as:
|
V2531. MISRA. Expression of essential type 'foo' should not be explicitly cast to essential type 'bar'.
This diagnostic rule is based on the software development guidelines developed by MISRA (Motor Industry Software Reliability Association).
This diagnostic applies only to code written in C. A value of one essential type should not be explicitly cast to a value of another incompatible essential type.
The MISRA standard introduces the essential type model, where variables can have the following types:
- Boolean, if it operates true/false values: '_Bool';
- signed, if operates signed integer numbers, or is an unnamed enum: 'signed char', 'signed short', 'signed int', 'signed long', 'signed long long', 'enum { .... }';
- unsigned, if operates unsigned integer numbers: 'unsigned char', 'unsigned short', 'unsigned int', 'unsigned long', 'unsigned long long';
- floating, if operates floating point numbers: 'float', 'double', 'long double';
- character, if operates only characters: 'char';
- Named enum, if operates a named set of user-specific values: 'enum name { .... };'.
This model does not include pointers.
The following table shows situations that developers should avoid:

Exceptions:
- A variable of type 'enum' can be cast to an alias for that type.
- Constant integers '0' and '1' can be cast to 'Boolean'.
Reasons for explicit type conversion are as follows:
- to make code easier to read;
- to change a type to use it in a subsequent arithmetic operation;
- deliberate truncation of the value (when casting from a wider type to a narrower type, i.e. 'long' -> 'short').
For some reasons, casts from one essential type to another may be dangerous or meaningless, for example:
- casting from 'signed'/'unsigned' integer to named 'enum' may be dangerous as the value may not fit into the range determined by the maximum size of the given 'enum' type;
- casts from 'Boolean' to any other type are usually meaningless;
- casts between essential 'floating' and 'character' types are also meaningless as there is no precise mapping between the two representations.
The following example will trigger the corresponding warnings:
enum A {ONE, TWO = 2};
float foo(int x, char ch)
{
enum A a = (enum A) x; // signed to enum, may lead to
// unspecified behavior
int y = int(x == 4); // Meaningless cast Boolean to signed
return float(ch) + .01; // Meaningless cast character to floating,
// there is no precise mapping between
// two representations
}This diagnostic is classified as:
|
V2532. MISRA. String literal should not be assigned to object unless it has type of pointer to const-qualified char.
This diagnostic rule is based on the software development guidelines developed by MISRA (Motor Industry Software Reliability Association).
The analyzer has detected implicit removal of constness of a string literal. Since any attempt to change a string literal leads to undefined behavior, it should be assigned only to objects of type pointer to const-qualified char.
This rule also applies to wide string literals.
Here is an example of code that will trigger this warning:
char* Foo(void)
{
return "Hello, world!";
}A modified string literal also causes the analyzer to issue the warning:
"first"[1] = 'c';This diagnostic is classified as:
|
V2533. MISRA. C-style and functional notation casts should not be performed.
This diagnostic rule is based on the software development guidelines developed by MISRA (Motor Industry Software Reliability Association).
This rule only applies to C++.
C-style and functional casting can convert unrelated types which may lead to an error.
You must explicitly cast types using the operators 'static_cast', 'const_cast' and 'reinterpret_cast'.
Examples, for which the analyzer will issue warnings:
int i;
double d;
size_t s;
void *p;
....
i = int(p); //V2533
d = (double)s; //V2533
s = (size_t)(i); //V2533
p = (void *)(d); //V2533Exception: casting to void does not constitute any danger and is used to emphasize that a certain result is not used in any way. Example:
(void)fclose(f);This diagnostic is classified as:
|
V2534. MISRA. The loop counter should not have floating-point type.
This diagnostic rule is based on the software development guidelines developed by MISRA (Motor Industry Software Reliability Association).
Since floating-point numbers cannot accurately represent all real numbers, the number of iterations may vary for loops relying on such variables.
Consider the following example:
void foo(void) {
for (float A = 0.1f; A <= 10.0f; A += 0.1f) {
....
}
}This loop may iterate 99 or 100 times. The accuracy of operations involving real numbers depends on the compiler, optimization mode, and many other things.
It is better to rewrite the loop as follows:
void foo(void) {
for (int count = 1; count <= 100; ++count) {
float A = count / 10.0f;
}
}Now it is guaranteed to iterate exactly 100 times, while the 'A' variable can be used for the calculations.
This diagnostic is classified as:
|
V2535. MISRA. Unreachable code should not be present in the project.
This diagnostic rule is based on the software development guidelines developed by MISRA (Motor Industry Software Reliability Association).
Unreachable code may be a sign of a programmer's error and complicates support of code.
For purposes of optimization, the compiler may remove unreachable code. Unreachable code, not removed by the compiler can waste resources. For example, it can increase the size of the binary file or cause unnecessary instruction caching.
Let's consider the first example:
void Error()
{
....
exit(1);
}
FILE* OpenFile(const char *filename)
{
FILE *f = fopen(filename, "w");
if (f == nullptr)
{
Error();
printf("No such file: %s", filename);
}
return f;
}The 'printf(....)' function will never print an error message as the 'Error()' function doesn't return control. A proper way of fixing code depends on the behavior logic initially intended by a programmer. Perhaps, the function must return control. It is also possible that the order of expressions is wrong and the correct code should be as follows:
FILE* OpenFile(const char *filename)
{
FILE *f = fopen(filename, "w");
if (f == nullptr)
{
printf("No such file: %s", filename);
Error();
}
return f;
}Let's consider the second example:
char ch = strText[i];
switch (ch)
{
case '<':
...
break;
case '>':
...
break;
case 0xB7:
case 0xBB:
...
break;
...
}Here the branch after "case 0xB7:" and "case 0xBB:" will never regain control. The 'ch' variable is of the 'char' type and therefore the range of its values lies within [-128..127]. The result of the "ch == 0xB7" and "ch==0xBB" expressions will always be false. The 'ch' variable has to be of the 'unsigned char' type so that the code was correct. Fixed code:
unsigned char ch = strText[i];
switch (ch)
{
case '<':
...
break;
case '>':
...
break;
case 0xB7:
case 0xBB:
...
break;
...
}Let's consider the third example:
if (n < 5) { AB(); }
else if (n < 10) { BC(); }
else if (n < 15) { CD(); }
else if (n < 25) { DE(); }
else if (n < 20) { EF(); } // This branch will never be executed.
else if (n < 30) { FG(); }Due to improper intersection of ranges under conditions, one of the branches will never be executed. Fixed code:
if (n < 5) { AB(); }
else if (n < 10) { BC(); }
else if (n < 15) { CD(); }
else if (n < 20) { EF(); }
else if (n < 25) { DE(); }
else if (n < 30) { FG(); }This diagnostic is classified as:
|
V2536. MISRA. Function should not contain labels not used by any 'goto' statements.
This diagnostic rule is based on the software development guidelines developed by MISRA (Motor Industry Software Reliability Association).
The presence of labels not referenced by any 'goto' operator in the body of the function might indicate an error made by a programmer. Such labels can appear if a programmer accidentally used the wrong label jump or made a typo when creating a case-label.
Let's consider the first example:
string SomeFunc(const string &fStr)
{
string str;
while (true)
{
getline(cin, str);
if (str == fStr)
goto retRes;
else if (str == "stop")
goto retRes;
}
retRes:
return str;
badRet:
return "fail";
}In the body of the function there is the 'badRet' label, not referenced by any 'goto' operator, however there is another referenced 'retRes' label. A programmer made a mistake and instead of going to the 'badRet' label, he jumped to the 'retRes' label again.
The correct code should be as follows:
string SomeFunc(const string &fStr)
{
string str;
while(true)
{
getline(cin,str);
if (str == fStr)
goto retRes;
else if(str == "stop")
goto badRet;
}
retRes:
return str;
badRet:
return "fail";
}Let's consider the second example:
switch (c)
{
case 0:
...
break;
case1: // <=
...
break;
defalt: // <=
...
break;
}A programmer made two typos when writing the 'switch' body which resulted in two labels, not referenced by any 'goto' operator. On top of this rule violation by these labels, the code that contains them turned out to be unreachable.
Fixed code:
switch (c)
{
case 0:
...
break;
case 1:
...
break;
default:
...
break;
}This diagnostic is classified as:
|
V2537. MISRA. Functions should not have unused parameters.
This diagnostic rule is based on the software development guidelines developed by MISRA (Motor Industry Software Reliability Association).
Unused function parameters frequently appear after code refactoring. The function signature does not match its implementation, it's difficult to immediately find out if it is a programmer's error.
Let's consider the example:
static bool CardHasLock(int width, int height)
{
const double xScale = 0.051;
const double yScale = 0.0278;
int lockWidth = (int)floor(width * xScale);
int lockHeight = (int)floor(width * yScale);
....
}From the code you can see that the 'height' parameter was never used in the body of the function. Most likely, there is an error and the initialization of the 'lockHeight' variable has to be as follows:
int lockHeight = (int)floor(height * yScale);This diagnostic is classified as:
|
V2538. MISRA. The value of uninitialized variable should not be used.
This diagnostic rule is based on the software development guidelines developed by MISRA (Motor Industry Software Reliability Association).
If a variable of a POD type isn't initialized explicitly and doesn't have an initializer by default, its value will be undefined. Usage of such value will lead to undefined behavior.
Simple synthetic example:
int Aa = Get();
int Ab;
if (Ab) // Ab - uninitialized variable
Ab = Foo();
else
Ab = 0;Usually errors of using uninitialized variables occur through misprints. For example, it may appear that a different variable should be used in this place. Correct code variant:
int Aa = Get();
int Ab;
if (Aa) // OK
Ab = Foo();
else
Ab = 0;This diagnostic is classified as:
|
V2539. MISRA. Class destructor should not exit with an exception.
This diagnostic rule is based on the software development guidelines developed by MISRA (Motor Industry Software Reliability Association).
This rule only applies to C++. Throwing an exception in the object destructor is a bad practice. Starting from C++11 throwing an exception in the destructor body leads to call of the function 'std::terminate'. What follows from this is that an exception thrown inside a destructor must be handled inside the same destructor.
Let's look at the first example:
LocalStorage::~LocalStorage()
{
...
if (!FooFree(m_index))
throw Err("FooFree", GetLastError());
...
}The analyzer has detected a destructor containing the throw statement outside the try..catch block. This code should be rewritten so that it reports an error in the destructor without using the exception mechanism. If the error is not critical, then it can be ignored:
LocalStorage::~LocalStorage()
{
try {
...
if (!FooFree(m_index))
throw Err("FooFree", GetLastError());
...
}
catch (...)
{
assert(false);
}
}Exceptions can also occur when calling the 'new' operator. If you cannot allocate memory, the 'std::bad_alloc' exception will be thrown. Let's consider the second example:
A::~A()
{
...
int *localPointer = new int[MAX_SIZE];
...
}An exception can also occur when the dynamic_cast operator is applied to references. If the cast is impossible, the exception 'std::bad_cast' will be generated. Let's consider the third example:
B::~B()
{
...
UserType &type = dynamic_cast<UserType&>(baseType);
...
}To fix these errors the code should be rewritten so that 'new' or 'dynamic_cast' would be placed in the 'try-catch' block.
This diagnostic is classified as:
|
V2540. MISRA. Arrays should not be partially initialized.
This diagnostic rule is based on the software development guidelines developed by MISRA (Motor Industry Software Reliability Association).
If one or several array items are initialized explicitly, all the items have to be explicitly initialized as well.
When initializing using the list in curly braces, all uninitialized items will be initialized by default (for example, by zero). Explicit initialization of each item ensures that all items have been assigned the expected value.
Exceptions:
- You may use the form { 0 }, because it clearly indicates that all the items are initialized with zero.
- The array initialized with a single string literal does not require explicit initializer for each element.
- You can partially initialize an array if only designated-initializers are used.
A few examples that violate the rule:
int White[4] = { 0xffff };
int RGBwhite[4] = { 0xffff, 0xffff, 0xffff };
char *a3[100] = { "string", "literals" };
char hi[5] = { 'H', 'i', '!' };
int designated_butNotAll[4] = { [0] = 3,[1] = 1, 0 };Here are some correct examples:
char lpszTemp[5] = { '\0' };
char a1[100] = "string_literal";
char a2[100] = { "string_literal" };
int Black[4] = { 0 };
int CMYKwhite[4] = { 0, 0, 0, 0 };
int CMYKblack[4] = { 0xffff, 0xffff, 0xffff, 0xffff };
int designated_All[4] = { [0] = 3,[1] = 1,[2] = 4 };This diagnostic is classified as:
|
V2541. MISRA. Function should not be declared implicitly.
This diagnostic rule is based on the software development guidelines developed by MISRA (Motor Industry Software Reliability Association).
This rule only applies to C. In the C language, it is valid to use a function without its prior declaration. However, this usage is dangerous because it can cause incorrect operation of the program.
Let's look at a simple example:
char *CharMallocFoo(int length)
{
return (char*)malloc(length);
}Since the header file <stdlib.h> is not included, the C compiler will conclude that the 'malloc' function's return type is 'int'. Incorrect interpretation of return value by the compiler can cause problems when executing a program, including its crash.
If the program is 64-bit, then most likely 32 high bits of the returned address will be lost. So the program will work incorrectly for some time. However when free memory in 4 low gigabytes of address space is run out or significantly fragmented, a buffer outside 4 low gigabytes will be allocated. As the address's high bits are lost, the consequences will be extremely unpleasant and unpredictable. You may find more details about this case in the article "A nice 64-bit error in C".
Correct code:
#include <stdlib.h>
....
char *CharMallocFoo(int length)
{
return (char*)malloc(length);
}This diagnostic is classified as:
|
V2542. MISRA. Function with a non-void return type should return a value from all exit paths.
This diagnostic rule is based on the software development guidelines developed by MISRA (Motor Industry Software Reliability Association).
The analyzer has detected a function with a non-void return type which doesn't return a value on all the paths of execution. According to the C/C++ standard, this can lead to undefined behavior.
Let's consider an example in which an undefined value is returned only occasionally:
BOOL IsInterestingString(char *s)
{
if (s == NULL)
return FALSE;
if (strlen(s) < 4)
return;
return (s[0] == '#') ? TRUE : FALSE;
}There is a typo in the code. If a string length is less than 4 characters, the function will return an undefined value. Correct variant:
BOOL IsInterestingString(char *s)
{
if (s == NULL)
return FALSE;
if (strlen(s) < 4)
return FALSE;
return (s[0] == '#') ? TRUE : FALSE;
}Note. The analyzer tries to identify the cases when the absence of the return value is not an error. Here's a code example, which will be considered safe:
int Foo()
{
...
exit(10);
}This diagnostic is classified as:
|
V2543. MISRA. Value of the essential character type should be used appropriately in the addition/subtraction operations.
This diagnostic rule is based on the software development guidelines developed by MISRA (Motor Industry Software Reliability Association).
This diagnostic rule is only relevant for C. Values of the essential character type should not be used in arithmetic expressions.
The MISRA standard defines the following essential type model, in which a variable may have a type:
- Boolean, if it operates true/false values: '_Bool';
- signed, if operates signed integer numbers, or is an unnamed enum: 'signed char', 'signed short', 'signed int', 'signed long', 'signed long long', 'enum { .... }';
- unsigned, if operates unsigned integer numbers: 'unsigned char', 'unsigned short', 'unsigned int', 'unsigned long', 'unsigned long long';
- floating, if operates floating point numbers: 'float', 'double', 'long double';
- character, if operates only characters: 'char';
- Named enum, if operates a named set of user-specific values: 'enum name { .... };'.
There are no pointers in this model.
According to the essential type model, essential character type values mustn't be used in arithmetic expressions, as they are represented by a non-numerical type.
Let's see the list of correct ways of using character-type variables in arithmetic expressions:
- When adding, one operand must have the character type, another one - of signed or unsigned integer type. The result of such operation has the character type:
- character + [un]signed => character; (1)
- [un]signed + character => character; (2)
- When subtracting, the left operand must have character type and the right operand - the signed or unsigned integer type. The result of this operation will be a value of character type:
- character - [un]signed => character; (3)
- When subtracting, both operands must have character type. The result of such operation will be a value of signed integer type:
- character - character => signed; (4)
An example of the code for which the analyzer will issue warnings:
void foo(char ch, unsigned ui, float f, _Bool b, enum A eA)
{
ch + f; // Essential character type should not be used in
// the addition operation with expression
// of the essential floating type
ch + b; // Also relates to the essential Boolean
ch + eA; // Also relates to the essential enum <A> type
(ch + ui) + (ch - 6); // After the expressions in parentheses
// have been executed, both operands of the
// essential character type are used
// in addition operation
}This diagnostic is classified as:
|
V2544. MISRA. The values used in expressions should have appropriate essential types.
This diagnostic rule is based on the software development guidelines developed by MISRA (Motor Industry Software Reliability Association).
This diagnostic rule is only relevant for C. The values used in expressions should have appropriate essential types.
The MISRA standard defines the following essential type model, in which a variable may have a type:
- Boolean, if it operates true/false values: '_Bool';
- signed, if operates signed integer numbers, or is an unnamed enum: 'signed char', 'signed short', 'signed int', 'signed long', 'signed long long', 'enum { .... }';
- unsigned, if operates unsigned integer numbers: 'unsigned char', 'unsigned short', 'unsigned int', 'unsigned long', 'unsigned long long';
- floating, if operates floating point numbers: 'float', 'double', 'long double';
- character, if operates only characters: 'char';
- Named enum, if operates a named set of user-specific values: 'enum name { .... };'.
There are no pointers in this model.
In C language, there are no restrictions on operations with basic types, but some of these operations may have unspecified/undefined behavior or make no sense at all. For example:
- obtain a value in an array using a Boolean type index;
- try to change the sign of the unsigned integer number;
- work with bit representation, using variables of not unsigned type for this.
Implicit castings to essential Boolean may also be dangerous, as not all decimals can be represented in the binary number system.
void Foo(float f, _Bool other_expr)
{
If (f || other_expr) ....
}The following table gives intersections of operands and operations types, which shouldn't be composed in expressions. These intersections are marked with the 'X' sign.

An example of the code for which the analyzer will issue relevant warnings:
void Foo(float f, _Bool b, int a[], enum E e)
{
if (~a[(e ? 1 : 2) >> (-b * f --> +b) << signed(-24U)]) ....;
}Exception: expression of a signed type with a positive value can be used as the right-hand operand of a shift operator (>>, <<).
void foo(signed vi, unsigned _)
{
assert(vi >= 0);
_ >> vi;
_ << vi;
}This diagnostic is classified as:
|
V2545. MISRA. Conversion between pointers of different object types should not be performed.
This diagnostic rule is based on the software development guidelines developed by MISRA (Motor Industry Software Reliability Association).
This rule applies only to C. Casting a pointer to one type to a pointer to another type could result in undefined behavior if these types are aligned differently.
Example of non-compliant code:
void foo( void )
{
int *pi;
double *pd = ....;
typedef int *PI;
pi = pd; // <=
pi = (int*) pd; // <=
pi = PI(pd); // <=
}This diagnostic also checks the qualifiers of the types referred to by the pointers participating in the conversion:
void foo( void )
{
double **ppd = ....;
const double **ppcd = (const double **) ppd;
double * const *pcpd = ....;
const volatile double * const *pcvpd =
(const volatile double * const *) pcpd;
}An exception is made for cases when the cast is done to pointers to the types 'char', 'signed char', 'unsigned char', or 'void' since such behavior is explicitly defined by the standard.
This diagnostic is classified as:
|
V2546. MISRA. Expression resulting from the macro expansion should be surrounded by parentheses.
This diagnostic rule is based on the software development guidelines developed by MISRA (Motor Industry Software Reliability Association).
The analyzer has detected a potentially incorrect macro definition. The macro and its parameters should be enclosed in parentheses.
When macro parameters or expression are not parenthesized, the intended logic may get disrupted after expanding the macro.
Here is an example of code that will trigger this warning:
#define DIV(x, y) (x / y)This example demonstrates the use of the faulty macro:
Z = DIV(x + 1, y + 2);Expanding the macro will result in the following expression:
Z =(x + 1 / y + 2);To keep the intended logic, the macro definition should be rewritten as follows:
#define DIV(x,y) ((x) / (y))This diagnostic is classified as:
|
V2547. MISRA. The return value of non-void function should be used.
This diagnostic rule is based on the software development guidelines developed by MISRA (Motor Industry Software Reliability Association).
It is possible to call a non-void function without using its return value afterward. There could be an error behind such behavior.
Values returned by non-void functions must always be used. Example of non-compliant code:
int Foo(int x)
{
return x + x;
}
void Bar(int x)
{
Foo(x);
}If the loss of the return value was planned by the developer, it can be cast to the type 'void'. Example of compliant code:
void Bar(int x)
{
(void)Foo(x);
}This diagnostic is classified as:
|
V2548. MISRA. The address of an object with local scope should not be passed out of its scope.
This diagnostic rule is based on the software development guidelines developed by MISRA (Motor Industry Software Reliability Association).
Copying an object's address to a pointer/reference with a long lifetime may cause that pointer/reference to become "dangling" after the original object has ceased to exist. This is a case of memory safety violation. Using data referenced by a "dangling" pointer/reference leads to undefined behavior.
First example of non-compliable code:
int& Foo( void )
{
int some_variable;
....
return some_variable;
}Second example of non-compliable code:
#include <stddef.h>
void Bar( int **ptr )
{
int some_variable;
....
if (ptr != NULL)
*ptr = &some_variable;
}This diagnostic is classified as:
|
V2549. MISRA. Pointer to FILE should not be dereferenced.
This diagnostic rule is based on software development guidelines developed by MISRA (Motor Industry Software Reliability Association).
This rule applies only to C. A pointer to the standard type FILE must not be dereferenced, whether explicitly or implicitly. Copying this object is pointless as the copy will not show the same behavior. Direct use of a FILE object is forbidden because it may be incompatible with the accepted file stream handling design.
Explicit dereferencing is in fact ordinary dereferencing with the use of specific operators:
- *p;
- p->_Placeholder;
- p[0];
Implicit dereferencing involves calling a function inside which the pointer is dereferenced, for example, 'memcpy' or 'memcmp'.
Example of non-compliant code:
void foo()
{
FILE *f = fopen(....);
FILE *d = fopen(....);
....
if (memcmp(f, d, sizeof(FILE)) == 0) { .... } // <=
memset(d, 0, sizeof(*d)); // <=
*d = *f; // <=
....
}This diagnostic is classified as:
|
V2550. MISRA. Floating-point values should not be tested for equality or inequality.
This diagnostic rule is based on the software development guidelines developed by MISRA (Motor Industry Software Reliability Association).
This rule applies only to C++. When comparing values of real types for equality or non-equality, the results may vary depending on the processor being used and compiler settings.
Example of non-compliant code:
const double PI_div_2 = 1.0;
const double sinValue = sin(M_PI / 2.0);
if (sinValue == PI_div_2) { .... }To compare values of real types correctly, either use the predefined constant 'std::numeric_limits<float>::epsilon()' or 'std::numeric_limits<double>::epsilon()' or create your own constant 'Epsilon' of custom precision.
Fixed code:
const double PI_div_2 = 1.0;
const double sinValue = sin(M_PI / 2.0);
// equality
if (fabs(a - b) <= std::numeric_limits<double>::epsilon()) { .... };
// inequality
if (fabs(a - b) > std::numeric_limits<double>::epsilon()) { .... };In some cases, it is allowed to compare two real numbers using the '==' or '!=' operator, for example, when checking a variable for a known value:
bool foo();
double bar();
double val = foo() ? bar() : 0.0;
if (val == 0.0) { .... }The analyzer does not issue the warning if a value is compared with itself. Such a comparison is useful to check a variable for NaN:
bool isnan(double value) { return value != value; }However, a better style is to implement this check through the 'std::isnan' function.
This diagnostic is classified as:
|
V2551. MISRA. Variable should be declared in a scope that minimizes its visibility.
This diagnostic rule is based on the software development guidelines developed by MISRA (Motor Industry Software Reliability Association).
Variables should be declared in as narrow a scope as possible. This will help to avoid potential errors caused by inadvertent use of variables outside their intended scope, as well as minimize memory consumption and increase the program's performance.
Example of non-compliant code:
static void RenderThrobber(RECT *rcItem, int *throbbing, ....)
{
....
int width = rcItem->right - rcItem->left;
....
if (*throbbing)
{
RECT rc;
rc.right = width;
....
}
.... // width is not used anywhere else
}The 'width' variable is used only inside the 'if' block; therefore, it would be reasonable to declare it inside that block. That way, 'width' will be evaluated only if the condition is true, thus saving time. In addition, this will help to prevent incorrect use of the variable in the future.
This diagnostic is classified as:
|
V2552. MISRA. Expressions with enum underlying type should have values corresponding to the enumerators of the enumeration.
This diagnostic rule is based on the software development guidelines developed by MISRA (Motor Industry Software Reliability Association).
The analyzer has detected an unsafe cast of a number to an enumeration. This number may be out of the range of enum values.
Consider the following example:
enum TestEnum { A, B, C };
TestEnum Invalid = (TestEnum)42;Since the standard does not specify a base type for enum, casting a number that is out of the range of enum elements results in unspecified behavior in standards older than C++17 and undefined behavior starting with C++17.
To avoid this, make sure you check numbers before casting them. As an alternative, you could explicitly specify the base type for enum or use 'enum class' whose base type is 'int' by default.
The fixed code – version 1:
enum TestEnum { A, B, C, Invalid = 42 };Version 2:
enum TestEnum : int { A, B, C };
TestEnum Invalid = (TestEnum)42;Version 3:
enum class TestEnum { A, B, C };
TestEnum Invalid = (TestEnum)42;This diagnostic is classified as:
|
V2553. MISRA. Unary minus operator should not be applied to an expression of the unsigned type.
This diagnostic rule is based on the software development guidelines developed by MISRA (Motor Industry Software Reliability Association).
When applying the unary minus operator to a variable of type 'unsigned int', 'unsigned long', or 'unsigned long long', that variable will keep its type and stay 'unsigned', which makes this operation meaningless.
Applying the unary minus operator to a variable of a shorter 'unsigned' integer type resulting from integer promotion may result in getting a 'signed' value, which is not a good practice, so such an operation will also trigger the warning.
Example of non-compliant code:
unsigned int x = 1U;
int y = -x;This diagnostic is classified as:
|
V2554. MISRA. Expression containing increment (++) or decrement (--) should not have other side effects.
This diagnostic rule is based on the software development guidelines developed by MISRA (Motor Industry Software Reliability Association).
Using a decrement (--) or increment (++) operation along with other operators in one expression is not recommended. Using them in an expression that has other side effects makes the code less readable and may result in undefined behavior. A safer practice is to isolate the decrement/increment operators in separate expressions.
Example of non-compliant code:
i = ++i + i--;This code attempts to modify one variable at one sequence point, which results in undefined behavior.
This diagnostic is classified as:
|
V2555. MISRA. Incorrect shifting expression.
This diagnostic rule is based on the software development guidelines developed by MISRA (Motor Industry Software Reliability Association).
In a bitwise shift operation, the value of the right operand must be within the range [0 .. N - 1], where N is the number of bits representing the left operand. Failing to follow this rule leads to undefined behavior.
Example of non-compliant code:
(int32_t) 1 << 128u;
(unsigned int64_t) 2 >> 128u;
int64_X >>= 64u;
any_var << -2u;The following example is a snippet from a real application, where an incorrect bitwise shift operation results in undefined behavior:
UINT32 m_color1_mask;
UINT32 m_color2_mask;
#define ARRAY_LENGTH(x) (sizeof(x) / sizeof(x[0]))
PALETTE_INIT( montecar )
{
static const UINT8 colortable_source[] =
{
0x00, 0x00, 0x00, 0x01,
0x00, 0x02, 0x00, 0x03,
0x03, 0x03, 0x03, 0x02,
0x03, 0x01, 0x03, 0x00,
0x00, 0x00, 0x02, 0x00,
0x02, 0x01, 0x02, 0x02,
0x00, 0x10, 0x20, 0x30,
0x00, 0x04, 0x08, 0x0c,
0x00, 0x44, 0x48, 0x4c,
0x00, 0x84, 0x88, 0x8c,
0x00, 0xc4, 0xc8, 0xcc
};
....
for (i = 0; i < ARRAY_LENGTH(colortable_source); i++)
{
UINT8 color = colortable_source[i];
if (color == 1)
state->m_color1_mask |= 1 << i; // <=
else if (color == 2)
state->m_color2_mask |= 1 << i; // <=
prom_to_palette(machine, i,
color_prom[0x100 + colortable_source[i]]);
}
....
}The value 1 is shifted by i bits to the left at the i-th iteration of the loop. Starting with the 32-nd iteration (given that int is a 32-bit type), the 'i' variable will be taking values within the range [0 .. 43], which is larger than the allowed range.
This diagnostic is classified as:
|
V2556. MISRA. Use of a pointer to FILE when the associated stream has already been closed.
This diagnostic rule is based on the software development guidelines developed by MISRA (Motor Industry Software Reliability Association).
This rule applies only to C. Using a pointer to the standard type 'FILE' after the associated stream has been already closed may lead to errors because that object will be having an undefined state.
Example of non-compliant code:
FILE* f = fopen("/path/to/file.log", "w");
if (f == NULL) { .... }
fprintf(f, "....");
if (....) // something went wrong
{
fclose(f);
fprintf(f, "...."); // Print log information
// after stream has been released.
}This diagnostic is classified as:
|
V2557. MISRA. Operand of sizeof() operator should not have other side effects.
This diagnostic rule is based on the software development guidelines developed by MISRA (Motor Industry Software Reliability Association).
The 'sizeof()' operator does not execute the expression passed to it but only evaluates the type of the resulting expression and returns its size at compile time. Therefore, no assembler code is generated for any code inside 'sizeof()' (unevaluated context) and no operations inside it will ever be executed.
For that reason, to avoid such loss of operations, the operand passed to 'sizeof()' must not have any other side effects.
Example of non-compliant code:
int x = ....;
....
size_t s = n * sizeof(x++);To achieve the desired behavior, the snippet should be rewritten as follows:
int x = ....;
....
++x;
size_t s = n * sizeof(x);This diagnostic is classified as:
|
V2558. MISRA. A pointer/reference parameter in a function should be declared as pointer/reference to const if the corresponding object was not modified.
This diagnostic rule is based on the software development guidelines developed by MISRA (Motor Industry Software Reliability Association).
This diagnostic rule applies only to code written in C++. The analyzer has detected a situation where an object is passed to a function by pointer or reference without being further modified in the body of the function. This may be a sign of a programming mistake. If this is really the programmer's intention not to modify the object, then the function's signature lacks precision without the 'const' qualifier. Adding 'const' helps prevent potential bugs and make the function's implementation clearer.
Example of non-compliant code:
size_t StringEval(std::string &str)
{
return str.size();
}The 'str' variable here is used only to perform a read operation even though it is passed by a non-constant reference. Explicitly declaring the function's parameter constant would signal to the maintainer that the function does not modify the object, and prevent any potential bugs that may occur when changing the function itself.
Fixed code:
size_t StringEval(const std::string &str)
{
return str.size();
}This diagnostic is classified as:
|
V2559. MISRA. Subtraction, >, >=, <, <= should be applied only to pointers that address elements of the same array.
This diagnostic rule is based on the software development guidelines developed by MISRA (Motor Industry Software Reliability Association).
The C/C++ standard specifies (C11 § 6.5.8 paragraph 5; C++17 § 8.5.9 paragraph 3) that applying the operator '-', '>', '>=', '<', or '<=' to two pointers that do not point to the elements of the same array is undefined/unspecified behavior. Therefore, if two pointers point to different array objects, then these objects must be elements of the same array to be comparable.
Example of non-compliant code:
int arr1[10];
int arr2[10];
int *pArr1 = arr1;
if (pArr1 < arr2)
{
....
}The following code is also non-compliant:
int arr1[10];
int arr2[10];
int *pArr1 = &arr1[1];
int *pArr2 = &arr2[1];
int len = pArr1 - pArr2;To learn more about why pointer comparisons may lead to errors, see the article: "Pointers are more abstract than you might expect in C".
This diagnostic is classified as:
|
V2560. MISRA. There should be no user-defined variadic functions.
This diagnostic rule is based on the software development guidelines developed by MISRA (Motor Industry Software Reliability Association).
This diagnostic rule applies only to code written in C++. There should be no user-defined variadic functions (i.e. containing the ellipsis '...') in the code. Arguments passed using the ellipsis cannot be checked by the compiler for type compatibility and using them can, therefore, lead to errors. You may accidentally pass arguments of the wrong types to a function that is declared but not defined. Additionally, passing an argument of a non-POD type leads to undefined behavior.
Example of non-compliant code:
void foo(int _, ...) // <=
{
va_list ap;
va_start(ap, _);
....
va_end(ap);
}The standard, however, does permit the declaration of existing library variadic functions. The following code is allowed:
int printf(const char *fmt, ...);This diagnostic is classified as:
|
V2561. MISRA. The result of an assignment expression should not be used.
This diagnostic rule is based on the software development guidelines developed by MISRA (Motor Industry Software Reliability Association).
Using the assignment operation in subexpressions introduces an additional side effect making the code less readable and more susceptible to new mistakes.
Besides, following this rule significantly reduces the risk of confusing the operators '=' and '=='.
Example of non-compliant code:
int Inc(int i)
{
return i += 1; // <=
}
void neg(int a, int b)
{
int c = a = b; // <=
Inc(a = 1); // <=
if(a = b) {} // <=
}This diagnostic is classified as:
|
V2562. MISRA. Expressions with pointer type should not be used in the '+', '-', '+=' and '-=' operations.
This diagnostic rule is based on the software development guidelines developed by MISRA (Motor Industry Software Reliability Association).
This diagnostic rule applies only to code written in C. Pointers should not be used in expressions with the operators '+', '-', '+=', and '-=' but can be used with the subscript '[]' and increment/decrement ('++'/'--') operators.
The use of address arithmetic makes the program less readable and may cause the maintainer to misinterpret the code. The use of indexing, on the contrary, is explicit and makes the code clearer; even if an expression using the subscript operator to index an array contains a mistake, it will be much easier to find. The same is true for increment/decrement operations: they explicitly convey the developer's intention to successively loop over a memory block that makes a continuous data region.
Example of non-compliant code:
int arr[] = { 0, 1, 2 };
int *p = arr + 1; //+V2562
p += 1; //+V2562Fixed code:
int arr[] = { 0, 1, 2 };
int *p = &arr[1];
++p;
int *q = p[1];This diagnostic is classified as:
|
V2563. MISRA. Array indexing should be the only form of pointer arithmetic and it should be applied only to objects defined as an array type.
This diagnostic rule is based on the software development guidelines developed by MISRA (Motor Industry Software Reliability Association).
This diagnostic rule applies only to code written in C++. This MISRA rule advises against the use of address arithmetic. The only form of address arithmetic it allows is the subscript operation ('[]') applied to an entity declared as an array.
Exception: the rule allows the use of the increment and decrement operations ('++' and '--').
The use of address arithmetic makes the program less readable and may cause the maintainer to misinterpret the code. The use of indexing, on the contrary, is explicit and makes the code clearer; even if an expression using the subscript operator to index an array contains a mistake, it will be much easier to find. The same is true for increment/decrement operations: they explicitly convey the developer's intention to successively loop over a memory block that makes a continuous data region.
Example of non-compliant code:
int arr[] = { 0, 1, 2 };
int *p = arr + 1; //+V2563
p += 1; //+V2563
int *q = p[1]; //+V2563Fixed code:
int arr[] = { 0, 1, 2 };
int *p = &arr[1];
++p;This diagnostic is classified as:
|
V2564. MISRA. There should be no implicit integral-floating conversion.
This diagnostic rule is based on the software development guidelines developed by MISRA (Motor Industry Software Reliability Association).
This diagnostic rule applies only to code written in C++. The code should not contain implicit conversions from floating-point types to integer types, and vice versa.
Integer types are:
- 'signed char', 'unsigned char',
- 'short', 'unsigned short',
- 'int', 'unsigned int',
- 'long', 'unsinged long',
- 'long long', 'unsigned long long'.
Floating-point types are:
- 'float',
- 'double',
- 'long double'.
Implicit conversion from floating-point types to integer types may result in losing some part of the value (for example, the decimal part) or lead to undefined behavior if the floating-point value cannot be represented as an integer value.
Implicit conversion from integer types to floating-point types may result in imprecise representation not meeting the developer's expectations.
Example of non-compliant code:
void foo1(int x, float y);
void foo2()
{
float y = 10;
int x = 10.5;
foo1(y, x);
}Example of code considered compliant from the point of view of this diagnostic:
void foo1(int x, float y);
void foo2()
{
float y = static_cast<float>(10);
int x = static_cast<int>(10.5);
foo1(static_cast<int>(y), static_cast<float>(x));
}This diagnostic is classified as:
|
V2565. MISRA. A function should not call itself either directly or indirectly.
This diagnostic rule is based on the software development guidelines developed by MISRA (Motor Industry Software Reliability Association).
Functions should not call themselves either directly or indirectly. Recursion can lead to elusive bugs such as stack overflow in the case of very deep recursion.
Example of non-compliant code:
#include <stdint.h>
uint64_t factorial(uint64_t n)
{
return n > 1 ? n * factorial(n - 1) : 1;
}Recursive calls should be replaced with loops wherever possible. The following example demonstrates how this can be applied to the code above:
#include <stdint.h>
uint64_t factorial(uint64_t n)
{
uint64_t result = 1;
for (; n > 1; --n)
{
result *= n;
}
return result;
}This diagnostic is classified as:
|
V2566. MISRA. Constant expression evaluation should not result in an unsigned integer wrap-around.
This diagnostic rule is based on the software development guidelines developed by MISRA (Motor Industry Software Reliability Association).
This diagnostic rule applies only to code written in C. As specified by the C standard, an overflow of values of unsigned types results in a wrap-around. Using this mechanism in evaluation of expressions at runtime is a well-known practice (unlike signed types, where an overflow leads to undefined behavior).
However, an unsigned integer wrap-around in expressions evaluated at compile time may be misleading.
Example of non-compliant code:
#include <stdint.h>
#define C1 (UINT_MAX)
#define C2 (UINT_MIN)
....
void foo(unsigned x)
{
switch(x)
{
case C1 + 1U: ....; break;
case C2 - 1U: ....; break;
}
}According to this rule, an unsigned integer wrap-around that occurs when evaluating a constant expression of unsigned type, it will not be treated as an error if the expression will never be evaluated:
#include <stdint.h>
#define C UINT_MAX
....
unsigned foo(unsigned x)
{
if(x < 0 && (C + 1U) == 0x42) ....;
return x + C;
}The '(C + 1U)' expression resulting in an overflow will not be executed since the 'x < 0' condition is always true. Therefore, the second operand of the logical expression will not be evaluated.
This diagnostic is classified as:
|
V2567. MISRA. Cast should not remove 'const' / 'volatile' qualification from the type that is pointed to by a pointer or a reference.
This diagnostic rule is based on the software development guidelines developed by MISRA (Motor Industry Software Reliability Association).
Removing the 'const' / 'volatile' qualifier can lead to undefined behavior.
For example:
- Changing an object declared as 'const' using a pointer/reference to a non-'const' type leads to undefined behavior.
- Accessing an object declared as 'volatile' using a pointer/reference to a non-'volatile' type leads to undefined behavior.
- The compiler can optimize the code if undefined behavior occurs. In the code below, for example, the compiler can make the loop infinite:
inline int foo(bool &flag)
{
while (flag)
{
// do some stuff...
}
return 0;
}
int main()
{
volatile bool flag = true;
return foo(const_cast<bool &>(flag));
}Another example of non-compliant code:
void my_swap(const int *x, volatile int *y)
{
auto _x = const_cast<int*>(x);
auto _y = const_cast<int*>(y);
swap(_x, _y);
}
void foo()
{
const int x = 30;
volatile int y = 203;
my_swap(&x, &y); // <=
}This diagnostic is classified as:
|
V2568. MISRA. Both operands of an operator should be of the same type category.
This diagnostic rule is based on the software development guidelines developed by MISRA (Motor Industry Software Reliability Association).
This diagnostic rule applies only to code written in C. If the entity types of operands do not match when converting arithmetic types, this can lead to non-obvious issues.
The MISRA standard defines an essential type model, where variables can have the following types:
- Boolean for Boolean values true/false: '_Bool';
- signed for signed integers or unnamed enums: 'signed char', 'signed short', 'signed int', 'signed long', 'signed long long', 'enum { .... };';
- unsigned for unsigned integers: 'unsigned char', 'unsigned short', 'unsigned int', 'unsigned long', 'unsigned long long';
- floating for floating-point values: 'float', 'double', 'long double';
- character for characters only: 'char';
- named enum for a named set of user-defined values: 'enum name { .... };'.
This model does not include pointers.
The C language allows much freedom in casting between arithmetic types, but it can also lead to hidden problems such as loss of sign, value, or precision. Despite its strictness, the MISRA standard does allow conversions between arithmetic types when the operands have the same essential types.
Exception: the essential types of the left and right operands of the operators '+', '-', '+=', and '-=' can be 'character' and 'signed' / 'unsigned' respectively.
Example of non-compliant code:
enum { A };
int i;
unsigned u;
void foo()
{
A + u;
0.f - i;
A > (_Bool)0;
}Example of code considered compliant from the viewpoint of this diagnostic:
void foo(unsigned short x, _Bool b)
{
x + 1UL;
if (b && x > 4U) ....
}This diagnostic is classified as:
|
V2569. MISRA. The 'operator &&', 'operator ||', 'operator ,' and the unary 'operator &' should not be overloaded.
This diagnostic rule is based on the software development guidelines developed by MISRA (Motor Industry Software Reliability Association).
This diagnostic rule applies only to code written in C++. The built-in operators '&&', '||', '&' (address-of), and ',' have a specific evaluation order and semantics. When overloaded, they can no longer maintain their specific behavior, and the programmer may not know about that.
1) When overloaded, logical operators no longer support lazy evaluation. When using built-in operators, the second operand is not evaluated if the first operand of '&&' is 'false' or if the first operand of '||' is 'true'. Overloading these operators makes such optimization impossible:
class Tribool
{
public:
Tribool(bool b) : .... { .... }
friend Tribool operator&&(Tribool lhs, Tribool rhs) { .... }
friend Tribool operator||(Tribool lhs, Tribool rhs) { .... }
....
};
// Do some heavy weight stuff
bool HeavyWeightFunction();
void foo()
{
Tribool flag = ....;
if (flag || HeavyWeightFunction()) // evaluate all operands
// no short-circuit evaluation
{
// Do some stuff
}
}The compiler will not be able to optimize this code and will have to execute the "heavy-weight" function, which could have been avoided if the built-in operator had been used.
2) Overloading the unary operator '&' (address-of) can also lead to non-obvious issues. Consider the following example:
// Example.h
class Example
{
public:
Example* operator&() ;
const Example* operator&() const;
};
// Foo.cc
#include "Example.h"
void foo(Example &x)
{
&x; // call overloaded "operator&"
}
// Bar.cc
class Foobar;
void bar(Example &x)
{
&x; // may call built-in or overloaded "operator&"!
}The behavior observed in the second case is considered unspecified according to the C++ standard ($8.3.1.5), which means that applying the 'address-of' operator to the 'x' object may result in randomly calling the built-in operator or its overloaded version.
3) The built-in operator "comma" evaluates the left operand and ignores the resulting value; it then evaluates the right operand and returns its value. The built-in comma operator also guarantees that any side effects of the left operand will have taken place before it starts evaluating the right operand.
There is no such guarantee in the case of the overloaded version (before C++17), so the code below may output 'foobar' or 'barfoo':
#include <iostream>
template <typename T1, typename T2>
T2& operator,(const T1 &lhs, T2 &rhs)
{
return rhs;
}
int main()
{
std::cout << "foo", std::cout << "bar";
return 0;
}This diagnostic is classified as:
|
V2570. MISRA. Operands of the logical '&&' or the '||' operators, the '!' operator should have 'bool' type.
This diagnostic rule is based on the software development guidelines developed by MISRA (Motor Industry Software Reliability Association).
This diagnostic rule applies only to code written in C++. Using the logical operators '!', '&&', and '||' with variables of a type other than 'bool' is pointless; it does not seem to be the intended behavior and may be a sign of a mistake. The programmer probably intended to use a bitwise operator ('&', '|', or '~').
Example of non-compliant code:
void Foo(int x, int y, int z)
{
if ((x + y) && z)
{
....
}
}
void Bar(int *x)
{
if (!x)
{
....
}
}Fixed code:
void Foo(int x, int y, int z)
{
if ((x + y) & z)
{
....
}
}
void Foo(int x, int y, int z)
{
if ((x < y) && (y < z))
{
....
}
}
void Bar(int *x)
{
if (x == NULL)
{
....
}
}This diagnostic is classified as:
|
V2571. MISRA. Conversions between pointers to objects and integer types should not be performed.
This diagnostic rule is based on the software development guidelines developed by MISRA (Motor Industry Software Reliability Association).
Conversions between pointers to objects and integer types can lead to undefined, unspecified, or implementation-specific behavior. For that reason, MISRA does not recommend using such conversions.
Example of non-compliant code 1 (C):
int *p = (int *)0x0042;
int i = p;
enum en { A, B } e = (enum en) p;Example of non-compliant code 2 (C++):
struct S { int16_t i; int16_t j; } *ps = ....;
int i64 = reinterpret_cast<int>(ps);Example of non-compliant code 3 (C and C++):
void foo(int i) {}
void wrong_param_type()
{
char *pc = ....;
foo((int) pc);
}Example of non-compliant code 4 (C and C++):
int wrong_return_type()
{
double *pd = ....;
return (int) pd;
}This diagnostic is classified as:
|
V2572. MISRA. Value of the expression should not be converted to the different essential type or the narrower essential type.
This diagnostic rule is based on the software development guidelines developed by MISRA (Motor Industry Software Reliability Association).
This diagnostic rule applies only to code written in C. The C language allows much freedom in casting between arithmetic types, but it can also lead to hidden problems such as loss of sign, value, or precision.
The MISRA standard defines an essential type model, where variables can have the following types:
- Boolean for Boolean values true/false: '_Bool';
- signed for signed integers or unnamed enums: 'signed char', 'signed short', 'signed int', 'signed long', 'signed long long', 'enum { .... };';
- unsigned for unsigned integers: 'unsigned char', 'unsigned short', 'unsigned int', 'unsigned long', 'unsigned long long';
- floating for floating-point values: 'float', 'double', 'long double';
- character for characters only: 'char';
- named enum for a named set of user-defined values: 'enum name { .... };'.
This model does not include pointers.
Following the essential type model can help to avoid many of the non-obvious issues mentioned above by assigning values of the same essential type to variables. Within this model, you are allowed to assign a value of a narrower essential type to a variable of a wider type. Implicit conversions between different essential types are forbidden.
Exceptions:
- A non-negative constant expression of an essential signed type can be assigned to an object of an essential unsigned type if its value can be represented by this type.
- The '{ 0 }' initializer can be used to initialize an aggregate type or union.
Example of non-compliant code:
typedef enum ENUM {ONE} ENUM;
void Positive(signed char x)
{
unsigned char uchr = x; // <=
unsigned short usht = x; // <=
unsigned int uit = x; // <=
unsigned long ulg = x; // <=
unsigned long long ullg = x; // <=
long double ld = 0.0;
double d = ld; // <=
float f = d; // <=
ENUM e = x; // <=
}Fixed code:
enum {ONE = 1, TWO, THREE, FOUR, FIVE, SIX,
MUCH = 123123, MORE = 0x7FFFFFFF-1};
void Negative()
{
signed char c = ONE; // ok
signed short h = TWO; // ok
signed int i = THREE; // ok
signed long long ll = FOUR; // ok
unsigned char uc = FIVE; // ok
unsigned short uh = SIX; // ok
unsigned int ui = MUCH; // ok
unsigned long long ull = MORE; // ok
float f = 0.0f; // ok
double d = f; // ok
long double ld = d; // ok
ENUM e = c; // ok
}This diagnostic is classified as:
|
V2573. MISRA. Identifiers that start with '__' or '_[A-Z]' are reserved.
This diagnostic rule is based on the software development guidelines developed by MISRA (Motor Industry Software Reliability Association).
As defined by the C++ standard, macro names and identifiers that contain the '__' sequence anywhere or begin with '_[A-Z]' are reserved for use in the language and standard library implementation. The same rule applies to the C language as well, except that the '__' sequence should be at the beginning of a reserved identifier.
Declaring such identifiers outside the standard library may cause problems. For example, this code:
#define _BUILTIN_abs(x) (x < 0 ? -x : x)
#include <cmath>
int foo(int x, int y, bool c)
{
return abs(c ? x : y)
}may change the behavior of the 'abs' function if this function is implemented through the use of the compiler's built-in (intrinsic) function as follows:
#define abs(x) (_BUILTIN_abs(x))This diagnostic is classified as:
|
V2574. MISRA. Functions should not be declared at block scope.
This diagnostic rule is based on the software development guidelines developed by MISRA (Motor Industry Software Reliability Association).
This diagnostic rule is only relevant to C++ programs. A function declared at the block scope will also be visible in the namespace enclosing the block.
Look at the example:
namespace Foo
{
void func()
{
void bar(); // <=
bar();
}
}
void Foo::bar() // Function 'bar' is visible here
{
}The programmer wanted to narrow the scope of the function by declaring it in the 'func' function block. However, the 'bar' function is also visible outside the 'Foo' namespace. Therefore, one should declare the function explicitly in the enclosing namespace:
namespace Foo
{
void bar();
void func()
{
bar();
}
}
void Foo::bar() // Function 'bar' is visible
{
}Also, due to the ambiguity of the C++ grammar, the function declaration may look like an object declaration:
struct A
{
void foo();
};
int main()
{
A a();
a.foo(); // compile-time error
}This problem is known as "Most vexing parse": the compiler resolves this ambiguity of "declaring a function or an object" in favor of "declare a function". Therefore, despite the programmer's intention to declare an object of the 'A' class and call the 'A::foo' non-static member function, the compiler will perceive this as a declaration of the 'a' function, that does not accept parameters and returns type 'A'.
To avoid confusion, the analyzer also warns about such declarations.
This diagnostic is classified as:
|
V2575. MISRA. The global namespace should only contain 'main', namespace declarations and 'extern "C"' declarations.
This diagnostic rule is based on the software development guidelines developed by MISRA (Motor Industry Software Reliability Association).
This diagnostic rule is only relevant to C++. Declarations in the global space clutter the list of available identifiers. New identifiers added to the block's scope may be similar to identifiers in the global space. This can confuse a developer and lead to incorrect identifier choice.
To guarantee the developer's expectations, all identifiers must be located inside the corresponding namespaces.
The analyzer issues a warning for the following code example:
int x1;
void foo();According to the rule, this code should look like this:
namespace N1
{
int x1;
void foo();
}Another possible version with the extern "C" may look like this:
extern "C"
{
int x1;
}
extern "C" void bar();Here is what the MISRA standard suggests. If the name of the type alias contains the size of its final type, we can use 'typedef' in the global namespace.
The analyzer doesn't issue warnings for the following code example:
typedef short int16_t;
typedef int INT32;
typedef unsigned long long Uint64;The analyzer issues warnings for the following code example:
typedef std::map<std::string, std::string> TestData;
typedef int type1;This diagnostic is classified as:
|
V2576. MISRA. The identifier 'main' should not be used for a function other than the global function 'main'.
This diagnostic rule is based on the software development guidelines developed by MISRA (Motor Industry Software Reliability Association).
This diagnostic rule is only relevant to C++. The 'main' function should only be present in the global namespace. This way a developer will be sure - if the 'main' function appears, it is always the entry point to the program.
The analyzer issues a warning for the following code example:
namespace N1
{
int main();
}Another code example that triggers the analyzer:
namespace
{
int main();
}If we rewrite the code by the rule, we will get the following:
namespace N1
{
int start();
}This diagnostic is classified as:
|
V2577. MISRA. The function argument corresponding to a parameter declared to have an array type should have an appropriate number of elements.
This diagnostic rule is based on the software development guidelines developed by MISRA (Motor Industry Software Reliability Association).
This diagnostic rule is only relevant to C. Suppose a formal function parameter was declared as an array with a fixed size. The array is passed as an actual argument. Its size must not be smaller than the array received by the function.
In C, one can pass an array to a function via passing a pointer to its beginning. Therefore, one can pass an array of any size to such a function. However, the function interface becomes less comprehensive when a formal parameter is a pointer. It is not clear whether the function works with a single element or with an array.
To indicate that a function works with a certain number of elements, declare the relevant parameter as an array. A macro is often used to specify the array size. The macro is then used to traverse the array elements:
#define ARRAY_SIZE 32
void foo(int arr[ARRAY_SIZE])
{
for (size_t i = 0; i < ARRAY_SIZE; ++i)
{
// Do something with elements
}
}Keep in mind that such an array is still a pointer. Hence, one can pass an array with fewer elements. This can lead to the array index out of bounds, which is undefined behavior:
#define ARRAY_SIZE 32
void foo(int arr[ARRAY_SIZE]);
void bar()
{
int array1[32] = { 1, ...., 32 };
int array2[28] = { 1, ...., 28 };
foo(array2); // <=
}In this example, the function received an array of a wrong size. The correct option may be:
#define ARRAY_SIZE 32
void foo(int arr[ARRAY_SIZE]);
void bar()
{
int array1[32] = { 1, ...., 32 };
int array2[28] = { 1, ...., 28 };
foo(array1); // <=
}Another option is to change the number of elements of the array passed to the function and fill in the added elements with default values:
#define ARRAY_SIZE 32
void foo(int arr[ARRAY_SIZE]);
void bar()
{
int array1[32] = { 1, ...., 32 };
int array2[32] = { 1, ...., 28 }; // <=
foo(array2);
}If the function processes arrays of different sizes, the rule allows you to use an array of any size as an argument to the function. The array size should be passed in a different way, such as this:
#define ARRAY_SIZE(arr) (sizeof(arr)/sizeof(arr[0]))
void foo(int arr[], size_t count);
void bar()
{
int array1[] = { 1, 2, 3, 4, 5 };
int array2[] = { 10, 20, 30 };
foo(array1, ARRAY_SIZE(array1));
foo(array2, ARRAY_SIZE(array2));
}This diagnostic is classified as:
|
V2578. MISRA. An identifier with array type passed as a function argument should not decay to a pointer.
This diagnostic rule is based on the software development guidelines developed by MISRA (Motor Industry Software Reliability Association).
This diagnostic rule is only relevant to C++. If you pass an array to a function by pointer, you will lose the array size. As a result, the function may receive an array with a fewer number of elements as an argument than it is expected. During execution the function may violate array bounds. This will result in undefined behavior.
Pass the array only by reference not to lose data on the array size. If a function needs to handle arrays of different lengths, use a class to encapsulate the array and its size.
Example of code that does not follow the rule:
void foo(int *ptr);
void bar(int arr[5])
void bar(const char chars[30]);
int main
{
int array[5] = { 1, 2, 3 };
foo(array);
bar(array);
}Acceptable version:
void bar(int (&arr)[5]);
int main
{
int array[7] = { 1, 2, 3, 4, 5 };
bar(array);
}Another code example that does not follow the rule:
void bar(const char chars[30]);
int main()
{
bar("something"); //const char[10]
}An acceptable version with a class for encapsulation:
template <typename T>
class ArrayView
{
T *m_ptr;
size_t m_size;
public:
template <size_t N>
ArrayView(T (&arr)[N]) : m_ptr(arr), m_size(N) {}
// ....
};
void bar(ArrayView<const char> arr);
int main()
{
bar("something");
}This diagnostic is classified as:
|
V2579. MISRA. Macro should not be defined with the same name as a keyword.
This diagnostic rule is based on the software development guidelines by MISRA (Motor Industry Software Reliability Association).
This rule is only relevant for C. The analyzer detected a macro whose name overlaps a keyword.
Examples:
#define if while
#define int float
#define while(something) for (;(something);)Changes in the meaning of keywords are confusing and can lead to incorrect code.
An exception is the redefinition of the 'inline' keyword if the C90 language standard is used.
Here is the example that is valid in C90, but will be considered an error in C99 and later standards:
#define inlineThe diagnostic also ignores keyword overrides if they are identical in terms of semantics, or the macro is expanded into a keyword of the same name.
Example:
#define const constThis diagnostic is classified as:
|
V2580. MISRA. The 'restrict' specifier should not be used.
This diagnostic is based on the MISRA (Motor Industry Software Reliability Association) software development guide.
This rule only applies to programs written in C. The 'restrict' specifier is prohibited in variable declarations, functions' formal parameters, and structure/union fields. Although the compiler may be able to generate better-optimized code, using the 'restrict' specifier may lead to errors if two or more pointers refer to the same memory area.
Below is a code sample that triggers the analyzer's warnings:
void my_memcpy(void * restrict dest,
const void * restrict src,
size_t bytes)
{
// ...
}
typedef struct
{
void * restrict m_field;
} MyStruct;This diagnostic is classified as:
|
V2581. MISRA. Single-line comments should not end with a continuation token.
This diagnostic rule is based on the MISRA (Motor Industry Software Reliability Association) software development guide.
This rule only applies to programs written in C. A continuation token ('\') should not stand at the end of single-line comments.
Example:
// Some comment \It may as well comment out the code line that follows the comment. In the following example, the condition, in fact, is not checked, because 'if' gets commented out, and the code block is always executed:
int startsWith(const char *str, const char *prefix);
void foo();
void foobar(const char *str)
{
// Check that the string doesn't start with foo\bar\
if (startsWith(str, "foo\\bar\\") == 0)
{
foo();
}
....
}Such code can be successfully compiled, and the compiler may not issue warnings.
If any characters other than '\' or a newline follow the '\' character, the next line will not be considered a comment, and the analyzer will not issue a warning:
int startsWith(const char *str, const char *prefix);
void foo();
void foobar(const char *str)
{
// Check that the string doesn't start with "foo\bar\"
if (startsWith(str, "foo\\bar\\") == 0)
{
foo();
}
....
}This diagnostic is classified as:
|
V2582. MISRA. Block of memory should only be freed if it was allocated by a Standard Library function.
This diagnostic rule is based on the MISRA (Motor Industry Software Reliability Association) software development guide.
This rule only applies to programs written in C. The 'free' function releases memory that was dynamically allocated by the 'malloc', 'calloc', or 'realloc' functions. Using the 'free' function twice on the same memory block causes undefined behavior.
Take a look at the following example:
void foo()
{
int arr[50];
// ....
free(arr);
}The analyzer found an error here. The developer calls the 'free' function to delete an array. This is unnecessary and results in undefined behavior. The array is stored on the stack, and the memory is freed automatically when the 'foo' function exits.
Here's another example:
void foo()
{
float *p1 = (float *)malloc(N * sizeof(float));
float *p2 = (float *)malloc(K * sizeof(float));
// ....
free(p1);
free(p1);
}The code contains a typo. The 'free' function is called twice for the memory block with the same pointer, 'p1'. This causes two problems. First, the buffer whose address is stored in the 'p2' variable, is not freed and causes a memory leak. Second, this code produces undefined behavior because the same buffer is released twice.
The fixed code:
void foo()
{
float *p1 = (float *)malloc(N * sizeof(float));
float *p2 = (float *)malloc(K * sizeof(float));
// ....
free(p1);
free(p2);
}This diagnostic is classified as:
|
V2583. MISRA. Line whose first token is '#' should be a valid preprocessing directive.
This diagnostic rule is based on the software development guidelines developed by MISRA (Motor Industry Software Reliability Association).
This diagnostic rule is only relevant to C. Preprocessor directives (lines starting with'#') can be used to conditionally include or exclude code from compilation. Incorrectly written preprocessor directives can lead to incorrect inclusion or exclusion of code while such code changes were not intended. Therefore, all preprocessing directives must be syntactically correct.
Consider an example:
// #define CIRCLE
#define SQUARE
float processArea(float x)
{
#ifdef CIRCLE
return 3.14 * x * x;
#elf defined(SQUARE)
return x * x;
#else1
return 0;
#endif
}The '#elif' and '#else' preprocessor directives are misspelled here. This will exclude all code from the function body. Correct version:
// #define CIRCLE
#define SQUARE
float processArea(float x)
{
#ifdef CIRCLE
return 3.14 * x * x;
#elif defined(SQUARE)
return x * x;
#else
return 0;
#endif
}This diagnostic is classified as:
|
V2584. MISRA. Expression used in condition should have essential Boolean type.
This diagnostic rule is based on the MISRA (Motor Industry Software Reliability Association) software development guide.
This rule only applies to programs written in C. Expressions used in 'if' / 'for' / 'while' conditions should have essential Boolean type.
The MISRA standard introduces the essential type model, where a variable might have one of the following types:
- Boolean, if it uses true/false values: '_Bool';
- signed, if it uses signed integer numbers, or is an unnamed enum: 'signed char', 'signed short', 'signed int', 'signed long', 'signed long long', 'enum { .... };';
- unsigned, if it uses unsigned integer numbers: 'unsigned char', 'unsigned short', 'unsigned int', 'unsigned long', 'unsigned long long';
- floating, if it uses floating point numbers: 'float', 'double', 'long double';
- character, if it uses only characters: 'char';
- Named enum, if it uses a named set of user-specific values: 'enum name { .... };'
Thus, the standard allows the following expressions:
- expression of type bool (from C99);
- expression containing a comparison with '==', '!=', '<', '>', '<=', '>=' operators;
- constants with value 0 or 1.
An example for which the analyzer will issue a warning:
void some_func(int run_it)
{
if (run_it)
{
do_something();
}
// ....
}Here the variable should be explicitly checked against zero:
void some_func(int run_it)
{
if (run_it != 0)
{
do_something();
}
// ....
}Another example:
void func(void *p)
{
if (!p) return;
// ....
}To eliminate the issue, the pointer should be explicitly compared with the null:
void func(void *p)
{
if (p == NULL) return;
// ....
}The analyzer will not issue a warning for such code:
void fun(void)
{
while (1)
{
// ....
}
}This diagnostic is classified as:
|
V2585. MISRA. Casts between a void pointer and an arithmetic type should not be performed.
This diagnostic rule is based on the MISRA (Motor Industry Software Reliability Association) software development guide.
This rule only applies to programs written in C. A cast between a variable or an arithmetic type literal and 'void *' may cause undefined (for floating-point numbers) or platform-specific behavior (for integer types).
Consider the first synthetic example:
void* foo(void)
{
double pi = 3.14;
return pi;
}In this case, the double 'pi' variable is implicitly cast to 'void *'. Such code will lead to undefined behavior.
Take a look at the second synthetic example:
void bar(void)
{
int a = 5;
void* b = (void*)a;
}Here the 'int' variable is explicitly cast to the 'void *' pointer. Further dereferencing of such a pointer may lead to segfault.
This diagnostic is classified as:
|
V2586. MISRA. Flexible array members should not be declared.
This diagnostic rule is based on the MISRA (Motor Industry Software Reliability Association) software development guide.
This rule only applies to programs written in C. Flexible array members should not be declared. Flexible array members are often used if dynamic memory allocation is expected and if the size of the stored data is unknown.
Example:
typedef struct
{
size_t len;
int data[]; // flexible array
} S;
S* alloc_flexible_array(size_t n)
{
S *obj = malloc(sizeof(S) + (n * sizeof(int)));
obj->len = n;
return obj;
}With such flexible array members, the size of the 'data' array is determined at runtime according to the actual amount of data.
Such flexible array members are dangerous because 'sizeof' gives a wrong result.
Another problem is that a copy of such flexible array member may lead to unexpected results, even if the size is calculated correctly. Consider the corresponding example:
typedef struct
{
size_t len;
int data[];
} S;
S* make_copy(S *s)
{
S *copy = malloc(sizeof(S) + (s->len * sizeof(int)));
*copy = *s;
return copy;
}Even though the correct amount of memory is allocated, only the 'len' field gets into the copy.
Flexible array members are often declared in the wrong way:
typedef struct
{
size_t len;
int data[1];
} S;This is a one-element array. The compiler might consider accessing such an array past the first element as undefined behavior and optimize the code unexpectedly.
This diagnostic is classified as:
|
V2587. MISRA. The '//' and '/*' character sequences should not appear within comments.
This diagnostic rule is based on the MISRA (Motor Industry Software Reliability Association) software development standard.
This rule applies only to C. Comments must not contain character sequences that are reserved to indicate a comment's beginning. This is possible if a comment block was not closed with the '*/' sequence or if a block was commented out line-by-line with the '//' sequences.
For example:
/* this comment is not closed
some_critical_function();
/* We're still inside the comment */In the code above, the first comment block is not closed and the second block of comments is opened inside the first one. In this scenario, crucial code may end up inside comments.
The problem extends to single-line comments as well. For example:
int some_function(int x, int y)
{
return x // /*
+ y
// */
;
}A single-line comment takes precedence over the multi-line one. Thus, the resulting expression is the following:
return x + y;instead of the expected one:
int x = y;The analyzer does not issue a warning if the '//' sequence is inside a single-line comment:
....
// some_unecessary_call_1(); // probably, should not do this
// some_unecessary_call_2(); // probably, should not do this too
....In the code above, somebody must have added comments after method calls - and then commented out the entire code block as single-line comments.
This diagnostic is classified as:
|
V2588. MISRA. All memory or resources allocated dynamically should be explicitly released.
This diagnostic rule is based on the MISRA (Motor Industry Software Reliability Association) software development standard.
This rule applies only to C. The analyzer detected a potential memory or resource leak. The memory or resource had been allocated with standard library functions, such as: 'malloc', 'calloc', 'realloc', or 'fopen'.
For example:
void foo()
{
int *a = (int*)malloc(40 * sizeof(int));
int *b = (int*)malloc(80 * sizeof(int));
....
free(a);
}The code above dynamically allocates two buffers, but when the function exits, only one of them is released. This creates a memory leak.
You can fix the code fragment in the following way:
void foo()
{
int *a = (int*)malloc(40 * sizeof(int));
int *b = (int*)malloc(80 * sizeof(int));
....
free(a);
free(b);
}Let's take a look at a different example:
void bar(bool b)
{
FILE *f = fopen("tmp", "r");
if (b)
{
return;
}
....
fclose(f);
}The function above opens and reads a file - and does not close it on one of the exit paths. This results in a file descriptor leak.
Below is the correct code:
void bar(bool b)
{
FILE *f = fopen("tmp", "r");
if (b)
{
fclose(f);
return;
}
....
fclose(f);
}This diagnostic is classified as:
|
V2589. MISRA. Casts between a pointer and a non-integer arithmetic type should not be performed.
This diagnostic rule is based on the MISRA (Motor Industry Software Reliability Association) software development guide.
This rule only applies to programs written in C. A cast between a non-integer arithmetic type and a pointer may lead to undefined behavior.
The MISRA standard introduces the Essential type model, where a variable might have the following types:
- Boolean, if it operates true/false values: '_Bool';
- signed, if it operates signed integer numbers, or is an unnamed enum: 'signed char', 'signed short', 'signed int', 'signed long', 'signed long long', 'enum { .... };';
- unsigned, if it operates unsigned integer numbers: 'unsigned char', 'unsigned short', 'unsigned int', 'unsigned long', 'unsigned long long';
- floating, if it operates floating-point numbers: 'float', 'double', 'long double';
- character, if it operates only characters: 'char';
- Named enum, if it operates a named set of user-defined values: 'enum name { .... };'
A cast between essential 'Boolean', 'character' or 'enum' and a pointer may lead to a misaligned pointer, which causes undefined behavior. Example:
enum Nums
{
ONE,
TWO,
....
};
double* bar(Nums num)
{
....
return (double*)num;
}A cast between a pointer and essential types described above may result in a value unrepresentable within the destination essential type, which also leads to undefined behavior. Example:
void foo(void)
{
....
char *a = "something";
char b = a;
....
}A cast between an essential 'floating' type and a pointer leads to undefined behavior. Example:
void foo(short *p)
{
// ....
float f = (float) p;
// ....
}This diagnostic is classified as:
|
V2590. MISRA. Conversions should not be performed between pointer to function and any other type.
This diagnostic rule is based on the MISRA (Motor Industry Software Reliability Association) software development standard.
This rule applies only to C. Type casting between a pointer to function and any other type causes undefined behavior. Type casting between pointers to functions of incompatible types causes undefined behavior when this function is called.
The example below demonstrates type casting between pointers to functions of incompatible types. Both casts are potentially fatal:
void foo(int32_t x);
typedef void (*fp)(int16_t x);
void bar(void)
{
fp fp1 = (fp)&foo;
int32_t(*fp2)(void) = (int32_t (*)(void))(fp1);
}The following code is incorrect because a pointer to a function is cast to other types:
void* vp = (void*)fp1;
int32_t i32 = (int32_t)foo;
fp fp3 = (fp)i32;Calling the function through pointers obtained in that way may lead to segmentation errors.
Exceptions:
Type casting between a null pointer constant and a pointer to a function is possible:
fp fp3 = NULL;Casting between a pointer to a function and the 'void' type:
(void) fp4;Implicit casting between a function and a pointer to the same function:
(void(*)(int32_t)) foo;This diagnostic is classified as:
|
V2591. MISRA. Bit fields should only be declared with explicitly signed or unsigned integer type
This diagnostic rule is based on the software development guidelines developed by MISRA (Motor Industry Software Reliability Association).
This rule is only relevant to C. According to various C language standard versions, bit fields must be declared only with corresponding types. For C90: 'signed int' or 'unsigned int'. For C99: 'signed int', 'unsigned int', '_Bool' or another integral type allowed by the implementation must explicitly specify the modifier 'signed' or 'unsigned'.
It is also allowed to use an alias ('typedef') for a valid type.
A bit field of 'int' type can be 'signed' or 'unsigned' depending on the compiler. If you use 'unsigned int' to represent a bit field, all the bits allocated for the field will be significant. Such a bit field of 'n' bits has a range of values '[0, 2 ^ n - 1]'.
If you use 'signed int' to represent the bit field, 1 bit will be allocated for the sign. To write a significant part of a bit field value a developer will use 1 bit less than allocated. Such a bit field of 'n' bits has a range of values '[-2 ^ (n - 1), 2 ^ (n - 1) - 1]'.
So, depending on the compiler, bit fields of 'int' type may have different ranges of values. To avoid potential errors, explicitly specify the modifier - 'signed' or 'unsigned'.
An example of a bit field misuse:
struct S
{
int b : 3; // <=
};
void foo()
{
S s;
s.b = 5;
if (s.b != 5)
{
Boom();
}
}In this example, the compiler may choose an unsigned type for 'b' bit field representation. This way all 3 bits in which 5 is written will be significant. In fact, a modulo 8 residue is written. The code will work as expected — 5 will be written to the bit field.
If the compiler chooses a signed type to represent the 'b' bit field, the latter splits into 1 bit sign and 2 bits of a significant part. When writing 5 in 'b', only 2 low bits will be written in significant part. 1 will be written in the bit field instead of 5. The check will pass, the 'Boom' function will be called.
To fix it, explicitly specify the modifier - 'signed'/'unsigned':
struct S
{
unsigned int b : 3;
};
void foo()
{
S s;
s.b = 5;
if (s.b != 5)
{
Boom();
}
}You can explicitly specify which types are allowed to declare bit fields by your compiler that supports C99 standard. To do this, add the following comment to the source code or the pvsconfig file.
//V_2591_ALLOWED_C99_TYPES:short,long longAfter the colon, write allowed types in a comma-separated list. Don't specify signed/unsigned:
- 'char'
- 'short'
- 'long'
- 'long long'
This diagnostic is classified as:
|
V2592. MISRA. An identifier declared in an inner scope should not hide an identifier in an outer scope.
This diagnostic rule is based on the MISRA (Motor Industry Software Reliability Association) software development guide.
This rule only applies to programs written in C. An identifier declared in an inner scope and an identifier declared in an outer scope should have different names. Otherwise, an identifier declared in the inner scope hides the one from the outer scope. This can lead to confusion or a software error.
Such a name collision may result in a logical error as in the example below:
int foo(int param)
{
int i = 0;
if (param > 0)
{
int i = var + 1;
}
return i;
}The 'foo' function receives a positive parameter value. At first glance the function seems to return this value increased by '1'. However, that does not happen. In fact, the function always returns '0'. To prove that let's change the identifiers names:
int foo(int param)
{
int i_outer = 0;
if (param > 0)
{
int i_inner = var + 1;
}
return i_outer;
}Now it is clear that the value of the 'i' variable in the 'if' branch does not affect the result of the 'foo' function. The 'i' identifier ('i_inner') in the inner scope hides the 'i' identifier ('i_outer') from the outer scope. An error occurs.
This diagnostic is classified as:
|
V2593. MISRA. Single-bit bit fields should not be declared as signed type.
This diagnostic rule is based on the software development guidelines developed by MISRA (Motor Industry Software Reliability Association).
This rule is only relevant to C. Don't declare single-bit bit fields as a signed type. According to the standard C99 §6.2.6.2C99 § 6.2.6.2, a single-bit bit field of a signed type has one bit for the sign and zero - for values. With any representation of integers, zero significant bits can't specialize any significant number.
Although C90 has no such description, the rule applies also for this version of the standard.
Consider an example:
struct S
{
int a : 1;
};
void foo()
{
struct S s;
s.a = 1;
if (s.a > 0)
{
DoWork();
}
}The bit field is explicitly assigned '1' and must be positive. But the check for this will fail—'1' in the 's.a' field may be interpreted differently. It depends on the compiler implementation. To compare types, they will be cast to the 'int' type. The result is '-1' (0xFFFFFFFF). So, the 'DoWork()' function will not be executed because the condition '-1 > 0' is false. Correct option:
struct S
{
unsigned a : 1;
};
void foo()
{
struct S s;
s.a = 1u;
if (s.a > 0u)
{
DoWork();
}
}The exception is unnamed bit fields, because one can't use a value from such a field:
struct S
{
int a : 31;
int : 1; // ok
};This diagnostic is classified as:
|
V2594. MISRA. Controlling expressions should not be invariant.
This diagnostic rule is based on the MISRA (Motor Industry Software Reliability Association) software development guide.
This rule only applies to programs written in C. Controlling expressions in 'if', '?:', 'while', 'for', 'do', 'switch' should not be invariant, that is, controlling expressions should not always lead to executing the same code branch. An invariant value in a controlling expression may indicate a program error. The compiler may remove any code, unreachable due to an invariant expression. Expressions containing 'volatile' variables are not invariant.
Exceptions:
- 'do' loops with a controlling expression of the essential 'Boolean' type, which is evaluated as '0';
- invariants that are used to create infinite loops.
Note. The following invariants may be used to create infinite loops:
- literals of the essential 'Boolean' type: '1' or 'true' (C99);
- converting a constant literal '1' to an essential 'Boolean' type (for example, '(bool) 1');
- 'for' loop without a controlling expression.
Consider an example:
void adjust(unsigned error)
{
if (error < 0)
{
increase_value(-error);
}
else
{
decrease_value(error);
}
}This example illustrates the error. The condition is always false because the function receives an unsigned integer. As a result, the 'decrease_value' function is always called. The compiler may remove the code branch with the 'increase_value' function.
This diagnostic is classified as:
|
V2595. MISRA. Array size should be specified explicitly when array declaration uses designated initialization.
This diagnostic rule is based on the software development guidelines developed by MISRA (Motor Industry Software Reliability Association).
This rule is only relevant to C. When designated initialization is used to initialize objects in an array, implicit array size specification may lead to errors. It is because changing object initializers will implicitly resize the array. Specify the number of elements explicitly. This way the array size will be determined accurately and quickly.
int arr[] = { [0] = 5, [7] = 5, [19] = 5, [3] = 2 };What if this array size is specified implicitly? Its size is determined by the largest index of initialized objects. When there are many initialized objects, a developer may not always determine the array size correctly. Besides that, deleting or adding initialization of the highest index object can change the size significantly:
int arr[] = { [0] = 5, [7] = 5, [3] = 2 };The array size decreased from 20 to 8 elements. The array index may end up out of bounds in the piece where we expect this array with 20 elements.
According to the rule, safe array declaration may look as follows:
int arr[20] = { [0] = 5, [7] = 5, [19] = 5, [3] = 2 };This diagnostic is classified as:
|
V2596. MISRA. The value of a composite expression should not be assigned to an object with wider essential type.
This diagnostic rule is based on the software development guidelines developed by MISRA (Motor Industry Software Reliability Association).
This diagnostic rule is relevant only to C. The C language allows much freedom in casting between arithmetic types. But such implicit conversions can also lead to hidden problems such as loss of sign, value, or precision.
Code example:
void foo()
{
....
uint16_t var_a = 30000;
uint16_t var_b = 40000;
uint32_t var_sum;
var_sum = var_a + var_b; /* var_sum = 70000 or 4464? */
....
}When you calculate the 'var_sum' variable value an implicit type conversion from the 'uint16_t' type to 'int' occurs. In consequence, the assignment result depends on the 'int' type size.
If 'int' has the 32-bit size, the modulo 2^32 operation is performed, and the expected '70000' value is written to the 'var_sum' variable.
If 'int' has the 16-bit size, the modulo 2^16 operation is performed, and the '70000 % 65536 == 4464' value is be written to the 'var_sum' variable.
The MISRA standard introduces the Essential type model to prevent such errors. A variable might have the following types in this model:
- Boolean, if it operates true/false values: '_Bool';
- signed, if it operates signed integer numbers, or is an unnamed enum: 'signed char', 'signed short', 'signed int', 'signed long', 'signed long long', 'enum { .... };';
- unsigned, if it operates unsigned integer numbers: 'unsigned char', 'unsigned short', 'unsigned int', 'unsigned long', 'unsigned long long';
- floating, if it operates floating-point numbers: 'float', 'double', 'long double';
- character, if it operates only characters: 'char';
- Named enum, if it operates a named set of user-defined values: 'enum name { .... };'.
Use the Essential type model to reduce the number of such subtle problems. Avoid assigning composite expressions that have a narrower essential type to variables of a wider essential type or passing such expressions to a function as an argument of a wider type.
To correct the code above, use an explicit conversion to 'uint32_t':
void foo()
{
....
uint16_t var_a = 30 000;
uint16_t var_b = 40 000;
uint32_t var_sum;
var_sum = (uint32_t)var_a + var_b; /* var_sum = 70 000 */
....
};Now the modulo 2^32 operation is performed in all cases, no matter what size the 'int' type has, and the error doesn't occur even if 'int' has the 16-bit size.
This diagnostic is classified as:
|
V2597. MISRA. Cast should not convert pointer to function to any other pointer type.
This diagnostic rule is based on the MISRA (Motor Industry Software Reliability Association) software development standard.
This rule applies only to C++. When a pointer to a function is cast to any other pointer, undefined behavior occurs. Type casting between pointers to functions of incompatible types causes undefined behavior when this function is called.
The code below violates this rule - all four type casts are invalid:
void foo(int32_t x);
typedef void (*fp)(int16_t x);
void bar()
{
fp fp1 = reinterpret_cast<fp>(&foo);
fp fp2 = (fp)foo;
void* vp = reinterpret_cast<void*>(fp1);
char* chp = (char*)fp1;
}Using such pointers to call the function may potentially cause segmentation errors.
This diagnostic is classified as:
|
V2598. MISRA. Variable length array types are not allowed.
This diagnostic rule is based on the MISRA (Motor Industry Software Reliability Association) manual for software development.
This rule only applies to C. Declaring variable-length arrays can lead to a stack overflow and potential vulnerabilities in the program.
Look at the example:
void foo(size_t n)
{
int arr[n];
// ....
}Transmission of large number 'n' can lead to a stack overflow as the array will become too large and take up more memory than it really is.
The most logical way is to limit the size of the array:
#define MAX_SIZE 128
void foo(size_t n)
{
size_t size = n > MAX_SIZE ? MAX_SIZE : n;
int arr[size];
if (size < n) // error
// ....
}However, in this case it is better to use a constant to simplify the logic of the program:
#define SIZE 128
void foo()
{
int arr[size];
// ....
}This will also help to avoid VLA-connected problems like calculating 'sizeof' on such arrays and passing them to other functions.
This diagnostic is classified as:
|
V2599. MISRA. The standard signal handling functions should not be used.
This diagnostic rule is based on the software development guidelines developed by MISRA (Motor Industry Software Reliability Association).
Standard library functions of the header files <signal.h> / <csignal> may be dangerous. Their behavior depends on the implementation, and their use may cause undefined behavior.
The use of signal handlers in a multithreaded program, for example, could be one of the reasons for undefined behavior. Other reasons you will find here.
The analyzer issues this warning when it detects the following functions:
- signal;
- raise.
Here is an example of code triggering this warning:
#include <signal.h>
void handler(int sig) { .... }
void foo()
{
signal(SIGINT, handler);
}This diagnostic is classified as:
|
V2600. MISRA. The standard input/output functions should not be used.
This diagnostic rule is based on the MISRA (Motor Industry Software Reliability Association) manual for software development.
The standard library functions from the '<stdio.h>' / '<cstdio>' and '<wchar.h>' header files can be dangerous. Their behavior depends on the implementation. Besides, their use may lead to undefined behavior.
Look at the code fragment:
#include <stdio.h>
void InputFromFile(FILE *file); // Read from 'file'
void foo()
{
FILE *stream;
....
InputFromFile(stream);
fflush(stream);
}First, the code reads data via the 'stream' file descriptor, which is then passed to the 'fflush' function. This sequence of operations leads to undefined behavior.
The analyzer issues a warning if it detects the use of any functions defined in the '<stdio.h>' / '<cstdio>' and '<wchar.h>' header files:
- fopen;
- fclose;
- freopen;
- fflush;
- setbuf;
- setvbuf;
- etc.
For example, the analyzer issues a warning for the code below:
#include <stdio.h>
void foo(const char *filename, FILE *oldFd)
{
FILE *newFd = freopen(filename, "r", oldFd);
....
}This diagnostic is classified as:
|
V2601. MISRA. Functions should be declared in prototype form with named parameters.
This diagnostic rule is based on the software development guidelines developed by MISRA (Motor Industry Software Reliability Association).
This diagnostic rule is relevant only to C. It's not safe to use the "K&R" function declaration as well as unnamed function parameters.
Old-style "K&R" function declarations do not carry information about the types and number of parameters, so the use of such functions can lead to errors.
The use of named function parameters provides valuable information about the function interface and allows you to track an error if the names in the declaration and definition do not match.
Code example:
// header
void draw();
// .c file
void draw(x, y)
double x;
double y;
{
// ....
}
// usage
void foo()
{
draw(1, 2);
}The 'draw' function declaration doesn't have parameters. So, when you call the 'draw' function, 2 parameters of the 'int' type and not 'double' type are passed to it. It's an error. Function declaration with a prototype fixes the problem:
// header
void draw(double x, double y);
// .c file
void draw(double x, double y)
{
// ....
}If a function has no parameters, then the use of empty parentheses in its declaration is not correct, because such a declaration corresponds to the "K&R" style:
void foo();Such a declaration allows to pass any number of arguments. To explicitly indicate that a function has no parameters, you need to use the 'void' keyword:
void foo(void);Unnamed parameters make the function interface less understandable:
void draw(double, double);To avoid errors when you use a function, give names to parameters:
void draw(double x, double y);This diagnostic is classified as:
|
V2602. MISRA. Octal and hexadecimal escape sequences should be terminated.
This diagnostic rule is based on the MISRA (Motor Industry Software Reliability Association) software development standard.
This rule applies only to C. Sequences of octal and hexadecimal numbers inside string and character literals must be terminated. This helps avoid errors when determining where an escape sequence ends.
Example:
const char *str = "\x0exit";This string literal is 4 characters long, instead of 5, as it may seem at first. The '\x0e' sequence is one character that has the 0xE code - not a character, that has a zero code, followed by the letter 'e'.
To avoid this confusion, one must terminate the escape sequence in one of two ways:
- terminating the string literal;
- starting a new escape-sequence.
The 2 examples below show the right way to terminate an escape sequence:
const char *str1 = "\x0" "exit";
const char *str2 = "\x1f\x2f";This diagnostic is classified as:
|
V2603. MISRA. The 'static' keyword shall not be used between [] in the declaration of an array parameter.
This diagnostic rule is based on the MISRA (Motor Industry Software Reliability Association) manual for software development.
This rule only applies to C. You shouldn't use the 'static' keyword to precede the value that defines the size of an array accepted by a function, as this keyword may be ignored. The keyword is only an indication to the compiler. On the basis of that indication the compiler can generate more efficient code.
Example:
void add(int left[static 10], int right[static 10])
{
for(size_t i = 0U; i < 10U; ++i)
{
left[i] += right[i];
}
}
extern int data1[10];
extern int data2[20];
extern int data3[5];
void foo(void)
{
add(data1, data2);
add(data1, data3);
}The 'add' function is called several times in code. The formal parameters of this function are two arrays of at least 10 elements in size. The second function call will lead to undefined behavior since the actual array size (5) is less than expected (10).
This diagnostic is classified as:
|
V2604. MISRA. Features from <stdarg.h> should not be used.
This diagnostic rule is based on the MISRA (Motor Industry Software Reliability Association) manual for software development.
This rule only applies to C. You shouldn't use the '<stdarg.h>' header file that includes the 'va_list' type , as well as macros 'va_arg', 'va_start', ' va_end' and 'va_copy'. They are necessary for working with functions with a variable number of arguments. However, the improper use of the '<stdarg.h>' header file often causes undefined behavior.
Look at the example:
#include <stdint.h>
#include <stdarg.h>
void foo(va_list args)
{
double y;
y = va_arg(args, int);
}
void bar(uint16_t count, ...)
{
uint16_t x;
va_list ap;
va_start (ap, count); // <=
x = va_arg (ap, int);
foo(ap);
x = va_arg (ap, int);
}
void baz(void)
{
bar(1.25, 10.07);
}The code above demonstrates several problems that can lead to undefined behavior. Note: the list below contains only the issues that relate to this diagnostic:
- The 'va_start' macro is called in the 'bar' function. However, the 'va_end' macro is not called.
- The 'va_arg' macro is applied to the same 'va_list' object in different functions. The developer cannot control the what state the argument list is in as well as the number of elements that were extracted from it after passing the 'ap' variable to the function. Hence the problem.
- The 'bar' function with the arguments of the 'double' type is called in the 'baz' function, although the 'bar' function expects 'int'. Calling the 'bar' function can lead to data loss.
This diagnostic is classified as:
|
V2605. MISRA. Features from <tgmath.h> should not be used.
This diagnostic rule is based on the MISRA (Motor Industry Software Reliability Association) software development guide.
This rule only applies to programs written in C. Functions or macros from the '<tgmath.h>' header file should not be used. They may lead to undefined behavior.
Look at the example:
void bar(float complex fc)
{
ceil(fc); // undefined behavior
}The 'ceil' function call with an actual argument of the 'float complex' type leads to undefined behavior because the standard library does not contain a specialized version with such formal parameter type.
If a specialized function exists, it should be used to avoid such situations:
#include <tgmath.h>
float foo(float x)
{
return sin(x);
}For the 'sin' function, a specialized version with a formal argument of the 'float' type - 'sinf' type exists:
#include <math.h>
float foo(float x)
{
return sinf(x);
}This diagnostic is classified as:
|
V2606. MISRA. There should be no attempt to write to a stream that has been opened for reading.
This diagnostic rule is based on the MISRA (Motor Industry Software Reliability Association) manual for software development.
This rule only applies to C. The C standard does not define the behavior when the 'fputs' function writes data into a read-only file. Therefore, this is an incorrect behavior.
Look at the example:
void foo(void)
{
FILE *file = fopen("file.txt", "r");
if (file != NULL)
{
fputs(file, "I am writing to the read-only file\n");
fclose(file);
}
}The file.txt file was opened in read-only mode, but at the same time the 'fputs' function writes data into it. The software may behave unpredictably in this situation.
Most likely it's a typo and you need to change the opening mode:
void foo(void)
{
FILE *file = fopen("file.txt", "w");
if (file != NULL)
{
fputs(file, "I am writing to the write-only file\n");
fclose(file);
}
}This diagnostic is classified as:
|
V2607. MISRA. Inline functions should be declared with the static storage class.
This diagnostic rule is based on the software development guidelines developed by MISRA (Motor Industry Software Reliability Association).
This rule is only relevant to C. Functions with the 'inline' qualifier must be declared with the 'static' qualifier.
If an inline function with 'external linkage' is declared in a translation unit but is not defined in this translation unit, this will result in undefined behavior.
Even an 'inline' function with 'external linkage' that is declared and called in one translation unit may cause a problem. Such a call is unspecified behavior. The compiler can generate a function call or embed the body of that function instead of the call. Although this will not affect the called function behavior, it can impact the program runtime and thus affect the program during its execution.
Code example that the analyzer will issue a warning for:
#include <stdint.h>
extern inline int64_t sum(int64_t lhs, int64_t rhs);
extern inline int64_t sum(int64_t lhs, int64_t rhs)
{
return lhs + rhs;
};This diagnostic is classified as:
|
V2608. MISRA. The 'static' storage class specifier should be used in all declarations of object and functions that have internal linkage.
This diagnostic rule is based on the software development guidelines developed by MISRA (Motor Industry Software Reliability Association).
A function or object declared once with internal linkage will also have internal linkage when redeclared or defined. This may not be obvious to developers, and therefore you should explicitly specify the 'static' specifier in each declaration and definition.
For C++, this rule applies only to functions.
The following code does not comply with the rule, since the definition does not reflect the internal linkage type specified in the 'foo' function declaration with the 'static' keyword:
static void foo(int x); //in header.h
void foo(int x) //in source.cpp
{
....
}According to the rule, the code fragment should be as follows:
static void foo(int x); //in header.h
static void foo(int x) //in source.cpp
{
....
}In the example below, the definition of the 'foo' function with the 'extern' storage class specifier does not specify the external linkage type, as it might seem. The linkage type remains internal:
static void foo(int x); //in header.h
extern void foo(int x) //in source.cpp
{
....
}The C Standard allows using such code, but in this case, it is misleading. According to MISRA, here is the correct option:
extern void foo(int x); //in header.h
extern void foo(int x) //in source.cpp
{
....
}A similar example with a global variable that violates the MISRA C rule:
static short y; //in header.h
extern short y = 10; //in source.cThe 'y' variable has the internal linkage type. This may not be obvious. A valid option would be:
static short y; //in header.h
static short y = 10; //in source.cor
extern short y; //in header.h
extern short y = 10; //in source.cThis diagnostic is classified as:
|
V2609. MISRA. There should be no occurrence of undefined or critical unspecified behaviour.
This diagnostic rule is based on the software development guidelines developed by MISRA (Motor Industry Software Reliability Association).
This rule is only relevant to C. If undefined behaviour occurs in a program, a developer has no guarantees how the program will run. This behaviour is inadmissible.
If critical unspecified behaviour occurs in a program, it means that depending on the compiler and its configuration, generated executable code may vary. This behaviour is inadmissible as well.
Undefined or unspecified behaviour can be unpredictable. Not all cases of undefined behaviour are recognizable. Therefore, an algorithm that guarantees the absence of undefined or unspecified behaviour in a particular program doesn't exist.
However, many situations may lead to undefined or critical unspecified behaviour. The analyzer can recognize them algorithmically. Let's look at some of these cases.
You can often determine possible dereferencing of a null pointer. Here is a code fragment:
void foo()
{
int len = GetLen();
char *str = (char *) malloc(mlen + 1);
str[len] = '\0';
}There is no protection from null pointer dereferencing in this code. If the 'malloc' function cannot allocate memory, it will write 'nullptr' to the 'str' variable. Then 'nullptr' will be dereferenced in the expression 'str[len]', which is undefined behaviour. The analyzer will issue a warning:
V2609 Undefined behaviour should not occur. There might be dereferencing of a potential null pointer 'str'. Check lines: 4, 5.
At first, it may seem that such errors immediately lead to the program crash. At the beginning of the address space, the first pages of memory are protected by the operating system. And if you try to address to them, the operating system will generate a signal/exception. Which means the error is not critical. And that's not true.
- If the 'len' variable has a large value, the 'str[len]' expression can refer to relatively remote memory cells available for recording. Writing null there will lead to unpredictable consequences. That is, to undefined behaviour.
- A program crash is a critical error for some apps as well.
- In some microcontroller architectures, low addresses of the address space are not protected from recording. And the operating system will not detect the writing by the null pointer. They often don't have an operating system at all.
More detailed information you will find in the article: "Why it is important to check what the malloc function returned".
One more situation that analyzer can recognize algorithmically - a variable modification between two sequence points and repeated access to it.
Here is a code fragment:
void foo()
{
int *ptr;
....
*ptr++ = *(ptr + 1);
}From developer's perspective, first, the 'ptr' pointer will be increased by 1. Then the expression 'ptr + 1' would be evaluated, and the new value 'ptr' would be used.
However, here, we access the 'ptr' variable twice between the two sequence points. One of the calls modifies the variable value. We deal with null pointer dereferencing here.
The analyzer will issue a warning:
V2609 Undefined behaviour should not occur. The 'bufl' variable is modified while being used twice between sequence points.
It is also possible to detect incorrect use of shift operators. Code example:
void foo()
{
int delta = -2;
....
int expr = DoSomeCalculations();
expr <<= delta;
}Here, we see the shift of the 'expr' variable to the left by -2 bits. Shifting of negative values is an incorrect operation. It leads to undefined behaviour.
This diagnostic is classified as:
|
V2610. MISRA. The ', " or \ characters and the /* or // character sequences should not occur in a header file name.
This diagnostic rule is based on the MISRA (Motor Industry Software Reliability Association) manual for software development.
This rule only applies to C. If you use certain characters in header file names, this can lead to undefined behavior.
The rule prohibits using the following character sets:
- ', ", \, /*, // — in the name of any included file specified between '<' and '>';
- ', \, /*, // — in the name of any included file specified between double quotation marks.
Example:
#include <bad"include.h>
#include "bad'include.h"More often the diagnostic reveals the presence of a backslash in the path. MISRA sees this code as incorrect:
#include "myLibrary\header.h"However, you can use a forward slash:
#include "myLibrary/header.h"This diagnostic is classified as:
|
V2611. MISRA. Casts between a pointer to an incomplete type and any other type shouldn't be performed.
This diagnostic rule is based on the MISRA (Motor Industry Software Reliability Association) guidelines for software development.
This rule applies only to C. Casts, that involve pointers to an incomplete type, may result in an incorrectly assigned pointer. This may lead to undefined behavior. The same happens when a developer attempts casts between pointers to incomplete types - and floating point numbers.
Pointers to incomplete types are also used to hide the implementation (the PIMPL idiom). Casting to a pointer to an object breaks this encapsulation.
Example:
typedef struct _First First;
typedef struct _Second
{
int someVar;
} Second;
void foo(void)
{
First *f;
Second t;
...
f = &t; // <=
...
}
Second* bar(First *ptr)
{
return (Second*)ptr; // <=
}In the code above, two structures are declared - 'First' and 'Second'. Note that the 'First' type is incomplete, because there's no definition for it. Then the 'foo' function indirectly casts a pointer to an incomplete type. While the 'bar' function does a direct cast from an incomplete type to a complete one. Both of these cases can lead to undefined behavior.
There are two exceptions to this rule:
- The null pointer constant ('NULL') can be cast to a pointer to an incomplete type.
- A pointer to an incomplete type can be converted to 'void'.
The 'baz' function below demonstrates both cases:
typedef struct _First First;
First* foo(void);
void baz(void)
{
First *f = NULL;
(void)foo();
}This diagnostic is classified as:
|
V2612. MISRA. Array element should not be initialized more than once.
This diagnostic rule is based on the MISRA (Motor Industry Software Reliability Association) guidelines for software development.
This rule applies only to C. The C language has special syntax to initialize expressions - a designated initializer. It allows you to initialize array or structure elements in a custom order.
For example, you can initialize an array's specific elements:
int arr[4] = {
[1] = 1,
[3] = 2,
};This syntax also works for structures:
struct point
{
int x;
int y;
};
struct point pt1 = {
.x = 1,
.y = 1,
};However, when using this syntax, a developer can make a mistake and initialize the same element twice:
int arr[4] = {
[3] = 1,
[3] = 2,
};
struct point pt1 = {
.x = 1,
.x = 1,
};MISRA prohibits this syntax construction, because the language standard does not define whether the code above causes any side effects. Most likely, such mistakes are typos.
This diagnostic is classified as:
|
V2613. MISRA. Operand that is a composite expression has more narrow essential type than the other operand.
This diagnostic rule is based on the MISRA (Motor Industry Software Reliability Association) manual for software development.
This rule only applies to C. The analyzer has detected a situation: a composite expression participates in an arithmetic operation. This expression has more narrow essential type than another operand. Calculating this compound expression may lead to an overflow.
Let's look at the following synthetic example:
uint16_t w1;
uint16_t w2;
uint32_t dw1;
// ....
return w1 * w2 + dw1;On typical platforms (x86/ARM) the 'uint16_t' type corresponds to the 'unsigned short' type. During the evaluation, 'unsigned short' expands to the 'int' type. However, on other platforms (for example, 16-bit microcontrollers), 'uint16_t' may correspond to the 'unsigned int'. Thus, there is no expansion to 32 bit, which may result in overflow in the multiplication.
The diagnostic can determine this via an essential type model. This model determines the expression type in such a way as if the expression didn't expand to 'int' (integer promotion). In this model, a variable may have the following types:
- Boolean, if it operates with boolean values true/false: '_Bool';
- signed, if it operates with signed integers or if it's an unnamed enum: 'signed char', 'signed short', 'signed int', 'signed long', 'signed long long', 'enum { .... };';
- unsigned, if it operates with unsigned integers: 'unsigned char', 'unsigned short', 'unsigned int', 'unsigned long', 'unsigned long long';
- floating, if it operates with floating-point numbers: 'float', 'double', 'long double';
- character, if it operates only with characters: 'char';
- Named enum, if it operates with a named set of user-defined values: 'enum name { .... };'.
To fix the situation, cast one of the composite expression operands to the resulting type. For example:
return (uint32_t)w1 * w2 + dw1;Thus, the calculation of the expression occurs in a broader type 'uint32_t'.
This diagnostic is classified as:
|
V2614. MISRA. External identifiers should be distinct.
This diagnostic rule is based on the MISRA (Motor Industry Software Reliability Association) guidelines for software development.
This rule applies only to C. Identifiers with external linkage should be easily distinguished within the limitations imposed by the standard used.
The limitations are as follows:
- before standard C99 - 6 significant characters, case-insensitive;
- starting with standard C99 - 31 significant characters, case-sensitive.
Example 1:
// 123456789012345678901234567890123
extern int shrtfn(void); // OK
extern int longfuncname(void); // Error in C90,
// but OK in C99
extern int longlonglonglonglongfunctionname1(void); // Error in bothLong identifiers make it difficult to read code - and it's easy to confuse them with automatically generated identifiers. Also, when two identifiers differ only in characters that are not significant, this causes undefined behavior.
Some implementations of compilers and linkers can have their own limitations. To find out what these limitations are, refer to these tools' documentation.
Example 2:
// 123456789012345678901234567890123
extern int longFuncName1(int);
extern int longFuncName2(int);
extern int AAA;
extern int aaa;
void foo(void)
{
longFuncName2(AAA);
}This code contains several errors at once (we'll examine this code based on the C90 standard):
- Identifiers 'longFuncName1' and 'longFuncName2' will be truncated down to the first 6 characters ('longFu'). So the linker will regard them as identical.
- According to the C90 standard, identifiers are not always case-sensitive - so the linker can interpret identifiers 'AAA' and 'aaa' as identical as well.
- The 'foo' function calls the 'longFuncName2' function and passes the 'AAA' variable value as its parameter. This call leads to undefined behavior because each of these two identifiers cannot be interpreted as distinct.
This diagnostic is classified as:
|
V2615. MISRA. A compatible declaration should be visible when an object or function with external linkage is defined.
This diagnostic rule is based on the MISRA (Motor Industry Software Reliability Association) manual for software development.
This rule only applies to C. Don't define objects and/or functions with external linkage without prior declaration.
The point of this rule is to avoid "manual" use of external entities in places where they are needed. You should declare external objects and functions in a header file.
For example, the following code fragment defines an external variable and function without a prior declaration:
int foo;
void bar(void) {
// ....
}You should put declarations in a header file. It is also worth including the header file in the compiled one:
// file.h
extern int foo;
extern void bar(void);
// file.c
#include "file.h"
int foo;
void bar(void) {
// ....
}You do not need a prior declaration of objects and functions with internal linkage:
static int baz;
static void qux(void) {
// ....
}This diagnostic is classified as:
|
V2616. MISRA. All conditional inclusion preprocessor directives should reside in the same file as the conditional inclusion directive to which they are related.
This diagnostic rule is based on the MISRA (Motor Industry Software Reliability Association) manual for software development.
Conditional compilation directives '#else', '#elif' and '#endif' must be in the same file as the '#if', '#ifdef' or '#ifndef' to which they refer. Non-compliance with this rule makes code more difficult to read. Besides, this increases the probability of a mistake when you edit and maintain code.
Note: it is impossible to make this error in modern compilers. Incorrect use of conditional compilation directives in these compilers leads to compile-time errors.
Look at the example:
#define Check_A 10
#ifdef Check_A // <=
#if Check_A > 5
static int a = 5;
#elif Check_A > 2
static int a = 2;
#else
static int a = 0;
#endif // <=
int main(void)
{
return a;
}In the first example a nested condition that consists of '#ifdef' and '#if' is used. At the end of the fragment the second conditional compilation directive ('#if') is closed, but '#ifdef' remains open. This can create incorrect code.
Look at another example:
/* File.h */
#ifdef Check_B
#include "SomeOtherFile.h" // <=
/* End of File.h */In this example the conditional compilation directive is not closed. If you include this file in others using the '#include' preprocessor directive, this can lead to subtle errors.
This diagnostic is classified as:
|
V2617. MISRA. Object should not be assigned or copied to an overlapping object.
This diagnostic rule is based on the MISRA (Motor Industry Software Reliability Association) guidelines for software development.
The behavior is undefined when two objects are created, and they partially overlap each other in memory, and one of them is assigned or copied to the other.
This may happen, for example, when you use the 'memcpy' function. In this case the source's memory area overlaps with that of the receiver:
void func(int *x)
{
memcpy(x, x+2, 10 * sizeof(int));
}In this case, '(x+2)', a pointer to a data source, is offset from the destination by 8 bytes ('sizeof(int) * 2'). An attempt to copy 40 bytes to the destination from the source leads to a partial source memory area overlap.
To avoid this error, you can use a function, that is specifically intended for such cases – 'memmove'. Alternatively, you can adjust the offsets specified for the source and receiver, so that memory areas do not overlap.
The correct code:
void func(int *x)
{
memmove(x, x+2, 10 * sizeof(int));
}This diagnostic is classified as:
|
V2618. MISRA. Identifiers declared in the same scope and name space should be distinct.
This diagnostic rule is based on the MISRA (Motor Industry Software Reliability Association) manual for software development.
This rule only applies to C. The code has two identifiers that differ only in non-significant characters. If you declare these identifiers in the same scope, it leads to undefined behavior. Besides, long identifiers make it difficult to read the code. Long identifiers can also be confused with auto-generated ones.
Before C99 standard only the first 31 characters were significant. Starting from the C99 standard the first 63 characters are significant. The rest of the characters are non-significant.
This rule doesn't apply to code if both identifiers have external linkage. For this case, the V2614 diagnostic is intended.
This rule doesn't apply to code if one of the identifiers is a macro.
Look at the example for C90:
// 1234567890123456789012345678901***
static int very_long_long_long_long__test_var1; // (1)
extern int very_long_long_long_long__test_var2; // (2)Identifiers 1 and 2 differ only in the non-significant characters ('var1' and 'var2'). The significant part — 'long_long_long_long_long__test_' — is the same. If you want to avoid undefined behavior, shorten the length of the identifier:
// 1234567890123456789012345678901***
static int not_very_long__test_var1;
extern int not_very_long__test_var2;Look at the second example:
// 1234567890123456789012345678901***
static int long_long_long_long_long__test_var3; // (3)
void foo()
{
// 1234567890123456789012345678901***
int long_long_long_long_long__test_var4; // (4)
}Here identifiers 3 and 4 also differ in non-significant characters. However, they are in different scopes, so there's no rule violation.
This diagnostic is classified as:
|
V2619. MISRA. Typedef names should be unique across all name spaces.
This diagnostic rule is based on the software development guidelines developed by MISRA (Motor Industry Software Reliability Association).
This rule only applies to C. Typedef names should be unique across all name spaces. The repeated use of 'typedef' name can confuse the developer.
Let's look at the example:
void foo()
{
{
typedef unsigned char Id;
Id x = 128; // ok
}
{
typedef char Id;
Id x = 128; // error
}
}The 'unsigned char' type ranges from 0 to 255. The 'signed char' type has a range between -128 and 127. After working with the second 'typedef', the programmer may forget that the type has changed. This may lead to an error.
Here's the second example:
void foo()
{
{
typedef unsigned char uId;
uId x = 128; // ok
}
{
typedef singned char sId;
sId x = 128; // ok
}
}In this case, it is more difficult to make a mistake, since the 'typedef' names differ.
As an exception, you can duplicate the 'typedef' name when you declare 'struct', 'union' or 'enum' if they are associated with this particular 'typedef'.
typedef struct list
{
struct list* next;
int element;
} list; // okThis diagnostic is classified as:
|
V2620. MISRA. Value of a composite expression should not be cast to a different essential type category or a wider essential type.
This diagnostic rule is based on the MISRA (Motor Industry Software Reliability Association) guidelines for software development.
This rule applies only to C. Casting a composite expression's result to an essential type from a different category – or to a wider type – can cause the loss of the higher bit values.
Example:
int32_t foo(int16_t x, int16_t y)
{
return (int32_t)(x * y);
}On some platforms (x86/ARM), the 'int16_t' corresponds to the 'short' type, and it is expanded to the 'int' type when the expression is evaluated. On other platforms (for example, 16-bit microcontrollers), 'int16_t' may correspond to the 'int' type and will not expand to 32 bits – and this may cause an overflow during the multiplication.
Below is a possible fix:
int32_t foo(int16_t x, int16_t y)
{
return (int32_t)x * y;
}In this case, the entire expression is calculated in the 'int32_t' wider type.
Another example:
int32_t sum(float x, float y)
{
return (int32_t)(x + y);
}According to the essential type model, the expression's resulting type belongs to the floating category, while the 'int32_t' type – to signed category of essential types. Casting the sum's result to an integer type causes the loss of precision. The result of adding two 'float' type numbers may also be greater than the top limit of the 'int32_t' type's range.
The code below is a way to fix this:
float sum(float x, float y)
{
return x + y;
}If further on you decide to cast the expression's result to the 'int' type, you need to do the following:
- check that the converted value is within the type's range;
- use a function to round the result to the float value.
The Essential Type Model defines six categories:
- boolean, for boolean true/false values: '_Bool';
- signed, for signed integers or unnamed enums: 'signed char', 'signed short', 'signed int', 'signed long', 'signed long long', 'enum { .... };';
- unsigned, for unsigned integers: 'unsigned char', 'unsigned short', 'unsigned int', 'unsigned long', 'unsigned long long';
- floating, for floating point numbers: 'float', 'double', 'long double';
- character, for characters: 'char';
- named enum, for named sets of user-defined values: 'enum name { .... };'.
In this model, the compound expression's type is defined in a way as if the result hadn't been expanded to 'int' – i.e. the integer promotion hadn't happened.
This diagnostic is classified as:
|
V2621. MISRA. Tag names should be unique across all name spaces.
This diagnostic rule is based on the MISRA (Motor Industry Software Reliability Association) manual for software development.
This rule only applies to C. The names of structures, enumerations, and unions must be unique for all namespaces and blocks. Reusing name tags can confuse the developer.
Look at the example:
int foo()
{
{
struct MyStuct
{
unsigned char data; // (1)
};
struct MyStuct sample = { .data = 250 }; // ok
}
// ....
{
struct MyStruct
{
signed char data; // (2)
};
struct MyStruct sample = { .data = 250 }; // error
}
}The 'unsigned char' type allows values from 0 to 255, and the 'signed char' type allows values from -128 to 127. After working with the first 'MyStruct' structure, the developer may get used to the fact that the member of the 'data' structure has the 'unsigned char' type. After that, the developer can easily make a mistake in the second block by writing the 'sample.data' value. This leads to the signed integer overflow.
Fixed example:
int foo()
{
{
struct MyStuctUnsigned
{
unsigned char data; // (1)
};
struct MyStuctUnsigned sample = { .data = 250 }; // ok
}
// ....
{
struct MyStructSigned
{
signed char data; // (2)
};
struct MyStructSigned sample = { .data = 127 }; // ok
}
}Here the names of the structures are different. Thus, it's more difficult to make a mistake.
The type alias declared via 'typedef' can duplicate the name when the developer declares 'struct', 'union' or 'enum' if they are associated with this 'typedef':
typedef struct list
{
struct list* next;
int element;
} list; // okThis diagnostic is classified as:
|
V2622. MISRA. External object or function should be declared once in one and only one file.
This diagnostic rule is based on the MISRA (Motor Industry Software Reliability Association) software development guide.
This rule only applies to programs written in C. Objects or functions with external linkage should be declared once.
Look at the following example:
/* lib1.h */
extern int32_t var; // Declaration
/* lib2.h */
extern int32_t var; // Declaration
/* some.cpp */
#include "lib1.h"
#include "lib2.h"In this example, the 'var' variable is declared twice: in 'lib1.h' and 'lib2.h'.
We have several ways to fix this:
- If the 'some.cpp' file contains an extra header file, we can exclude it.
- If one of the header files contains an extra declaration of the 'var' variable, we can exclude it.
- We can declare the 'var' variable in a more generalized header file and include it wherever it is used:
/* lib.h */
extern int32_t var; // Declaration
/* lib1.h */
#include "lib.h"
/* lib2.h */
#include "lib.h"
/* some.cpp */
#include "lib1.h"
#include "lib2.h"This diagnostic is classified as:
|
V2623. MISRA. Macro identifiers should be distinct.
This diagnostic rule is based on the software development guidelines developed by MISRA (Motor Industry Software Reliability Association).
This diagnostic rule is relevant only to C programs. The macro identifier should be distinct from the identifiers of previously defined macros. The macro parameter identifier should be also distinct from the macro identifier itself and from all other parameters.
The minimum requirement for distinction of the macro identifiers and their parameters depends on the version of the C Standard:
- C90: 31 first characters
- C99: 63 first characters
In practice, compilers can exceed these limits. However, the diagnostic rule requires that macro identifiers should be distinct within the limits recommended by standard.
The following examples are relevant to C90.
The example of incorrect code with the macro identifier:
// 1234567890123456789012345678901
#define average_winter_air_temperature_monday awt_m
#define average_winter_air_temperature_tuesday awt_tThe first macro identifier is indistinct from the second one, if we take the first 31 characters. Here is the correct code:
// 1234567890123456789012345678901
#define average_winter_air_temp_monday awt_m
#define average_winter_air_temp_tuesday awt_tThe example of incorrect code with indistinct macro identifier and its parameters:
#define average_winter_air_temp(average_winter_air_temp) awt_mThe correct code:
#define average_winter_air_temp(winter_air_temp) awt_mThe example of incorrect code with indistinct identifiers of macro parameters:
#define air_temp(winter_air_temp, winter_air_temp) awt_mThe correct code:
#define air_temp(average_winter_air_temp, winter_air_temp) awt_mThis diagnostic is classified as:
|
V2624. MISRA. The initializer for an aggregate or union should be enclosed in braces.
This diagnostic rule is based on the software development guidelines of MISRA (Motor Industry Software Reliability Association).
This diagnostic rule is relevant only to C-programs. It requires initializers for an aggregate or union to be enclosed in braces. This diagnostic rule can be used for both objects and subobjects.
Exceptions:
- the initializer of the form '{ 0 }' is used to initialize subobjects;
- the array is initialized with a string literal;
- a structure or union with automatic storage duration is initialized with an expression that is compatible with the structure or union;
- the designated initialization is used to initialize a part of a subobject.
Look at the example:
int num[3][2] = { 1, 2, 3, 4, 5, 6 };The code contains array initializers that are not enclosed in braces. Here is the correct code:
int num[3][2] = { { 1, 2 }, { 3, 4 }, { 5, 6 } };Take a look at another example:
struct S1
{
char buf;
int num[3][2];
} s1[4] = {
'a', { 1, 2 }, { 0, 0 }, { 5, 6 },
'b', { 1, 2 }, { 0, 0 }, { 5, 6 },
'c', { 1, 2 }, { 0, 0 }, { 5, 6 },
'd', { 1, 2 }, { 0, 0 }, { 5, 6 }
};The diagnostic rule requires initializers for an aggregate to also be enclosed in braces. Here is the correct code:
struct S1
{
char buf;
int num [3][2];
} s1[4] = {
{ 'a', { { 1, 2 }, { 0, 0 }, { 5, 6 } } },
{ 'b', { { 1, 2 }, { 0, 0 }, { 5, 6 } } },
{ 'c', { { 1, 2 }, { 0, 0 }, { 5, 6 } } },
{ 'd', { { 1, 2 }, { 0, 0 }, { 5, 6 } } }
};Let's take a look at the following case:
struct S2 {
char color[8];
int num;
} s2[3] = {
{ "Red", 1 },
{ "Green", 2 },
{ "Blue", 3 }
};Here, the character literal should also be enclosed in braces. Here is the correct code:
struct S2 {
char color[8];
int num;
} s2[3] = {
{ { "Red" }, 1 },
{ { "Green" }, 2 },
{ { "Blue" }, 3 }
};The example of code with designated initializers looks as follows:
int num[2][2] = { [0][1] = 0, { 0, 1 } };Here are the examples of code with the initializer of the form '{ 0 }':
int num1[3][2] = { 0 };
int num2[3][2] = { { 1, 2 }, { 0 }, { 5, 6 } };
int num3[2][2] = { { 0 }, [1][1] = 1 };This diagnostic is classified as:
|
V2625. MISRA. Identifiers that define objects or functions with external linkage shall be unique.
The diagnostic rule is based on the MISRA (Motor Industry Software Reliability Association) software development guidelines.
The rule is relevant only for C. An identifier with external linkage should be unique in a program. The name should not be used by other identifiers that have a different linkage type (no linkage, internal linkage) within functions or other translation units. The rule applies to both objects and functions.
Note. To search for non-unique identifiers in different translation units, enable the intermodular analysis mode.
Here is an example:
int var; // external linkage
void foo()
{
short var; // no linkage
}In the code fragment above, the 'var' identifier with external linkage is hidden by a local variable in the 'foo' function. The fixed code looks like this:
int var; // external linkage
void foo()
{
short temp; // no linkage
}Let's look at another example, but this one is based on the contents of two files from the same project:
// file1.c
int x; // external linkage
static int y; // internal linkage
static void bar(); // internal linkage
// file2.c
void bar() // external linkage
{
int y; // no linkage
}
void foo() // external linkage
{
int x; // no linkage
}The 'x' identifiers from 'file1.c' and 'bar' from 'file2.c' have external linkage and are not unique, so they violate the rule. The 'y' identifier is not unique, either. However, since it has internal linkage in 'file1.c' and no linkage in 'file2.c', the rule is not violated for this name.
Here is the fixed code:
// file1.c
static int x; // internal linkage
static int y; // internal linkage
static void func(); // internal linkage
// file2.c
void bar() // external linkage
{
int y; // no linkage
}
void foo() // external linkage
{
int x; // no linkage
}This diagnostic is classified as:
|
V3001. There are identical sub-expressions to the left and to the right of the 'foo' operator.
The analyzer has detected a code fragment that is very likely to have a logical error in it. The program text contains an operator (<, >, <=, >=, ==, !=, &&, ||, -, /, &, |, ^) whose both operands are identical subexpressions.
Consider this example:
if (a.x != 0 && a.x != 0)In this case, the '&&' operator is surrounded by identical subexpressions "a.x != 0", which enables the analyzer to detect a mistake made through carelessness. A correct version of this code, which won't trigger the diagnostic, should look as follows:
if (a.x != 0 && a.y != 0)Here's another example of a mistake detected by the analyzer in an application's code:
class Foo {
List<int> Childs { get; set; }
...
public bool hasChilds() { return(Childs[0] > 0 || Childs[0] > 0); }
...
}In this case, although the code compiles well and without any warnings, it just doesn't make sense. Its correct version should look like this:
public bool hasChilds(){ return(Childs[0] > 0 || Childs[1] > 0);}The analyzer compares the code blocks, taking into account inversion of the expression's parts in relation to the operator. For example, it will detect the error in the following code:
if (Name.Length > maxLength && maxLength < Name.Length)This diagnostic is classified as:
You can look at examples of errors detected by the V3001 diagnostic. |
V3002. The switch statement does not cover all values of the enum.
The analyzer has detected a 'switch' statement where selection is done for a variable of the enum type, some of the enumeration elements missing in the 'switch' statement. This may indicate an error.
Consider this example:
public enum Actions { Add, Remove, Replace, Move, Reset };
public void SomeMethod(Actions act)
{
switch (act)
{
case Actions.Add: Calculate(1); break;
case Actions.Remove: Calculate(2); break;
case Actions.Replace: Calculate(3); break;
case Actions.Move: Calculate(5); break;
}
}The 'Actions' enumeration in this code contains 5 named constants, while the 'switch' statement, selecting among the values of this enumeration, only selects among 4 of them. This is very likely a mistake.
It may be that the programmer added a new constant during refactoring but forgot to add it into the list of cases in the 'switch' statement, or simply skipped it by mistake, as it sometimes happens with large enumerations. This results in incorrect processing of the missing value.
The correct version of this code should look like this:
public void SomeMethod(Actions act)
{
switch (act)
{
case Actions.Add: Calculate(1); break;
case Actions.Remove: Calculate(2); break;
case Actions.Replace: Calculate(3); break;
case Actions.Move: Calculate(5); break;
case Actions.Reset: Calculate(6); break;
}
}Or this:
public void SomeMethod(Actions act)
{
switch (act)
{
case Actions.Add: Calculate(1); break;
case Actions.Remove: Calculate(2); break;
case Actions.Replace: Calculate(3); break;
case Actions.Move: Calculate(5); break;
default: Calculate(10); break;
}
}The analyzer doesn't output the warning every time there are missing enumeration elements in the 'switch' statement; otherwise, there would be too many false positives. There are a number of empirical exceptions from this rule, the main of which are the following:
- A default-branch is present;
- The missing constant's name includes the words "None", "Unknown", and the like.
- The missing constant is the very last in the enumeration and its name includes the words "end", "num", "count", and the like.
- The enumeration consists of only 1 or 2 constants;
- And so on.
You can look at examples of errors detected by the V3002 diagnostic. |
V3003. The use of 'if (A) {...} else if (A) {...}' pattern was detected. There is a probability of logical error presence.
The analyzer has detected a potential error in a construct consisting of conditional statements.
Consider the following example:
if (a == 1)
Foo1();
else if (a == 2)
Foo2();
else if (a == 1)
Foo3();In this code, the 'Foo3()' method will never get control. We are most likely dealing with a logical error here and the correct version of this code should look as follows:
if (a == 1)
Foo1();
else if (a == 2)
Foo2();
else if (a == 3)
Foo3();In practice though, errors of this type can take more complicated forms, as shown below.
For example, the analyzer has found the following incorrect construct.
....
} else if (b.NodeType == ExpressionType.Or ||
b.NodeType == ExpressionType.OrEqual){
current.Condition = ConstraintType.Or;
} else if(...) {
....
} else if (b.NodeType == ExpressionType.OrEqual ||
b.NodeType == ExpressionType.Or){
current.Condition = ConstraintType.Or |
ConstraintType.Equal;
} else if(....In this example, the uppermost if statement checks the following condition:
b.NodeType == ExpressionType.Or ||
b.NodeType == ExpressionType.OrEqual.while the lowermost if statement checks a condition with the same logic but written in a reverse order, which is hardly noticeable for a human yet results in a runtime error.
b.NodeType == ExpressionType.OrEqual ||
b.NodeType == ExpressionType.OrThis diagnostic is classified as:
You can look at examples of errors detected by the V3003 diagnostic. |
V3004. The 'then' statement is equivalent to the 'else' statement.
The analyzer has detected a suspicious code fragment with an 'if' statement whose both true- and false-statements are absolutely identical. It is often a sign of an error.
For example:
if (condition)
result = FirstFunc(val);
else
result = FirstFunc(val);Regardless of the variable's value, the same actions will be performed. This code is obviously incorrect and should have looked something like this:
if (condition)
result = FirstFunc(val);
else
result = SecondFunc(val);This diagnostic is classified as:
You can look at examples of errors detected by the V3004 diagnostic. |
V3005. The 'x' variable is assigned to itself.
The analyzer has detected a potential error when a variable is assigned to itself.
Consider the following example taken from a real-life application:
public GridAnswerData(
int questionId, int answerId, int sectionNumber,
string fieldText, AnswerTypeMode typeMode)
{
this.QuestionId = this.QuestionId;
this.AnswerId = answerId;
this.FieldText = fieldText;
this.TypeMode = typeMode;
this.SectionNumber = sectionNumber;
}As seen from the code, the programmer intended to change the values of an object's properties according to the parameters accepted in the method, but mistakenly assigned to the 'QuestionId' property its own value instead of the 'questionId' argument's value.
The correct version of this code should have looked as follows:
public GridAnswerData(
int questionId, int answerId, int sectionNumber,
string fieldText, AnswerTypeMode typeMode)
{
this.QuestionId = questionId;
this.AnswerId = answerId;
this.FieldText = fieldText;
this.TypeMode = typeMode;
this.SectionNumber = sectionNumber;
}You can look at examples of errors detected by the V3005 diagnostic. |
V3006. The object was created but it is not being used. The 'throw' keyword could be missing.
The analyzer has detected a potential error when an instance of a class derived from 'System.Exception' is created but not being used in any way.
Here's an example of incorrect code:
public void DoSomething(int index)
{
if (index < 0)
new ArgumentOutOfRangeException();
else
....
}In this fragment, the 'throw' statement is missing, so executing this code will only result in creating an instance of a class derived from 'System.Exception' without it being used in any way, and the exception won't be generated. The correct version of this code should look something like this:
public void DoSomething(int index)
{
if (index < 0)
throw new ArgumentOutOfRangeException();
else
....
}This diagnostic is classified as:
You can look at examples of errors detected by the V3006 diagnostic. |
V3007. Odd semicolon ';' after 'if/for/while' operator.
The analyzer has detected a potential error when a semicolon ';' is used after statement 'for', 'while', or 'if'.
Consider the following example:
int i = 0;
....
for(i = 0; i < arr.Count(); ++i);
arr[i] = i;In this code, the programmer wanted the assignment operation to process all of the array's items but added a semicolon by mistake after the closing parenthesis of the loop. It results in the assignment operation being executed only once. Moreover, it also causes an array index out of bounds error.
The correct version of the code should look as follows:
int i = 0;
....
for(i = 0; i < arr.Count(); ++i)
arr[i] = i;The presence of a semicolon ';' after said statements does not always indicate an error, of course. Sometimes a loop body is not required to execute the needed statements, and the use of a semicolon is justified in such code. For example:
int i;
for (i = 0; !char.IsWhiteSpace(str[i]); ++i) ;
Console.WriteLine(i);The analyzer won't output a warning in this and some other cases.
This diagnostic is classified as:
V3008. The 'x' variable is assigned values twice successively. Perhaps this is a mistake.
The analyzer has detected an error that has to do with assigning values to one and the same variable twice in a row, while this variable is not used in any way between the assignments.
Consider this example:
A = GetA();
A = GetB();The 'A' variable being assigned values twice might indicate a bug. The code should have most probably looked like this:
A = GetA();
B = GetB();Cases when the variable is used between the assignments are treated as correct and do not trigger the warning:
A = 1;
A = Foo(A);The following is an example of the bug taken from a real-life application:
....
if (bool.TryParse(setting, out value))
_singleSignOn = value;
_singleSignOn = false;
....A correct version of this code should look like this:
....
if (bool.TryParse(setting, out value))
_singleSignOn = value;
else
_singleSignOn = false;
....The analyzer might output false positives sometimes. This happens when such variable assignments are used for debugging purposes. For example:
status = Foo1();
status = Foo2();The false positive in this code can be handled in a number of ways:
- You can suppress it by inserting comment "//-V3008".
- You can forbid the analyzer to output diagnostic V3008 for any case where variable 'status' is used. To do that, insert comment "//-V:status:3008".
- You can remove idle assignments from the code.
- Perhaps this code is incorrect, so we have to check the value of the 'status' variable.
This diagnostic is classified as:
You can look at examples of errors detected by the V3008 diagnostic. |
V3009. It's odd that this method always returns one and the same value of NN.
The analyzer has detected a strange method: it does not have any state and does not change any global variables. At the same time, it has several return points returning the same numerical, string, enum, constant or read only field value.
This code is very odd and might signal a possible error. The method is most likely intended to return different values.
Consider the following simple example:
int Foo(int a)
{
if (a == 33)
return 1;
return 1;
}This code contains an error. Let's change one of the returned values to fix it. You can usually identify the necessary returned values only when you know the operation logic of the whole application in general
This is the fixed code:
int Foo(int a)
{
if (a == 33)
return 1;
return 2;
}If the code is correct, you may get rid of the false positive using the "//-V3009" comment.
This diagnostic is classified as:
You can look at examples of errors detected by the V3009 diagnostic. |
V3010. The return value of function 'Foo' is required to be utilized.
The analyzer has detected a suspicious call on a method whose return value is not used. Calling certain methods doesn't make sense without using their return values.
Consider the following example:
public List<CodeCoverageSequencePoint> SequencePoints
{ get; private set; }
....
this.SequencePoints.OrderBy(item => item.Line);In this code, extension method 'OrderBy' is called for the 'SequencePoints' collection. This method sorts the collection by the specified criteria and returns its sorted copy. Since the 'OrderBy' method doesn't modify the 'SequencePoints' collection, it makes no sense calling it without saving the collection returned.
The correct version of the code above should look as follows:
var orderedList = this.SequencePoints.OrderBy(
item => item.Line).ToList();This diagnostic is classified as:
You can look at examples of errors detected by the V3010 diagnostic. |
V3011. Two opposite conditions were encountered. The second condition is always false.
The analyzer has detected a potential logical error: two conditional statements executed in sequence contain mutually exclusive conditions.
Examples of such conditions:
- "A == B" and "A != B";
- "A > B" and "A <= B";
- "A < B" and "B < A";
- and so on.
This error can occur as a result of a typo or bad refactoring.
Consider the following example of incorrect code:
if (x == y)
if (y != x)
DoSomething(x, y);In this fragment, the 'DoSomething' method will never be called because the second condition will always be false when the first one is true. One of the variables used in the comparison is probably wrong. In the second condition, for example, variable 'z' should have been used instead of 'x':
if (x == y)
if (y != z)
DoSomething(x, y);This diagnostic is classified as:
You can look at examples of errors detected by the V3011 diagnostic. |
V3012. The '?:' operator, regardless of its conditional expression, always returns one and the same value.
The analyzer has detected a potential error when using the ternary operator "?:". Regardless of the condition's result, one and the same statement will be executed. There is very likely a typo somewhere in the code.
Consider the following, simplest, example:
int A = B ? C : C;In either case, the A variable will be assigned the value of the C variable.
Let's see what such an error may look like in real-life code:
fovRadius[0] = Math.Tan((rollAngleClamped % 2 == 0 ?
cg.fov_x : cg.fov_x) * 0.52) * sdist;This code has been formatted. In reality, though, it may be written in one line, so it's no wonder that a typo may stay unnoticed. The error here has to do with the member of the "fov_x" class being used both times. The correct version of this code should look as follows:
fovRadius[0] = Math.Tan((rollAngleClamped % 2 == 0 ?
cg.fov_x : cg.fov_y) * 0.52) * sdist;This diagnostic is classified as:
You can look at examples of errors detected by the V3012 diagnostic. |
V3013. It is odd that the body of 'Foo_1' function is fully equivalent to the body of 'Foo_2' function.
The analyzer outputs this warning when it detects two functions implemented in the same way. The presence of two identical functions in code is not an error in itself, but such code should be inspected.
This diagnostic is meant for detecting the following type of bugs:
class Point
{
....
float GetX() { return m_x; }
float GetY() { return m_x; }
};A typo makes two different functions do the same thing. This is the correct version of this code:
float GetX() { return m_x; }
float GetY() { return m_y; }In the example above, the bodies of the functions GetX() and GetY() being alike is obviously a sign of a bug. However, there would be too many false positives if we set the analyzer to output this warning every time it encounters functions with identical bodies. That's why it relies on a number of exceptions for cases when it shouldn't output the warning. Such cases include the following:
- Functions with identical bodies use no other variables but arguments. For example: "bool IsXYZ() { return true; }";
- Functions with identical bodies are repeated more than twice;
- The functions' bodies consist of only the throw() statement;
- Etc.
There are a number of ways to handle the false positives. If they relate to the files of external libraries or tests, you can add the path to these files or folders into the exception list. If they relate to your own code, you can add the "//-V3013" comment to suppress them. If there are too many false positives, you can disable this diagnostic completely from the analyzer's settings. Also, you may want to modify the code so that one function calls another.
The following is a code sample from a real-life application where functions meant to do different work are implemented in the same way:
public void Pause(FrameworkElement target)
{
if (Storyboard != null)
{
Storyboard.Pause(target);
}
}
public void Stop(FrameworkElement target)
{
if (Storyboard != null)
{
Storyboard.Stop(target);
}
}
public void Resume(FrameworkElement target)
{
if (Storyboard != null)
{
Storyboard.Pause(target);
}
}Having made a few copies of one function, the programmer forgot to modify the last of them, function Resume().
The correct version of this fragment should look like this:
public void Resume(FrameworkElement target)
{
if (Storyboard != null)
{
Storyboard.Resume(target);
}
}You can look at examples of errors detected by the V3013 diagnostic. |
V3014. It is likely that a wrong variable is being incremented inside the 'for' operator. Consider reviewing 'X'.
The analyzer detected a potential error: a variable referring to an outer loop and located inside the 'for' operator is incremented.
This is the simplest form of this error:
for (int i = 0; i < 5; i++)
for (int j = 0; j < 5; i++)
A[i][j] = 0;It is the 'i' variable which is incremented instead of 'j' in the inner loop. Such an error might be not so visible in a real application. This is the correct code:
for (int i = 0; i < 5; i++)
for (int j = 0; j < 5; j++)
A[i][j] = 0;This diagnostic is classified as:
You can look at examples of errors detected by the V3014 diagnostic. |
V3015. It is likely that a wrong variable is being compared inside the 'for' operator. Consider reviewing 'X'.
The analyzer detected a potential error: a variable referring to an outer loop is used in the condition of the 'for' operator.
This is the simplest form of this error:
for (int i = 0; i < 5; i++)
for (int j = 0; i < 5; j++)
A[i][j] = 0;It is the comparison 'i < 5' that is performed instead of 'j < 5' in the inner loop. Such an error might be not so visible in a real application. This is the correct code:
for (int i = 0; i < 5; i++)
for (int j = 0; j < 5; j++)
A[i][j] = 0;This diagnostic is classified as:
You can look at examples of errors detected by the V3015 diagnostic. |
V3016. The variable 'X' is being used for this loop and for the outer loop.
The analyzer detected a potential error: a nested loop is arranged by a variable which is also used in an outer loop.
In a schematic form, this error looks in the following way:
int i = 0, j = 0;
for (i = 0; i < 5; i++)
for (i = 0; i < 5; i++)
A[i][j] = 0;Of course, this is an artificial sample, so we may easily see the error, but in a real application, the error might be not so apparent. This is the correct code:
int i = 0, j = 0;
for (i = 0; i < 5; i++)
for (j = 0; j < 5; j++)
A[i][j] = 0;Using one variable both for the outer and inner loops is not always a mistake. Consider a sample of correct code the analyzer won't generate the warning for:
for(c = lb; c <= ub; c++)
{
if (!(xlb <= xlat(c) && xlat(c) <= ub))
{
Range r = new Range(xlb, xlb + 1);
for (c = lb + 1; c <= ub; c++)
r = DoUnion(r, new Range(xlat(c), xlat(c) + 1));
return r;
}
}In this code, the inner loop "for (c = lb + 1; c <= ub; c++)" is arranged by the "c" variable. The outer loop also uses the "c" variable. But there is no error here. After the inner loop is executed, the "return r;" operator will perform exit from the function.
This diagnostic is classified as:
V3017. A pattern was detected: A || (A && ...). The expression is excessive or contains a logical error.
The analyzer has detected an expression that can be reduced. Such redundancy may be a sign of a logical error.
Consider this example:
bool firstCond, secondCod, thirdCond;
....
if (firstCond || (firstCond && thirdCond))
....This expression is redundant. If 'firstCond == true', the condition will always be true regardless of what value the 'thirdCond' variable refers to; and if 'firstCond == false', the condition will always be false – again, irrespective of the 'thirdCond' variable.
Perhaps the programmer made a mistake and wrote a wrong variable in the second subexpression. Then the correct version of this code should look like this:
if (firstCond || (secondCod && thirdCond))You can look at examples of errors detected by the V3017 diagnostic. |
V3018. Consider inspecting the application's logic. It's possible that 'else' keyword is missing.
The analyzer has detected a code fragment where an 'if' statement occupies the same line as the closing brace of the previous 'if' statement. The 'else' keyword may be missing in this line, and this causes the program to work differently than expected.
Consider the following example:
if (cond1) {
Method1(val);
} if (cond2) {
Method2(val);
} else {
Method3(val);
}If the 'cond1' condition is true, not only will method 'Method1' be called, but method 'Method2' or 'Method3' as well. If it is exactly this logic that was intended, the code formatting should be fixed by moving the second 'if' statement to the next line:
if (cond1) {
Method1(val);
}
if (cond2) {
Method2(val);
} else {
Method3(val);
}This code formatting is more conventional and won't make other programmers suspect a bug. Besides, the analyzer will stop outputting the warning, too.
But if it's not the behavior that the programmer really intended, then there is an execution logic error, so the keyword 'else' must be added. Correct code in this case will look as follows:
if (cond1) {
Method1(val);
} else if (cond2) {
Method2(val);
} else {
Method3(val);
}This diagnostic is classified as:
You can look at examples of errors detected by the V3018 diagnostic. |
V3019. It is possible that an incorrect variable is compared with null after type conversion using 'as' keyword.
The analyzer has detected a potential error that may lead to memory access by a null reference.
The situation that the analyzer detected deals with the following algorithm. An object of the base class is first cast to a derived class by using the 'as' operator. Then the same object is checked for a null value, though it is the object of the derived class that this check should have been applied to.
Here's an example. In this code, the baseObj object may not be an instance of the Derived class, in which case, when calling the Func function, the program will crash, raising the NullReferenceException. The analyzer will output a warning pointing out two lines. The first line is the spot where the object of the base class is checked for null; the second is where it is cast to an object of the derived class.
Base baseObj;
Derived derivedObj = baseObj as Derived;
if (baseObj != null)
{
derivedObj.Func();
}It is most likely the object of the derived class that the programmer intended to check for null before using it. This is the fixed version of the code:
Base baseObj;
Derived derivedObj = baseObj as Derived;
if (derivedObj != null)
{
derivedObj.Func();
}This diagnostic is classified as:
You can look at examples of errors detected by the V3019 diagnostic. |
V3020. An unconditional 'break/continue/return/goto' within a loop.
The analyzer has detected a suspicious loop where one of the following statements is used: continue, break, return, goto, or throw. These statements are executed all the time, irrespective of any conditions.
For example:
while (k < max)
{
if (k == index)
value = Calculate(k);
break;
++k;
}In this code, the 'break' statement doesn't belong to the 'if' statement, which will cause it to execute all the time, regardless of whether or not the 'k == index' condition is true, and the loop body will iterate only once. The correct version of this code should look like this:
while (k < max)
{
if (k == index)
{
value = Calculate(k);
break;
}
++k;
}This diagnostic is classified as:
You can look at examples of errors detected by the V3020 diagnostic. |
V3021. There are two 'if' statements with identical conditional expressions. The first 'if' statement contains method return. This means that the second 'if' statement is senseless.
The analyzer has detected an issue when the 'then' part of the 'if' operator never gets control. It happens because there is another 'if' before which contains the same condition whose 'then' part contains the unconditional 'return' operator. It may signal both a logical error in the program and an unnecessary second 'if' operator.
Consider the following example of incorrect code:
if (l >= 0x06C0 && l <= 0x06CE) return true;
if (l >= 0x06D0 && l <= 0x06D3) return true;
if (l == 0x06D5) return true; // <=
if (l >= 0x06E5 && l <= 0x06E6) return true;
if (l >= 0x0905 && l <= 0x0939) return true;
if (l == 0x06D5) return true; // <=
if (l >= 0x0958 && l <= 0x0961) return true;
if (l >= 0x0985 && l <= 0x098C) return true;In this case, the 'l == 0x06D5' condition is doubled, and we just need to remove one of them to fix the code. However, it may be that the value being checked in the second case should be different from the first one.
This is the fixed code:
if (l >= 0x06C0 && l <= 0x06CE) return true;
if (l >= 0x06D0 && l <= 0x06D3) return true;
if (l == 0x06D5) return true;
if (l >= 0x06E5 && l <= 0x06E6) return true;
if (l >= 0x0905 && l <= 0x0939) return true;
if (l >= 0x0958 && l <= 0x0961) return true;
if (l >= 0x0985 && l <= 0x098C) return true;This diagnostic is classified as:
You can look at examples of errors detected by the V3021 diagnostic. |
V3022. Expression is always true/false.
The analyzer has detected a possible error that has to do with a condition which is always either true or false. Such conditions do not necessarily indicate a bug, but they need reviewing.
Consider the following example:
string niceUrl = GetUrl();
if (niceUrl != "#" || niceUrl != "") {
Process(niceUrl);
} else {
HandleError();
}The analyzer outputs the following warning:
"V3022 Expression 'niceUrl != "#" || niceUrl != ""' is always true. Probably the '&&' operator should be used here. "
The else branch in this code will never be executed because regardless of what value the niceUrl variable refers to, one of the two comparisons with a string will always be true. To fix this error, we need to use operator && instead of ||. This is the fixed version of the code:
string niceUrl = GetUrl();
if (niceUrl != "#" && niceUrl != "") {
Process(niceUrl);
} else {
HandleError();
}Now let's discuss a code sample with a meaningless comparison. It's not necessarily a bug, but this code should be reviewed:
byte type = reader.ReadByte();
if (type < 0)
recordType = RecordType.DocumentEnd;
else
recordType = GetRecordType(type);The error here is in comparing an unsigned variable with zero. This sample will trigger the warning "V3022 Expression 'type < 0' is always false. Unsigned type value is always >= 0." The code either contains an unnecessary comparison or incorrectly handles the situation of reaching the end of the document.
The analyzer doesn't warn about every condition that is always true or false; it only diagnoses those cases when a bug is highly probable. Here are some examples of code that the analyzer treats as correct:
// 1) Code block temporarily not compiled
if (false && CheckCondition())
{
...
}
// 2) Expressions inside Debug.Assert()
public enum Actions { None, Start, Stop }
...
Debug.Assert(Actions.Start > 0);This diagnostic is classified as:
You can look at examples of errors detected by the V3022 diagnostic. |
V3023. Consider inspecting this expression. The expression is excessive or contains a misprint.
The analyzer has detected a suspicious code fragment with a redundant comparison. There may be a superfluous check, in which case the expression can be simplified, or an error, which should be fixed.
Consider the following example:
if (firstVal == 3 && firstVal != 5)This code is redundant as the condition will be true if 'firstVal == 3', so the second part of the expression just makes no sense.
There are two possible explanations here:
1) The second check is just unnecessary and the expression can be simplified. If so, the correct version of that code should look like this:
if (firstVal == 3)2) There is a bug in the expression; the programmer wanted to use a different variable instead of 'firstVal'. Then the correct version of the code should look as follows:
if (firstVal == 3 && secondVal != 5)This diagnostic is classified as:
You can look at examples of errors detected by the V3023 diagnostic. |
V3024. An odd precise comparison. Consider using a comparison with defined precision: Math.Abs(A - B) < Epsilon or Math.Abs(A - B) > Epsilon.
The analyzer has detected a suspicious code fragment where floating-point numbers are compared using operator '==' or '!='. Such code may contain a bug.
Let's discuss an example of correct code first (which will, however, trigger the warning anyway):
double a = 0.5;
if (a == 0.5) //ok
++x;This comparison is correct. Before executing it, the 'a' variable is explicitly initialized to value '0.5', and it is this value the comparison is done over. The expression will evaluate to 'true'.
So, strict comparisons are permitted in certain cases - but not all the time. Here's an example of incorrect code:
double b = Math.Sin(Math.PI / 6.0);
if (b == 0.5) //err
++x;The 'b == 0.5' condition proves false because the 'Math.Sin(Math.PI / 6.0)' expression evaluates to 0.49999999999999994. This number is very close but still not equal to '0.5'.
One way to fix this is to compare the difference of the two values against some reference value (i.e. amount of error, which in this case is expressed by variable 'epsilon'):
double b = Math.Sin(Math.PI / 6.0);
if (Math.Abs(b - 0.5) < epsilon) //ok
++x;You should estimate the error amount appropriately, depending on what values are being compared.
The analyzer points out those code fragments where floating-point numbers are compared using operator '!=' or '==', but it's the programmer alone who can figure out whether or not such comparison is incorrect.
References:
This diagnostic is classified as:
You can look at examples of errors detected by the V3024 diagnostic. |
V3025. Incorrect format. Consider checking the N format items of the 'Foo' function.
The analyzer has detected a possible error related to use of formatting methods: String.Format, Console.WriteLine, Console.Write, etc. The format string does not correspond with actual arguments passed to the method.
Here are some simple examples:
Unused arguments.
int A = 10, B = 20;
double C = 30.0;
Console.WriteLine("{0} < {1}", A, B, C);Format item {2} is not specified, so variable 'C' won't be used.
Possible correct versions of the code:
//Remove extra argument
Console.WriteLine("{0} < {1}", A, B);
//Fix format string
Console.WriteLine("{0} < {1} < {2}", A, B, C);Number of arguments passed is less than expected.
int A = 10, B = 20;
double C = 30.0;
Console.WriteLine("{0} < {1} < {2}", A, B);
Console.WriteLine("{1} < {2}", A, B);A much more dangerous situation occurs when a function receives fewer arguments than expected. This will raise a FormatException exception.
Possible correct versions of the code:
//Add missing argument
Console.WriteLine("{0} < {1} < {2}", A, B, C);
//Fix indices in format string
Console.WriteLine("{0} < {1}", A, B);The analyzer doesn't output the warning given that:
- The number of format items specified matches the number of arguments.
- The format object is used a number of times:
int row = 10;
Console.WriteLine("Line: {0}; Index: {0}", row);Here is an example of this bug in a real-life application:
var sql = string.Format(
"SELECT {0} FROM (SELECT ROW_NUMBER() " +
" OVER (ORDER BY {2}) AS Row, {0} FROM {3} {4}) AS Paged ",
columns, pageSize, orderBy, TableName, where);The function receives 5 formatting objects, but the 'pageSize' variable is not used as format item {1} is missing.
This diagnostic is classified as:
You can look at examples of errors detected by the V3025 diagnostic. |
V3026. The constant NN is being utilized. The resulting value could be inaccurate. Consider using the KK constant.
The analyzer has detected an issue that deals with using constants of poor accuracy in mathematical calculations.
Consider this example:
double pi = 3.141592654;This way of writing the pi constant is not quite correct. It's preferable to use mathematical constants from the static class Math:
double pi = Math.PI;The analyzer doesn't output the warning for cases when constants are explicitly defined as of 'float' type. The reason is that type 'float' has fewer significant positions than type 'double'. That is why the following code won't trigger the warning:
float f = 3.14159f; //okThis diagnostic is classified as:
V3027. The variable was utilized in the logical expression before it was verified against null in the same logical expression.
The analyzer has detected an issue that has to do with checking a variable for 'null' after it has been used (in a method call, attribute access, and so on). This diagnostic operates within one logical expression.
Consider the following example:
if (rootDoc.Text.Trim() == documentName.Trim() && rootDoc != null)In this code, attribute 'Text' is accessed first (moreover, method 'Trim' is called for this attribute), and only then the 'rootDoc' reference is checked for 'null'. If it proves to be equal to 'null', a 'NullReferenceException' will be raised. This bug can be fixed by having the referenced checked first and only then accessing the object's attribute:
if (rootDoc != null && rootDoc.Text.Trim() == documentName.Trim())This is the simplest way to fix the error. However, you should carefully examine the code to figure out how to fix it best in every particular case.
This diagnostic is classified as:
You can look at examples of errors detected by the V3027 diagnostic. |
V3028. Consider inspecting the 'for' operator. Initial and final values of the iterator are the same.
The analyzer has detected a potential error: initial and finite counter values coincide in the 'for' operator. Using the 'for' operator in such a way will cause the loop to be executed only once or not be executed at all.
Consider the following example:
void BeginAndEndForCheck(int beginLine, int endLine)
{
for (int i = beginLine; i < beginLine; i++)
{
...
}The loop body is never executed. Most likely, there is a misprint and "i < beginLine" should be replaced with the correct expression "i < endLine". This is the correct code:
for (int i = beginLine; i < endLine; i++)
{
...
}Another example:
for (int i = A; i <= A; i++)
...This loop's body will be executed only once. This is probably not what the programmer intended.
This diagnostic is classified as:
You can look at examples of errors detected by the V3028 diagnostic. |
V3029. The conditional expressions of the 'if' statements situated alongside each other are identical.
The analyzer has detected two 'if' statements with identical conditions following each other. This code is either redundant or incorrect.
Consider the following example:
public void Logging(string S_1, string S_2)
{
if (!String.IsNullOrEmpty(S_1))
Print(S_1);
if (!String.IsNullOrEmpty(S_1))
Print(S_2);
}There is an error in the second condition, where the 'S_1' variable is checked for the second time whereas it is variable 'S_2' that should be checked instead.
This is what the correct version of the code looks like:
public void Logging(string S_1, string S_2)
{
if (!String.IsNullOrEmpty(S_1))
Print(S_1);
if (!String.IsNullOrEmpty(S_2))
Print(S_2);
}This diagnostic does not always point out a bug; often, it deals with just redundant code:
public void Logging2(bool toFile, string S_1, string S_2)
{
if(toFile)
Print(S_1);
if (toFile)
Print(S_2);
}This code is correct but somewhat inefficient since it checks one and the same variable twice. We suggest rewriting it as follows:
public void Logging2(bool toFile, string S_1, string S_2)
{
if(toFile)
{
Print(S_1);
Print(S_2);
}
}You can look at examples of errors detected by the V3029 diagnostic. |
V3030. Recurring check. This condition was already verified in previous line.
The analyzer has detected a possible error that has to do with one and the same condition being checked twice.
Consider the following two examples:
// Example N1:
if (A == B)
{
if (A == B)
....
}
// Example N2:
if (A == B) {
} else {
if (A == B)
....
}The second "if (A == B)" condition is always true in the first case and always false in the second.
This code is very likely to contain an error – for example a wrong variable name is used because of a typo. Correct versions of the examples above should look like this:
// Example N1:
if (A == B)
{
if (A == C)
....
}
// Example N2:
if (A == B) {
} else {
if (A == C)
....
}This diagnostic is classified as:
You can look at examples of errors detected by the V3030 diagnostic. |
V3031. An excessive check can be simplified. The operator '||' operator is surrounded by opposite expressions 'x' and '!x'.
The analyzer has detected a code fragment that can be simplified. In this code, expressions with opposite meanings are used as operands of the '||' operator. This code is redundant and, therefore, can be simplified by using fewer checks.
Consider this example:
if (str == null || (str != null && str == "Unknown"))In the "str != null && str == "Unknown"" expression, the condition "str != null" is redundant since an opposite condition, "str == null", is checked before it, while both expressions act as operands of operator '||'. So the superfluous check inside the parentheses can be left out to make the code shorter:
if (str == null || str == "Unknown"))Redundancy may be a sign of an error – for example use of a wrong variable. If this is the case, the fixed version of the code above should look like this:
if (cond || (str != null && str == "Unknown"))Sometimes the condition is written in a reversed order and on first glance can not be simplified:
if ((s != null && s == "Unknown") || s == null)It seems that we can't get rid neither of a (s!=null) nor of a (s==null) check. This is not the case. This expression and the case described above, can be simplified:
if (s == null || s == "Unknown")You can look at examples of errors detected by the V3031 diagnostic. |
V3032. Waiting on this expression is unreliable, as compiler may optimize some of the variables. Use volatile variable(s) or synchronization primitives to avoid this.
The analyzer has detected a loop that may turn into an infinite one due to compiler-driven optimization. Such loops are usually used when the program is waiting for an external event.
Consider the following example:
private int _a;
public void Foo()
{
var task = new Task(Bar);
task.Start();
Thread.Sleep(10000);
_a = 0;
task.Wait();
}
public void Bar()
{
_a = 1;
while (_a == 1);
}If this code is compiled and executed in Debug configuration, the program will terminate correctly. But when compiled in Release mode, it will hang at the while loop. The reason is that the compiler will "cache" the value referred to by the '_a' variable.
This difference between Debug and Release versions may lead to complicated and hard-to-detect bugs, which can be fixed in a number of ways. For example, if the variable in question is really used to control the logic of a multithreaded program, special synchronization means such as mutexes or semaphores should be used instead. Another way is to add modifier 'volatile' to the variable definition:
private volatile int _a;
...Note that these means alone do not secure the sample code completely since Bar() is not guaranteed to start executing before the '_a' variable is assigned 0. We discussed this example only to demonstrate a potentially dangerous situation related to compiler optimizations. To make that code completely safe, additional synchronization is required before the _a = 0 expression to ensure that the _a = 1 expression has been executed.
This diagnostic is classified as:
You can look at examples of errors detected by the V3032 diagnostic. |
V3033. It is possible that this 'else' branch must apply to the previous 'if' statement.
The analyzer detected a potential error in logical conditions: code's logic does not coincide with the code formatting.
Consider this sample:
if (X)
if (Y) Foo();
else
z = 1;The code formatting disorientates you so it seems that the "z = 1" assignment takes place if X == false. But the 'else' branch refers to the nearest operator 'if'. In other words, this code is actually analogous to the following code:
if (X)
{
if (Y)
Foo();
else
z = 1;
}So, the code does not work the way it seems at first sight.
If you get the V3033 warning, it may mean one of the two following things:
1) Your code is badly formatted and there is no error actually. In this case you need to edit the code so that it becomes clearer and the V3033 warning is not generated. Here is a sample of correct editing:
if (X)
if (Y)
Foo();
else
z = 1;2) A logical error has been found. Then you may correct the code, for instance, this way:
if (X) {
if (Y)
Foo();
} else {
z = 1;
}This diagnostic is classified as:
You can look at examples of errors detected by the V3033 diagnostic. |
V3034. Consider inspecting the expression. Probably the '!=' should be used here.
The analyzer has detected a potential error. The '!=' or '== !' operator should be probably used instead of the '=!' operator. Such errors most often occur through misprints.
Consider an example of incorrect code:
bool a, b;
...
if (a =! b)
{
...
}It's most probably that this code should check that the 'a' variable is not equal to 'b'. If so, the correct code should look like follows:
if (a != b)
{
...
}The analyzer accounts for formatting in the expression. That's why if it is exactly assignment you need to perform - not comparison - you should specify it through parentheses or blanks. The following code samples are considered correct:
if (a = !b)
...
if (a=(!b))
...This diagnostic is classified as:
V3035. Consider inspecting the expression. Probably the '+=' should be used here.
The analyzer detected a potential error: there is a sequence of '=+' characters in code. It might be a misprint and you should use the '+=' operator.
Consider the following example:
int size, delta;
...
size=+delta;This code may be correct, but it is highly probable that there is a misprint and the programmer actually intended to use the '+=' operator. This is the fixed code:
int size, delta;
...
size+=delta;If this code is correct, you may remove '+' or type in an additional space to prevent showing the V3035 warning. The following is an example of correct code where the warning is not generated:
size = delta;
size = +delta;Note. To search for misprints of the 'A =- B' kind, we use the V3036 diagnostic rule. This check is implemented separately since a lot of false reports are probable and you may want to disable it.
This diagnostic is classified as:
You can look at examples of errors detected by the V3035 diagnostic. |
V3036. Consider inspecting the expression. Probably the '-=' should be used here.
The analyzer detected a potential error: there is a sequence of '=-' characters in code. It might be a misprint and you should use the '-=' operator.
Consider this sample:
int size, delta;
...
size =- delta;This code may be correct, but it is highly probable that there is a misprint and the programmer actually intended to use the '-=' operator. This is the fixed code:
int size, delta;
...
size -= delta;If the code is correct, you may type in an additional space between the characters '=' and '-' to remove the V3036 warning. This is an example of correct code where the warning is not generated:
size = -delta;To make false reports fewer, there are some specific exceptions to the V3036 rule. For instance, the analyzer will not generate the warning if a programmer does not use spaces between variables and operators. Here are some samples of code the analyzer considers safe:
A=-B;
int Z =- 1;
N =- N;Note. To search for misprints of the 'A =+ B' type, the V3035 diagnostic check is used.
This diagnostic is classified as:
V3037. An odd sequence of assignments of this kind: A = B; B = A;
The analyzer has detected a possible error that has to do with meaningless variable assignments.
Consider this example:
int a, b, c;
...
a = b;
c = 10;
b = a;The "B = A" assignment statement in this code does not make sense. It might be a typo or just unnecessary operation. This is what the correct version of the code should look like:
a = b;
c = 10;
b = a_2;You can look at examples of errors detected by the V3037 diagnostic. |
V3038. The argument was passed to method several times. It is possible that another argument should be passed instead.
The analyzer detected a possible error that has to do with passing two identical arguments to a method. It is a normal practice to pass one value as two arguments to many methods, so we implemented this diagnostic with certain restrictions.
The warning is triggered when arguments passed to the method and the method's parameters have a common pattern by which they can be described. Consider the following example:
void Do(int mX, int mY, int mZ)
{
// Some action
}
void Foo(Vecor3i vec)
{
Do(vec.x, vec.y, vec.y);
}Note the 'Do' method's signature and its call: the 'vec.y' argument is passed twice, while the 'mZ' parameter is likely to correspond to argument 'vec.z'. The fixed version could look like this:
Do(vec.x, vec.y, vec.z);The diagnostic suggests possible correct versions of one of the duplicate arguments, and if the suggested variable is within the scope of the caller, a warning will be displayed with information about the suspected typo and the correct argument.
V3038 The 'vec.y' argument was passed to 'Do' method several times. It is possible that the 'vec.z' argument should be passed to 'mZ' parameter.
Another suspicious situation is passing identical arguments to such functions as 'Math.Min', 'Math.Max', 'string.Equals', etc..
Consider the following example:
int count, capacity;
....
size = Math.Max(count, count);A typo causes the 'Math.Max' function to compare a variable with itself. This is the fixed version:
size = Math.Max(count, capacity);If you have encountered an error of this kind that the analyzer failed to diagnose, please email us and specify the name of the function that you do not want to receive one variable for several arguments.
Here is another example of an error found in real-life code:
return invariantString
.Replace(@"\", @"\\")
.Replace("'", @"\'")
.Replace("\"", @"""");The programmer seems to be unfamiliar with the specifics of string literals preceded by the '@' character, which was the cause of a subtle error when writing the sequence @"""". Based on the code, it seems the programmer wanted to have two quotation marks added in succession. However, because of the mistake, one quotation mark will be replaced by another. There are two ways to fix this error. The first solution:
.Replace("\"", "\"\"")The second solution:
.Replace("\"", @"""""")This diagnostic is classified as:
You can look at examples of errors detected by the V3038 diagnostic. |
V3039. Consider inspecting the 'Foo' function call. Defining an absolute path to the file or directory is considered a poor style.
The analyzer has detected a possible error in a call to a function intended for file handling. The error has to do with an absolute path to a file or directory being passed to the function as one of the arguments. Passing absolute paths as arguments can be dangerous since such paths may not exist on the user's computer.
Consider the following example:
String[] file = File.ReadAllLines(
@"C:\Program Files\MyProgram\file.txt");A better solution is to get the path to the file based on certain conditions.
This is what the fixed version of the code should look like:
String appPath = Path.GetDirectoryName(
Assembly.GetExecutingAssembly().Location);
String[] fileContent = File.ReadAllLines(
Path.Combine(appPath, "file.txt"));In this code, the file will be looked up in the application's directory.
This diagnostic is classified as:
V3040. The expression contains a suspicious mix of integer and real types.
The analyzer detected a possible error in an expression where integer and real data types are used together. Real data types include types 'float' and 'double'.
Consider the following example taken from a real application:
public long ElapsedMilliseconds { get; }
....
var minutes = watch.ElapsedMilliseconds / 1000 / 60;
Assert.IsTrue(minutes >= 0.95 && minutes <= 1.05);The 'minutes' variable is of type 'long', and comparing it with values 0.95 and 1.05 does not make sense. The only integer value that fits into this range is 1.
The programmer probably expected the result of integer division operation to be a value of type 'double', but it is not so. In the example above, integer division produces an integer value, which is assigned to the 'minutes' variable.
This code can be fixed by explicitly casting the number of milliseconds to type 'double', before the division operation:
var minutes = (double)watch.ElapsedMilliseconds / 1000 / 60;
Assert.IsTrue(minutes >= 0.95 && minutes <= 1.05);The quotient will now be more accurate, and the 'minutes' variable will be of type 'double'.
This diagnostic is classified as:
You can look at examples of errors detected by the V3040 diagnostic. |
V3041. The expression was implicitly cast from integer type to real type. Consider utilizing an explicit type cast to avoid the loss of a fractional part.
The analyzer detected a possible error that has to do with a result of integer division being implicitly cast to type float. Such cast may lead to inaccurate result.
Consider the following example:
int totalTime = 1700;
int operationNum = 900;
double averageTime = totalTime / operationNum;The programmer expects the 'averageTime' variable to refer to value '1.888(8)', but because the division operation is applied to integer values and only then is the resulting value cast to type float, the variable will actually refer to '1.0'.
As in the previous case, there are two ways to fix the error.
One way is to change the variables' types:
double totalTime = 1700;
double operationNum = 900;
double averageTime = totalTime / operationNum;Another way is to use explicit type cast.
int totalTime = 1700;
int operationNum = 900;
double averageTime = (double)(totalTime) / operationNum;This diagnostic is classified as:
You can look at examples of errors detected by the V3041 diagnostic. |
V3042. Possible NullReferenceException. The '?.' and '.' operators are used for accessing members of the same object.
The analyzer has detected that members of one object are accessed in two different ways – using operators "?." and ".". When accessing a part of an expression through "?.", it is assumed that the preceding member may be null; therefore, trying to access this member using operator "." will cause a crash.
Consider the following example:
if (A?.X == X || A.X == maxX)
...The programmer's inattention may result in a situation when the first check will return false and the second check will raise a NullReferenceException if "A" is null. The fixed code should look like this:
if (A?.X == X || A?.X == maxX)
...And here is another example of this error, taken from a real application:
return node.IsKind(SyntaxKind.IdentifierName) &&
node?.Parent?.FirstAncestorOrSelf<....>() != null;In the second part of the condition, it is assumed that "node" may be null: "node?.Parent"; but there is no such check when calling function "IsKind".
This diagnostic is classified as:
You can look at examples of errors detected by the V3042 diagnostic. |
V3043. The code's operational logic does not correspond with its formatting.
The analyzer detected a possible error: the formatting of the code after a conditional statement does not correspond with the program's execution logic. Opening and closing braces may be missing.
Consider the following example:
if (a == 1)
b = c; d = b;In this code, the assignment 'd = b;' will be executed all the time regardless of the 'a == 1' condition.
If it is really an error, the code can be fixed by adding the braces:
if (a == 1)
{ b = c; d = b; }Here is one more example of incorrect code:
if (a == 1)
b = c;
d = b;Again, we need to put in the braces to fix the error:
if (a == 1)
{
b = c;
d = b;
}If it is not an error, the code should be formatted in the following way to prevent the displaying of warning V3043:
if (a == 1)
b = c;
d = b;This diagnostic is classified as:
You can look at examples of errors detected by the V3043 diagnostic. |
V3044. WPF: writing and reading are performed on a different Dependency Properties.
The analyzer detected a possible error related to dependency property registration. The property that performs writing into/reading from properties was defined incorrectly.
class A : DependencyObject
{
public static readonly DependencyProperty CurrentTimeProperty =
DependencyProperty.Register("CurrentTime", ....);
public static readonly DependencyProperty OtherProperty =
DependencyProperty.Register("Other", ....);
public DateTime CurrentTime {
get { return (DateTime)GetValue(CurrentTimeProperty); }
set { SetValue(OtherProperty, value); } }
}
....Because of copy-paste, the methods GetValue and SetValue, used in the definitions of the get and set access methods of the CurrentTime property, work with different dependency properties. As a result, when reading from CurrentTime, the value will be retrieved from the CurrentTimeProperty dependency property, but when writing a value into CurrentTime, it will be written into 'OtherProperty'.
A correct way to address the dependency property in the code above is as follows:
public DateTime CurrentTime {
get { return (DateTime)GetValue(CurrentTimeProperty); }
set { SetValue(CurrentTimeProperty, value); } }
}V3045. WPF: the names of the property registered for DependencyProperty, and of the property used to access it, do not correspond with each other.
The analyzer detected a possible error related to dependency property registration. A wrong name was defined for the property used to access the registered dependency property.
class A : DependencyObject
{
public static readonly DependencyProperty ColumnRulerPenProperty =
DependencyProperty.Register("ColumnRulerBrush", ....);
public DateTime ColumnRulerPen {
get { return (DateTime)GetValue(ColumnRulerPenProperty); }
set { SetValue(ColumnRulerPenProperty, value); }
}
....Because of renaming, a wrong name was defined for the property used for writing into the ColumnRulerPenProperty dependency property. In the example above, taken from a real application, the name ColumnRulerPen is used instead of ColumnRulerBrush (as suggested by the Register function's parameters).
Implementing dependency properties in a way like that may cause problems because, when accessing the ColumnRulerPen property from the XAML markup for the first time, the value will be successfully read, but it won't update as this property changes.
A correct property definition in the code above should look like this:
public DateTime ColumnRulerBrush {
get { return (DateTime)GetValue(CurrentTimeProperty); }
set { SetValue(CurrentTimeProperty, value); }
}In real programs, the following version of incorrect dependency property name definition is also common:
public static readonly DependencyProperty WedgeAngleProperty =
DependencyProperty.Register("WedgeAngleProperty", ....);It is supposed that the word "Property" will be missing from the string literal:
public static readonly DependencyProperty WedgeAngleProperty =
DependencyProperty.Register("WedgeAngle", ....);You can look at examples of errors detected by the V3045 diagnostic. |
V3046. WPF: the type registered for DependencyProperty does not correspond with the type of the property used to access it.
The analyzer detected a possible error related to dependency property registration. When registering a dependency property, a wrong type was specified for its values.
In the following example, it is property CurrentTimeProperty:
class A : DependencyObject
{
public static readonly DependencyProperty CurrentTimeProperty =
DependencyProperty.Register("CurrentTime", typeof(int),....);
public DateTime CurrentTime
{
get { return (DateTime)GetValue(CurrentTimeProperty); }
set { SetValue(CurrentTimeProperty, value); }
}
....Because of using copy-paste when registering the dependency property, type int was mistakenly specified as the type of values taken by the property. Trying to write into or read from CurrentTimeProperty within the CurrentTime property will raise an error.
A correct way to register the dependency property in the code above is as follows:
public static readonly DependencyProperty CurrentTimeProperty =
DependencyProperty.Register("CurrentTime", typeof(DateTime),....);This diagnostic also checks if the type of a dependency property being registered and the type of its default value correspond with each other.
public static readonly DependencyProperty CurrentTimeProperty =
DependencyProperty.Register("CurrentTime", typeof(DateTime),
typeof(A),
new FrameworkPropertyMetadata(132));In this example, the default value is 132 while type DateTime is specified as the type of values that the property can take.
You can look at examples of errors detected by the V3046 diagnostic. |
V3047. WPF: A class containing registered property does not correspond with a type that is passed as the ownerType.type.
The analyzer detected a potential error related to dependency property registration. When registering a dependency property, the owner type specified for this property refers to a class different from the one the property is originally defined in.
class A : DependencyObject { .... }
class B : DependencyObject
{
public static readonly DependencyProperty CurrentTimeProperty =
DependencyProperty.Register("CurrentTime", typeof(DateTime),
typeof(A));
....Because of using copy-paste when registering the dependency property, class 'A' was mistakenly specified as its owner while this property was actually defined in class 'B'.
A correct way to register this dependency property is as follows:
class B : DependencyObject
{
public static readonly DependencyProperty CurrentTimeProperty =
DependencyProperty.Register("CurrentTime", typeof(DateTime),
typeof(B));V3048. WPF: several Dependency Properties are registered with a same name within the owner type.
The analyzer detected a possible error related to dependency property registration. Two dependency properties were registered under the same name within one class.
class A : DependencyObject
{
public static readonly DependencyProperty CurrentTimeProperty =
DependencyProperty.Register("CurrentTime",....);
public static readonly DependencyProperty OtherProperty =
DependencyProperty.Register("CurrentTime",....);
....Because of copy-paste, the OtherProperty dependency property was registered under the name 'CurrentTime' instead of 'Other' as intended by the developer.
A correct way to register the dependency properties in the code above is as follows:
public static readonly DependencyProperty CurrentTimeProperty =
DependencyProperty.Register("CurrentTime",....);
public static readonly DependencyProperty OtherProperty =
DependencyProperty.Register("Other",....);V3049. WPF: readonly field of 'DependencyProperty' type is not initialized.
The analyzer detected a possible error related to dependency property registration. A dependency property was defined but wasn't initialized: it will cause an error when trying to access the property using SetValue / GetValue.
class A : DependencyObject
{
public static readonly DependencyProperty CurrentTimeProperty;
static A(){ /* CurrentTimeProperty not initialized */ }
....Bad refactoring or copy-paste may result in leaving a dependency property unregistered. The following is the fixed version of the code above:
class A : DependencyObject
{
public static readonly DependencyProperty CurrentTimeProperty;
static A()
{
CurrentTimeProperty =
DependencyProperty.Register("CurrentTime", typeof(DateTime),
typeof(A));
}
....V3050. Possibly an incorrect HTML. The </XX> closing tag was encountered, while the </YY> tag was expected.
The analyzer has detected a string literal containing HTML markup with errors: a closing tag required for an element does not correspond with its opening tag.
Consider the following example:
string html = "<B><I>This is a text, in bold italics.</B>";In this code, the opening tag "<I>" must be matched with closing tag "</I>"; instead, closing tag "</B>" is encountered further in the string. This is an error, which renders this part of the HTML code invalid.
To fix the error, correct sequences of opening and closing tags must be ensured.
This is what the fixed version of the code should look like:
string html = "<B><I>This is a text, in bold italics.</I></B>";You can look at examples of errors detected by the V3050 diagnostic. |
V3051. An excessive type cast or check. The object is already of the same type.
An expression with a redundant operator 'as' or 'is' was detected. It makes no sense casting an object to or checking its compatibility with its own type. Such operations are usually just redundant code, but sometimes they may indicate a bug.
To figure out what this bug pattern is about, let's discuss a few examples.
A synthetic example:
public void SomeMethod(String str)
{
var localStr = str as String;
....
}When initializing the 'localStr' variable, object 'str' is explicitly cast to type 'String', although it's not necessary since 'str' is already of type 'String'.
The fixed version would then look like this:
public void SomeMethod(String str)
{
String localStr = str;
....
}Instead of explicitly specifying the 'localStr' object type, the programmer could have kept the keyword 'var' here, but explicit type specification makes the program clearer.
The following is a more interesting example:
public object FindName(string name, FrameworkElement templatedParent);
....
lineArrow = (Grid)Template.FindName("lineArrow", this) as Grid;
if (lineArrow != null);
....Let's examine the line with casts closer to see what's happening:
- Method 'FindName' returns an object of type 'object', which the programmer tries to explicitly cast to type 'Grid'.
- If this cast fails, an 'InvalidCastException' will be raised.
- If, on the contrary, the cast is successful, the object will be again cast to the same type, 'Grid', using the 'as' operator. Then the cast is guaranteed to be successful, and this cast is redundant.
- As a result, if the cast fails, 'lineArrow' will never be assigned the value 'null'.
As suggested by the next line, it is assumed that 'lineArrow' may refer to the 'null' value, so it is exactly the 'as' operator that is supposed to be used. As explained before, 'lineArrow' can't take the value 'null' if the cast fails. Therefore, it's not just a redundant cast – it's an apparent error.
To solve this issue, we can remove the extra cast operation from the code:
lineArrow = Template.FindName("lineArrow", this) as Grid;
if (lineArrow != null);This diagnostic is classified as:
You can look at examples of errors detected by the V3051 diagnostic. |
V3052. The original exception object was swallowed. Stack of original exception could be lost.
The analyzer detected that the original object of a caught exception was not used properly when re-throwing from a catch block. This issue makes some errors hard to detect since the stack of the original exception is lost.
Further we will discuss a couple of examples of incorrect code. The first example:
public Asn1Object ToAsn1Object()
{
try
{
return Foo(_constructed, _tagNumber);
}
catch (IOException e)
{
throw new ParsingException(e.Message);
}
}In this code, the programmer wanted to transform the caught I/O exception into a new exception of type 'ParsingException'. However, only the message from the first exception is included, so some of the information is lost.
The fixed version of the code:
public Asn1Object ToAsn1Object()
{
try
{
return Foo(_constructed, _tagNumber);
}
catch (IOException e)
{
throw new ParsingException(e.Message, e);
}
}In the fixed version, the original exception is re-thrown as an inner one, so all the information about the original error is saved.
Here's the second example:
private int ReadClearText(byte[] buffer, int offset, int count)
{
int pos = offset;
try
{
....
}
catch (IOException ioe)
{
if (pos == offset) throw ioe;
}
return pos - offset;
}In this case, the caught I/O exception is thrown again, completely erasing the stack of the original error. To avoid this defect, we just need to re-throw the original exception.
The fixed version of the code:
private int ReadClearText(byte[] buffer, int offset, int count)
{
int pos = offset;
try
{
....
}
catch (IOException ioe)
{
if (pos == offset) throw;
}
return pos - offset;
}This diagnostic is classified as:
You can look at examples of errors detected by the V3052 diagnostic. |
V3053. An excessive expression. Examine the substrings "abc" and "abcd".
The analyzer detected a potential bug, connected with the fact that a longer and shorter substrings are searched in the expression. With all that a shorter string is a part of a longer one. As a result, one of the comparisons is redundant or there is a bug here.
Consider the following example:
if (str.Contains("abc") || str.Contains("abcd"))If substring "abc" is found, the check will not execute any further. If substring "abc" is not found, then searching for longer substring "abcd" does not make sense either.
To fix this error, we need to make sure that the substrings were defined correctly or delete extra checks, for example:
if (str.Contains("abc"))Here's another example:
if (str.Contains("abc"))
Foo1();
else if (str.Contains("abcd"))
Foo2();In this code, function Foo2() will never be called. We can fix the error by reversing the check order to make the program search for the longer substring first and then search for the shorter one:
if (str.Contains("abcd"))
Foo2();
else if (str.Contains("abc"))
Foo1();You can look at examples of errors detected by the V3053 diagnostic. |
V3054. Potentially unsafe double-checked locking. Use volatile variable(s) or synchronization primitives to avoid this.
The analyzer detected a possible error related to unsafe use of the "double-checked locking" pattern. This software design pattern is used to reduce the overhead of acquiring a lock by first testing the locking criterion without actually acquiring the lock. Only if the locking criterion check indicates that locking is required, does the actual locking logic proceed. That is, locking will be performed only if really needed.
Consider the following example of unsafe implementation of this pattern in C#:
private static MyClass _singleton = null;
public static MyClass Singleton
{
get
{
if(_singleton == null)
lock(_locker)
{
if(_singleton == null)
{
MyClass instance = new MyClass();
instance.Initialize();
_singleton = instance;
}
}
return _singleton;
}
}In this example, the pattern is used to implement "lazy initialization" – that is, initialization is delayed until a variable's value is needed for the first time. This code will work correctly in a program that uses a singleton object from one thread. To ensure safe initialization in a multithreaded program, a construct with the lock statement is usually used. However, it's not enough in our example.
Note the call to method 'Initialize' of the 'Instance' object. When building the program in Release mode, the compiler may optimize this code and invert the order of assigning the value to the '_singleton' variable and calling to the 'Initialize' method. In that case, another thread accessing 'Singleton' at the same time as the initializing thread may get access to the object before initialization is over.
Here's another example of using the double-checked locking pattern:
private static MyClass _singleton = null;
private static bool _initialized = false;
public static MyClass Singleton;
{
get
{
if(!_initialized)
lock(_locker)
{
if(!_initialized)
{
_singleton = new MyClass();
_initialized = true;
}
}
return _singleton;
}
}Like in the previous example, compiler optimization of the order of assigning values to variables '_singleton' and '_initialized' may cause errors. That is, the '_initialized' variable will be assigned the value 'true' first, and only then will a new object of the 'MyClass' type, be created and the reference to it be assigned to '_singleton'.
Such inversion may cause an error when accessing the object from a parallel thread. It turns out that the '_singleton' variable will not be specified yet while the '_initialized' flag will be already set to 'true'.
One of the dangers of these errors is the seeming correctness of the program's functioning. Such false impression occurs because this problem won't occur very often and will depend on the architecture of the processor used, CLR version, and so on.
There are several ways to ensure thread-safety when using the pattern. The simplest way is to mark the variable checked in the if condition with the 'volatile' keyword:
private static volatile MyClass _singleton = null;
public static MyClass Singleton
{
get
{
if(_singleton == null)
lock(_locker)
{
if(_singleton == null)
{
MyClass instance = new MyClass();
instance.Initialize();
_singleton = instance;
}
}
return _singleton;
}
}The volatile keyword will prevent the variable from being affected by possible compiler optimizations related to swapping write/read instructions and caching its value in processor registers.
For performance reasons, it's not always a good solution to declare a variable as volatile. In that case, you can use the following methods to access the variable: 'Thread.VolatileRead', 'Thread.VolatileWrite', and 'Thread.MemoryBarrier'. These methods will put barriers for reading/writing memory only where necessary.
Finally, you can implement "lazy initialization" using the 'Lazy<T>' class, which was designed specifically for this purpose and is available in .NET starting with version 4.
See also: Detecting the incorrect double-checked locking using the V3054 diagnostic.
This diagnostic is classified as:
You can look at examples of errors detected by the V3054 diagnostic. |
V3055. Suspicious assignment inside the condition expression of 'if/while/for' operator.
The analyzer detected an issue that has to do with using the assignment operator '=' with boolean operands inside the conditions of statements if/while/do while/for. It is very likely that the '==' operator was meant to be used instead.
Consider the following example:
void foo(bool b1, bool b2)
{
if (b1 = b2)
....There is a typo in this code. It will result in changing the value of variable b1 instead of comparing variables b1 and b2. The fixed version of this code should look like this:
if (b1 == b2)If you want to do assignment inside an 'if' statement to save on code size, it is recommended that you parenthesize the assignment statement: it is a common programming technique described in books and recognized by different compilers and code analyzers.
A condition with additional parentheses tells programmers and code analyzers that there is no error:
if ((b1 = b2))Furthermore, not only do additional parentheses make code easier to read, but they also prevent mistakes related to operation precedence, as in the following example:
if ((a = b) || a == c)
{ }Without parentheses, the part 'b || a == c' would be evaluated first, according to operation precedence, and then the result of this expression would be assigned to variable 'a'. This behavior may be different from what the programmer expected.
This diagnostic is classified as:
V3056. Consider reviewing the correctness of 'X' item's usage.
The analyzer has found a possible typo in code. There is a certain evident pattern in the code that was broken. For instance, the 'GetX' method was used twice instead of 'GetX' and 'GetY' respectively for initializing variables 'x' and 'y'.
Consider the example:
int x = GetX() * n;
int y = GetX() * n;In the second line, function GetX() is used instead of GetY(). The fixed version:
int x = GetX() * n;
int y = GetY() * n;To detect this error, the analyzer uses the following logic. There is a line with a name containing fragment "X". Nearby is a line with an antipode name containing fragment "Y". But the second line also contains the name with "X". If this and a few other conditions are true, this construct is treated as dangerous and the analyzer suggests reviewing it. If, for example, there were no variables "x" and "y" in the left part, the warning wouldn't be triggered. Here is an example that the analyzer would ignore:
array[0] = GetX() / 2;
array[1] = GetX() / 2;Unfortunately, this diagnostic produces false positives since the analyzer doesn't know the program structure and the purpose of the code. Consider, for example, the following test code:
var t1 = new Thread { Name = "Thread 1" };
var t2 = new Thread { Name = "Thread 2" };
var m1 = new Message { Name = "Thread 1: Message 1", Thread = t1};
var m2 = new Message { Name = "Thread 1: Message 2", Thread = t1};
var m3 = new Message { Name = "Thread 2: Message 1", Thread = t2};The analyzer assumes that variable 'm2' was declared using copy-paste and it led to an error: variable 't1' is used instead of 't2'. But there is no error actually. As the messages suggest, this code tests the printing of messages 'm1' and 'm2' from thread 't1' and of message 'm3' from thread 't2'. For cases like this, the analyzer allows you to suppress the warning by adding the comment "//-V3056" or through other false-positive suppression mechanisms.
This diagnostic is classified as:
You can look at examples of errors detected by the V3056 diagnostic. |
V3057. Function receives an odd argument.
The analyzer detected a possible error that has to do with passing a suspicious value as an argument to a function.
Consider the following examples:
Invalid characters in a path
string GetLogPath(string root)
{
return System.IO.Path.Combine(root, @"\my|folder\log.txt");
}A path containing invalid character '|' is passed to function 'Combine()'. It will result in an 'ArgumentException'.
The fixed version:
string GetLogPath(string root)
{
return System.IO.Path.Combine(root, @"\my\folder\log.txt");
}Suspicious argument to format function
string.Format(mask, 1, 2, mask);The 'string.Format()' function replaces one or more format items in a specified string. An attempt to write the same string into the format string is treated as suspicious by the analyzer.
Invalid index
var pos = mask.IndexOf('\0');
if (pos != 0)
asciiname = mask.Substring(0, pos);'IndexOf()' returns the position of a specified argument. If the argument is not found, the function returns the value '-1'. And passing a negative index to function 'Substring()' results in an 'ArgumentOutOfRangeException'.
The fixed version:
var pos = mask.IndexOf('\0');
if (pos > 0)
asciiname = mask.Substring(0, pos);Note that the analyzer may also issue a warning when a correct argument is passed to the method, but the corresponding parameter inside the method may take an invalid value.
static void Bar(string[] data, int index, int length)
{
if (index < 0)
throw new Exception(....);
if (data.Length < index + length)
length = data.Length - index; // <=
....
Array.Copy(data, index, result, 0, length); // <=
}
static void Foo(string[] args)
{
Bar(args, 4, 2); // <=
....
}In this case, the analyzer will issue a warning that the 'length' parameter used in the 'Array.Copy' method call may take a negative value. This parameter corresponds to the '2' argument passed in the 'Bar' call. This will result in 'ArgumentOutOfRangeException'.
Indeed, if the size of the 'args' array ('data' inside the 'Bar' method) is less than 4, a negative value will be written to 'length' inside 'Bar', despite the fact that a positive value (2) is passed to the method. As a result, an exception will be thrown when calling 'Array.Copy'.
In the 'Bar' method, you should add a check for the new 'length' value and the necessary processing of negative values:
if (data.Length < index + length)
length = data.Length - index;
if (length < 0)
.... // Error handlingThis diagnostic is classified as:
You can look at examples of errors detected by the V3057 diagnostic. |
V3058. An item with the same key has already been added.
The analyzer detected an issue that has to do with adding values to a dictionary for a key already present in this dictionary. It will cause raising an ArgumentException at runtime with the message: "An item with the same key has already been added".
Consider the following example:
var mimeTypes = new Dictionary<string, string>();
mimeTypes.Add(".aif", "audio/aiff");
mimeTypes.Add(".aif", "audio/x-aiff"); // ArgumentExceptionIn this code, an ArgumentException will be raised when attempting to add a value for the ".aif" key for the second time.
To make this code correct, we must avoid duplicates of keys when filling the dictionary:
var mimeTypes = new Dictionary<string, string>();
mimeTypes.Add(".aif", "audio/aiff");This diagnostic is classified as:
V3059. Consider adding '[Flags]' attribute to the enum.
The analyzer detected a suspicious enumeration whose members participate in bitwise operations or have values that are powers of 2. The enumeration itself, however, is not marked with the [Flags] attribute.
If one of these conditions is true, the [Flags] attribute must be set for the enumeration if you want to use it as a bit flag: it will give you some advantages when working with this enumeration.
For a better understanding of how using the [Flags] attribute with enumerations changes the program behavior, let's discuss a couple of examples:
enum Suits { Spades = 1, Clubs = 2, Diamonds = 4, Hearts = 8 }
// en1: 5
var en1 = (Suits.Spades | Suits.Diamonds);Without the [Flags] attribute, executing the OR bitwise operation over the members with the values '1' and '4' will result in the value '5'.
It changes when [Flags] is specified:
[Flags]
enum SuitsFlags { Spades = 1, Clubs = 2, Diamonds = 4, Hearts = 8 }
// en2: SuitsFlags.Spades | SuitsFlags.Diamonds;
var en2 = (SuitsFlags.Spades | SuitsFlags.Diamonds);In this case, the result of the OR operation is treated not as a single integer value, but as a set of bits containing the values 'SuitsFlags.Spades' and 'SuitsFlags.Diamonds'.
If you call to method 'ToString' for objects 'en1' and 'en2', the results will be different, too. This method attempts to convert numerical values to their character equivalents, but the value '5' has no such equivalent. However, when the 'ToString' method discovers that the enumeration is used with the [Flags] attribute, it treats the numerical values as sets of bit flags. Therefore, calling to the 'ToString' method for objects 'en1' and 'en2' will result in the following:
String str1 = en1.ToString(); // "5"
String str2 = en2.ToString(); // "SuitsFlags.Spades |
// SuitsFlags.Diamonds"In a similar way, numerical values are obtained from a string using static methods 'Parse' and 'TryParse' of class 'Enum'.
Another advantage of the [Flags] attribute is that it makes the debugging process easier, too. The value of the 'en2' variable will be displayed as a set of named constants, not as simply a number:

References:
- What does the [Flags] Enum Attribute mean in C#?
- CLR via C#. Jeffrey Richter. Chapter 15 - Enumerated Types and Bit Flags.
V3060. A value of variable is not modified. Consider inspecting the expression. It is possible that other value should be present instead of '0'.
The analyzer detected a suspicious bitwise expression. This expression was meant to change certain bits in a variable, but the value this variable refers to will actually stay unchanged.
Consider the following example:
A &= ~(0 << Y);
A = A & ~(0 << Y);The programmer wanted to clear a certain bit in the variable's value but made a mistake and wrote 0 instead of 1.
Both expressions evaluate to the same result, so let's examine the second line as a clearer example. Suppose we have the following values of the variables in bit representation:
A = 0..0101
A = 0..0101 & ~(0..0000 << 0..00001)
Shifting the value 0 by one bit to the left won't change anything; we'll get the following expression:
A = 0..0101 & ~0..0000
Then, the bitwise negation operation will be executed, resulting in the following expression:
A = 0..0101 & 11111111
After executing the bitwise "AND" operation, the original and resulting expressions will turn out to be the same:
A = 0..0101
The fixed version of the code should look like this:
A &= ~(1 << Y);
A = A & ~(1 << Y);This diagnostic is classified as:
V3061. Parameter 'A' is always rewritten in method body before being used.
The analyzer detected a possible error in a method's body. One of the method's parameters is rewritten before being used; therefore, the value passed to the method is simply lost.
This error can manifest itself in a number of ways. Consider the following example:
void Foo1(Node A, Node B)
{
A = SkipParenthesize(A);
B = SkipParenthesize(A);
// do smt...
}There is a typo here that will result in the 'B' object being assigned an incorrect value. The fixed code should look like this:
void Foo1(Node A, Node B)
{
A = SkipParenthesize(A);
B = SkipParenthesize(B);
// do smt...
}However, this bug can take trickier forms:
void Foo2(List<Int32> list, Int32 count)
{
list = new List<Int32>(count);
for (Int32 i = 0; i < count; ++i)
list.Add(GetElem(i));
}This method was meant to initialize a list with some values. But what actually takes place is copying of the reference ('list'), which stores the address of the memory block in the heap where the list (or 'null' if memory wasn't allocated) is stored. Therefore, when we allocate memory for the list once again, the memory block's address is written into a local copy of the reference while the original reference (outside the method) remains unchanged. It results in additional work on memory allocation, list initialization, and subsequent garbage collection.
The error has to do with a missing 'out' modifier. This is the fixed version of the code:
void Foo2(out List<Int32> list, Int32 count)
{
list = new List<Int32>(count);
for (Int32 i = 0; i < count; ++i)
list.Add(GetElem(i));
}You can look at examples of errors detected by the V3061 diagnostic. |
V3062. An object is used as an argument to its own method. Consider checking the first actual argument of the 'Foo' method.
The analyzer detected a method call in which an object is used as an argument to its own method. Most likely, this is erroneous code and the method should be passed another object.
Consider the example:
A.Foo(A);Due to a typo the incorrect variable name is used here. The fixed version of this code should look like this:
A.Foo(B);or this:
B.Foo(A);And here's an example from a real application:
private bool CanRenameAttributePrefix(....)
{
....
var nameWithoutAttribute =
this.RenameSymbol.Name.GetWithoutAttributeSuffix(isCaseSensitive:
true);
var triggerText = GetSpanText(document,
triggerSpan,
cancellationToken);
// nameWithoutAttribute, triggerText - String
return triggerText.StartsWith(triggerText);
}The return value in this code will always be the value 'true' because the method that checks whether a string starts with a substring receives, as its argument, the string itself ('triggerText'). The programmer must have meant the following check instead:
return triggerText.StartsWith(nameWithoutAttribute);You can look at examples of errors detected by the V3062 diagnostic. |
V3063. A part of conditional expression is always true/false if it is evaluated.
The analyzer detected a possible error inside a logical condition a part of which is always true/false and is considered to be suspicious.
Consider the following example:
uint i = length;
while ((i >= 0) && (n[i] == 0)) i--;The "i >= 0" condition is always true because the 'i' variable is of type uint, so if 'i' reaches zero, the while loop won't stop and 'i' will take the maximum value of type uint. An attempt of further access to the 'n' array will result in raising an OverflowException.
The fixed code:
int i = length;
while ((i >= 0) && (n[i] == 0)) i--;Here's another example:
public static double Cos(double d)
{
// -9223372036854775295 <= d <= 9223372036854775295
bool expected = !performCheck ||
!(-9223372036854775295 <= d || // <=
d <= 9223372036854775295);
if (!expected)
....The programmer wanted to make sure that the d variable belongs to the specified range (it is stated in the comment before the check) but made a typo and wrote the '||' operator instead of '&&'. The fixed code:
bool expected = !performCheck ||
!(-9223372036854775295 <= d &&
d <= 9223372036854775295);Sometimes the V3063 warning detects simply redundant code rather than an error. For example:
if (@char < 0x20 || @char > 0x7e) {
if (@char > 0x7e
|| (@char >= 0x01 && @char <= 0x08)
|| (@char >= 0x0e && @char <= 0x1f)
|| @char == 0x27
|| @char == 0x2d)The analyzer will warn us that the subexpressions @char == 0x27 and @char == 0x2d are always false because of the preceding if statement. This code may work quite well, but it is redundant and we'd better simplify it. It will make the program easier to read for other developers.
This is the simplified version of the code:
if (@char < 0x20 || @char > 0x7e) {
if (@char > 0x7e
|| (@char >= 0x01 && @char <= 0x08)
|| (@char >= 0x0e && @char <= 0x1f))This diagnostic is classified as:
You can look at examples of errors detected by the V3063 diagnostic. |
V3064. Division or mod division by zero.
The analyzer detected a potential division by zero.
Consider the following example:
if (maxHeight >= 0)
{
fx = height / maxHeight;
}It is checked in the condition if the value of the maxHeight variable is non-negative. If this value equals 0, a division by zero will occur inside the if statement's body. To fix this issue, we must ensure that the division operation is executed only when maxHeight refers to a positive number.
The fixed version of the code:
if (maxHeight > 0)
{
fx = height / maxHeight;
}This diagnostic is classified as:
You can look at examples of errors detected by the V3064 diagnostic. |
V3065. Parameter is not utilized inside method's body.
The analyzer detected a suspicious situation when one parameter of a method is never used while another parameter is used several times. It may be a sign of an error.
Consider the following example:
private static bool CardHasLock(int width, int height)
{
const double xScale = 0.051;
const double yScale = 0.0278;
int lockWidth = (int)Math.Round(height * xScale);
int lockHeight = (int)Math.Round(height * yScale);
....
}The 'width' parameter is never used in the method body while the 'height' parameter is used twice, including the initialization of the 'lockWidth' variable. This code is very likely to contain an error and the 'lockWidth' variable should be actually initialized in the following way:
int lockWidth = (int)Math.Round(width * xScale);You can look at examples of errors detected by the V3065 diagnostic. |
V3066. Possible incorrect order of arguments passed to method.
The analyzer detected a suspicious sequence of arguments passed to a method. Perhaps, some arguments are misplaced.
An example of suspicious code:
void SetARGB(byte a, byte r, byte g, byte b)
{ .... }
void Foo(){
byte A = 0, R = 0, G = 0, B = 0;
....
SetARGB(A, R, B, G);
....
}When defining the object color, the programmer accidentally swapped the blue and green color parameters.
The fixed version of the code should look like this:
SetARGB(A, R, G, B);Here's an example from a real project:
public virtual string Qualify(string catalog,
string schema,
string table)
{ .... }
public Table AddDenormalizedTable(....) {
string key = subselect ??
dialect.Qualify(schema, catalog, name);
....
}As logic suggests, the code should actually look like this:
public Table AddDenormalizedTable(....) {
string key = subselect ??
dialect.Qualify(catalog, schema, name);
....
}This diagnostic is classified as:
You can look at examples of errors detected by the V3066 diagnostic. |
V3067. It is possible that 'else' block was forgotten or commented out, thus altering the program's operation logics.
The analyzer has detected a suspicious code fragment which may be a forgotten or incorrectly commented else block.
This issue is best explained on examples.
if (!x)
t = x;
else
z = t;In this case, code formatting doesn't meet its logic: the z = t expression will execute only if (x == 0), which is hardly what the programmer wanted. A similar situation may occur when a code fragment is not commented properly:
if (!x)
t = x;
else
//t = -1;
z = t;In this case, we either need to fix the formatting by turning it into something more readable or fix the logic error by adding a missing branch of the if operator.
Sometimes there are cases when it's hard to say whether this code is incorrect or if it is peculiar code formatting. The analyzer tries to decrease the number of false positives related to code formatting, by not issuing warnings when the code is formatted with both spaces and tabs; with that the number of tabs is various in different strings.
This diagnostic is classified as:
You can look at examples of errors detected by the V3067 diagnostic. |
V3068. Calling overrideable class member from constructor is dangerous.
The analyzer detected a potential error inside a class constructor - invoking an overridable method (virtual or abstract).
The following example shows how such call can lead to an error:
abstract class Base
{
protected Base()
{
Initialize();
}
protected virtual void Initialize()
{
...
}
}
class Derived : Base
{
Logger _logger;
public Derived(Logger logger)
{
_logger = logger;
}
protected override void Initialize()
{
_logger.Log("Initializing");
base.Initialize();
}
}In this code, the constructor of abstract class Base contains a call to virtual method 'Initialize'. In the 'Derived' class, which is derived from the 'Base' class, we override the 'Initialize' method and utilize the '_logger' field in this overridden method. The '_logger' field itself is initialized in the 'Derived' class's constructor.
However, when creating an instance of the 'Derived' class, the constructor of the less derived type in the inheritance sequence will be executed first ('Base' class in our case). But when calling to the Initialize method from 'Base' constructor, we'll be executing the 'Initialize' method of the object created at runtime, i.e. the 'Derived' class. Note that when executing the 'Initialize' method, the '_logger' field will not be initialized yet, so creating an instance of the 'Derived' class in our example will cause a 'NullReferenceException'.
Therefore, invoking overridable methods in a constructor may result in executing methods of an object whose initialization is not complete yet.
To fix the analyzer warning, either mark the method you are calling (or the class that contains it) as 'sealed' or remove the 'virtual' keyword from its definition.
If you do want the program to behave as described above when initializing an object and you want to hide the analyzer's warning, mark the message as a false positive. For details about warning-suppression methods, see the documentation.
You can look at examples of errors detected by the V3068 diagnostic. |
V3069. It's possible that the line was commented out improperly, thus altering the program's operation logics.
The analyzer detected a possible error that has to do with two 'if' statements following in series and separated by a commented-out line that is very likely to contain meaningful code. The programmer's inattention has resulted in a significant change in the program's execution logic.
Consider the following example:
if(!condition)
//condition = GetCondition();
if(condition)
{
...
}The program has become meaningless; the condition of the second 'if' statement never executes. The fixed version should look like this:
//if(!condition)
//condition = GetCondition();
if(condition)
{
...
}This diagnostic is classified as:
V3070. Uninitialized variables are used when initializing the 'A' variable.
The analyzer detected a possible error that has to do with initializing a class member to a value different from the one the programmer expected.
Consider the following example:
class AClass {
static int A = B + 1;
static int B = 10;
}In this code, the 'A' field will be initialized to the value '1', not '11', as the programmer may have expected. The reason is that the 'B' field will be referring to '0' when the 'A' field will be initialized. It has to do with the fact that all the members of a type (class or structure) are initialized to default values at first ('0' for numeric types, 'false' for the Boolean type, and 'null' for reference types). And only then will they be initialized to the values defined by the programmer. To solve this issue, we need to change the order in which the fields are processed:
class AClass {
static int B = 10;
static int A = B + 1;
}This way, the 'B' field will be referring to the value '10' when the 'A' field will be initialized, as intended.
This diagnostic is classified as:
You can look at examples of errors detected by the V3070 diagnostic. |
V3071. The object is returned from inside 'using' block. 'Dispose' will be invoked before exiting method.
The analyzer detected that a function returns an object that is being used in the 'using' statement.
Consider the following example:
public FileStream Foo(string path)
{
using (FileStream fs = File.Open(path, FileMode.Open))
{
return fs;
}
}Since the variable was initialized in the using block, method Dispose will be called for this variable before exiting the function. Therefore, it may not be safe to use the object that will be returned by the function.
The Dispose method will be called because the code above will be modified by the compiler into the following code:
public FileStream Foo(string path)
{
FileStream fs = File.Open(path, FileMode.Open)
try
{
return fs;
}
finally
{
if (fs != null)
((IDisposable)fs).Dispose();
}
}The fixed version may look something like this:
public FileStream Foo(string path)
{
return File.Open(path, FileMode.Open)
}V3072. The 'A' class containing IDisposable members does not itself implement IDisposable.
The analyzer detected that a class, which does not implement 'IDisposable' interface, contains fields or properties of a type that does implement 'IDisposable'. Such code indicates that a programmer probably forgot to release resources after using an object of their class.
Consider the following example:
class Logger
{
FileStream fs;
public Logger() {
fs = File.OpenWrite("....");
}
}In this code, the wrapper class, which allows writing the log to a file, does not implement 'IDisposable' interface. At the same time, it contains a variable of type 'FileStream', which enables writing to a file. In this case, the 'fs' variable will be holding the file until the Finalize method of the 'fs' object is called (it will happen when the object is being cleared by the garbage collector). As a result, we get an access error, behaving like a heisenbug and occurring, for example, when attempting to open the same file from a different stream.
This issue can be fixed in a number of ways. The most correct one is as follows:
class Logger : IDisposable
{
FileStream fs;
public Logger() {
fs = File.OpenWrite("....");
}
public void Dispose() {
fs.Dispose();
}
}However, the program logic does not always allow you implement 'IDisposable' in the 'Logger' class. The analyzer checks many scenarios and reduces the number of false positives. In our code above, for example, we can simply close 'FileStream', which writes to a file, from a separate function:
class Logger
{
FileStream fs;
public Logger() {
fs = File.OpenWrite("....");
}
public void Close() {
fs.Close();
}
}V3073. Not all IDisposable members are properly disposed. Call 'Dispose' when disposing 'A' class.
The analyzer detected a possible error in a class implementing the 'IDisposable' interface. The 'Dispose' method is not called in the 'Dispose' method of the class on some of the fields whose type implements the 'IDisposable' interface. It is very likely that the programmer forgot to free some resources after use.
Consider the following example:
class Logger : IDisposable
{
FileStream fs;
public Logger() {
fs = File.OpenWrite("....");
}
public void Dispose() { }
}This code uses a wrapper class, 'Logger', implementing the 'IDisposable' interface, which allows writing to a log file. This class, in its turn, contains variable 'fs', which is used to perform the writing. Since the programmer forgot to call method 'Dispose' or 'Close' in the 'Dispose' method of the 'Logger' class, the following error may occur.
Suppose an object of the 'Logger' class was created in the 'using' block:
using(Logger logger = new Logger()){
....
}As a result, method 'Dispose' will be called on the 'logger' object before leaving the 'using' block.
Such use implies that all the resources used by the object of class 'Logger' have been freed and you can use them again.
In our case, however, the 'fs' stream, writing to a file, won't be closed; and when trying to access this file again from another stream, for example, an access error may occur.
It is a heisenbug because the 'fs' object will free the opened file as this object is being cleared by the garbage collector. However, clearing of this object is a non-deterministic event; it's not guaranteed to take place after the 'logger' object leaves the 'using' block. A file access error occurs if the file is opened before the garbage collector has cleared the 'fs' object.
To solve this issue, we just need to call 'fs.Dispose()' in the 'Dispose' method of the 'Logger' class:
class Logger : IDisposable
{
FileStream fs;
public Logger() {
fs = File.OpenWrite("....");
}
public void Dispose() {
fs.Dispose();
}
}This solution guarantees that the file opened by the 'fs' object will be freed by the moment of leaving the 'using' block.
V3074. The 'A' class contains 'Dispose' method. Consider making it implement 'IDisposable' interface.
The analyzer detected a method named 'Dispose' in a class that does not implement the 'IDisposable' interface. The code may behave in two different ways in the case of this error.
Scenario one
The most common situation deals with mere non-compliance with the Microsoft coding conventions, which specify that method 'Dispose' is an implementation of the standard 'IDisposable' interface and is used for deterministic disposal of resources, including unmanaged resources.
Consider the following example:
class Logger
{
....
public void Dispose()
{
....
}
}By convention, method 'Dispose' is used for resource freeing, and its presence implies that the class itself implements the 'IDisposable' interface. There are two ways to solve this issue.
1) Add an implementation of the 'IDisposable' interface to the class declaration:
class Logger : IDisposable
{
....
public void Dispose()
{
....
}
}This solution allows using objects of class 'Logger' in the 'using' block, which guarantees to call the 'Dispose' method when leaving the block.
using(Logger logger = new Logger()){
....
}2) Choose a neutral name for your method, for example 'Close':
class Logger
{
....
public void Close()
{
....
}
}Scenario two
The second scenario when this warning is triggered implies a potential threat of incorrect method call when the class is cast to the 'IDisposable' interface.
Consider the following example:
class A : IDisposable
{
public void Dispose()
{
Console.WriteLine("Dispose A");
}
}
class B : A
{
public new void Dispose()
{
Console.WriteLine("Dispose B");
}
}If an object of class 'B' is cast to the 'IDisposable' interface or is used in the 'using' block, as, for example, in the following code:
using(B b = new B()){
....
}then the 'Dispose' method will be called from class 'A'. That is, the 'B' class' resources won't be released.
To ensure that the method is correctly called from class 'B', we need to additionally implement the 'IDisposable' interface in it: then the 'Dispose' method will be called exactly from the 'B' class when its object is cast to the 'IDisposable' interface or used it in the 'using' block.
Fixed code:
class B : A, IDisposable
{
public new void Dispose()
{
Console.WriteLine("Dispose B");
base.Dispose();
}
}V3075. The operation is executed 2 or more times in succession.
The analyzer detected a possible error that has to do with executing operation '!', '~', '-', or '+' two or more times in succession. This error may be caused by a typo. The resulting expression makes no sense and may lead to incorrect behavior.
Consider the following example:
if (!(( !filter )))
{
....
}This error most likely appeared during code refactoring. For example, a part of a complex logical expression was removed while the negation of the whole result wasn't. As a result, we've got an expression with an opposite meaning.
The fixed version of the code may look like this:
if ( filter )
{
....
}or this:
if ( !filter )
{
....
}You can look at examples of errors detected by the V3075 diagnostic. |
V3076. Comparison with 'double.NaN' is meaningless. Use 'double.IsNaN()' method instead.
The analyzer detected that a variable of type float or double is compared with a float.NaN or double.NaN value. As stated in the documentation, if two double.NaN values are tested for equality by using the == operator, the result is false. So, no matter what value of type double is compared with double.NaN, the result is always false.
Consider the following example:
void Func(double d) {
if (d == double.NaN) {
....
}
}It's incorrect to test the value for NaN using operators == and !=. Instead, method float.IsNaN() or double.IsNaN() should be used. The fixed version of the code:
void Func(double d) {
if (double.IsNaN(d)) {
....
}
}This diagnostic is classified as:
You can look at examples of errors detected by the V3076 diagnostic. |
V3077. Property setter / event accessor does not utilize its 'value' parameter.
The analyzer detected a possible error that deals with property and event accessors not using their 'value' parameter.
Consider the following example:
private bool _visible;
public bool IsVisible
{
get { return _visible; }
set { _visible = true; }
}When setting a new value for the "IsVisible" property, the programmer intended to save the result into the "_visible" variable but made a mistake. As a result, changing the property won't affect the object state in any way.
This is the fixed version:
public bool IsVisible
{
get { return _visible; }
set { _visible = value; }
}Code of the following pattern will also trigger the warning:
public bool Unsafe {
get { return (flags & Flags.Unsafe) != 0; }
set { flags |= Flags.Unsafe; }
}In this case, the 'set' method is used to change the flag state and there's no error. However, using a property like that may be misleading, as the assignments "myobj.Unsafe = true" and "myobj.Unsafe = false" will have the same result.
To reset the state of the internal variable, it is better to use a function rather than a property:
public bool Unsafe
{
get { return (flags & Flags.Unsafe) != 0; }
}
public void SetUnsafe()
{
flags |= Flags.Unsafe;
}If you can't do without the property, mark this line with special comment "//-V3077" to tell the analyzer not to output the warning on this property in future:
public bool Unsafe {
get { return (flags & Flags.Unsafe) != 0; }
set { flags |= Flags.Unsafe; } //-V3077
}For a complete overview of all false-positive suppression mechanisms, see the documentation.
You can look at examples of errors detected by the V3077 diagnostic. |
V3078. Sorting keys priority will be reversed relative to the order of 'OrderBy' method calls. Perhaps, 'ThenBy' should be used instead.
The analyzer has detected a potential error: 'OrderBy' or 'OrderByDescending' methods are called twice in a row. The result of such sorting may differ from the expected one.
Consider an example:
var seq = points.OrderBy(item => item.Primary)
.OrderBy(item => item.Secondary);Let's say a programmer wants to sort a collection in the following way: the elements must be grouped and sorted by 'Primary', and after that, each group must be sorted by 'Secondary' inside the resulting collection.
In fact, the collection's elements will be grouped and sorted by 'Secondary', and after that, each group will be sorted by 'Primary' inside the resulting collection.
To get the expected behavior, the second 'OrderBy' call should be replaced with the 'ThenBy' call.
var seq = points.OrderBy(item => item.Primary)
.ThenBy(item => item.Secondary);To get the intended behavior, it is also possible to use two 'OrderBy' calls. To do this, we need to swap the calls:
var seq = points.OrderBy(item => item.Secondary)
.OrderBy(item => item.Primary);A programmer can make a similar error when writing code with the help of query syntax:
var seq = from item in points
orderby item.Primary
orderby item.Secondary
select item;We can fix the code as follows:
var seq = from item in points
orderby item.Primary, item.Secondary
select item;You can look at examples of errors detected by the V3078 diagnostic. |
V3079. The 'ThreadStatic' attribute is applied to a non-static 'A' field and will be ignored.
The analyzer detected a suspicious declaration of a non-static field, to which the 'ThreadStatic' attribute is applied.
Using this attribute with a static field allows one to set an individual value for this field for each thread. Besides, it prohibits simultaneous access to this field by different threads, thus eliminating the possibility of mutual exclusion when addressing the field. However, this attribute is ignored when used with a non-static field.
Consider the following example:
[ThreadStatic]
bool m_knownThread;This field looks like a flag that must have individual values for each thread. But since the field is not static, applying the 'ThreadStatic' attribute to it does not make sense. If the program's logic does imply that the field must have a unique value for each thread (as suggested by its name and the presence of the 'ThreadStatic' attribute), there is probably an error in this code.
To fix the error, we need to add the 'static' modifier to the field declaration:
[ThreadStatic]
static bool m_knownThread;References:
You can look at examples of errors detected by the V3079 diagnostic. |
V3080. Possible null dereference.
The analyzer detected a code fragment that may cause a null-dereference issue.
Consider the following examples, which trigger the V3080 diagnostic message:
if (obj != null || obj.Func()) { ... }
if (obj == null && obj.Func()) { ... }
if (list == null && list[3].Func()) { ... }All the conditions contain a logical mistake that results in null dereference. This mistake appears as the result of bad code refactoring or a typo.
The following are the fixed versions of the samples above:
if (obj == null || obj.Func()) { .... }
if (obj != null && obj.Func()) { .... }
if (list != null && list[3].Func()) { .... }These are very simple situations, of course. In real-life code, an object may be tested for null and used in different lines. If you see the V3080 warning, examine the code above the line that triggered it and try to find out why the reference is null.
Here's an example where an object is checked and used in different lines:
if (player == null) {
....
var identity = CreateNewIdentity(player.DisplayName);
....
}The analyzer will warn you about the issue in the line inside the 'if' block. There is either an incorrect condition or some other variable should have been used instead of 'player'.
Sometimes programmers forget that when testing two objects for null, one of them may appear null and the other non-null. It will result in evaluating the entire condition, and null dereference. For example:
if ((text == null && newText == null) || text.Equals(newText)) {
....
}This condition can be rewritten in the following way:
if ((text == null && newText == null) ||
(text != null && newText != null && text.Equals(newText))) {
....
}Another way to make this mistake is to use the logical AND operator (&) instead of conditional AND (&&). One must remember that, firstly, both parts of the expression are always evaluated when using logical AND, and, secondly, the priority of logical AND is higher than that of conditional AND.
For example:
public static bool HasCookies {
get {
var context = HttpContext;
return context != null
&& context.Request != null & context.Request.Cookies != null
&& context.Response != null && context.Response.Cookies != null;
}
}In this code, 'context.Request.Cookies' will be referenced even if 'context.Request' is null.
Dereferencing a parameter that has a default value of 'null' is also dangerous. Here is an example:
public NamedBucket(string name, List<object> items = null)
{
_name = name;
foreach (var item in items)
{
....
}
}The constructor takes the 'items' collection as an optional parameter. However, if the value for 'items' is not passed while calling the constructor, 'NullReferenceException' will be thrown when trying to traverse the collection in 'foreach'.
The issue may be resolved differently depending on the situation. For example, we can traverse a collection only if it is not equal to 'null'.
This diagnostic is classified as:
You can look at examples of errors detected by the V3080 diagnostic. |
V3081. The 'X' counter is not used inside a nested loop. Consider inspecting usage of 'Y' counter.
The analyzer detected a possible error in two or more nested 'for' loops, when the counter of one of the loops is not used because of a typo.
Consider the following synthetic example of incorrect code:
for (int i = 0; i < N; i++)
for (int j = 0; j < M; j++)
sum += matrix[i, i];The programmer wanted to process all the elements of a matrix and find their sum but made a mistake and wrote variable 'i' instead of 'j' when indexing into the matrix.
Fixed version:
for (int i = 0; i < N; i++)
for (int j = 0; j < M; j++)
sum += matrix[i, j];Unlike diagnostics V3014, V3015, and V3016, this one deals with indexing errors only in loop bodies.
You can look at examples of errors detected by the V3081 diagnostic. |
V3082. The 'Thread' object is created but is not started. It is possible that a call to 'Start' method is missing.
The analyzer detected a suspicious code fragment where an object of type 'Thread' is created but the new thread is not started.
Consider the following example:
void Foo(ThreadStart action)
{
Thread thread = new Thread(action);
thread.Name = "My Thread";
}In this code, an object of type 'Thread' is created, and the reference to it is written into the 'thread' variable. However, the thread itself is not started or passed anywhere. Therefore, the created object, which will not have been used in any way, will simply be erased the next time garbage collection occurs.
To fix this error, we need to call the object's 'Start' method, which will start the thread. The fixed code should look something like this:
void Foo(ThreadStart action)
{
Thread thread = new Thread(action);
thread.Name = "My Thread";
thread.Start();
}This diagnostic is classified as:
V3083. Unsafe invocation of event, NullReferenceException is possible. Consider assigning event to a local variable before invoking it.
The analyzer detected a potentially unsafe call to an event handler that may result in 'NullReferenceException'.
Consider the following example:
public event EventHandler MyEvent;
void OnMyEvent(EventArgs e)
{
if (MyEvent != null)
MyEvent(this, e);
}In this code, the 'MyEvent' field is tested for 'null', and then the corresponding event is invoked. The null check helps to prevent an exception if there are no event subscribers at the moment when the event is invoked (in this case, 'MyEvent' will be null).
Suppose, however, there is one subscriber to the 'MyEvent' event. Then, at the moment between the null check and the call to the event handler by the 'MyEvent()' invocation, the subscriber may unsubscribe from the event - for example on a different thread:
MyEvent -= OnMyEventHandler;Now, if the 'OnMyEventHandler' handler was the only subscriber to 'MyEvent' event, the 'MyEvent' field will have a null value, but because in our hypothetical example the null check has already executed on another thread where the event is to be invoked, the line 'MyEvent()' will be executed. This situation will cause a 'NullReferenceException'.
Therefore, a null check alone is not enough to ensure safe event invocation. There are many ways to avoid the potential error described above. Let's see what these ways are.
The first solution is to create a temporary local variable to store a reference to event handlers of our event:
public event EventHandler MyEvent;
void OnMyEvent(EventArgs e)
{
EventHandler handler = MyEvent;
if (handler != null)
handler(this, e);
}This solution will allow calling event handlers without raising the exception. Even if the event subscriber gets unsubscribed at the point between testing 'handler' for null and invoking it, as in our first example, the 'handler' variable will still be storing the reference to the original handler, and this handler will be invoked correctly despite the fact that the 'MyEvent' event no longer contains this handler.
Another way to avoid the error is to assign an empty handler, with an anonymous method or lambda expression, to the event field at its initialization:
public event EventHandler MyEvent = (sender, args) => {};This solution guarantees that the 'MyEvent' field will never have a null value, as such anonymous method cannot be unsubscribed (unless it's stored in a separate variable, of course). It also enables us to do without a null check before invoking the event.
Finally, starting with C# version 6.0 (Visual Studio 2015), you can use the '?.' operator to ensure safe event invocation:
MyEvent?.Invoke(this, e);This diagnostic is classified as:
You can look at examples of errors detected by the V3083 diagnostic. |
V3084. Anonymous function is used to unsubscribe from event. No handlers will be unsubscribed, as a separate delegate instance is created for each anonymous function declaration.
The analyzer detected a possible error that has to do with using anonymous functions to unsubscribe from an event.
Consider the following example:
public event EventHandler MyEvent;
void Subscribe()
{
MyEvent += (sender, e) => HandleMyEvent(e);
}
void UnSubscribe()
{
MyEvent -= (sender, e) => HandleMyEvent(e);
}In this example, methods 'Subscribe' and 'UnSubscribe' are declared respectively for subscribing to and unsubscribing from the 'MyEvent' event. A lambda expression is used as an event handler. Subscription to the event will be successfully fulfilled in the 'Subscribe' method, and the handler (the anonymous function) will be added to the event.
However, the 'UnSubscribe' method will fail to unsubscribe the handler previously subscribed in the 'Subscribe' method. After executing this method, the 'MyEvent' event will still be containing the handler added in 'Subscribe'.
This behavior is explained by the fact that every declaration of an anonymous function results in creating a separate delegate instance – of type EventHandler in our case. So, what is subscribed in the 'Subscribe' method is 'delegate 1' while 'delegate 2' gets unsubscribed in the 'Unsubscribe' method, despite these two delegates having identical bodies. Since our event contains only 'delegate 1' by the time the handler is unsubscribed, unsubscribing from 'delegate 2' will not affect the value of 'MyEvent'.
To correctly subscribe to events using anonymous functions (when subsequent unsubscription is required), you can keep the lambda handler in a separate variable, using it both to subscribe to and unsubscribe from an event:
public event EventHandler MyEvent;
EventHandler _handler;
void Subscribe()
{
_handler = (sender, e) => HandleMyEvent(sender, e);
MyEvent += _handler;
}
void UnSubscribe()
{
MyEvent -= _handler;
}V3085. The name of 'X' field/property in a nested type is ambiguous. The outer type contains static field/property with identical name.
The analyzer detected that a nested class contains a field or property with the same name as a static/constant field or property in the outer class.
Consider the following example:
class Outside
{
public static int index;
public class Inside
{
public int index; // <= Field with the same name
public void Foo()
{
index = 10;
}
}
}A construct like that may result in incorrect program behavior. The following scenario is the most dangerous. Suppose that there was no 'index' field in the 'Inside' class at first. It means that it was the static variable 'index' in the 'Outside' class that the 'Foo' function used to change. Now that we have added the 'index' field to the 'Inside' class and the name of the outer class is not specified explicitly, the 'Foo' function will be changing the 'index' field in the nested class. The code, naturally, will start working differently from what the programmer expected, although it won't trigger any compiler warnings.
The error can be fixed by renaming the variable:
class Outside
{
public static int index;
public class Inside
{
public int insideIndex;
public void Foo()
{
index = 10;
}
}
}You can look at examples of errors detected by the V3085 diagnostic. |
V3086. Variables are initialized through the call to the same function. It's probably an error or un-optimized code.
The analyzer detected a possible error that deals with two different variables being initialized by the same expression. Not all of such expressions are treated as unsafe but only those where function calls are used (or too long expressions).
Here is the simplest case:
x = X();
y = X();Three scenarios are possible:
- The code contains an error, which should be fixed by replacing 'X()' with 'Y()'.
- The code is correct but works slowly. If the 'X()' function is required to perform multiple calculations, a better way is to write 'y = x;'.
- The code is correct and works with proper speed, or the 'X()' function reads the value from a file. To suppress the false positive in this case, use the comment "//-V3086".
Now consider the following example from real code:
string frameworkPath =
Path.Combine(tmpRootDirectory, frameworkPathPattern);
string manifestFile =
Path.Combine(frameworkPath, "sdkManifest.xml");
string frameworkPath2 =
Path.Combine(tmpRootDirectory, frameworkPathPattern2);
string manifestFile2 =
Path.Combine(frameworkPath, "sdkManifest.xml");There is a copy-paste error in this code, which is not easy to notice at first. Actually, it deals with mistakenly passing the first part of the path to the 'Path.Combine' function when receiving the 'manifestFile2' string. The code logic suggests that variable 'frameworkPath2' should be used instead of the originally used 'frameworkPath' variable.
The fixed code should look like this:
string manifestFile2 =
Path.Combine(frameworkPath2, "sdkManifest.xml");V3087. Type of variable enumerated in 'foreach' is not guaranteed to be castable to the type of collection's elements.
The analyzer detected a possible error in a 'foreach' loop. It is very likely that an InvalidCastException will be raised when iterating through the 'IEnumarable<T>' collection.
Consider the following example:
List<object> numbers = new List<object>();
....
numbers.Add(1.0);
....
foreach (int a in numbers)
Console.WriteLine(a);In this code, the 'numbers' collection's template is initialized to type 'object', which allows adding objects of any type to it.
It is defined in the loop iterating through this collection that the iterated collection members must be of type 'int'. If an object of another type is found in the collection, it will be cast to the required type, which operation may result in 'InvalidCastException'. In our example, the exception occurs because the value of type 'double', boxed in a collection element of type 'object', cannot be unboxed to type 'int'.
To fix this error, we can cast the collection-template type and the element type in the 'foreach' loop to a single type:
Solution 1:
List<object> numbers = new List<object>();
....
foreach (object a in numbers)Solution 2:
List<int> numbers = new List<int>();
....
foreach (int a in numbers)This error can often be observed when working with a collection of base-interface elements while the programmer specifies in the loop the type of one of the interfaces or classes implementing this base interface:
void Foo1(List<ITrigger> triggers){
....
foreach (IOperableTrigger trigger in triggers)
....
}
void Foo2(List<ITrigger> triggers){
....
foreach (IMutableTrigger trigger in triggers)
....
}To iterate through the objects of only one particular type in a collection, you can filter them in advance using the 'OfType' function:
void Foo1(List<ITrigger> triggers){
....
foreach (IOperableTrigger trigger in
triggers.OfType<IOperableTrigger>())
....
}
void Foo2(List<ITrigger> triggers){
....
foreach (IMutableTrigger trigger in
triggers.OfType<IMutableTrigger>())
....
}This solution guarantees that the 'foreach' loop will iterate only through objects of proper type, making 'InvalidCastException' impossible.
You can look at examples of errors detected by the V3087 diagnostic. |
V3088. The expression was enclosed by parentheses twice: ((expression)). One pair of parentheses is unnecessary or misprint is present.
The analyzer detected an expression enclosed in double parentheses. It is very likely that one of the parentheses is misplaced.
Note that the analyzer does not simply look for code fragments with double parentheses; it looks for those cases when placing one of them differently can change the meaning of the whole expression. Consider the following example:
if((!isLowLevel|| isTopLevel))This code looks suspicious: there is no apparent reason for using additional parentheses here. Perhaps the expression was actually meant to look like this:
if(!(isLowLevel||isTopLevel))Even if the code is correct, it is better to remove the extra pair of parentheses. There are two reasons:
- Those programmers who will be reading the code may be confused by the double parentheses and doubt its correctness.
- Removing the extra parentheses will make the analyzer stop reporting the false positive.
You can look at examples of errors detected by the V3088 diagnostic. |
V3089. Initializer of a field marked by [ThreadStatic] attribute will be called once on the first accessing thread. The field will have default value on different threads.
The analyzer detected a suspicious code fragment where a field marked with the '[ThreadStatic]' attribute is initialized at declaration or in a static constructor.
If the field is initialized at declaration, it will be initialized to this value only in the first accessing thread. In every next thread, the field will be set to the default value.
A similar situation is observed when initializing the field in a static constructor: the constructor executes only once, and the field will be initialized only in the thread where the static constructor executes.
Consider the following example, which deals with field initialization at declaration:
class SomeClass
{
[ThreadStatic]
public static Int32 field = 42;
}
class EntryPoint
{
static void Main(string[] args)
{
new Task(() => { var a = SomeClass.field; }).Start(); // a == 42
new Task(() => { var a = SomeClass.field; }).Start(); // a == 0
new Task(() => { var a = SomeClass.field; }).Start(); // a == 0
}
}When the first thread accesses the 'field' field, the latter will be initialized to the value specified by the programmer. That is, the 'a' variable, as well as the 'field' field, will be set to the value '42'.
From that moment on, as new threads start and access the field, it will be initialized to the default value ('0' in this case), so the 'a' variable will be set to '0' in all the subsequent threads.
As mentioned earlier, initializing the field in a static constructor does not solve the problem, as the constructor will be called only once (when initializing the type), so the problem remains.
It can be dealt with by wrapping the field in a property with additional field initialization logic. It helps solve the problem, but only partially: when the field is accessed instead of the property (for example inside a class), there is still a risk of getting an incorrect value.
class SomeClass
{
[ThreadStatic]
private static Int32 field = 42;
public static Int32 Prop
{
get
{
if (field == default(Int32))
field = 42;
return field;
}
set
{
field = value;
}
}
}
class EntryPoint
{
static void Main(string[] args)
{
new Task(() => { var a = SomeClass.Prop; }).Start(); // a == 42
new Task(() => { var a = SomeClass.Prop; }).Start(); // a == 42
new Task(() => { var a = SomeClass.Prop; }).Start(); // a == 42
}
}This diagnostic is classified as:
You can look at examples of errors detected by the V3089 diagnostic. |
V3090. Unsafe locking on an object.
The analyzer detected a code fragment with unsafe locking on an object.
This diagnostic is triggered in the following situations:
- locking on 'this';
- locking on instances of classes 'Type', 'MemberInfo', 'ParameterInfo', 'String', 'Thread';
- locking on a public member of the current class;
- locking on an object that resulted from boxing;
- locking on newly created objects.
The first three scenarios may cause a deadlock, while the last two ones caus thread synchronization to fail. The common problem of the first three scenarios is that the object being locked on is public: it can be locked on elsewhere and the programmer will never know about that after locking on it for the first time. As a result, a deadlock may occur.
Locking on 'this' is unsafe when the class is not private: an object can be locked on in any part of the program after creating its instance.
For the same reason, it is unsafe to lock on public class members.
To avoid these issues, you just need to lock on, for example, a private class field instead.
Here is an example of unsafe code where the 'lock' statement is used to lock on 'this':
class A
{
void Foo()
{
lock(this)
{
// do smt
}
}
}To avoid possible deadlocks, we should lock on, for example, a private field instead:
class A
{
private Object locker = new Object();
void Foo()
{
lock(locker)
{
// do smt
}
}
}Locking on instances of classes 'Type', 'MemberInfo', and 'ParameterInfo' is a bit more dangerous, as a deadlock is more likely to occur. Using the 'typeof' operator or methods 'GetType', 'GetMember', etc. on different instances of one type will produce the same result: getting the same instance of the class.
Objects of types 'String' and 'Thread' need to be discussed separately.
Objects of these types can be accessed from anywhere in the program, even from a different application domain, which makes a deadlock even more likely. To avoid this issue, do not lock on instances of these types.
Let's see how a deadlock occurs. Suppose we have an application (Sample.exe) with the following code:
static void Main(string[] args)
{
var thread = new Thread(() => Process());
thread.Start();
thread.Join();
}
static void Process()
{
String locker = "my locker";
lock (locker)
{
....
}
}There is also another application with the following code:
String locker = "my locker";
lock (locker)
{
AppDomain domain = AppDomain.CreateDomain("test");
domain.ExecuteAssembly(@"C:\Sample.exe");
}Executing this code will result in a deadlock, as it uses an instance of the 'String' type as a locking object.
We create a new domain within the same process and attempt to execute an assembly from another file (Sample.exe) in that domain, which results in both 'lock' statements locking on the same string literal. String literals get interned, so we will get two references to the same object. As a result, both 'lock' statements lock on the same object, causing a deadlock.
This error could occur within one domain as well.
A similar problem is observed when working with the 'Thread' type, an instance of which can be easily created by using the 'Thread.CurrentThread' property, for example.
To avoid this issue, do not lock on objects of types 'Thread' and 'String'.
Locking on an object of a value type prevents threads from being synchronized. Note that the 'lock' statement does not allow setting a lock on objects of value types, but it cannot protect the 'Monitor' class with its methods 'Enter' and 'TryEnter' from being locked on.
The methods 'Enter' and 'TryEnter' expect an object of type 'Object' as an argument, so if an object of a value type is passed, it will be 'boxed', which means that a new object will be created and locked on every time; therefore, the lock will be set (and released) on these new objects. As a result, thread synchronization will fail.
Consider the following example:
sealed class A
{
private Int32 m_locker = 10;
void Foo()
{
Monitor.Enter(m_locker);
// Do smt...
Monitor.Exit(m_locker);
}
}The programmer wanted to set a lock on the private field 'm_locker', but it will be actually set (and released) on the newly created objects resulting from 'boxing' of the original object.
To fix this error, we just need to change the type of the 'm_locker' field to a valid reference type, for example, 'Object'. In that case, the fixed code would look like this:
sealed class A
{
private Object m_locker = new Object();
void Foo()
{
Monitor.Enter(m_locker);
// Do smt...
Monitor.Exit(m_locker);
}
}A similar error will appear when the 'lock' construction is used, if there will be packing of an object in the result of casting:
Int32 val = 10;
lock ((Object)val)
{ .... }In this code there will be locking on objects, obtained in the result of boxing. There will be no thread synchronization, because new objects will be created after the boxing.
Locking on the newly created objects will be erroneous. An example of such code may be as follows:
lock (new Object())
{ .... }or as this:
lock (obj = new Object())
{ .... }Locking will be also done on different objects, because new objects are created every time the code is executed. Therefore, the threads will not be synchronized.
This diagnostic is classified as:
You can look at examples of errors detected by the V3090 diagnostic. |
V3091. Empirical analysis. It is possible that a typo is present inside the string literal. The 'foo' word is suspicious.
When the analyzer detects two identical string literals, it tries to figure out if they result from misuse of Copy-Paste. Be warned that this diagnostic is based on an empirical algorithm and may sometimes generate strange false positives.
Consider the following example:
string left_str = "Direction: left.";
string right_str = "Direction: right.";
string up_str = "Direction: up.";
string down_str = "Direction: up.";This code was written using the Copy-Paste technique. At the end, the programmer forgot to change the string literal from "up" to "down". The analyzer treats this code as incorrect and points out the suspicious word "up" in the last line.
Fixed code:
string left_str = "Direction: left.";
string right_str = "Direction: right.";
string up_str = "Direction: up.";
string down_str = "Direction: down.";You can look at examples of errors detected by the V3091 diagnostic. |
V3092. Range intersections are possible within conditional expressions.
The analyzer has detected a potential error in a condition. The program must perform different actions depending on which range of values a certain variable meets.
For this purpose, the following construct is used in the code:
if ( MIN_A < X && X < MAX_A ) {
....
} else if ( MIN_B < X && X < MAX_B ) {
....
}The analyzer generates the warning when the ranges checked in conditions overlap. For example:
if ( 0 <= X && X < 10)
FooA();
else if ( 10 <= X && X < 20)
FooB();
else if ( 20 <= X && X < 300)
FooC();
else if ( 30 <= X && X < 40)
FooD();The code contains a typo. The programmer's fingers faltered at some moment and he wrote "20 <= X && X < 300" instead of "20 <= X && X < 30" by mistake. If the X variable stores, for example, the value 35, it will be the function FooC() that will be called instead of FooD().
The fixed code:
if ( 0 <= X && X < 10)
FooA();
else if ( 10 <= X && X < 20)
FooB();
else if ( 20 <= X && X < 30)
FooC();
else if ( 30 <= X && X < 40)
FooD();This diagnostic is classified as:
You can look at examples of errors detected by the V3092 diagnostic. |
V3093. The operator evaluates both operands. Perhaps a short-circuit operator should be used instead.
The analyzer detected a possible error that has to do with the programmer confusing operator '&' with '&&' or '|' with '||' when using them to form a logical expression.
Conditional operators AND ('&&') / OR ('||') evaluate the second operand only when necessary (see Short circuit) while operators '&' and '|' always evaluate both operands. It is very likely that the code author did not intend it to work that way.
Consider the following example:
if ((i < a.m_length) & (a[i] % 2 == 0))
{
sum += a[i];
}Suppose the 'a' object is a container; the number of elements in it is stored in the 'm_length' member. We need to find the sum of even elements, making sure that we do not go beyond the array boundaries.
Because of a typo, our example uses operator '&' instead of '&&'. It will result in an array-index-out-of-bounds error when evaluating the '(a[i] % 2 == 0)' subexpression if index 'i' appears to be greater than or equal to 'a.m_length'. Regardless of whether the left part of the expression is true or false, the right part will be evaluated anyway.
Fixed code:
if ((i < a. m_length) && (a[i] % 2 == 0))
{
sum += a[i];
}Here is another example of incorrect code:
if (x > 0 | BoolFunc())
{
....
}The call to the 'BoolFunc()' function will execute all the time, even when the '(x > 0)' condition is true.
Fixed code:
if (x > 0 || BoolFunc())
{
....
}Code fragments detected by diagnostic V3093 do not always contain errors, but they do deal with expressions that are non-optimal from the viewpoint of performance (especially when they use calls to complex functions).
If, however, the conditional expression is correct and written as you intended, you can mark this fragment with special comment "//-V3093" so that the analyzer does not output the warning:
if (x > 0 | BoolFunc()) //-V3093
{
....
}To learn more about false-positive-suppression techniques, see the documentation.
This diagnostic is classified as:
You can look at examples of errors detected by the V3093 diagnostic. |
V3094. Possible exception when deserializing type. The Ctor(SerializationInfo, StreamingContext) constructor is missing.
The analyzer detected a suspicious class implementing the 'ISerializable' interface but lacking a serialization constructor.
A serialization constructor is used for object deserialization and receives 2 parameters of types 'SerializationInfo' and 'StreamingContext'. When inheriting from this interface, the programmer is obliged to implement method 'GetObjectData' but is not obliged to implement a serialization constructor. However, if this constructor is missing, a 'SerializationException' will be raised.
Consider the following example. Suppose we have declared a method to handle object serialization and deserialization:
static void Foo(MemoryStream ms, BinaryFormatter bf, C1 obj)
{
bf.Serialize(ms, obj);
ms.Position = 0;
obj = (C1)bf.Deserialize(ms);
}The 'C1' class itself is declared as follows:
[Serializable]
sealed class C1 : ISerializable
{
public C1()
{ }
public void GetObjectData(SerializationInfo info,
StreamingContext context)
{
info.AddValue("field", field, typeof(String));
}
private String field;
}When attempting to deserialize the object, a 'SerializationException' will be thrown. To ensure correct deserialization of an object of type 'C1', a special constructor is required. A correct class declaration should then look like this:
[Serializable]
sealed class C1 : ISerializable
{
public C1()
{ }
private C1(SerializationInfo info, StreamingContext context)
{
field = (String)info.GetValue("field", typeof(String));
}
public void GetObjectData(SerializationInfo info,
StreamingContext context)
{
info.AddValue("field", field, typeof(String));
}
private String field;
}Note. This diagnostic has an additional parameter, which can be configured in the configuration file (*.pvsconfig). It has the following syntax:
//+V3094:CONF:{ IncludeBaseTypes: true }With this parameter on, the analyzer examines not only how the 'ISerializable' interface is implemented by the class itself, but also how it is implemented by any of the base classes. This option is off by default.
To learn more about configuration files, see this page.
V3095. The object was used before it was verified against null. Check lines: N1, N2.
The analyzer has detected a potential error that may cause access by a null reference.
The analyzer has noticed the following situation in the code: an object is being used first and only then it is checked whether this is a null reference. It means one of the following things:
1) An error occurs if the object is equal to null.
2) The program works correctly, since the object is never equal to null. The check is not necessary in this case.
Let's consider the first case. There is an error.
obj = Foo();
result = obj.Func();
if (obj == null) return -1;If the 'obj' object is equal to null, the 'obj.Func()' expression will cause an error. The analyzer will generate a warning for this code mentioning 2 lines: the first line is the place where the object is used; the second line is the place where the object is compared to null.
This is the correct code:
obj = Foo();
if (obj == null) return -1;
result = obj.Func();Let's consider the second case. There is no error.
Stream stream = CreateStream();
while (stream.CanRead)
{
....
}
if (stream != null)
stream.Close();This code is always correct. Stream object is never equal to null. But the analyzer does not understand this situation and generates a warning. To make it disappear, you should remove the check "if (stream != null)". It has no sense and can only confuse a programmer while reading this code.
This is the correct code:
Stream stream = CreateStream();
while (stream.CanRead)
{
....
}
stream.Close();When the analyzer is wrong, you may use (apart from changing the code) a comment to suppress warnings. For example: "obj.Foo(); //-V3095".
This diagnostic is classified as:
You can look at examples of errors detected by the V3095 diagnostic. |
V3096. Possible exception when serializing type. [Serializable] attribute is missing.
The analyzer detected a type that implements the 'ISerializable' interface but is not marked with the [Serializable] attribute. Attempting to serialize instances of this type will cause raising a 'SerializationException'. Implementation of the 'ISerializable' interface is not enough for the CLR to know at runtime that the type is serializable; it must be additionally marked with the [Serializable] attribute.
Consider the following example. Suppose we have a method to perform object serialization and deserialization:
static void Foo(MemoryStream ms, BinaryFormatter bf, C1 obj)
{
bf.Serialize(ms, obj);
ms.Position = 0;
obj = (C1)bf.Deserialize(ms);
}The 'C1' class is declared in the following way:
sealed class C1 : ISerializable
{
public C1()
{ }
private C1(SerializationInfo info, StreamingContext context)
{
field = (String)info.GetValue("field", typeof(String));
}
public void GetObjectData(SerializationInfo info,
StreamingContext context)
{
info.AddValue("field", field, typeof(String));
}
private String field = "Some field";
}When trying to serialize an instance of this type, a 'SerializationException' will be raised. To solve the issue, we must decorate this class with the [Serializable] attribute. Therefore, a correct class declaration should look like this:
[Serializable]
sealed class C1 : ISerializable
{
public C1()
{ }
private C1(SerializationInfo info, StreamingContext context)
{
field = (String)info.GetValue("field", typeof(String));
}
public void GetObjectData(SerializationInfo info,
StreamingContext context)
{
info.AddValue("field", field, typeof(String));
}
private String field = "Some field";
}Note. This diagnostic has one additional parameter, which you can configure in the configuration file (*.pvsconfig). It has the following syntax:
//+V3096:CONF:{ IncludeBaseTypes: true }With this parameter on, the analyzer examines not only how the 'ISerializable' interface is implemented by the class itself, but also how it is implemented by any of the base classes. This option is off by default.
To learn more about configuration files, see this page.
V3097. Possible exception: type marked by [Serializable] contains non-serializable members not marked by [NonSerialized].
The analyzer detected a suspicious class marked with the [Serializable] attribute and containing members of non-serializable types (i.e. types that are themselves not marked with this attribute). At the same time, these members are not marked with the [NonSerialized] attribute. The presence of such members may lead to raising a 'SerializationException' for some standard classes when attempting to serialize an instance of such a class.
Consider the following example. Suppose we have declared a method to handle object serialization and deserialization:
static void Foo(MemoryStream ms, BinaryFormatter bf, C1 obj)
{
bf.Serialize(ms, obj);
ms.Position = 0;
obj = (C1)bf.Deserialize(ms);
}We have also declared classes 'C1' and 'NonSerializedClass':
sealed class NonSerializedClass { }
[Serializable]
class C1
{
private Int32 field1;
private NotSerializedClass field2;
}When attempting to serialize an instance of the 'C1' class, a 'SerializationException' will be thrown, as marking a class with the [Serializable] attribute implies that all of its fields are to be serialized while the type of the 'field2' field is not serializable, which will result in raising the exception. To resolve this issue, the 'field2' field must be decorated with the [NonSerialized] attribute. A correct declaration of the 'C1' class will then look like this:
[Serializable]
class C1
{
private Int32 field1;
[NonSerialized]
private NotSerializedClass field2;
}Properties are handled a bit differently. Consider the following example:
[Serializable]
class C2
{
private Int32 field1;
public NonSerializedClass Prop { get; set; }
}You cannot apply the [NonSerialized] attribute to properties. Nevertheless, the exception will be thrown anyway when attempting to serialize a class like the one in the code above using, for example, 'BinaryFormatter'. The reason is that the compiler expands auto-implemented properties into a field and corresponding "get" and possibly "set" accessors. What will be serialized in this case is not the property itself but the field generated by the compiler. This issue is similar to the one with field serialization discussed above.
The error can be fixed by explicitly implementing the property through some field. A correct version of the code will then look like this:
[Serializable]
class C2
{
private Int32 field1;
[NonSerialized]
private NonSerializedClass nsField;
public NonSerializedClass Prop
{
get { return nsField; }
set { nsField = value; }
}
}You can look at examples of errors detected by the V3097 diagnostic. |
V3098. The 'continue' operator will terminate 'do { ... } while (false)' loop because the condition is always false.
The analyzer detected a code fragment that may mislead programmers reading it. Not all developers know that using the "continue" statement in a "do { ... } while(false)" loop will terminate it instead of continuing its execution.
So, after executing the 'continue' statement, the '(false)' condition will be checked and the loop will terminate because the condition is false.
Consider the following example:
int i = 1;
do
{
Console.Write(i);
i++;
if (i < 3)
continue;
Console.Write('A');
} while (false);The programmer may expect the program to print '12A', but it will actually print '1'.
Even if the code was intended to work that way and there is no error, it is still recommended to revise it. For example, you can use the 'break' statement:
int i=1;
do {
Console.Write(i);
i++;
if(i < 3)
break;
Console.Write('A');
} while(false);The code has become clearer; one can immediately see that the loop will terminate if the "(i < 3)" condition is true. In addition, it won't trigger the analyzer warning anymore.
If the code is incorrect, it must be fixed. There are no set rules as to how exactly it should be rewritten since it depends on the code's execution logic. For example, if you need the program to print '12A', it is better to rewrite this fragment as follows:
for (i = 1; i < 3; ++i)
Console.Write(i);
Console.Write('A');This diagnostic is classified as:
V3099. Not all the members of type are serialized inside 'GetObjectData' method.
The analyzer detected a suspicious implementation of method 'GetObjectData', where some of the serializable type members are left unserialized. This error may result in incorrect object deserialization or raising a 'SerializationException'.
Consider the following example. Suppose we have declared a method to handle object serialization and deserialization.
static void Foo(BinaryFormatter bf, MemoryStream ms, Derived obj)
{
bf.Serialize(ms, obj);
ms.Position = 0;
obj = (Derived)bf.Deserialize(ms);
}Declaration of class 'Base':
abstract class Base
{
public Int32 Prop { get; set; }
}Declaration of class 'Derived':
[Serializable]
sealed class Derived : Base, ISerializable
{
public String StrProp { get; set; }
public Derived() { }
private Derived(SerializationInfo info,
StreamingContext context)
{
StrProp = info.GetString(nameof(StrProp));
}
public void GetObjectData(SerializationInfo info,
StreamingContext context)
{
info.AddValue(nameof(StrProp), StrProp);
}
}When declaring the 'Derived' class, the programmer forgot to serialize the 'Prop' property of the base class, which will result in incomplete saving of the object's state when it is serialized. When the object is deserialized, the 'Prop' property will be set to the default value, which is 0 in this case.
To ensure that the object's state is saved in full during serialization, we need to modify the code by specifying in the implementation of method 'GetObjectData' that the 'Prop' property's value should be stored in an object of type 'SerializationInfo', and in the serialization constructor that it should retrieve that value.
The fixed implementation of method 'GetObjectData' and 'Derived' class' serialization constructor should look like this:
private Derived(SerializationInfo info,
StreamingContext context)
{
StrProp = info.GetString(nameof(StrProp));
Prop = info.GetInt32(nameof(Prop));
}
public void GetObjectData(SerializationInfo info,
StreamingContext context)
{
info.AddValue(nameof(StrProp), StrProp);
info.AddValue(nameof(Prop), Prop);
}In the example that we've discussed above, the developer of the base class didn't cater for its serialization. If there is enabled and the type implements the 'ISerializable' interface, then for the correct serialization of the members of the base class we should call the method 'GetObjectData' of the base class from the derived one:
public override void GetObjectData(SerializationInfo info,
StreamingContext context)
{
base.GetObjectData(info, context);
....
}Additional information:
This diagnostic is classified as:
V3100. NullReferenceException is possible. Unhandled exceptions in destructor lead to termination of runtime.
The analyzer detected a block of code that may lead to raising a NullReferenceException in a class destructor (finalizer) when executed.
The body of a class destructor is a critical spot of the program. Starting with .NET version 2.0, throwing an unhandled exception in the destructor body will cause it to crash. An exception that has left the destructor cannot be handled afterwards.
What follows from this explanation is that when addressing objects inside a destructor, you should test them for null in advance to avoid a crash.
Consider the following example:
class A
{
public List<int> numbers { get; set; }
~A()
{
if (numbers.Count > 0) {
....
}
}
}Since the 'numbers' collection was not initialized at declaration time, the 'numbers' field is not guaranteed to contain the reference to the object of class 'A' when this object is finalized. Therefore, we should additionally test the collection for null or wrap the call to the field into a try/catch block.
A correct version of the code above should look like this:
~A()
{
if (numbers != null)
{
if (numbers.Count > 0)
{
....
}
}
}Starting with C# version 6.0, you can use the '?.' operator to reduce the check to the following code:
~A()
{
if (numbers?.Count > 0) {
....
}
}This diagnostic is classified as:
V3101. Potential resurrection of 'this' object instance from destructor. Without re-registering for finalization, destructor will not be called a second time on resurrected object.
The analyzer detected a suspicious destructor that deals with potentially incorrect object "resurrection".
The object destructor is invoked by the .NET garbage collector immediately before reclaiming the object. Destructor declaration is not obligatory in .NET Framework languages, as the garbage collector will reclaim the object anyway, even without its destructor being declared explicitly. Destructors are usually used when one needs to release unmanaged resources used by .NET objects before freeing these objects. File-system handles are one example of such resources, which cannot be released automatically by the garbage collector.
However, immediately before an object is reclaimed, the user can (intentionally or unintentionally) "resurrect" it before the garbage collector reclaims its memory. As you remember, the garbage collector frees objects that have become inaccessible, i.e. there are no references to these objects left. However, if you assign a reference to such an object from its destructor to a global static variable, for example, then the object will become visible to other parts of the program again, i.e. will be "resurrected". This operation may be executed multiple times.
The following example shows how such "resurrection" occurs:
class HeavyObject
{
private HeavyObject()
{
HeavyObject.Bag.Add(this);
}
...
public static ConcurrentBag<HeavyObject> Bag;
~HeavyObject()
{
if (HeavyObject.Bag != null)
HeavyObject.Bag.Add(this);
}
}Suppose we have object "HeavyObject", creation of which is a highly resource-intensive operation. Besides, this object cannot be used from different parts of the program simultaneously. Suppose also that we can create just a few instances of such objects at once. In our example, the "HeavyObject" type has open static field "Bag", which is a collection that will be used to store all the created instances of "HeavyObject" objects (they are be added to the collection in the constructor). This will allow getting an instance of type "HeavyObject" from anywhere in the program:
HeavyObject heavy;
HeavyObject.Bag.TryTake(out heavy);Method "TryTake" will also delete the "heavy" instance from the "Bag" collection. That is, we can use only a limited number of instances of type "HeavyObject" (its constructor is closed) created in advance. Now, suppose we do not need the "heavy" instance created by the "TryTake" method anymore and all references to this object have been deleted. Then, some time later, the garbage collector will invoke the object's destructor, where this object will be again added to the "Bag" collection, i.e. "resurrected" and made available to the user, without having to re-create it.
However, our example contains an error that will make the code work differently from what is described above. This error deals with an assumption that the "resurrected" object's destructor will be invoked each time the object becomes invisible to the program (i.e. there are no references to it left). What will actually happen is that the destructor will be called only once, i.e. the object will be "lost" the next (a second) time the garbage collector attempts to reclaim it.
To ensure correct work of the destructor when the object is "resurrected", this object must be re-registered using method GC.ReRegisterForFinalize:
~HeavyObject()
{
if (HeavyObject.Bag != null)
{
GC.ReRegisterForFinalize(this);
HeavyObject.Bag.Add(this);
}
}This solution guarantees that the destructor will be called each time before the garbage collector tries to reclaim the object.
V3102. Suspicious access to element by a constant index inside a loop.
The analyzer detected a possible error that has to do with trying to access the elements of an array or list using the same constant index at each iteration of a 'for' loop.
Consider the following example:
ParameterInfo[] parameters = method.GetParameters();
for (int i = 0; i < parameters.Length; i++)
{
Type parameterType = parameters[0].ParameterType;
....
}In this code, the programmer wanted the value of the i-th element of the 'parameters' array to be assigned to variable 'parameterType' at each loop iteration, but because of a typo only the first element is accessed all the time. Another explanation is that the programmer probably used the element at index zero for debugging and then forgot to change the index value.
Fixed code:
ParameterInfo[] parameters = method.GetParameters();
for (int i = 0; i < parameters.Length; i++)
{
Type parameterType = parameters[i].ParameterType;
....
}Here is one more example, taken from a real application:
if (method != null && method.SequencePoints.Count > 0)
{
CodeCoverageSequence firstSequence = method.SequencePoints[0];
int line = firstSequence.Line;
int column = firstSequence.Column;
for (int i = 1; i < method.SequencePoints.Count; ++i)
{
CodeCoverageSequence sequencePoint = method.SequencePoints[0];
if (line > sequencePoint.Line)
{
line = sequencePoint.Line;
column = sequencePoint.Column;
}
}
// ....
}In this code, the programmer wrote a separate block of code to access the first element of the 'method.SequencePoints' list while the other elements are processed in a loop. However, the programmer copied the line accessing the first element into the loop body and changed only the variable name from 'firstSequence' to 'sequencePoint' but forgot about the index.
Fixed code:
if (method != null && method.SequencePoints.Count > 0)
{
CodeCoverageSequence firstSequence = method.SequencePoints[0];
int line = firstSequence.Line;
int column = firstSequence.Column;
for (int i = 1; i < method.SequencePoints.Count; ++i)
{
CodeCoverageSequence sequencePoint = method.SequencePoints[i];
if (line > sequencePoint.Line)
{
line = sequencePoint.Line;
column = sequencePoint.Column;
}
}
// ....
}You can look at examples of errors detected by the V3102 diagnostic. |
V3103. A private Ctor(SerializationInfo, StreamingContext) constructor in unsealed type will not be accessible when deserializing derived types.
The analyzer detected a serialization constructor with a strange access modifier.
The following cases are treated as suspicious:
- the constructor is declared with the 'public' access modifier;
- the constructor is declared with the 'private' access modifier, but the type is unsealed.
A serialization constructor is called when an object is deserialized, and must not be called outside the type (except when called by a derived class), so it should not be declared as 'public' or 'internal'.
If a constructor is declared with the 'private' access modifier but the class is not sealed, derived classes will not be able to call this constructor; therefore, deserialization of the members of the base class will be impossible.
Consider the following example:
[Serializable]
class C1 : ISerializable
{
....
private C1(SerializationInfo info, StreamingContext context)
{
....
}
....
}The 'C1' class is unsealed, but the serialization constructor is declared as 'private'. As a result, derived classes will not be able to call this constructor and, therefore, the object will not be deserialized correctly. To fix this error, the access modifier should be changed to 'protected':
[Serializable]
class C1 : ISerializable
{
....
protected C1(SerializationInfo info, StreamingContext context)
{
....
}
....
}Note. This diagnostic has an additional parameter, which can be configured in the configuration file (*.pvsconfig). It has the following syntax:
//+V3103:CONF:{ IncludeBaseTypes: true }With this parameter on, the analyzer examines not only how the 'ISerializable' interface is implemented by the class itself, but also how it is implemented by any of the base classes. This option is off by default.
To learn more about configuration files, see this page.
V3104. The 'GetObjectData' implementation in unsealed type is not virtual, incorrect serialization of derived type is possible.
The analyzer detected an unsealed class implementing the 'ISerializable' interface but lacking virtual method 'GetObjectData'. As a result, serialization errors are possible in derived classes.
Consider the following example. Suppose we have declared a base class and a class inheriting from it as follows:
[Serializable]
class Base : ISerializable
{
....
public void GetObjectData(SerializationInfo info,
StreamingContext context)
{
....
}
}
[Serializable]
sealed class Derived : Base
{
....
public new void GetObjectData(SerializationInfo info,
StreamingContext context)
{
....
}
}There is also the following code to manage object serialization:
void Foo(BinaryFormatter bf, MemoryStream ms)
{
Base obj = new Derived();
bf.Serialize(ms, obj);
ms.Position = 0;
Derived derObj = (Derived)bf.Deserialize(ms);
}The object will be serialized incorrectly because the 'GetObjectData' method will be called from the base class, not the derived one. Therefore, the members of the derived class will not be serialized. Attempting to retrieve the values of the members added by method 'GetObjectData' of the derived class when deserializing the 'SerializationInfo' object will cause raising an exception because there are no such values in the object.
To fix this error, the 'GetObjectData' method must be declared as 'virtual' in the base class, and as 'override' in the derived one. The fixed code will then look like this:
[Serializable]
class Base : ISerializable
{
....
public virtual void GetObjectData(SerializationInfo info,
StreamingContext context)
{
....
}
}
[Serializable]
sealed class Derived : Base
{
....
public override void GetObjectData(SerializationInfo info,
StreamingContext context)
{
....
}
}If the class contains only an explicit implementation of the interface, an implicit implementation of virtual method 'GetObjectData' is also required. Consider the following example. Suppose we have declared the classes as follows:
[Serializable]
class Base : ISerializable
{
....
void ISerializable.GetObjectData(SerializationInfo info,
StreamingContext context)
{
....
}
}
[Serializable]
sealed class Derived : Base, ISerializable
{
....
public void GetObjectData(SerializationInfo info,
StreamingContext context)
{
....
}
}You cannot call to the 'GetObjectData' method of the base class from the derived class. Therefore, some of the members will not be serialized. To fix the error, virtual method 'GetObjectData' must be implicitly implemented in addition to the explicit interface implementation. The fixed code will then look like this:
[Serializable]
class Base : ISerializable
{
....
void ISerializable.GetObjectData(SerializationInfo info,
StreamingContext context)
{
GetObjectData(info, context);
}
public virtual void GetObjectData(SerializationInfo info,
StreamingContext context)
{
....
}
}
[Serializable]
sealed class Derived : Base
{
....
public override void GetObjectData(SerializationInfo info,
StreamingContext context)
{
....
base.GetObjectData(info, context);
}
}If the class is not expected to have any descendants, declare it as 'sealed'.
V3105. The 'a' variable was used after it was assigned through null-conditional operator. NullReferenceException is possible.
This diagnostic rule warns you that a 'NullReferenceException' may be thrown during program execution. The analyzer issues this warning when the variable field is accessed without checking whether the variable is 'null'. The key point is that the value of the variable is calculated with an expression that uses the null-conditional operator.
Let's look at the example:
public int Foo (Person person)
{
string parentName = person?.Parent.ToString();
return parentName.Length;
}In the code above, when initializing the 'parentName' object, we assume that 'person' can be 'null'. In this case, the 'ToString()' function is not executed and 'null' is written to the 'parentName' variable. A 'NullReferenceException' is thrown when trying to read the 'Length' property of the 'ParentName' variable.
You can fix the code as follows:
public int Foo (Person person)
{
string parentName = person?.Parent.ToString();
return parentName?.Length ?? 0;
}Now, if the 'parentName' variable is not 'null', we return the string length. Otherwise, we return 0.
An error can occur if a value obtained using null-conditional is passed to a method, constructor, or assigned to a property without checking.
Let's look at the example:
void UsersProcessing(Users users)
{
IEnumerable<User> usersList = users?.GetUsersCollection();
LogUserNames(usersList);
}
void LogUserNames(IEnumerable<User> usersList)
{
foreach (var user in usersList)
{
....
}
}The 'usersList' variable is passed as an argument to the 'LogUserNames' method. The variable can be "null" since the null-conditional operator is used to get the value. The passed collection is traversed within 'LogUserNames'. To do this, 'foreach' is used, and the collection will have the 'GetEnumerator' method called. If 'userList' is set to 'null', an exception of the 'NullReferenceException' type is thrown.
Fixed code may look as follows:
void UsersProcessing(Users users)
{
IEnumerable<User> usersList = users?.GetUsersCollection();
LogUserNames(usersList ?? Enumerable.Empty<User>());
}
void LogUserNames(IEnumerable<User> usersList)
{
foreach (var user in usersList)
{
....
}
}The result of executing 'users?.GetUsersCollection()' is assigned to the 'usersList' variable. If the variable returns 'null', an empty collection will be passed to the 'LogUserNames' method. This will help avoid 'NullReferenceException' when traversing 'usersList' in 'foreach'.
This diagnostic is classified as:
You can look at examples of errors detected by the V3105 diagnostic. |
V3106. Possibly index is out of bound.
When indexing into a variable of type 'array', 'list', or 'string', an 'IndexOutOfRangeException' exception may be thrown if the index value is outbound the valid range. The analyzer can detect some of such errors.
For example, it may happen when iterating through an array in a loop:
int[] buff = new int[25];
for (int i = 0; i <= 25; i++)
buff[i] = 10;Keep in mind that the first item's index is 0 and the last item's index is the array size minus one. Fixed code:
int[] buff = new int[25];
for (int i = 0; i < 25; i++)
buff[i] = 10;Errors like that are found not only in loops but in conditions with incorrect index checks as well:
void ProcessOperandTypes(ushort opCodeValue, byte operandType)
{
var OneByteOperandTypes = new byte[0xff];
if (opCodeValue < 0x100)
{
OneByteOperandTypes[opCodeValue] = operandType;
}
...
}Fixed version:
void ProcessOperandTypes(ushort opCodeValue, byte operandType)
{
var OneByteOperandTypes = new byte[0xff];
if (opCodeValue < 0xff)
{
OneByteOperandTypes[value] = operandType;
}
...
}Programmers also make mistakes of this type when accessing a particular item of an array or list.
void Initialize(List<string> config)
{
...
if (config.Count == 16)
{
var result = new Dictionary<string, string>();
result.Add("Base State", config[0]);
...
result.Add("Sorted Descending Header Style", config[16]);
}
...
}In this example, the programmer made a mistake in the number of entries in the 'config' list. The fixed version should look like this:
void Initialize(List<string> config)
{
...
if (config.Count == 17)
{
var result = new Dictionary<string, string>();
result.Add("Base State", config[0]);
...
result.Add("Sorted Descending Header Style", config[16]);
}
...
}This diagnostic is classified as:
You can look at examples of errors detected by the V3106 diagnostic. |
V3107. Identical expression to the left and to the right of compound assignment.
The analyzer detected identical subexpressions to the left and to the right of a compound assignment operator. This operation may be incorrect or meaningless, or can be simplified.
Consider the following example:
x += x + 5;Perhaps the programmer simply wanted to add the value 5 to the 'x' variable. In that case, the fixed code would look like this:
x = x + 5;Or perhaps they wanted to add the value 5 but wrote an extra 'x' variable by mistake. Then the code should look like this:
x += 5;However, it is also possible that the code is written correctly, but it looks too complicated and should be simplified:
x = x * 2 + 5;Now consider the following example:
x += x;This operation is equivalent to multiplying the value of a variable by two. This is what a clearer version would look like:
x *= 2;Here is one more expression:
y += top - y;We are trying to add the difference of the variables 'top' and 'y' to the 'y' variable. Resolving this expression produces the following result:
y = y + top – y;It can be simplified, as the 'y' variable is subtracted from itself, which does not make sense:
y = top;You can look at examples of errors detected by the V3107 diagnostic. |
V3108. It is not recommended to return null or throw exceptions from 'ToString()' method.
The analyzer detected that an overridden 'ToString()' method returns 'null' or throws an exception.
Consider the following example:
public override string ToString()
{
return null;
}It is very likely that this method will be called to get a string representation of an instance at runtime or during debugging. Since the programmer is not likely to test the function’s return result for 'null', using it may lead to throwing 'NullReferenceException'. If you need to return an empty or unknown value of an instance’s string representation, return an empty string:
public override string ToString()
{
return string.Empty;
}Another example of poor implementations of the 'ToString()' method is when it throws exceptions:
public override string ToString()
{
if(hasError)
throw new Exception();
....
}It is very likely that this method will be called by the user of the class at a point where exceptions are not expected to be thrown and handled, for example in a destructor.
If you want the method to issue an error message when generating an object’s string representation, return its text as a string or log the error in some way:
public override string ToString()
{
if(hasError)
{
LogError();
return "Error encountered";
}
....
}This diagnostic is classified as:
You can look at examples of errors detected by the V3108 diagnostic. |
V3109. The same sub-expression is present on both sides of the operator. The expression is incorrect or it can be simplified.
The analyzer detected identical subexpressions in the left and the right part of an expression with a comparison operator. This operation is incorrect or meaningless, or can be simplified.
Consider the following example:
if ((x – y) >= (x - z)) {};The 'x' variable in this fragment is obviously not necessary and can be removed from both parts of the expression. This is what the simplified version of the code would look like:
if (y <= z) {};The next example:
if (x1 == x1 + 1) {};This code contains a true error, as the expression will be false at any value of the 'x1' variable. Perhaps the programmer made a typo, and the code was actually meant to look like this:
if (x2 == x1 + 1) {};One more example:
if (x < x * y) {};This expression can also be simplified by removing the 'x' variable:
if (y > 1) {};V3110. Possible infinite recursion.
The analyzer detected a possible infinite recursion. It will most likely result in a stack overflow and raising a "StackOverflow" exception.
Consider the following example. Suppose we have property 'MyProperty' and field '_myProperty' related to that property. A typo could result in the following error:
private string _myProperty;
public string MyProperty
{
get { return MyProperty; } // <=
set { _myProperty = value; }
}When specifying the value to be returned in the property accessor method, the 'MyProperty' property is accessed instead of the '_myProperty' field, which leads to an infinite recursion when getting the property value. This is what the fixed code should look like:
private string _myProperty;
public string MyProperty
{
get { return _myProperty; }
set { _myProperty = value; }
}Another example:
class Node
{
Node parent;
public void Foo()
{
// some code
parent.Foo(); // <=
}
}It seems that the programmer intended to iterate through all the 'parent' fields but did not provide for a recursion termination condition. This issue is trickier than the previous one, as it may result not only in a stack overflow but a null dereference error as well when reaching the topmost parent entity. This is what the fixed code could look like:
class Node
{
Node parent;
public void Foo()
{
// some code
if (parent != null)
parent.Foo();
}
}A third example. Suppose there is a method with the 'try - catch - finally' construct.
void Foo()
{
try
{
// some code;
return;
}
finally
{
Foo(); // <=
}
}It seems that the programmer did not take into account that the 'finally' block would be executed both when throwing an exception inside the 'try' block and when leaving the method through the 'return' statement. The 'finally' block, therefore, will always recursively call to the 'Foo' method. To make the recursion work properly, a condition should be specified before the method call:
void Foo()
{
try
{
// some code;
return;
}
finally
{
if (condition)
Foo();
}
}This diagnostic is classified as:
You can look at examples of errors detected by the V3110 diagnostic. |
V3111. Checking value for null will always return false when generic type is instantiated with a value type.
The analyzer detected a comparison of a generic-type value with 'null'. If the generic type used has no constraints, it can be instantiated both with value and reference types. In the case of a value type, the check will always return 'false' because value types cannot have a value of null.
Consider the following example:
class Node<T>
{
T value;
void LazyInit(T newValue)
{
if (value == null) // <=
{
value = newValue;
}
}
}If 'T' is defined as a value type, the body of the 'if' statement will never execute and the 'value' variable will fail to be initialized to the value passed, so its value will always remain the 'default' value of 'T'.
Use constraints if you need to handle objects of reference types only. For example, you can use a constraint on the generic type 'T' in the code above so that it could be instantiated only with reference types:
class Node<T> where T : class // <=
{
T value;
void LazyInit(T newValue)
{
if (value == null)
{
value = newValue;
}
}
}If you want the generic type to work with both value and reference types and you want the check to work with values of both, test the value for the type's default value instead of 'null':
class Node<T>
{
T value;
void LazyInit(T newValue)
{
if (object.Equals(value, default(T))) // <=
{
value = newValue;
}
}
}In this case, the check will work properly with both reference and value types. However, if you want to apply it only to reference types with a null value (without constraints on the 'T' type), do the following:
class Node<T>
{
T value;
void LazyInit(T newValue)
{
if (typeof(T).IsClass && // <=
object.Equals(value, default(T)))
{
value = newValue;
}
}
}The 'IsClass' method will return 'true' if the generic type was instantiated with a reference type, so only reference-type values will be tested for the type's default value, like in the previous example.
V3112. An abnormality within similar comparisons. It is possible that a typo is present inside the expression.
The analyzer found suspicious condition that may contain an error.
The diagnosis is empirical, that is why it is easier to demonstrate it on the example than to explain the working principle of the analyzer.
Consider this example:
if (m_a != a ||
m_b != b ||
m_b != c) // <=
{
....
}Because of the similarity of the variable names, there is a typo in the code. An error is located on the third line. The variable 'c' should be compared with 'm_c' rather than with 'm_b'. It is difficult to notice the error even when reading this text. Please, pay attention to the variable names.
The right variant:
if (m_a != a ||
m_b != b ||
m_c != c) // <=
{
....
}If the analyzer issued the warning V3112, then carefully read the corresponding code. Sometimes it is difficult to notice a typo.
This diagnostic is classified as:
You can look at examples of errors detected by the V3112 diagnostic. |
V3113. Consider inspecting the loop expression. It is possible that different variables are used inside initializer and iterator.
The analyzer detected a 'for' operator whose iterator section contains an increment or decrement operation with a variable that is not the counter of that loop.
Consider the following expression:
for (int i = 0; i != N; ++N)This code is very likely to be incorrect: the 'i' variable should be used instead of 'N' in the increment operation '++N':
for (int i = 0; i != N; ++i)Another example:
for (int i = N; i >= 0; --N)This code is also incorrect. The 'i' variable should be decremented instead of 'N':
for (int i = N; i >= 0; --i)This diagnostic is classified as:
V3114. IDisposable object is not disposed before method returns.
To understand what kind of issues this diagnostic detects, we should recall some theory.
The garbage collector automatically releases the memory allocated to a managed object when that object is no longer used and there are no strong references to it left. However, it is not possible to predict when garbage collection will occur (unless you run it manually). Furthermore, the garbage collector has no knowledge of unmanaged resources such as window handles, or open files and streams. Such resources are usually released using the 'Dispose' method.
The analyzer relies on that information and issues a warning when detecting a local variable whose object implements the 'IDisposable' interface and is not passed outside that local variable's scope. After the object is used, its 'Dispose' method is not called to release the unmanaged resources held by it.
If that object contains a handle (for example a file), it will remain in the memory until the next garbage-collection session, which will occur in an indeterminate amount of time up to the point of program termination. As a result, the file may stay locked for indefinite time, affecting normal operation of other programs or the operating system.
Consider the following example:
string Foo()
{
var stream = new StreamReader(@"C:\temp.txt");
return stream.ReadToEnd();
}In this case, the 'StreamReader' object will be storing the handle of an open file even after control leaves the 'Foo' method, keeping that file locked to other programs and the operating system until the garbage collector cleans it up.
To avoid this problem, make sure you have your resources released in time by using the 'Dispose' method, as shown below:
string Foo()
{
var stream = new StreamReader(@"C:\temp.txt");
var result = stream.ReadToEnd();
stream.Dispose();
return result;
}For more certainty, however, we recommend that you use a 'using' statement to ensure that the resources held by an object will be released after use:
string Foo()
{
using (var stream = new StreamReader(@"C:\temp.txt"))
{
return stream.ReadToEnd();
}
}The compiler will expand the 'using' block into a 'try-finally' statement and insert a call to the 'Dispose' method into the 'finally' block to guarantee that the object will be collected even in case of exceptions.
This diagnostic is classified as:
You can look at examples of errors detected by the V3114 diagnostic. |
V3115. It is not recommended to throw exceptions from 'Equals(object obj)' method.
The analyzer detected that overridden method 'Equals(object obj)' might throw an exception.
Consider the following example:
public override bool Equals(object obj)
{
return obj.GetType() == this.GetType();
}If the 'obj' argument is null, a 'NullReferenceException' will be thrown. The programmer must have forgotten about this scenario when implementing the method. Use a null check to make this code work properly:
public override bool Equals(object obj)
{
if (obj == null)
return false;
return obj.GetType() == this.GetType();
}Another poor practice when implementing the 'Equals(object obj)' method is to explicitly throw an exception from it. For example:
public override bool Equals(object obj)
{
if (obj == null)
throw new InvalidOperationException("Invalid argument.");
return obj == this;
}This method is very likely to be called in such a block of code where exception throwing and handling are not expected.
If one of the objects does not meet the conditions, return 'false':
public override bool Equals(object obj)
{
if (obj == null)
return false;
return obj == this;
}This diagnostic is classified as:
You can look at examples of errors detected by the V3115 diagnostic. |
V3116. Consider inspecting the 'for' operator. It's possible that the loop will be executed incorrectly or won't be executed at all.
The analyzer detected a 'for' statement with incorrect bounds of the iterator.
Consider the following example:
for (int i = 0; i < 100; --i)This code is obviously incorrect: the value of the 'i' variable will always be less than 100, at least until it overflows. This behavior is hardly what the programmer expected. To fix this error, we need either to replace the decrement operation '--i' with increment operation '++i':
for (int i = 0; i < 100; ++i)or to specify the appropriate bounds for the 'i' variable using the relational operator '>' or '!= ':
for (int i = 99; i >= 0; --i)
for (int i = 99; i != -1; --i)Which solution is the right one is up to the author of the code to decide depending on the particular situation.
This diagnostic is classified as:
You can look at examples of errors detected by the V3116 diagnostic. |
V3117. Constructor parameter is not used.
The analyzer detected a constructor with an unused parameter.
For example:
public class MyClass
{
protected string _logPath;
public String LogPath { get { return _logPath; } }
public MyClass(String logPath) // <=
{
_logPath = LogPath;
}
}It seems that the programmer made a typo and wrote 'LogPath' instead of 'logPath', which resulted in not using the constructor's parameter anywhere in the code. The fixed version:
public class MyClass
{
protected string _logPath;
public String LogPath { get { return _logPath; } }
public MyClass(String logPath) // <=
{
_logPath = logPath;
}
}Consider one more example.
public class MyClass
{
public MyClass(String logPath) // <=
{
//_logPath = logPath;
}
}If you deliberately avoid using a constructor's parameter, we recommend that you mark the constructor with the 'Obsolete' attribute.
public class MyClass
{
[Obsolete]
public MyClass(String logPath) // <=
{
//_logPath = logPath;
}
}You can look at examples of errors detected by the V3117 diagnostic. |
V3118. A component of TimeSpan is used, which does not represent full time interval. Possibly 'Total*' value was intended instead.
The analyzer detected an expression accessing the property 'Milliseconds', 'Seconds', 'Minutes', or 'Hours' of an object of type 'TimeSpan', which represents a time interval between several dates or other time intervals.
This expression is incorrect if you expect it to return the total number of time units in the interval represented by the object, as the property you are accessing will return only part of that interval.
Consider the following example:
var t1 = DateTime.Now;
await SomeOperation(); // 2 minutes 10 seconds
var t2 = DateTime.Now;
Console.WriteLine("Execute time: {0}sec", (t2 - t1).Seconds);
// Result - "Execute time: 10sec"We write the date and time before executing an operation to the 't1' variable, and the date and time after executing the operation to the 't2' variable. Suppose that it takes exactly 2 minutes 10 seconds for the 'SomeOperation' method to execute. Then we want to output the difference between the two variables in seconds, i.e. the time interval of operation execution. In our example, it is 130 seconds, but the 'Seconds' property will return only 10 seconds. The fixed code should look like this:
var t1 = DateTime.Now;
await SomeOperation(); // 2 minutes 10 seconds
var t2 = DateTime.Now;
Console.WriteLine("Execute time: {0}sec", (t2 - t1).TotalSeconds);
// Result - "Execute time: 130sec"We need to use the 'TotalSeconds' property to get the total number of seconds in the time interval.
You can look at examples of errors detected by the V3118 diagnostic. |
V3119. Calling a virtual (overridden) event may lead to unpredictable behavior. Consider implementing event accessors explicitly or use 'sealed' keyword.
The analyzer detected usage of a virtual or overridden event. If this event is overridden in a derived class, it may lead to unpredictable behavior. MSDN does not recommend using overridden virtual events: "Do not declare virtual events in a base class and override them in a derived class. The C# compiler does not handle these correctly and it is unpredictable whether a subscriber to the derived event will actually be subscribing to the base class event". https://docs.microsoft.com/en-us/dotnet/csharp/programming-guide/events/how-to-raise-base-class-events-in-derived-classes.
Consider the following example:
class Base
{
public virtual event Action MyEvent;
public void FooBase() { MyEvent?.Invoke(); }
}
class Child: Base
{
public override event Action MyEvent;
public void FooChild() { MyEvent?.Invoke(); }
}
static void Main()
{
var child = new Child();
child.MyEvent += () => Console.WriteLine("Handler");
child.FooChild();
child.FooBase();
}Even though both methods 'FooChild()' and 'FooBase()' are called, the 'Main()' method will print only one line:
HandlerIf we used a debugger or test output, we could see that the 'MyEvent' variable's value was 'null' when calling to 'child.FooBase()'. It means that the subscriber to the 'MyEvent' event in the 'Child' class, which is derived from 'Base' and overrides this event, did not subscribe to the 'MyEvent' event in the base class. This behavior seems to contradict the behavior of virtual methods, for example, but it can be explained by the specifics of event implementation in C#. When declaring an event, the compiler automatically creates two accessor methods to handle it, 'add' and 'remove', and also a delegate field where delegates are added to\removed from when subscribing to\unsubscribing from events. For a virtual event, the base and derived classes will have individual (not virtual) fields associated with this event.
This issue can be avoided by declaring event accessors explicitly:
class Base
{
public virtual Action _myEvent { get; set; }
public virtual event Action MyEvent
{
add
{
_myEvent += value;
}
remove
{
_myEvent -= value;
}
}
public void FooBase() { _myEvent?.Invoke(); }
}We strongly recommend that you do not use virtual or overridden events in the way shown by the first example. If you still have to use overridden events (for example, when deriving from an abstract class), use them carefully, allowing for the possible undefined behavior. Declare accessors 'add' and 'remove' explicitly, or use the 'sealed' keyword when declaring a class or event.
You can look at examples of errors detected by the V3119 diagnostic. |
V3120. Potentially infinite loop. The variable from the loop exit condition does not change its value between iterations.
The analyzer detected a potentially infinite loop with its exit condition depending on a variable whose value never changes between iterations.
Consider the following example:
int x = 0;
while (x < 10)
{
Do(x);
}The loop's exit condition depends on variable 'x' whose value will always be zero, so the 'x < 10' check will always evaluate to "true", causing an infinite loop. A correct version of this code could look like this:
int x = 0;
while (x < 10)
{
x = Do(x);
}Here is another example where the loop exit condition depends on a variable whose value, in its turn, changes depending on other variables that never change inside the loop. Suppose we have the following method:
int Foo(int a)
{
int j = 0;
while (true)
{
if (a >= 32)
{
return j * a;
}
if (j == 10)
{
j = 0;
}
j++;
}
}The loop's exit condition depends on the 'a' parameter. If 'a' does not pass the 'a >= 32' check, the loop will become infinite, as the value of 'a' does not change between iterations. This is one of the ways to fix this code:
int Foo(int a)
{
int j = 0;
while (true)
{
if (a >= 32)
{
return j * a;
}
if (j == 10)
{
j = 0;
a++; // <=
}
j++;
}
}In the fixed version, the local variable 'j' controls how the 'a' parameter's value changes.
This diagnostic is classified as:
V3121. An enumeration was declared with 'Flags' attribute, but does not set any initializers to override default values.
The analyzer detected an enumeration declared with the 'Flags' (System.FlagsAttribute) attribute but lacking initializers for overriding the default values of the enumeration constants.
Consider the following example:
[Flags]
enum DeclarationModifiers
{
Static,
New,
Const,
Volatile
}When declared with the 'Flags' attribute, an enumeration behaves not just as a set of named, mutually exclusive constants, but as a bit field, i.e. a set of flags whose values are normally defined as powers of 2, and the enumeration is handled by combining the elements with a bitwise OR operation:
DeclarationModifiers result = DeclarationModifiers.New |
DeclarationModifiers.Const;If no initializers were set for the values of such an enumeration (default values are used instead), the values might overlap when combined. The example above is very likely to be incorrect and can be fixed in the following way:
[Flags]
enum DeclarationModifiers
{
Static = 1,
New = 2,
Const = 4,
Volatile = 8
}Now the enumeration meets all the requirements for a bit field.
However, programmers sometimes leave the default values of the elements in such an enumeration on purpose, but then they should allow for every possible combination of values. For example:
[Flags]
enum Colors
{
None, // = 0 by default
Red, // = 1 by default
Green, // = 2 by default
Red_Green // = 3 by default
}In this example, the programmer allowed for the overlapping values: a combination of 'Colors.Red' and 'Colors.Green' yields the value 'Colors.Red_Green', as expected. There is no error in this code, but it is only the code author who can establish this fact.
The following example shows the difference between the output of two enumerations marked with the 'Flags' attribute, one with and the other without value initialization:
[Flags]
enum DeclarationModifiers
{
Static, // = 0 by default
New, // = 1 by default
Const, // = 2 by default
Volatile // = 3 by default
}
[Flags]
enum DeclarationModifiers_Good
{
Static = 1,
New = 2,
Const = 4,
Volatile = 8
}
static void Main(....)
{
Console.WriteLine(DeclarationModifiers.New |
DeclarationModifiers.Const);
Console.WriteLine(DeclarationModifiers_Good.New |
DeclarationModifiers_Good.Const);
}The corresponding outputs:
Volatile
New, ConstSince the 'DeclarationModifiers' enumeration uses default values, combining the constants 'DeclarationModifiers.New' and 'DeclarationModifiers.Const' results in the value 3, overlapping the constant 'DeclarationModifiers.Volatile', which the programmer might not expect. For the 'DeclarationModifiers_Good' enumeration, on the contrary, a combination of the flags DeclarationModifiers_Good.New ' and 'DeclarationModifiers_Good.Const' results in a correct value, which is a combination of both, as planned.
You can look at examples of errors detected by the V3121 diagnostic. |
V3122. Uppercase (lowercase) string is compared with a different lowercase (uppercase) string.
The analyzer detected a comparison of two strings whose characters are in different cases.
Consider the following example:
void Some(string s)
{
if (s.ToUpper() == "abcde")
{
....
}
}After casting the 's' variable's value to upper case, the resulting string is compared with a string where all the characters are lowercase. As this comparison is always false, this code is incorrect and can be fixed in the following way:
void Some(string s)
{
if (s.ToLower() == "abcde")
{
....
}
}Consider another example:
void Some()
{
string s = "abcde";
....
if (s.Contains("AbCdE"))
{
....
}
}While all the characters of the 's' variable's value are lowercase, an attempt is made to check if the string contains a mixed-case substring. Obviously, the 'Contains' method will always return 'false', which also indicates an error.
This diagnostic is classified as:
You can look at examples of errors detected by the V3122 diagnostic. |
V3123. Perhaps the '??' operator works in a different way than it was expected. Its priority is lower than priority of other operators in its left part.
The analyzer detected a code fragment that is very likely to contain a logic error. The code uses an expression with the operator '??' or '?:' that may be evaluated differently from what the programmer intended.
The '??' and '?:' operators have lower precedence than the operators ||, &&, |, ^, &, !=, ==, +, -, %, /, *. Programmers sometimes forget about this and write faulty code like in the following example:
public bool Equals(Edit<TNode> other)
{
return _kind == other._kind
&& (_node == null) ? other._node == null :
node.Equals(other._node);
}Since the '&&' operator's precedence is higher than that of '?:', the '_kind == other._kind && (_node == null)' expression will be evaluated in the first place. To avoid errors like that, make sure to enclose the whole expression with the '?:' operator in parentheses:
public bool Equals(Edit<TNode> other)
{
return _kind == other._kind
&& ((_node == null) ? other._node == null :
node.Equals(other._node));
}The next example of incorrect code uses the '??' operator:
public override int GetHashCode()
{
return ValueTypes.Aggregate(...)
^ IndexMap?.Aggregate(...) ?? 0;
}The '^' operator's precedence is higher than that of '??', so if 'IndexMap' is found to be null, the left operand of the '??' operator will also have the value of "null", which means that the function will always return 0 regardless of the contents of the 'ValueTypes' collection.
Like in the case with the '?:' operator, it is recommended that you enclose expressions with the '??' operator in parentheses:
public override int GetHashCode()
{
return ValueTypes.Aggregate(...)
^ (IndexMap?.Aggregate(...) ?? 0);
}From now on, the 'GetHashCode()' function will return different values depending on the contents of the 'ValueTypes' collection even when 'IndexMap' is equal to 'null'.
This diagnostic is classified as:
You can look at examples of errors detected by the V3123 diagnostic. |
V3124. Appending an element and checking for key uniqueness is performed on two different variables.
The analyzer detected a suspicious code fragment where a key is tested for being present in one dictionary, while the new element is appended to another. This situation may indicate a typo or a logic error.
Consider the following example:
Dictionary<string, string> dict = new Dictionary<string, string>();
Dictionary<string, string> _dict = new Dictionary<string, string>();
....
void Add(string key, string val)
{
if (!dict.ContainsKey(key))
_dict.Add(key, val);
}There may be two programming mistakes at once here. The first mistake has to do with appending an element to a wrong dictionary, which may distort the program's logic. The second deals with checking if the 'key' key is present in the 'dict' dictionary instead of '_dict'. If '_dict' already contains a value associated with the 'key' key, an 'ArgumentException' will be thrown when executing the '_dict.Add(key, val)' statement. There are two ways to fix this construct (both imply that the key is tested for the same dictionary the new element is appended to):
Dictionary<string, string> dict = new Dictionary<string, string>();
Dictionary<string, string> _dict = new Dictionary<string, string>();
....
void Add1(string key, string val)
{
if (!_dict.ContainsKey(key))
_dict.Add(key, val);
}
...
void Add2(string key, string val)
{
if (!dict.ContainsKey(key))
dict.Add(key, val);
}V3125. The object was used after it was verified against null. Check lines: N1, N2.
The analyzer detected a possible error that may lead to a null dereference.
The following situation was detected. An object is tested for 'null' first and then used without such a check. It implies one of the two scenarios:
1) An exception will be thrown if the object turns out to be null.
2) The program runs correctly all the time, as the object is never null, and the check is therefore unnecessary.
The first scenario is illustrated by the following example, where an exception is likely to be thrown.
obj = Foo();
if (obj != null)
obj.Func1();
obj.Func2();If the 'obj' object turns out to be null, evaluating the 'obj.Func2()' expression will result in an exception. The analyzer displays a warning on this code, mentioning 2 lines. The first line is where the object is used; the second is where it is tested for 'null'.
Fixed code:
obj = Foo();
if (obj != null) {
obj.Func1();
obj.Func2();
}The second scenario is illustrated by the following example. The list is iterated in a safe way, so the check can be omitted:
List<string> list = CreateNotEmptyList();
if (list == null || list.Count == 0) { .... }
foreach (string item in list) { .... }This code works properly all the time. The 'list' list is never empty. However, the analyzer failed to figure this out and produced a warning. To remove the warning, delete the "if (list == null || list.Count == 0)" check: this operation is meaningless and may confuse the programmer who will be maintaining the code.
Fixed code:
List<string> list = CreateNotEmptyList();
foreach (string item in list) { .... }Another case where analyzer generates warning is when the null check and the variable's use are situated in the different branches of if\else or switch sections. For example:
if (lines.Count == 1)
{
if (obj != null)
obj.Func1();
}
else
{
lines.Clear();
obj.Func2();
}In this case, despite the fact that both branches will not be executed simultaneously - only one branch will be selected for the execution, the null check in one of them indirectly indicates a possibility of a variable receiving null value in other branch as well. Therefore, if control flows to that branch, exception will be generated.
Corrected variant:
if (lines.Count == 1)
{
if (obj != null)
obj.Func1();
}
else
{
lines.Clear();
if (obj != null)
obj.Func2();
}Instead of changing the code, you can add a special comment to suppress false warnings. For the example above, you would have to use the following comment: "obj.Foo(); //-V3125".
This diagnostic is classified as:
You can look at examples of errors detected by the V3125 diagnostic. |
V3126. Type implementing IEquatable<T> interface does not override 'GetHashCode' method.
The analyzer detected a user type that implements the 'IEquatable<T>' interface but does not override the 'GetHashCode' method.
This issue can cause incorrect output when using such a type with, for example, methods from 'System.Linq.Enumerable', such as 'Distinct', 'Except', 'Intersect', or 'Union'.
The following example uses method 'Distinct':
class Test : IEquatable<Test>
{
private string _data;
public Test(string data)
{
_data = data;
}
public override string ToString()
{
return _data;
}
public bool Equals(Test other)
{
return _data.Equals(other._data);
}
}
static void Main()
{
var list = new List<Test>();
list.Add(new Test("ab"));
list.Add(new Test("ab"));
list.Add(new Test("a"));
list.Distinct().ToList().ForEach(item => Console.WriteLine(item));
}Executing this program will result in the following output:
ab
ab
aEven though the 'Test' type implements the 'IEquatable<Test>' interface (method 'Equals' is declared), it is not enough. When executed, the program fails to output the expected result, and the collection contains duplicate elements. To eliminate this defect, you need to override the 'GetHashCode' method in the declaration of the 'Test' type:
class Test : IEquatable<Test>
{
private string _data;
public Test(string data)
{
_data = data;
}
public override string ToString()
{
return _data;
}
public bool Equals(Test other)
{
return _data.Equals(other._data);
}
public override int GetHashCode()
{
return _data.GetHashCode();
}
}
static void Main()
{
var list = new List<Test>();
list.Add(new Test("ab"));
list.Add(new Test("ab"));
list.Add(new Test("a"));
list.Distinct().ToList().ForEach(item => Console.WriteLine(item));
}This time, the program will output the following:
ab
aThis result is correct: the collection contains unique elements only.
V3127. Two similar code fragments were found. Perhaps, this is a typo and 'X' variable should be used instead of 'Y'.
The analyzer detected a code fragment probably containing a typo. It is very likely that this code was written by using the Copy-Paste technique.
The V3127 diagnostic looks for two adjacent code blocks similar in structure and different in one variable, which is used several times in the first block but only once in the second. This discrepancy suggests that the programmer forgot to change that variable to the proper one. The diagnostic is designed to detect situations where a code block is copied to make another block and the programmer forgets to change the names of some of the variables in the resulting block.
Consider the following example:
if (x > 0)
{
Do1(x);
Do2(x);
}
if (y > 0)
{
Do1(y);
Do2(x); // <=
}In the second block, the programmer must have intended to use variable 'y', not 'x':
if (x > 0)
{
Do1(x);
Do2(x);
}
if (y > 0)
{
Do1(y);
Do2(y);
}The following example is more complex.
....
if(erendlinen>239) erendlinen=239;
if(srendlinen>erendlinen) srendlinen=erendlinen;
if(erendlinep>239) erendlinep=239;
if(srendlinep>erendlinen) srendlinep=erendlinep; // <=
....The defect in this example is not that easy to see. The variables have similar names, which makes it much more difficult to diagnose the error. In the second block, variable 'erendlinep' should be used instead of 'erendlinen'.
This is what the fixed code should look like:
....
if(erendlinen>239) erendlinen=239;
if(srendlinen>erendlinen) srendlinen=erendlinen;
if(erendlinep>239) erendlinep=239;
if(srendlinep>erendlinep) srendlinep=erendlinep; // <=
....Obviously, 'erendlinen' and 'erendlinep' are poorly chosen variable names. An error like that is almost impossible to catch when carrying out code review. Even with the analyzer pointing at it directly, it is still not easy to notice. Therefore, take your time and make sure to examine the code closely when encountering a V3127 warning.
This diagnostic is classified as:
You can look at examples of errors detected by the V3127 diagnostic. |
V3128. The field (property) is used before it is initialized in constructor.
The analyzer detected a field (property) which is used before it is initialized in the class constructor.
Consider the following example:
class Test
{
List<int> mylist;
Test()
{
int count = mylist.Count; // <=
....
mylist = new List<int>();
}
}In the constructor of the 'Test' class, property 'Count' of the list 'mylist' is accessed, while the list itself is initialized later. Executing this code fragment would lead to a null reference exception. To avoid it, the list must be initialized first, for example, at declaration:
class Test
{
List<int> mylist = new List<int>();
Test()
{
int count = mylist.Count;
....
}
}Here is another example:
class Test2
{
int myint;
Test2(int param)
{
Foo(myint); // <=
....
myint = param;
}
}In this code, field 'myint', whose default value is 0, is passed to the 'Foo' method. This could be done on purpose, and then there is no error. However, executing code like that can cause unexpected behavior in certain cases. A better solution is to explicitly initialize the 'myint' field, even to a default value of 0:
class Test2
{
int myint = 0;
Test2(int param)
{
Foo(myint);
....
myint = param;
}
}Now both the analyzer and other programmers can see that the code author took care of the 'myint' field and initialized it.
This diagnostic is classified as:
You can look at examples of errors detected by the V3128 diagnostic. |
V3129. The value of the captured variable will be overwritten on the next iteration of the loop in each instance of anonymous function that captures it.
The analyzer detected a potential error related to anonymous function closure of a variable which is used as a loop iterator. At the compile time, the captured variable will be wrapped in a container class, and from this point on only one instance of this class will be passed to all anonymous functions for each iteration of a loop. Most likely, the programmer will expect different values of an iterator inside every anonymous function instead of the last value, which is an unobvious behavior and may cause an error.
Let's take a closer look at this situation using the following example:
void Foo()
{
var actions = new List<Action>();
for (int i = 0; i < 10; i++)
{
actions.Add(() => Console.Write(i)); // <=
}
// SOME ACTION
actions.ForEach(x => x());
}It is popularly believed that after executing the 'Foo' method, the numbers from 0 to 9 will be displayed on a console, because logically after the 'i' variable is enclosed in anonymous function, after compiling an anonymous container class will be created, and a value of the 'i' variable will be copied into one of its fields. But actually, the number 10 will be printed on console 10 times. This is caused by the fact that an anonymous container class will be created immediately after the 'i' variable declaration and not before the anonymous function declaration. As a result, all instances of the anonymous function on each loop enclose not the current value of the iterator, but a reference to the anonymous container class, which contains the last value of the iterator. It is also important to note that during the compilation, the 'i' variable declaration will be placed before the loop.
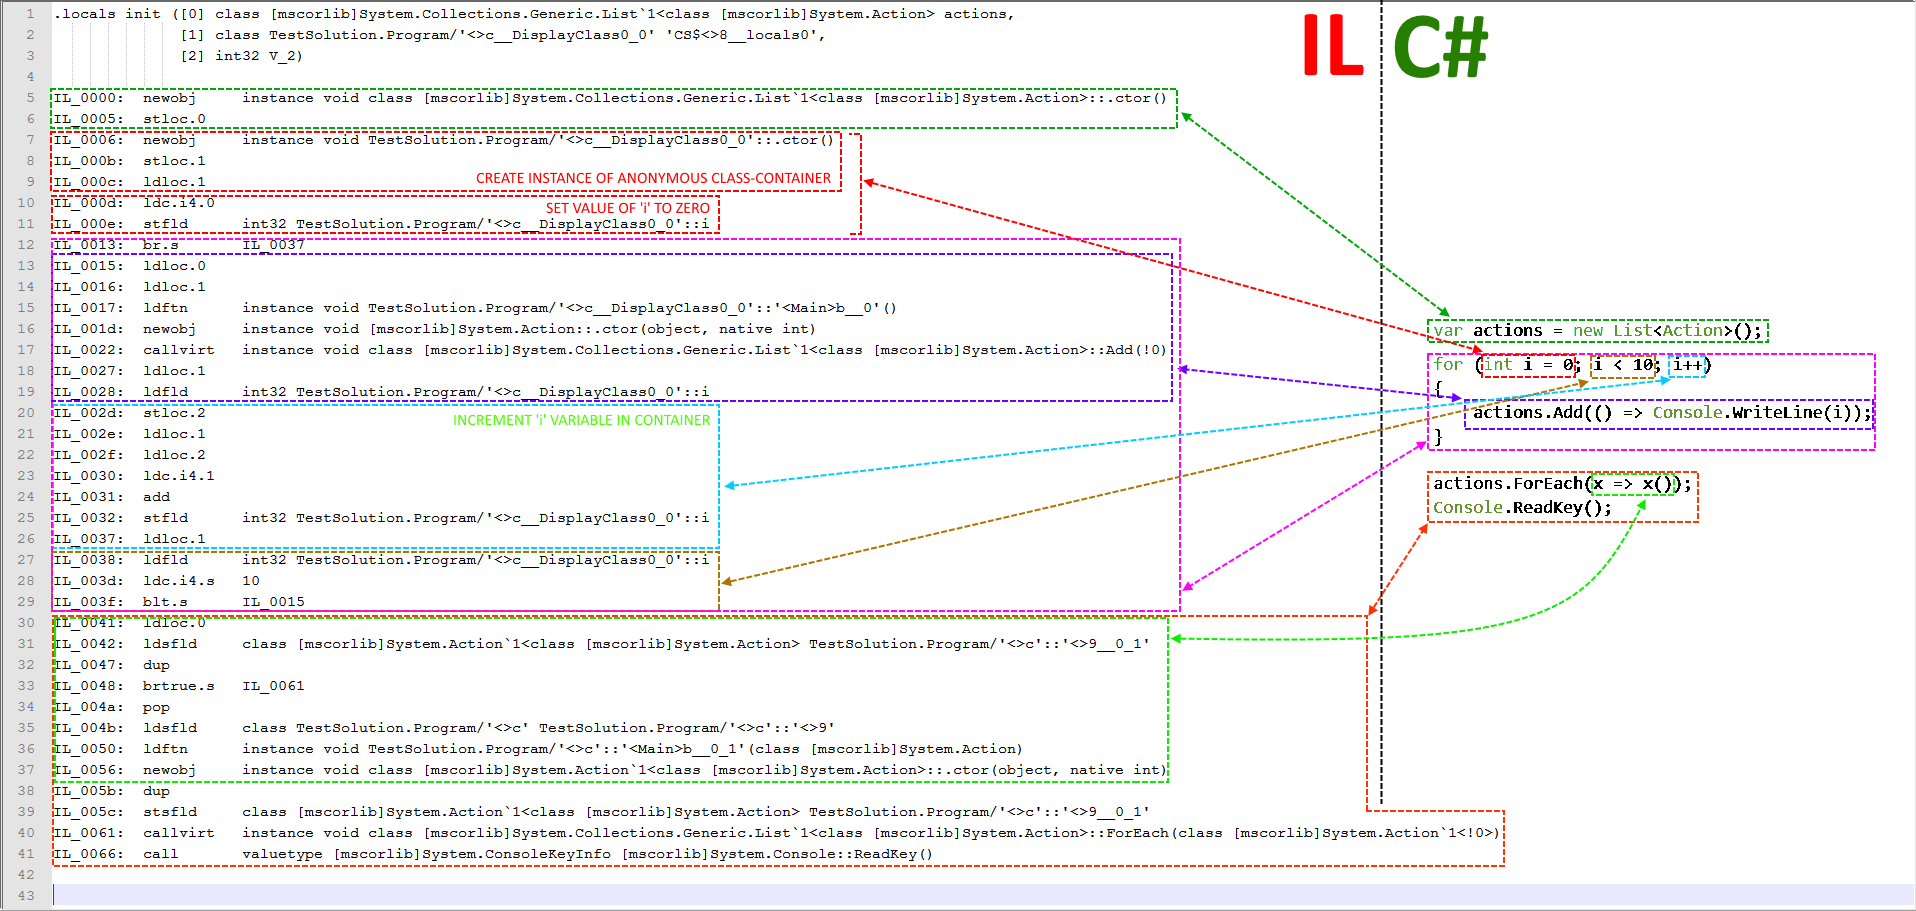
To avoid this error, ensure that the anonymous function encloses a local variable for the current iteration. The corrected code would look like:
void Foo()
{
var actions = new List<Action>();
for (int i = 0; i < 10; i++)
{
var curIndex = i;
actions.Add(() => Console.Write(curIndex)); // <=
}
// SOME ACTION
actions.ForEach(x => x());
}Therefore, we copy the value of the iterator to the local variable at each iteration and, as we already know, the anonymous container class will be created during the declaration of the enclosed variable, in our case - during the declaration of the 'curIndex' variable containing the current iterator value.
Let's examine a suspicious code fragment from the 'CodeContracts' project:
var tasks = new Task<int>[assemblies.Length];
Console.WriteLine("We start the analyses");
for (var i = 0; i < tasks.Length; i++)
{
tasks[i] = new Task<int>(() => CallClousotEXE(i, args)); // <=
tasks[i].Start();
}
Console.WriteLine("We wait");
Task.WaitAll(tasks);Despite the fact that the task (Task) is created and started during the same iteration, it will not be started immediately. Therefore, the chances are high that the task will start after the current iteration which will cause an error.
For example, if we run the given piece of code in a synthetic test we will see that all tasks were started after the loop is complete, and, thereby, the 'i' variable in all tasks is equal to the last iterator value (10).
The corrected code would look like:
var tasks = new Task<int>[10];
Console.WriteLine("We start the analyses");
for (var i = 0; i < tasks.Length; i++)
{
var index = i;
tasks[i] = new Task<int>(() => CallClousotEXE(index, args));
tasks[i].Start();
}
Console.WriteLine("We wait");
Task.WaitAll(tasks);V3130. Priority of the '&&' operator is higher than that of the '||' operator. Possible missing parentheses.
The analyzer has detected a potential error: the priority of the '&&' logical operator is higher than that of the '||' operator. Programmers often forget this, which causes the result of a logical expression using these operators to be quite different from what was expected.
Consider the following sample of incorrect code:
if (c == 'l' || c == 'L' && !token.IsKeyword)
{ .... }The programmer most likely expected that equality of the 'c' variable and the value 'l' or 'L' would be checked first, and only then the '&&' operation would be executed. But according to the C# operator precedence, the '&&' operation is executed first, and only then, the '||' operation.
We recommend that you add parentheses in every expression that contains operators you use rarely, or whenever you're not sure about the priorities. Even if parentheses appear to be unnecessary, it's ok. At the same time, you code will become easier to comprehend and less error-prone.
This is the fixed code:
if ((c == 'l' || c == 'L') && !token.IsKeyword)
{ .... }How to get rid of a false positive in case it was this very sequence you actually intended: first '&&', then '||'?
There are several ways:
1) Bad way. You may add the "//-V3130" comment into the corresponding line to suppress the warning.
if (c == 'l' || c == 'L' && !token.IsKeyword) //-V3130
{ .... }2) Good way. You may write additional parentheses:
if (c == 'l' || (c == 'L' && !token.IsKeyword))
{ .... }These will help other programmers understand that the code is correct.
You can look at examples of errors detected by the V3130 diagnostic. |
V3131. The expression is checked for compatibility with the type 'A', but is casted to the 'B' type.
The analyzer detected a likely error that has to do with checking if an expression is compatible with one type and casting it to another type inside the body of the conditional statement.
Consider the following example:
if (obj is A)
{
return (B)obj;
}The programmer must have made a mistake, since a type conversion like that is very likely to cause a bug. What was actually meant is either to check the expression for type 'B' or cast it to type 'A'.
This is what the correct version could look like:
if (obj is B)
{
return (B)obj;
}This diagnostic is classified as:
You can look at examples of errors detected by the V3131 diagnostic. |
V3132. A terminal null is present inside a string. The '\0xNN' characters were encountered. Probably meant: '\xNN'.
The analyzer detected a likely error that has to do with the presence of a terminal null inside a string.
This error is typically caused by a typo. For example, the sequence "\0x0A" will be interpreted as the following four-byte sequence: { '\0', 'x', '0', 'A' }.
If you want to specify a character code in hexadecimal format, you need to write the 'x' character immediately after the '\' character. If you write the sequence "\0" instead, the compiler will interpret it as zero (in octal format). See also:
- MSDN. C Character Constants.
- MSDN. Escape Sequences.
Consider the following example:
String s = "string\0x0D\0x0A";When trying to print this string, the newline escape characters will not be processed. Printing functions will stop at the null terminator, '\0'. To fix this error, the sequence "\0x0D\0x0A" needs to be replaced with "\x0D\x0A".
Fixed code:
String s = "string\x0D\x0A";This diagnostic is classified as:
V3133. Postfix increment/decrement is senseless because this variable is overwritten.
The analyzer detected a likely error that has to do with using a postfix increment or decrement in an assignment to the same variable.
Consider the following example:
int i = 5;
// Some code
i = i++;The increment operation here will not affect the expression result and the 'i' variable will be assigned the value 5 after executing this code.
This is explained by the fact that postfix increment and decrement operations are executed after evaluating the right operand of the assignment operator, while the result of the assignment is temporarily cached and is assigned later to the left part of the expression after the increment/decrement operation has executed. Therefore, the result of the increment/decrement is overwritten with the result of the whole expression.
To better understand the mechanics of this behavior, consider the IL code of the example above:
-======- START OF OPERATION "int i = 5" -======-
// Declaring local variable 'i'
// Current stack => []
.locals init ([0] int32 i)
// Passing value 5 to the top of stack
// Current stack => [5]
IL_0001: ldc.i4.5
// Assigning value 5 from stack to variable 'i'
// Current stack => []
IL_0002: stloc.0
-======- END OF OPERATION "int i = 5" -======-
-======- START OF OPERATION "i = i++" -======-
// Passing value of variable 'i' to the top of stack
// Current stack => [5]
IL_0003: ldloc.0
-======- START OF OPERATION "i++" -======-
// Copying top value on stack
// Current stack => [5, 5]
IL_0004: dup
// Passing value 1 to the top of stack
// Current stack => [1, 5, 5]
IL_0005: ldc.i4.1
// Adding two top values from stack (5 + 1)
// Result (6) is passed to the top of stack
// Current stack => [6, 5]
IL_0006: add
// Assigning value 6 from stack to variable 'i'
// Current stack => [5]
IL_0007: stloc.0
-======- END OF OPERATION "i++" -======-
// Assigning value 5 from stack to variable 'i'
// Current stack => []
IL_0008: stloc.0
-======- END OF OPERATION "i = i++" -======-As for the correct version of this code, it can look differently depending on the intended behavior.
This error may be a typo and the programmer unintentionally wrote variable 'i' twice in the assignment statement. Then the correct version could look as follows:
int i = 5;
// Some code
q = i++;Another scenario is that the programmer did not know that the postfix increment operator adds one to the value of the variable but returns its initial value. Then the assignment statement is redundant and the fixed code could look like this:
int i = 5;
// Some code
i++;This example may look more like a synthetic test and you may think nobody really writes code that way, but this error can actually be found in serious projects. Here is an example taken from MSBuild project.
_parsePoint =
ScanForPropertyExpressionEnd(expression, parsePoint++);Incrementing the '_parsePoint' variable is pointless because the increment operation will be executed after passing the initial value of this variable to method 'ScanForPropertyExpressionEnd' and will not affect the result of this method in any way. The programmer must have confused postfix and prefix increments. In that case, the correct version of this code could look as follows:
_parsePoint =
ScanForPropertyExpressionEnd(expression, ++_parsePoint);This diagnostic is classified as:
V3134. Shift by N bits is greater than the size of type.
The analyzer detected a likely error that has to do with shifting a value of an integer number by 'N' bits, 'N' being greater than the length of this type in bits.
Consider the following example:
UInt32 x = ....;
UInt32 y = ....;
UInt64 result = (x << 32) + y;The programmer intended to form a 64-bit value from two 32-bit ones by shifting 'x' by 32 bits and adding the most significant and the least significant parts. However, as 'x' is a 32-bit value at the moment when the shift operation is performed, shifting by 32 bits will be equivalent to shifting by 0 bits, which will lead to an incorrect result.
This is what the fixed version of the code could look like:
UInt32 x = ....;
UInt32 y = ....;
UInt64 result = ((UInt64)x << 32) + y;Now consider the following example from a real project:
static long GetLong(byte[] bits)
{
return ((bits[0] & 0xff) << 0)
| ((bits[1] & 0xff) << 8)
| ((bits[2] & 0xff) << 16)
| ((bits[3] & 0xff) << 24)
| ((bits[4] & 0xff) << 32)
| ((bits[5] & 0xff) << 40)
| ((bits[6] & 0xff) << 48)
| ((bits[7] & 0xff) << 56);
}In the 'GetLong' method, an array of bytes is cast to a 64-bit value. Since bitwise shift operations are defined only for 32-bit and 64-bit values, each byte will be implicitly cast to 'Int32'. The bitwise shift range for a 32-bit value is [0..31], so the cast will be performed correctly only for the first 4 bytes of the array.
If the byte array was formed from a 64-bit value (for example 'Int64.MaxValue'), then casting the array back to Int64 using this method will result in an error if the original value was beyond the range [Int32.MinValue....Int32.MaxValue].
For a better understanding of this, let's see what happens when this code is executed over the value '289077008695033855' as an example. When cast to an array of bytes, this value will look as follows:
289077008695033855 => [255, 255, 255, 255, 1, 2, 3, 4]After passing this array to method 'GetLong', each byte will be implicitly cast to Int32 before executing the shift operation. Let's shift each element separately, so we can see where the problem is:

As you can see, each shift is performed over a 32-bit value, which causes range overlapping and, therefore, leads to an incorrect result. This happens because when attempting to shift a 32-bit value by more than 32 bits, they are shifted in a circle (shifting by 32, 40, 48, and 56 bits is equivalent to shifting by 0, 8, 16, and 24 bits respectively).
The fixed version of the code above could look like this:
static long GetLong(byte[] bits)
{
return ((long)(bits[0] & 0xff) << 0)
| ((long)(bits[1] & 0xff) << 8)
| ((long)(bits[2] & 0xff) << 16)
| ((long)(bits[3] & 0xff) << 24)
| ((long)(bits[4] & 0xff) << 32)
| ((long)(bits[5] & 0xff) << 40)
| ((long)(bits[6] & 0xff) << 48)
| ((long)(bits[7] & 0xff) << 56);
}If we now examine each shift operation separately, we will see that the shifts are performed over 64-bit values, which prevents range overlapping.

This diagnostic is classified as:
You can look at examples of errors detected by the V3134 diagnostic. |
V3135. The initial value of the index in the nested loop equals 'i'. Consider using 'i + 1' instead.
The analyzer has detected a faulty or suboptimal loop. A standard pattern is used where some operation is executed for every pair of elements of an array. This operation, however, is usually not required for a pair whose members are the same element, i.e. when 'i == j'.
For example:
for (int i = 0; i < size; i++)
for (int j = i; j < size; j++)
...It is highly possible that a more correct and effective way to traverse the arrays would probably be this:
for (int i = 0; i < size; i++)
for (int j = i + 1; j < size; j++)
...This diagnostic is classified as:
V3136. Constant expression in switch statement.
The analyzer detected a constant expression in a 'switch' statement. This usually indicates the presence of a logic error in the code.
Consider the following synthetic example:
int i = 1;
switch (i)
{
....
}The condition of the 'switch' statement is represented by a variable whose value can be computed at compilation time. This situation could have resulted from code refactoring: the previous version of the code changed the variable's value but then it was modified and the variable turned out to be no longer assigned any value.
This diagnostic is classified as:
You can look at examples of errors detected by the V3136 diagnostic. |
V3137. The variable is assigned but is not used by the end of the function.
The analyzer has detected a possible error that has to do with assigning a value to a local variable without ever using this variable before the method returns.
Consider the following example:
private string GetDisplayName(string name)
{
MyStringId tmp = MyStringId.GetOrCompute(name);
string result;
if (!MyTexts.TryGet(tmp, out result))
result = name;
return name;
}The programmer wanted the method to return the variable 'result', which gets initialized depending on how 'TryGet' executes, but made a typo that causes the method to return the variable 'name' all the time. The fixed code should look like this:
private string GetDisplayName(string name)
{
MyStringId tmp = MyStringId.GetOrCompute(name);
string result;
if (!MyTexts.TryGet(tmp, out result))
result = name;
return result;
}Consider another example:
protected DateTimeOffset? GetFireTimeAfter()
{
DateTimeOffset sTime = StartTimeUtc;
DateTimeOffset? time = null;
....
if (....)
{
....
time = sTime;
}
else if (....)
{
....
time = sTime;
}
....
//apply the timezone before we return the time.
sTime = TimeZoneUtil.ConvertTime(time.Value, this.TimeZone);
return time;
}In several 'if' blocks, the 'time' variable is assigned the value 'sTime' storing some initial time incremented by a certain interval. The 'time' variable is returned at the end of the method. Before that, as suggested by the comment, the programmer wants to adjust the time depending on the time zone. Because of a typo, what is adjusted instead is the time zone of the 'sTime' variable, which is not used anymore. The correct version should probably look like this:
protected DateTimeOffset? GetFireTimeAfter()
{
DateTimeOffset sTime = StartTimeUtc;
DateTimeOffset? time = null;
....
//apply the timezone before we return the time.
time = TimeZoneUtil.ConvertTime(time.Value, this.TimeZone);
return time;
}It is a common practice to assign some value to a variable at declaration even though it is not used anywhere after that. This is usually not a mistake: for example, declaring a variable in this way may be prescribed by the coding standard at your company, which requires storing the return result of any method in a variable even if this result is not used in any way. For example:
void SomeMethod()
{
....
int result = DoWork();
....
}The analyzer provides for such situations and will not issue the warning in those cases.
This diagnostic is classified as:
You can look at examples of errors detected by the V3137 diagnostic. |
V3138. String literal contains potential interpolated expression.
The analyzer has detected a string that could contain an interpolated expression, but there is no interpolation character '$' before the literal.
Consider the following snippet:
string test = "someText";
....
Console.WriteLine("{test}");Because of the absent '$' character before the string declaration, the console will simply output the name of the variable. This is the correct notation:
string test = "someText";
....
Console.WriteLine($"{test}");Strings with expressions inside them are also treated as potential errors:
int a = 1;
int b = 1;
string test = "{a:c} test";
string test1 = "{a+b} test1 {{{ a + b }}}";However, an exception is made for string literals passed as arguments to methods whose other arguments are variables contained in that same literal.
string test1 = ReplaceCustom("someText {test}", "{test}", test);In cases like this, the expression in the literal is often a placeholder for the value of the variable passed along with it to the same method.
You can look at examples of errors detected by the V3138 diagnostic. |
V3139. Two or more case-branches perform the same actions.
The analyzer has detected a switch statement whose different case labels contain the same code. This is often a sign of redundant code, which could be improved by merging the labels. However, identical code fragments may also result from copy-paste programming, in which case they are genuine errors.
The following example illustrates the redundant code scenario:
switch (switcher)
{
case 0: Console.Write("0"); return;
case 1: Console.Write("0"); return;
default: Console.Write("default"); return;
}Indeed, different values of 'switcher' may require performing the same actions, so the code can be rewritten in a more concise form:
switch (switcher)
{
case 0:
case 1: Console.Write("0"); return;
default: Console.Write("default"); return;
}If you use the case expressions, you won't be able to group such expressions under one condition.
private static void ShowCollectionInformation(object coll, bool cond)
{
switch (coll)
{
case Array arr:
if(cond)
{
Console.WriteLine (arr.ToString());
}
break;
case IEnumerable<int> arr:
if(cond)
{
Console.WriteLine (arr.ToString());
}
break;
}
}You can, however, move the code into a separate method, which will make it easier to modify and debug this code in the future.
Now, the following real-life example demonstrates a programming mistake:
switch (status.BuildStatus)
{
case IntegrationStatus.Success:
snapshot.Status = ItemBuildStatus.CompletedSuccess;
break;
case IntegrationStatus.Exception:
case IntegrationStatus.Failure:
snapshot.Status = ItemBuildStatus.CompletedSuccess;
break;
}The status assignment is faulty: the 'ItemBuildStatus' enumeration has the element 'CompletedFailed', which was to be assigned in case of failure or exception.
Fixed code:
switch (status.BuildStatus)
{
case IntegrationStatus.Success:
snapshot.Status = ItemBuildStatus.CompletedSuccess;
break;
case IntegrationStatus.Exception:
case IntegrationStatus.Failure:
snapshot.Status = ItemBuildStatus. CompletedFailed;
break;
}You can look at examples of errors detected by the V3139 diagnostic. |
V3140. Property accessors use different backing fields.
Analyzer detected a property that uses different backing fields in its get and set accessors. This can indicate a misprint or a copy-paste error originating from another property.
Let's review an example from a real-life application, where a developer made similar error:
String _heading; String _copyright;
public string Heading
{
get { return this._heading; }
set { this._heading = value; }
}
public string Copyright
{
get { return this._heading; }
set { this._copyright = value; }
}Here, the get accessor of the 'Copyright' property should return the '_copyright' field. Instead, '_heading' field is returned.
This is how the correct code will look like:
String _heading; String _copyright;
public string Heading
{
get { return this._heading; }
set { this._heading = value; }
}
public string Copyright
{
get { return this._copyright; }
set { this._copyright = value; }
}You can look at examples of errors detected by the V3140 diagnostic. |
V3141. Expression under 'throw' is a potential null, which can lead to NullReferenceException.
The analyzer has detected a situation where a potentially null value is passed to expression under throw. When passing null to a throw expression, the .NET runtime will generate a NullReferenceException, although no actual dereference will have occurred in the code.
For example, in the following code:
private Exception GetException(String message)
{
if (message == null)
return null;
return new Exception(message);
}
....
throw GetException(message);a null value will be passed to the expression under throw if the 'message' parameter has the null value.
A behavior like that may be non-obvious or undesirable from the viewpoint of further handling of the exception. First, the stack of the NullReferenceException, generated at the time of executing the throw expression, will be referring to the throw expression itself rather than the cause of the exception (i.e. the return of the null value by the 'GetException' method). Second, throwing a NullReferenceException in this case does not look appropriate since no actual null dereference has occurred, and that contradiction may hinder subsequent debugging.
To make debugging easier in situations like that, either check the value returned by the 'GetException' method before any exception is thrown or, instead of returning null, have the method throw an exception that would more specifically describe the issue of passing an unexpected value to the method.
This is what the fixed version could look like:
private Exception GetException(String message)
{
if (message == null)
throw new ArgumentException();
return new Exception(message);
}V3142. Unreachable code detected. It is possible that an error is present.
The analyzer has detected a block of code that will never be executed. This may indicate an error in the program's logic.
This diagnostic detects code blocks that will never get control.
Consider the following example:
static void Foo()
{
Environment.Exit(255);
Console.WriteLine("Hello World!");
}The 'Console.WriteLine (....)' function is unreachable because the 'Exit()' function does not return control. The exact fix depends on what logic was originally intended by the developer. Perhaps the expressions were written in the wrong order, and the correct version should then look like this:
static void Foo()
{
Console.WriteLine("Hello World!");
Environment.Exit(255);
}Consider another example:
static void ThrowEx()
{
throw new Exception("Programm Fail");
}
public void SetResponse(int response)
{
ThrowEx();
Debug.Assert(false); //should never reach here
}In this example, the interprocedural analysis checks the 'ThrowEx' method and warns that the code below the method call is unreachable. If you expect such behavior in your program, you can mark this warning as a false positive.
public void SetResponse(int response)
{
ThrowEx();
Debug.Assert(false); //should never reach here //-V3142
}This diagnostic is classified as:
You can look at examples of errors detected by the V3142 diagnostic. |
V3143. The 'value' parameter is rewritten inside a property setter, and is not used after that.
The analyzer has detected an assignment of some value to the 'value' parameter inside the property's setter, with the 'value' parameter never being used in the body of this setter after that. This may indicate a programming mistake or typo.
Consider the following example taken from a real project:
public LoggingOptions Options
{
get { return m_loggingOptions; }
set { value = m_loggingOptions; }
}In this code, the value of the 'value' parameter is overwritten immediately after entering the property's set method, and the original value is lost. The developer must have made a typo and accidentally swapped 'value' and 'm_loggingOptions'. But if they did not intend to allow writing into this property, they could declare it with a private set method or avoid declaring the setter altogether.
This is what the fixed version could look like:
public LoggingOptions Options
{
get { return m_loggingOptions; }
set { m_loggingOptions = value; }
}You can look at examples of errors detected by the V3143 diagnostic. |
V3144. This file is marked with copyleft license, which requires you to open the derived source code.
The analyzer has detected a file marked with a copyleft license, which requires you to open the rest of the source code. This may be unacceptable for many commercial projects.
If you develop an open-source project, you can simply ignore this warning and turn it off.
Here is an example of a comment that will cause the analyzer to issue the warning:
/* This program is free software: you can redistribute it and/or modify
* it under the terms of the GNU General Public License as published by
* the Free Software Foundation, either version 3 of the License, or
* (at your option) any later version.
*
* This program is distributed in the hope that it will be useful,
* but WITHOUT ANY WARRANTY; without even the implied warranty of
* MERCHANTABILITY or FITNESS FOR A PARTICULAR PURPOSE. See the
* GNU General Public License for more details.
*
* You should have received a copy of the GNU General Public License
* along with this program. If not, see <https://www.gnu.org/licenses/>.
*/For proprietary projects
If you include a file with this type of license (GPL3 in this case) into a proprietary project, you will be required to open the rest of your source code due to the specifics of this license.
Such copyleft licenses are called "viral license" because of their tendency to affect other project files. The problem is that using at least one such file in a proprietary project automatically renders the entire source code open and compels you to distribute it along with the binary files.
This diagnostic detects the following viral licenses:
- AGPL-3.0
- GPL-2.0
- GPL-3.0
- LGPL-3.0
If you discover that your proprietary project uses files with a copyleft license, you have one of the following options:
- Exclude this code (library) from your project;
- Replace the library;
- Make your project open-source.
For open-source projects
We understand that this diagnostic is irrelevant to open-source projects. The PVS-Studio team contributes to the development of open-source software by helping to fix bugs found in such software and offering free license options to open-source developers. However, our product is a B2B solution, so this diagnostic is enabled by default.
If your code is distributed under one of the copyleft licenses from the list above, you can turn this diagnostic off in one of the following ways:
- If you're using the PVS-Studio plugin for Visual Studio, you can disable this diagnostic display in the analyzer output window by going to Options > PVS-Studio > Detectable Errors > 1.General Analysis > V3144. The downside of this method is that the error will still be written in the analyzer's log while saving it (or if the analysis was run from the command line). Therefore, when you open such a log on another machine or convert the analysis results to another format, the messages that were disabled in this way may reappear.
- If you're not using the plugin, you want to lock the rule for the whole team or remove from the analyzer report, - you can disable the diagnostic by adding the configuration file of the analyzer diagnostic rules in a project or solution. You can do it manually or using the Visual Studio interface (choose context menu of a project\solution 'Add > New Item', then choose PVS-Studio Filters File). The file you added in the version control system will be available for the whole team. Add the following line in the file: //-V::3144. This way you'll configure the analyzer to disable this diagnostic. To learn more about using comments to disable diagnostics, see the documentation.
- If you use the Plog Converter utility to convert analysis reports between different formats, you can disable the diagnostic by specifying the "-d" option.
Adding to the list of unsafe licenses
If you know of some other types of viral licenses that our tool does not yet detect, you can inform us about them using the feedback form so that we could add detection of those in the next release.
References
- GNU General Public License
- Viral license
- Ways to Get a Free PVS-Studio License
- Suppression of false alarms
V3145. Unsafe dereference of a WeakReference target. The object could have been garbage collected before the 'Target' property was accessed.
The analyzer has detected a case of unsafe use of an object of 'WeakReference' type, which may result in null dereference.
Consider the following contrived example:
string Foo(WeakReference weak)
{
Return weak.Target.ToString();
}Since the object referred to by 'WeakReference' can be garbage collected at any time, there is always a risk that the 'Target' property will return 'null'.
In that case, calling the 'ToString' method will cause a null dereference and a 'NullReferenceException'. One way to prevent potential object removal is to have the object stored in a local variable during the time it is being handled. This is what the fixed version looks like:
string Foo(WeakReference weak)
{
var weakTarget = weak.Target;
return weakTarget != null ? weakTarget.ToString() : String.Empty;
}With the reference stored in the local variable, the garbage collector will not be able to delete that object as long as the reference to it remains on the stack. But even then you must check that local variable for 'null' after writing the reference to it as the object referred to by the 'Target' property could have been already collected by the time the 'Target' is accessed.
Using the 'IsAlive' property for checking if the object is still inside 'WeakReference' will not protect you against 'NullReferenceException' either because the object could as well be collected between the 'IsAlive' check and dereference of the 'Target' property:
char Foo(WeakReference weak)
{
if (weak.IsAlive)
return (weak.Target as String)[0];
return ' ';
}This is one example of how to use the 'IsAlive' property correctly:
char Foo(WeakReference weak)
{
var str = weak.Target as String;
if (weak.IsAlive)
return str[0];
return ' ';
}This diagnostic is classified as:
You can look at examples of errors detected by the V3145 diagnostic. |
V3146. Possible null dereference. A method can return default null value.
The analyzer has detected a case of unsafe use of the value returned by one of the methods of the System.Enumerable library that can return a 'default' value.
'FirstOrDefault', 'LastOrDefault', 'SingleOrDefault', and 'ElementAtOrDefault' are examples of such methods. They return a default value if the array they are called on does not contain any object satisfying the search predicate parameter. An empty (null) reference is the default value for reference types. Therefore, a reference returned by such a method should be checked for null before it can be used.
Example of unsafe dereferencing:
public void TestMemberAccess(List<string> t)
{
t.FirstOrDefault(x => x == "Test message").ToString();
}This code requires a null check for the element returned by the method:
public void TestMemberAccess(List<string> t)
{
t.FirstOrDefault(x => x == "Test message")?.ToString();
}Methods returning default values are especially dangerous when used in call chains. This is an example from one open-source project:
public IViewCompiler GetCompiler()
{
....
_compiler = _services
.GetServices<IViewCompilerProvider>()
.FirstOrDefault()
.GetCompiler();
}
....
return _compiler;
}If you are sure that the array contains the required element, we recommend using a method that does not return a default value:
public IViewCompiler GetCompiler()
{
....
_compiler = _services
.GetServices<IViewCompilerProvider>()
.First()
.GetCompiler();
}
....
return _compiler;
}With this fix, if an error occurs, the program will throw an 'InvalidOperationException' with a more intelligible message "Sequence contains no elements" rather than a 'NullReferenceException'.
This diagnostic is classified as:
You can look at examples of errors detected by the V3146 diagnostic. |
V3147. Non-atomic modification of volatile variable.
The analyzer has detected a non-atomic modification of a 'volatile' variable, which may result in a race condition.
As you know, the 'volatile' modifier guarantees that the actual state of the marked variable will be visible to each thread. The 'volatile' modifier is used to tell the CLR that every assignment to this variable and every read from it must be atomic.
It may seem that marking a variable as 'volatile' should be enough to safely use any of the possible assignment operations on it in a multi-threaded application.
In addition to the usual assignment operations, there are operations that modify the variable's value before the write:
- var++, --var, ...
- var += smt, var *= smt, ...
- ...
Each of these operations looks like a single operation, but in reality it is a series of read-modify-write operations.
The following example uses a 'volatile' variable as a counter (counter++).
class Counter
{
private volatile int counter = 0;
....
public void increment()
{
counter++; // counter = counter + 1
}
....
}When compiled into IL, this increment operation expands into a series of commands:
IL_0001: ldarg.0
IL_0002: ldarg.0
IL_0003: volatile.
IL_0005: ldfld int32
modreq([mscorlib]System.Runtime.CompilerServices.IsVolatile)
VolatileTest.Test::val
IL_000a: ldc.i4.1
IL_000b: add
IL_000c: volatile.
IL_000e: stfld int32
modreq([mscorlib]System.Runtime.CompilerServices.IsVolatile)
VolatileTest.Test::valThis is where the race condition stems from. Suppose we have two threads simultaneously handling the same object of type Counter and incrementing the 'counter' variable, which was initialized to the value 10. Both threads will be performing intermediate operations on the counter variable at the same time, each on its own stack (let's call those intermediate values temp1 and temp2):
[counter == 10, temp1 == 10] Thread N1 reads the value of 'counter' onto its stack. (ldfld in IL)
[counter == 10, temp1 == 11] Thread N1 modifies the temp1 value on its stack. (add in IL)
[counter == 10, temp2 == 10] Thread N2 reads the value of 'counter' onto its stack. (ldfld in IL)
[counter == 11, temp1 == 11] Thread N1 writes the temp1 value into 'counter'. (stfld in IL)
[counter == 11, temp2 == 11] Thread N2 modifies the temp2 value on its stack. (add in IL)
[counter == 11, temp2 == 11] Thread N2 writes the temp2 value into 'counter'. (stfld in IL)
We expected the 'counter' variable to have the resulting value 12 (not 11) since the two threads were incrementing the same variable. The threads could also increment the variable in turn, which is where we would get the expected result.
To avoid such behavior of non-atomic operations on shared variables, you can use the following techniques:
- A 'lock' block
- Atomic-operation methods of the Interlocked class from the System.Threading library
- Locks provided by the Monitor class from the System.Threading library
Fixed code:
class Counter
{
private volatile int counter = 0;
....
public void increment()
{
Interlocked.Increment(ref counter);
}
....
}This diagnostic is classified as:
V3148. Casting potential 'null' value to a value type can lead to NullReferenceException.
The analyzer has detected an unsafe cast of a potentially null reference to a value type. Even though no dereference as such takes place in this case, such a cast will still result in raising a 'NullReferenceException'.
The simplest way to get this behavior is as follows:
void Foo()
{
object b = null;
var c = (bool)b;
}This is what the fixed code should look like:
void Foo()
{
object b = null;
var c = (bool)(b ?? false);
}A warning will also be issued if a potentially null variable is found to be cast to any value type, say, struct:
protected override void ProcessMessageAfterSend(....)
{
....
(DateTime)msg.GetMetadata(....);
....
}
public object GetMetadata(string tag)
{
object data;
if (metadata != null && metadata.TryGetValue(tag, out data))
{ return data; }
return null;
}The diagnostic checked the return result of the 'GetMetadata' method and found that it could return 'null'. The type cast in this example needs a null check too:
protected override void ProcessMessageAfterSend(....)
{
....
(DateTime)(msg.GetMetadata(....) ?? new DateTime());
....
}This diagnostic is classified as:
You can look at examples of errors detected by the V3148 diagnostic. |
V3149. Dereferencing the result of 'as' operator can lead to NullReferenceException.
The analyzer has detected an unsafe dereference of the value resulting from type conversion using the 'as' operator.
Consider the following contrived example:
void Foo()
{
BaseItem a = GetItem();
var b = a as SpecificItem;
b.Bar();
}The type of the value returned from the method may be different from the type we want to cast to. In that case, casting between the types using the 'as' operator will result in writing the value null to the variable 'b'. Even though no error will occur at the moment of the cast itself, further use of this variable without a prior null check will lead to raising a 'NullReferenceException'. The fixed code:
void Foo()
{
BaseItem a = GetItem();
var b = a as SpecificItem;
b?.Bar();
}If you are sure that the variable to which the 'as' operator is applied will always be successfully cast from the runtime type to the specified type, use the explicit cast operator:
void Foo()
{
BaseItem a = GetItem();
var b = (SpecificItem)a;
b.Bar();
}If the program's behavior changes later and the 'GetItem' method is no longer guaranteed to return a value convertible to the specified type, an invalid cast will raise an 'InvalidCastException', allowing you to quickly identify the problem spot. In contrast, using the 'as' operator will lead to raising a 'NullReferenceException' further in the code when attempting to dereference the variable resulting from an invalid cast and having the value null, and this may not happen until execution gets far from the failed cast, say, in some other method, thus making it difficult to find and fix the bug.
This diagnostic also points out possible typos in type checks:
void Foo()
{
IDisposable a = GetItem();
if(a is NonSpecificItem)
{
var b = a as SpecificItem;
b.Bar();
}
}In this example, the types SpecificItem and NonSpecificItem are not related, so the cast will return a null pointer. To prevent typos like that from breaking the program, you can implement the check using the Is Type Pattern syntax provided by C# 7.0:
void Foo()
{
IDisposable a = GetItem();
if(a is NonSpecificItem item)
{
item.Bar();
}
}The following snippet is taken from a real open-source project:
....
FuelDefinition = MyDefinitionManager.Static.GetPhysicalItemDefinition(FuelId);
MyDebug.AssertDebug(FuelDefinition != null);
....
String constraintTooltip = FuelDefinition.DisplayNameText;The 'GetPhysicalItemDefinition' method returns an object of type MyPhysicalItemDefinition retrieved from an array of objects of the basic type 'MyDefinitionBase':
public MyPhysicalItemDefinition GetPhysicalItemDefinition(MyDefinitionId id)
{
....
return m_definitions.m_definitionsById[id] as MyPhysicalItemDefinition;
}The call of the 'GetPhysicalItemDefinition' method is followed by a null check (MyDebug.AssertDebug) of the value resulting from the cast, which suggests that the method may return an object of an incompatible type. This check, however, will work only in the Debug version. In the Release version, the failed cast will result in null dereference further in the code (FuelDefinition.DisplayNameText).
This diagnostic is classified as:
V3150. Loop break conditions do not depend on the number of iterations.
The analyzer has detected a loop whose termination conditions do not depend on the number of iterations. Such a loop can iterate 0, 1, or an infinite number of times.
Consider the following example of such a loop:
void Foo(int left, int right)
{
while(left < right)
{
Bar();
}
}The problem is with the while loop: the variables being checked in the condition do not change; therefore, the loop will either never terminate or never start.
Here is another example of code that would trigger this diagnostic. A loop may become infinite if you forget to rethrow an exception in the 'try-catch' block down the stack:
while (condition)
{
try {
if(Foo())
{
throw new Exception();
}
}
catch (Exception ex)
{
....
}
}To have this loop terminate on throwing the exception, you can, for example, rethrow this exception from the catch section using the throw statement:
while (condition)
{
try {
if(Foo())
{
throw new Exception();
}
}
catch (Exception ex)
{
....
throw;
}
}V3151. Potential division by zero. Variable was used as a divisor before it was compared to zero. Check lines: N1, N2.
The analyzer has detected a potential division-by-zero error.
What the analyzer is reporting is a situation where some value is divided by a variable and then this variable is compared with zero. This means one of the two scenarios:
1) If the divisor variable has the value 0, an error will occur.
2) The division always yields a correct result because the divisor variable is never 0. In this case, the null check is unnecessary.
Consider the following example:
int Foo(int num)
{
result = 1 / num;
if (num == 0) return -1;
....
}If the value of 'num' happens to be zero, executing the '1 / num' expression will lead to an error. The analyzer reports this code by pointing at two lines: the first is where the division is executed and the second is where the divisor variable is checked for null.
Fixed code:
int Foo(int num)
{
if (num == 0) return -1;
result = 1 / num;
....
}The following example demonstrates the scenario where no error occurs and the null check is not needed.
int num = MyOneTenRandom();
result = 1 % num;
if (num == 0) return -1;This code is always correct. The 'MyOneTenRandom' function is implemented in such a way that it never returns zero. However, the analyzer failed to recognize this (which may happen when, for example, the method is virtual and the interprocedural analysis fails to determine which of its implementations will be called at runtime) and issued the warning. To eliminate it, remove the check "if (num == 0)" – it has no practical use and can only confuse the maintainer.
Fixed code:
int num = MyOneTenRandom();
result = 1 % num;As an alternative to removing the check to eliminate a false positive, you can also use a warning-suppression comment, for example: "1 % num; //-V3151".
This diagnostic is classified as:
V3152. Potential division by zero. Variable was compared to zero before it was used as a divisor. Check lines: N1, N2.
The analyzer has detected a potential division-by-zero error.
A numeric variable is first compared with zero and then divided by without such a check. This means one of the two scenarios:
1) If the divisor variable has the value 0, an error will occur.
2) The division always yields a correct result because the divisor variable is never 0. In this case, the null check is unnecessary.
Consider the following example. Executing this code may result in throwing an exception:
int num = Foo();
if (num != 0)
variable1 = 3 / num;
variable2 = 5 / num;If the value of 'num' happens to be zero, executing the '5 / num' expression will lead to an error. The analyzer reports this code by pointing at two lines: the first is where the division is executed and the second is where the divisor variable is checked for null.
Fixed code:
int num = Foo();
if (num != 0)
{
variable1 = 3 / num;
variable2 = 5 / num;
}Consider another example. The division here is safe and the check is not needed:
List<string> list = CreateNonEmptyList();
var count = list.Count;
if (count == 0) {....}
var variable = 10 / count;Suppose the 'CreateNonEmptyList' method always returns a non-empty list for 'list'. In that case, the code above will always work correctly and a division by zero will never occur.
Note: in this example, the analyzer does not produce the V3152 warning every time: if it can understand that the method always returns a non-empty list, it will instead issue a V3022 warning ("expression always true") on the check 'list.Count == 0'. If it fails to understand that (for example, because of a complicated sequence of reassignments or when the method is virtual, and so on), it will issue a V3152 warning. The type of the warning to be issued will depend on the implementation of the 'CreateNonEmptyList' method.
To eliminate the warning, remove the check 'if (list == null || list.Count == 0)'. In this case, it has no practical use and can only confuse the maintainer.
Fixed code:
List<string> list = CreateNonEmptyList();
var variable = 10 / list.Count;Another case where this warning is issued is when the null check and the division operation occur in different branches of if-else or switch statements, for example:
if (lines.Count == 1)
{
if (num != 0)
variable = 10 / num;
}
else
{
variable = 10 / num;
}In this example, even though execution can never follow both branches at one run and will instead follow only one of them, the fact that the variable is compared with zero in one of the branches is a sign that it can have the value 0 in the other branch. If that happens, a division by zero will occur when the other branch gets control.
Fixed version:
if (lines.Count == 1)
{
if (num != 0)
variable = 10 / num;
}
else
{
if (num != 0)
variable = 10 / num;
}As an alternative to removing the check to eliminate a false positive, you can also use a warning-suppression comment, for example:
variable = 10 / num; //-V3152This diagnostic is classified as:
V3153. Dereferencing the result of null-conditional access operator can lead to NullReferenceException.
The analyzer found a potential error that may cause the null reference's dereferencing. The code contains the '?.' operator's result that is dereferenced immediately - explicitly or implicitly.
A 'NullReferenceException' exception may be thrown, for example, in cases below:
- You used the null-conditional operator on a potentially null element, placed the expression in parentheses, and dereferenced the result.
- The 'foreach' statement contains the null-conditional operator.
The scenarios above may lead to one of the following:
- The program throws a 'NullReferenceException' exception if you conditionally access a 'null' reference.
- The program always works correctly, because the reference you use for conditional access is never 'null'. In the second case, checking for 'null' is unnecessary.
Let's take a closer look at the first case. This code may throw an exception:
var t = (obj?.ToString()).GetHashCode();In the 'obj?.ToString()' expression, if the 'obj' object is 'null', the 'ToString()' method is not called. This is how the conditional access operator works. However, since the 'GetHashCode' method is outside the null-conditional expression, it is called no matter the expression's result.
Below is the fixed code:
var t = obj?.ToString().GetHashCode();The expression above does not have the dangerous dereferencing. Additionally, the 't' variable now has the 'Nullable<int>' type, which correctly reflects its contents as potentially containing the 'null' value.
Let's take a look at a different example. Here, checking for 'null' is excessive because of the safe dereferencing:
object obj = GetNotNullString();
....
var t = ((obj as String)?.Length).GetHashCode();This code always works correctly. The 'obj' object is always of the 'String' type, therefore checking type after casting is unnecessary.
Below is the fixed code:
var t = ((String)obj).Length.GetHashCode();The example below shows a foreach statement that contains the null-conditional operator:
void DoSomething(string[] args)
{
foreach (var str in args?.Where(arg => arg != null))
....
}If the 'args' parameter is 'null', the 'args?.Where(....)' expression also evaluates to 'null' because of the '?.' operator. When the 'foreach' loop to iterates through the collection, a 'NullReferenceException' exception is thrown. This happens because the 'GetEnumerator()' method is implicitly called for the 'args?.Where(....)', and this dereferences the null reference.
You can fix the code in the following way:
void DoSomething(string[] args)
{
foreach (var str in args?.Where(arg => arg != null)
?? Enumerable.Empty<string>())
....
}This diagnostic is classified as:
You can look at examples of errors detected by the V3153 diagnostic. |
V3154. The 'a % b' expression always evaluates to 0.
A modulo operation performed on an integer type always returns 0. This happens because its right operand is represented by the value 1 (-1), which is most likely a typo.
A common pattern of this error is checking if no remainder is left after dividing a value by 2. To do this, you use the modulo operation and compare the result with 0 or 1. Making a typo at this point is easy because since you anticipate the value 1, you may accidentally divide by 1 too. For example:
if ((x % 1) == 1)
{
....
}The programmer wrote the value 1 instead of 2, which will result in the 'x % 1' expression always evaluating to 0 no matter the value of 'x'. Therefore, the condition will always be false.
Fixed code:
if ((x % 2) == 1)
{
....
}The following example was taken from a real-life application:
const int SyncReportFrequency = 1;
....
private void TimerOnElapsed(object sender, ElapsedEventArgs e)
{
if (_reportId % SyncReportFrequency == 0)
{
WriteSyncReport();
}
}The 'SyncReportFrequency ' is a constant equal to 1, so regardless of the value of the '_reportId' variable, the condition of the 'if' statement will always be true.
It is either that the developer made a typo in this code or the condition is superfluous. Fixed version:
const int SyncReportFrequency = 2;
....
private void TimerOnElapsed(object sender, ElapsedEventArgs e)
{
if (_reportId % SyncReportFrequency == 0)
{
WriteSyncReport();
}
}This diagnostic is classified as:
V3155. The expression is incorrect or it can be simplified.
The analyzer has detected a suspicious expression whose result will always be equal to one of the operands. Either such expressions are made redundant intentionally to convey a certain idea to future maintainers or they are simply errors.
The following example demonstrates a simple case of such an error:
var a = 11 - b + c * 1;The 'c' variable is multiplied by '1', which is a redundant operation and may signal a typo if the programmer actually meant to multiply the variable by some other value, say, 10:
var a = 11 - b + c * 10;The next example is taken from a real project. Here, redundancy was added on purpose but not quite properly:
detail.Discount = i * 1 / 4M;What the programmer meant by this expression is that the 'i' variable is to be multiplied by one fourth. Yes, they could have written it as 0.25, but the value 1/4 better conveys the logic of the algorithm.
But this expression is not very well implemented. The 'i' variable is first multiplied by 1 and only then does the division take place. True, the result is still the same, but code like that may be misleading, which is the reason why the analyzer pointed it out.
To make the code clearer and stop the analyzer from issuing the warning, parentheses should be added:
detail.Discount = i * (1 / 4M);Another real-life example:
public virtual ValueBuffer GetIncludeValueBuffer(int queryIndex)
{
return queryIndex == 0
? _activeQueries[_activeIncludeQueryOffset + queryIndex].Current
: _activeIncludeQueries[queryIndex - 1].Current;
}In this case, the '_activeIncludeQueryOffset' variable will always be added to zero because of the check 'queryIndex == 0' before it. It does not look like an error, but the code can be simplified:
public virtual ValueBuffer GetIncludeValueBuffer(int queryIndex)
{
return queryIndex == 0
? _activeQueries[_activeIncludeQueryOffset].Current
: _activeIncludeQueries[queryIndex - 1].Current;
}Note. The analyzer does not report a suspicious expression if it finds another similar expression next to it. For example:
A[i+0]=1;
A[i+1]=10;
A[i+2]=100;
A[i+3]=1000;
A[i+4]=10000;The 'i + 0' expression is redundant, but it is followed by a series of similar expressions of the 'i + literal' pattern. This suggests that the first expression, where the variable is added to 0, was written on purpose for the sake of consistent style.
This diagnostic is classified as:
V3156. The argument of the method is not expected to be null.
The analyzer has detected a possible issue, where the value 'null' is passed as an argument to a method that is not supposed to get the value 'null' for this argument.
This may result in, for example, throwing an exception or incorrectly executing the method.
When coding, it might be difficult to make sure you have null checks in all sensitive spots. Such a check is especially important when a variable that can take the value 'null' is passed to a method where it is further used as an argument to another method that does not expect the value 'null' for this argument.
Consider the following contrived example:
void Method(string[] args)
{
var format = args.Length != 0 ? args[0] : null;
....
var message = string.Format(format, _value);
// do something
}If the 'args' array is empty, the 'format' variable will be assigned the value 'null'. Consequently, that same value will be passed to the 'string.Format' method as its first argument, resulting in throwing an exception. This code can be fixed as follows:
void Method(string[] args)
{
var format = args.Length != 0 ? args[0] : null;
....
if (format == null)
{
// process an error
return;
}
var message = string.Format(format, _value);
// do something
}Let's make the example above a bit more complex:
void Method(string[] args)
{
var format = args.Length != 0 ? args[0] : null;
....
WriteInfo(format);
}
void WriteInfo(string format)
{
Console.Write(format, _value);
}The 'format' variable still depends on 'args.Length' and could potentially be assigned the value 'null'. In this case, we assume that 'format == null'. Therefore, it is also the value 'null' that will be passed to the 'WriteInfo' method. This value will then be passed to the 'Console.WriteLine' method as its first argument, resulting in an 'ArgumentNullException'.
This snippet is fixed in the same way as the previous one:
void Method(string[] args)
{
var format = args.Length != 0 ? args[0] : null;
....
WriteInfo(format);
}
void WriteInfo(string format)
{
if (format == null)
{
// process an error
return;
}
Console.Write(format, _value);
}The next example is taken from a real program:
private static string HandleSuffixValue(object val, StringSegment suffixSegment)
{
....
var res = string.Format(suffixSegment.Value, val).TrimEnd(']');
return res == "" ? null : res;
}The first argument of the 'string.Format' method must not be 'null'. Let's see what 'suffixSegment.Value' returns:
public string Value
{
get
{
if (HasValue)
{
return Buffer.Substring(Offset, Length);
}
else
{
return null;
}
}
}If 'HasValue' is 'false', then 'Value' will return 'null'. It means the call of the 'string.Format' method could potentially throw an exception in this case. This is how it can be fixed:
private static string HandleSuffixValue(object val, StringSegment suffixSegment)
{
....
if (suffixSegment.Value == null)
{
return null;
}
var res = string.Format(suffixSegment.Value, val).TrimEnd(']');
return res == "" ? null : res;
}This diagnostic is classified as:
You can look at examples of errors detected by the V3156 diagnostic. |
V3157. Suspicious division. Absolute value of the left operand is less than the right operand.
The analyzer has detected one of the two types of integer operations – either a division or modulo operation – in which the absolute value of the left operand is always less than the absolute value of the right operand.
Such operations will return the following results:
- division will always return 0;
- modulo operation will always return the left operand.
Such an expression is very likely to contain an error or is simply redundant.
Consider the following contrived example:
public void Method()
{
int a = 10;
int b = 20;
var c = a / b;
....
}In this snippet, the 'a / b' expression will always evaluate to 0 since 'a < b'. To turn this expression into a real division operation, we need to cast the type of the 'a' variable to 'double':
public void Method()
{
int a = 10;
int b = 20;
var c = (double)a / b;
....
}The following example is taken from a real program:
public override Shipper CreateInstance(int i)
{
....
return new Shipper
{
....
DateCreated = new DateTime(i + 1 % 3000, // <=
(i % 11) + 1,
(i % 27) + 1,
0,
0,
0,
DateTimeKind.Utc),
....
};
}The error here has to do with the wrong assumption about operation precedence. In the 'i + 1 % 3000' expression, the '1 % 3000' part will be evaluated first, thus always returning 1. Therefore, the value of the 'i' variable will always be added to 1. This is one way to fix this bug:
public override Shipper CreateInstance(int i)
{
....
return new Shipper
{
....
DateCreated = new DateTime((i + 1) % 3000, // <=
(i % 11) + 1,
(i % 27) + 1,
0,
0,
0,
DateTimeKind.Utc),
....
};
}Here is another real-life example:
private void ValidateMultiRecords(StorageEnvironment env,
IEnumerable<string> trees,
int documentCount,
int i)
{
for (var j = 0; j < 10; j++)
{
foreach (var treeName in trees)
{
var tree = tx.CreateTree(treeName);
using (var iterator = tree.MultiRead((j % 10).ToString())) // <=
{
....
}
}
}
}In this snippet, the 'j' variable is incremented over the range [0..9]. Therefore, the result of the 'j % 10' expression will always be equal to the value of 'j'. This is what the simpler correct version may look like:
private void ValidateMultiRecords(StorageEnvironment env,
IEnumerable<string> trees,
int documentCount,
int i)
{
for (var j = 0; j < 10; j++)
{
foreach (var treeName in trees)
{
var tree = tx.CreateTree(treeName);
using (var iterator = tree.MultiRead(j.ToString())) // <=
{
....
}
}
}
}This diagnostic is classified as:
You can look at examples of errors detected by the V3157 diagnostic. |
V3158. Suspicious division. Absolute values of both operands are equal.
The analyzer has detected one of the two types of integer operations – either a division or modulo operation – in which the absolute value of the left operand is always equal to the value of the right operand.
Such operations will return the following results:
- division will always return 1 (-1);
- modulo operation will always return 0.
Such an expression is very likely to contain an error or is simply redundant.
Consider the following example:
const int MinDimensionValue = 42;
const int MaxDimensionValue = 146;
static int GetSidesRatio(int width, int height)
{
if (width < MinDimensionValue || width > MinDimensionValue)
throw new ArgumentException(/*....*/);
if (height < MinDimensionValue || height > MinDimensionValue)
throw new ArgumentException(/*....*/);
return width / height;
}The analyzer is warning us that the 'width / height' expression will always evaluate to 1. Indeed, execution will reach the division operation only if the value of 'width' is exactly equal to 'MinDimensionValue'. With any other value, an exception will be thrown. The same is true for 'height'.
This snippet contains a typo. The check 'width > MinDimensionValue' should be replaced with 'width > MaxDimensionValue' (the same replacement should be done for 'height'). Fixed code:
const int MinDimensionValue = 42;
const int MaxDimensionValue = 146;
static int GetSidesRatio(int width, int height)
{
if (width < MinDimensionValue || width > MaxDimensionValue)
throw new ArgumentException(/*....*/);
if (height < MinDimensionValue || height > MaxDimensionValue)
throw new ArgumentException(/*....*/);
return width / height;
}This diagnostic is classified as:
V3159. Modified value of the operand is not used after the increment/decrement operation.
The analyzer has detected a situation where a value is not used after a postfix or prefix increment / decrement operation. Either this operation is redundant or the postfix version should be replaced with the prefix one.
Consider the following example:
int CalculateSomething()
{
int value = GetSomething();
....
return value++;
}The incremented value of the local variable 'value' is returned by the 'CalculateSomething' method. However, the postfix operation will actually create a copy of 'value', increment the original variable, and return the copy. In other words, the '++' operator does not affect the value returned by the method in any way. Here is one possible fix to this defect:
int CalculateSomething()
{
int value = GetSomething();
....
return ++value;
}The following alternative is even better in signaling that the method must return an incremented value:
int CalculateSomething()
{
int value = GetSomething();
....
return value + 1;
}We recommend using the second version as a clearer one.
Consider another synthetic example:
void Foo()
{
int value = GetSomething();
Do(value++);
Do(value++);
Do(value++);
}Each time the 'Do' function is called, its argument is incremented. The last increment has no practical use since the incremented value is not used after that. However, it cannot be viewed as a defect since it is written simply for the sake of neater appearance. The analyzer will recognize this intention and ignore this spot. No warning is issued when the variable is incremented more than twice in succession.
Still, we recommend using the following pattern:
void Foo()
{
int value = GetSomething();
Do(value++);
Do(value++);
Do(value);
}As an alternative solution, you can write as follows:
void Foo()
{
int value = GetSomething();
Do(value + 0);
Do(value + 1);
Do(value + 2);
}This diagnostic is classified as:
You can look at examples of errors detected by the V3159 diagnostic. |
V3160. Argument of incorrect type is passed to the 'Enum.HasFlag' method.
The analyzer has detected an issue: the type of the object calling the 'Enum.HasFlag' method is different from the type of the argument passed. Such a call will result in throwing an 'ArgumentException'.
Consider the following synthetic example:
bool DoSomethingIfAttachedToParent(TaskContinuationOptions options)
{
if (options.HasFlag(TaskCreationOptions.AttachedToParent))
{
// ....
return true;
}
else
{
return false;
}
}Note that in this example, 'HasFlag' is called on an object of type 'TaskContinuationOptions', whereas an object of type 'TaskCreationOptions' is passed as an argument. Executing this code will result in throwing an 'ArgumentException'.
An error like that may be difficult to notice because of the similar names of the enumerations and because the 'AttachedToParent' element is found in both types.
The error can be fixed by changing either the type of the argument or the type of the calling object:
bool DoSomethingIfAttachedToParent(TaskContinuationOptions options)
{
if (options.HasFlag(TaskContinuationOptions.AttachedToParent))
{
// ....
return true;
}
else
{
return false;
}
}This diagnostic is classified as:
V3161. Comparing value type variables with 'ReferenceEquals' is incorrect because compared values will be boxed.
The analyzer has detected a suspicious call of the 'Object.ReferenceEquals' method: either one or both of the passed arguments are of the value type. Since the method's parameters are of type 'Object', arguments of the value type will be boxed when passed to the method. As a result of such boxing, an object will be created on the heap and a reference to that object will be passed to the 'Object.ReferenceEquals' method. Since this reference is not equal to any other reference, the method will return 'false' regardless of the passed argument's value.
Consider a simple synthetic example:
void SyntheticMethod(Point x, object a)
{
if (Object.ReferenceEquals(x, a))
....
}The variables 'x' and 'a' are passed to the 'Object.ReferenceEquals' method. Since 'x' is of type 'Point', its value will be boxed as it gets cast to type 'Object'. The call to 'Object.ReferenceEquals' will, therefore, always return 'false' no matter what arguments were passed to 'SyntheticMethod'.
This issue can be fixed by replacing the method call with a direct comparison of the values:
void SyntheticMethod(Point x, object a)
{
if (a is Point pointA && pointA == x)
....
}This rule is also applied to arguments whose types are generic parameters. Unless values for such a parameter are limited to reference types only, the analyzer will issue the warning. For example:
void SomeFunction<T>(T genericObject,
object someObject)
{
if (Object.ReferenceEquals(genericObject, someObject))
....
}Here, 'genericObject' could be an instance of both a reference type and a value type. 'Object.ReferenceEquals' will always return 'false' for value types. Such behavior might be unexpected and unwanted. To make sure that no objects of value types can be passed to the method, limit the parameter accordingly:
void SomeFunction<T>(T genericObject,
object someObject) where T : class
{
if (Object.ReferenceEquals(genericObject, someObject))
....
}Now only a reference type can be substituted for the parameter, so the analyzer will no longer issue the warning.
In the following example, the parameter is limited to an interface:
void SomeFunction<T>(T genericObject,
object someObject) where T : ICloneable
{
if (Object.ReferenceEquals(genericObject, someObject))
....
}The analyzer will report this code since value-type objects can implement interfaces. Thus, the limitation 'where T : ICloneable' does not protect the method from being invoked on structures, and such a call may lead to unpredictable results.
There is one specific point about boxing nullable types that we need to discuss separately. They are of the value types, so they will be boxed when they are cast to 'Object'. However, objects of these types are boxed in their own special way. If such a variable has a value, the boxing will allocate the value itself on the heap, rather than the nullable-type object. If the variable has no value, the boxing will return a null reference.
In the following example, 'x' is of type 'Nullable<Point>'. When 'x' is boxed, you are quite possible to get a null reference. In that case, the call of 'Object.ReferenceEquals' will return 'true' if the 'a' argument is 'null' too.
void SyntheticMethod(Point? x, object a)
{
if (Object.ReferenceEquals(x, a))
....
}However, this code will still trigger the warning because testing two items against 'null' in a way like that is suspicious. A better way to check whether the variables have values is to directly compare them with 'null' or to use the 'HasValue' property:
void SyntheticMethod(Point? x, object a)
{
if (!x.HasValue && a == null)
....
}More on specifics of nullable types:
- Check how you remember nullable value types. Let's peek under the hood
- Nullable value types (C# reference)
- Boxing and Unboxing (C# Programming Guide)
This diagnostic is classified as:
V3162. Suspicious return of an always empty collection.
The analyzer has detected a 'return' statement that always returns an empty collection declared as a local variable. This typically happens when the programmer forgets to add elements to the collection.
Consider the following example:
List<string> CreateDataList()
{
List<string> list = new List<string>();
string data = DoSomething();
return list;
}The programmer forgot to add the 'data' element to 'list', so the method will always return an empty collection. Here is the fixed version:
List<string> CreateDataList()
{
List<string> list = new List<string>();
string data = DoSomething();
list.Add(data);
return list;
}Sometimes developers will write a method that does nothing more than simply create and return a collection, for example:
List<List<CustomClass>> CreateEmptyDataList()
{
var list = new List<List<CustomClass>>();
return list;
}Another example:
List<List<CustomClass>> CreateEmptyDataList()
{
return new List<List<CustomClass>>();
}This technique is used in certain programming patterns or when the type of the collection has a very long name. The analyzer can recognize such situations and ignore them.
V3163. An exception handling block does not contain any code.
The analyzer has detected an empty exception handling block ('catch' or 'finally'). Inappropriate exception handling may decrease the application's reliability.
In some cases, inappropriate exception handling may result in a vulnerability. Insufficient logging and monitoring are pointed out as a separate category on OWASP Top 10 Application Security Risks 2017: A10:2017-Insufficient Logging & Monitoring.
The following example contains an empty 'catch' block:
try
{
someCall();
}
catch
{
}Code like this is not necessarily faulty, of course. But simply suppressing an exception without taking any further precautions against it is a strange practice since such insufficient exception handling may let defects stay unnoticed.
Logging is one example of how you can handle an exception. At least it will prevent the exception from passing unnoticed:
try
{
someCall();
}
catch (Exception e)
{
Logger.Log(e);
}An empty 'finally' block is no less suspicious. It may indicate incomplete implementation of some logic necessary for reliable behavior of the program. Consider the following example:
try
{
someCall();
}
catch
{ .... }
finally
{
}This code is very likely to be faulty or simply redundant. Unlike the empty 'catch' block, which can be used to suppress an exception, the empty 'finally' block has no practical use at all.
This diagnostic is classified as:
V3164. Exception classes should be publicly accessible.
The analyzer has detected an exception class inaccessible to other builds. If such an exception is thrown, the external code will have to catch instances of the nearest accessible parent class such as the base class of all exceptions, 'Exception'. This hinders exception handling since the code of other builds cannot identify the problem precisely.
Lack of clear identification of exceptions poses an additional security risk because some specific exceptions may require specific handling rather than general handling. Insufficient logging and monitoring (including exception identification) are pointed out as a separate category on OWASP Top 10 Application Security Risks 2017: A10:2017-Insufficient Logging & Monitoring.
Consider the following simple example taken from a real project:
internal sealed class ResourceException : Exception
{
internal ResourceException(string? name, Exception? inner = null)
: base(name, inner)
{
}
}To correctly handle a given exception, the exception class must be declared as 'public':
public sealed class ResourceException : Exception
{
internal ResourceException(string? name, Exception? inner = null)
: base(name, inner)
{
}
}This will enable other builds to catch and handle this particular exception.
Keep in mind that declaring an exception class as 'public' may be insufficient if it is a nested class, as in the following example:
namespace SomeNS
{
class ContainingClass
{
public class ContainedException : Exception {}
....
}
}Here, the exception class is nested into 'ContainingClass', which is implicitly declared as 'internal'. Therefore, 'ContainedException' will also be accessible only within the scope of the current build even though it bears the 'public' specifier. The analyzer recognizes situations like that and issues the warning.
This diagnostic is classified as:
V3165. The expression of the 'char' type is passed as an argument of the 'A' type whereas similar overload with the string parameter exists.
The analyzer detected a possible error when calling the constructor or method. An expression of 'char' type which is implicitly converted to another type is used as one of the arguments. While a suitable overload is found, in which the corresponding parameter is represented by the 'String' type. It may have been necessary to use an expression of type 'String' instead of 'char' to call the correct overload.
Consider an example:
public static string ToString(object[] a)
{
StringBuilder sb = new StringBuilder('['); // <=
if (a.Length > 0)
{
sb.Append(a[0]);
for (int index = 1; index < a.Length; ++index)
{
sb.Append(", ").Append(a[index]);
}
}
sb.Append(']');
return sb.ToString();
}The developer wanted the string stored in the instance of the 'StringBuilder' type to start with a square bracket. However, due to a typo, an object without any characters with a capacity of 91 elements, will be created.
This happened because a single quotation mark was used instead of double ones, which led to the wrong constructor overload call:
....
public StringBuilder(int capacity);
public StringBuilder(string? value);
....When the constructor is called, the character literal '[' will be implicitly cast to the corresponding value of 'int' type (91 in Unicode). Thereby the constructor with an 'int' parameter setting the initial capacity will be called instead of the constructor setting the string's beginning.
To fix the error, replace the character literal with a string literal, which will allow calling the correct constructor overload:
public static string ToString(object[] a)
{
StringBuilder sb = new StringBuilder("[");
....
}This diagnostic rule takes into account not only literals, but also expressions, so the following code will also trigger a warning:
public static string ToString(object[] a)
{
var initSmb = '[';
StringBuilder sb = new StringBuilder(initSmb);
....
}This diagnostic is classified as:
V3166. Calling the 'SingleOrDefault' method may lead to 'InvalidOperationException'.
The analyzer has detected a situation where the 'SingleOrDefault' method may be called without a predicate on a collection that has more than one element. Such a call will lead to throwing an exception of the 'System.InvalidOperationException' type.
The programmer may have wrong assumptions about this method's behavior because of other 'OrDefault' methods' behavior. For example, the methods 'FirstOrDefault', 'LastOrDefault', and 'ElementAtOrDefault' return a 'default' value of the type of elements in a collection when the operation cannot be accomplished (because the collection is empty, there is no element matching the predicate, and so on). Similarly, the 'SingleOrDefault' method also returns the 'default' value when called on an empty collection, but throws an exception if there is more than one element in the collection. This detail may be unknown to the programmer.
Consider the following example:
IEnumerable<State> GetStates()
{
var states = new List<State>();
if (usualCondition)
states.Add(GetCustomState());
if (veryRareCondition)
states.Add(GetAnotherState());
return states;
}
void AnalyzeState()
{
....
var state = GetStates().SingleOrDefault();
....
}Not knowing the specifics of the 'SingleOrDefault' method's behavior, the developer intended the 'state' variable to store the value returned from the 'GetStates' method when the collection contains only one element, or 'default' otherwise (the collection has no elements or more than one element). However, if both the usual and the very rare condition (the variables 'usualCondition' and 'veryRareCondition') happen to be true at the same time, 'GetStates' will return a collection of two elements. In this case, an exception will be thrown instead of writing the 'default' value to 'state'.
The 'AnalyzeState' method can be fixed in the following way:
void AnalyzeState()
{
....
var states = GetStates();
var state = states.Count() == 1 ? states.First()
: default;
....
}This diagnostic is classified as:
V3167. Parameter of 'CancellationToken' type is not used inside function's body.
The analyzer found an unused parameter of the 'CancellationToken' type received by the method.
Objects of this type are usually used in cases when it may be necessary to interrupt an operation in a parallel thread. A method that receives 'CancellationToken' as a parameter can access it at runtime to terminate prematurely if needed. In some cases, the token is also passed as an argument when calling other methods to allow them to terminate prematurely.
It looks suspicious when the method receives 'CancellationToken' but does not use it. Perhaps, this parameter was supposed to cancel the operation if needed. However, the parameter became redundant due to a typo. As a result, the application might not respond promptly to cancellation requests from the user.
Consider an example:
public List<SomeStruct> LoadInfo(string[] keys, CancellationToken token)
{
List<SomeStruct> result = new List<SomeStruct>();
foreach (string key in keys)
{
SomeStruct item = LoadHugeData(key);
result.Add(item);
}
return result;
}This method performs sequential loading of large amounts of data. It makes sense to implement a potential way of interrupting such an operation. Despite this, the 'token' parameter is not used. Such code looks suspicious and is highlighted by the analyzer as a potential erroneous place. Here is a possible fixed version of this code:
public List<SomeStruct> LoadInfo(string[] keys, CancellationToken token)
{
List<SomeStruct> result = new List<SomeStruct>();
foreach (string key in keys)
{
if(token.IsCancellationRequested)
break;
SomeStruct item = LoadHugeData(key);
result.Add(item);
}
return result;
}Sequential data download can now be interrupted. If you receive a request to cancel the operation, the 'LoadInfo' method stops loading the elements and returns what was loaded before the operation cancellation.
Look at another example:
void ExecuteQuery(CancellationToken token = default)
{ .... }
public void ExecuteSomeActions(CancellationToken token)
{
....
ExecuteQuery();
....
}The 'executeQuery' method can take a value of the 'CancellationToken' type as an argument. However, when called in the 'ExecuteSomeActions' method, the 'token' parameter is not passed to the 'executeQuery' method. As a result, such code may not respond promptly to undo actions.
To fix the problem, one has to pass 'token' as an argument to the 'executeQuery' method:
ExecuteQuery(token);Note that the analyzer will not issue warnings in cases where the method is marked with the 'override' modifier or is part of an interface implementation. This exception is due to the fact that when inheriting and overriding, the method signature must contain a parameter of the 'CancellationToken' type, regardless of whether a particular implementation provides for its use. A similar exception relates to virtual methods: the 'CancellationToken' in a declaration may not be intended for the standard implementation, but for derived classes that will override this method.
Also, the warning will not be issued for lambda expressions, since they are often used as event handlers or passed as arguments. In these cases, the function will have to receive a certain set of parameters, even in cases when the function doesn't need parameters for proper execution.
V3168. Awaiting on expression with potential null value can lead to throwing of 'NullReferenceException'.
The analyzer detected a suspicious fragment: the 'await' operator is used with an expression whose value can be a null reference. When using 'await' with 'null', an exception of the 'NullReferenceException' type will be thrown.
Consider an example:
async void Broadcast(....)
{
await waiter.GetExplorerBehavior()?.SaveMatches();
....
}
ExplorerBehavior GetExplorerBehavior()
{
return _state == NodeState.HandShaked ? _Node.Behavior : null;
}In the 'Broadcast' method, the 'await' operator is used with an expression that may have the 'null' value in certain cases. The 'GetExplorerBehaviour' method returns 'null' under some circumstances. 'null' might later get into 'Broadcast'.
As a result, when using the 'await' operator with a 'null' expression we'll get 'NullReferenceException'.
As a fix, one can add an additional 'null' check to the 'Broadcast' method:
async void Broadcast(....)
{
var task = waiter.GetExplorerBehavior()?.SaveMatches();
if (task != null)
await task;
....
}The analyzer also warns about cases when a potentially null reference is passed to a method, constructor, or property, within which it can be used with 'await'. Example:
void ExecuteActionAsync(Action action)
{
Task task = null;
if (action != null)
task = new Task(action);
ExecuteTask(task); // <=
....
}
async void ExecuteTask(Task task)
{
....
await task;
}In this fragment, 'await' is used with the 'task' parameter. A potentially null reference is passed to the parameter. Here is a fixed code fragment of the 'ExecuteActionAsync' method:
void ExecuteActionAsync(Action action)
{
Task task = null;
if (action != null)
{
task = new Task(action);
ExecuteTask(task);
}
....
}This diagnostic is classified as:
You can look at examples of errors detected by the V3168 diagnostic. |
V3169. Suspicious return of a local reference variable which always equals null.
The analyzer detected that the 'return' statement returns a local variable that always equals null. This may happen because of a logical error or when someone forgot to assign a correct value to the variable.
Below is an example of a logical error that causes the 'GetRootNode' method to return 'null':
public Node GetRootNode(Node node)
{
Node parentNode = node.Parent == null ? node : node.Parent;
while (parentNode != null)
{
parentNode = parentNode.Parent;
}
return parentNode;
}Here the 'while' loop executes until the 'parentNode' variable's value is 'null'. To fix the method's behavior, correct the while loop's expression. Instead of 'parentNode', the expression must compare the 'parentNode.Parent' property to 'null'. Here is the fixed 'GetRootNode' method's code:
public Node GetRootNode(Node node)
{
Node parentNode = node.Parent == null ? node : node.Parent;
while (parentNode.Parent != null)
{
parentNode = parentNode.Parent;
}
return parentNode;
}V3170. Both operands of the '??' operator are identical.
The analyzer has found that both operands used in either the '??'' or '??=' operator are the same. Most likely, this operation is erroneous. Such errors may occur as a result of a typo or inattentive copy-paste.
Consider an example of a similar error that appears when using the '??' operator:
string SomeMethod()
{
String expr1 = Foo();
String expr2 = Bar();
....
return expr1 ?? expr1;
}'SomeMethod' will always return the same value whether the 'expr1' variable is 'null' or not. Therefore, the 'expr1 ?? expr1' expression in 'SomeMethod' does not make sense. Most likely, there was a typo, and the correct version of the expression should look like this:
return expr1 ?? expr2;A similar error can be made when using the '??=' operator:
void SomeMethod()
{
String expr1 = Foo();
String expr2 = Bar();
....
expr1 ??= expr1;
....
DoSmt(expr1);
}In this case, an error similar to the one described in the previous example was made. Fixed code:
expr1 ??= expr2;This diagnostic is classified as:
V3171. Potentially negative value is used as the size of an array.
The analyzer detected that a potentially negative value of a variable or expression might be used as the size of an array that is created.
Consider an example:
void ProcessBytes(byte[] bytes)
{
int length = BitConverter.ToUInt16(bytes, 0);
int[] newArr = new int[length - 2];
....
}The value returned by the 'ToUInt16' method and assigned to the 'length' variable may be zero. This will happen if the first two bytes in the 'bytes' array are zero. This way, when you create the 'newArr' array, its length will be a negative value. This will result in the 'OverflowException' type exception.
Fixed version of the 'ProcessBytes' method with an additional check might look like this:
void ProcessBytes(byte[] bytes)
{
int length = BitConverter.ToUInt16(bytes, 0);
if (length < 2)
return;
int[] newArr = new int[length - 2];
....
}Here is another code example. When you call the 'SubArray' method with a certain values of input arguments, a negative value can be used as a length of the array:
public byte[] GetSubArray(byte[] bytes)
{
return bytes.SubArray(4, 2);
}
public static T[] SubArray<T>(this T[] arr, int index, int length)
{
if (length < 0)
throw new Exception($"Incorrect length value: {length}.");
if (index < 0)
throw new Exception($"Incorrect index value: {index}.");
if (arr.Length < index + length)
length = arr.Length - index;
var subArr = new T[length];
Array.Copy(arr, index, subArr, 0, length);
return subArr;
}Here is the problem with the 'SubArray' method. It does not take into account cases when the length of the 'arr' array may be less than the value in the 'index' variable. In this case, the 'length' variable will get a negative value. Assume that the length of the 'arr' array is 3, the value of the 'index' variable is 4. The 'length' variable will get the value of -1 during the method's execution. There will be an attempt to create an array with a negative size.
The fixed version of the 'SubArray' method may look like this:
public static T[] SubArray<T>(this T[] arr, int index, int length)
{
if (length < 0)
throw new Exception($"Incorrect length value: {length}.");
if (index < 0 || arr.Length <= index)
throw new Exception($"Incorrect index value: {index}.");
if (arr.Length < index + length)
length = arr.Length - index;
var subArr = new T[length];
Array.Copy(arr, index, subArr, 0, length);
return subArr;
}This diagnostic is classified as:
V3172. The 'if/if-else/for/while/foreach' statement and code block after it are not related. Inspect the program's logic.
The analyzer found a possible error. The 'if/if-else/for/while/foreach' statement and the code block ('{ .... }') after it are not related.
Consider a synthetic example:
if (a == 1) DoSmt();
{
DoSmt2();
}At first glance, the block seems to be executed if the condition is true, in fact, it is not so. The block is always executed, regardless of the condition. This may mislead the programmer.
Let's consider other code examples that trigger the analyzer:
if (a == 2) Nop(); else Nop2();
{
Nop3();
}
if (a == 3) Nop();
else Nop2();
{
Nop3();
}
foreach (var item in query) DoSmt1();
{
DoSmt2();
}The analyzer does not issue a warning if the lines with the statement and the unrelated code block are non-contiguous:
if (a == 7) DoSmt();
// this is a block for initializing MyClass fields
{
....
}If you get such a warning, and it is false, you can tell the analyzer about it by adding an empty line between the statement and the block.
Also, the diagnostic does not issue a warning if the statement body is empty (';'). The diagnostic rule V3007 is responsible for this.
if (a == 3) ;
{
DoSmt();
}This diagnostic is classified as:
V3173. Possible incorrect initialization of variable. Consider verifying the initializer.
The analyzer detected a potential error that a variable or property initialization is missed.
Consider the example:
class A
{
int field1;
string field2;
string field3;
....
public void foo(int value)
{
field1 = value;
field2 = // <=
field3 = GetInitialization(value);
}
}In this case, the developer postponed the 'field2' initialization hoping that the code wouldn't compile and thus would remind of a missed initialization. But the code compiled successfully. 'field2' is assigned the value of 'field3'.
A similar situation may occur during a declaration, such as:
int b, c;
int a =
b = c = 2;This code looks suspicious. It is unclear what the author wanted to use to initialize the 'a' variable.
The analyzer will not issue a warning in a number of cases where it is clear that the code is written this way on purpose.
For example, there is indentation relative to the first line:
var1 =
var2 = 100;Here is another example with no indentation, but the value is written in several variables in the same way:
var1 =
var2 =
var3 =
var4 = 100;V3174. Suspicious subexpression in a sequence of similar comparisons.
The analyzer has detected a code fragment that most likely contains a typo. The chain of same-type comparisons of class members has an expression different from others. This expression compares members with different names, while the rest of the expressions compare members with the same names.
Look at the example:
public void Foo(TestClass a, TestClass b)
{
if (a.x == b.x && a.y == b.y && a.z == b.y)
{
....
}
}In this fragment, expression 'a.z == b.y' is different from the rest expressions in the chain. Most likely, it's a typo that appeared when the developer edited a copied text. The correct code which won't look suspicious for the analyzer:
public void Foo(TestClass a, TestClass b)
{
if (a.x == b.x && a.y == b.y && a.z == b.z)
{
....
}
}The analyzer issues a warning when the length of the comparison chain is more than two expressions.
This diagnostic is classified as:
V3175. Locking operations must be performed on the same thread. Using 'await' in a critical section may lead to a lock being released on a different thread.
The analyzer found a code fragment that likely contains an error. This code fragment is a critical section formed by calls of the 'Monitor' class methods. This section contains the 'await' operator. Using this scenario may lead to the 'SynchronizationLockException' type exception.
Example:
static object _locker = new object();
public async void Foo()
{
Monitor.Enter(_locker);
await Task.Delay(TimeSpan.FromSeconds(5));
Monitor.Exit(_locker);
}The 'Monitor.Enter' method receives the '_locker' object as a parameter and acquires a lock for this object. The lock limits access to the code written after the method call. The lock applies to all threads except for the one, on which the lock was acquired. The 'Monitor.Exit' method call removes the lock, releases the locked object, and allows access to the next thread. A code fragment limited in this way is called a critical section.
The example above uses the 'await' operator after the 'Monitor.Enter' method call. Most likely, after 'await' is applied to an operation, subsequent code lines will be executed on a different thread. In this case, the critical section will be opened and closed on different threads. This will lead to the 'SynchronizationLockException' type exception.
The correct code, which will not arouse the analyzer's suspicion, may look like this:
static SemaphoreSlim _semaphore = new SemaphoreSlim(1);
private static async void Foo()
{
_semaphore.Wait();
await Task.Delay(TimeSpan.FromSeconds(1));
_semaphore.Release();
}To implement the locking mechanism, the example above uses the internal counter of a 'SemaphoreSlim' class's instance. Calling 'Wait' decreases the counter's value by 1. If the counter equals 0, subsequent 'Wait' calls will block the calling threads until the counter's value is greater than zero. The counter's value is incremented with each 'Release' call — no matter on which thread this method was called.
If, when creating a 'SemaphoreSlim' type object, you pass 1 to the constructor, you will form something similar to a critical section between the 'Wait' and 'Release' calls. Inside this section, you will be able to use 'await' without the risk of getting the 'SynchronizationLockException' type exception.
This diagnostic is classified as:
V3176. The '&=' or '|=' operator is redundant because the right operand is always true/false.
The analyzer has detected a code fragment where the right operand of the '&=' or '|=' operator always has the same value.
Example:
void Foo(bool status)
{
....
bool currentStatus = ....;
....
if(status)
currentStatus &= status;
....
}In 'then' block of the 'if' construct, a compound assignment operation is performed. The 'currentStatus' variable will take a value equal to the result of the 'currentStatus & status' logical operation. Based on the condition, 'status' will always be 'true', which makes it pointless to use the '&=' operator — the value of 'currentStatus' will not change after the assignment.
If the right-hand operand is always 'false', the use of the '&=' operator is also pointless. In such cases, it can be replaced with a regular assignment.
The use of the '|=' operator is also pointless if its right operand always has the same value:
- if the value is 'false', the values of the operands remain unchanged;
- if the value is always 'true', then it will be assigned to the left operand regardless of its original value.
The cases described above may indicate both redundant use of '&=' and '|=' operators and an error in the application's logic.
Fixed version of the method described above may look as follows:
void Foo(bool status)
{
....
bool currentStatus = ....;
....
if(status)
currentStatus = status;
....
}This diagnostic is classified as:
V3177. Logical literal belongs to second operator with a higher priority. It is possible literal was intended to belong to '??' operator instead.
The analyzer has detected a code fragment that probably contains a logical error. In a conditional expression, the logical literal stands between '??' and another operator with a higher priority.
The '??' operator has a lower priority than '||', '&&', '|', '^', '&', '!=', '==' operators. If we do not use parentheses that define the evaluation of conditions, we may get an error similar to the one below:
class Item
{
....
public bool flag;
....
}
void CheckItem(Item? item)
{
if (item?.flag ?? true || GetNextCheck(item))
{
....
}
return;
}Since the '??' operator has a lower priority than '||', the 'true || GetNextCheck()' expression will be evaluated first. It always returns 'true', while the 'GetNextCheck' method has no effect on the result.
In this case, we can solve the problem by using parentheses for the first part of the expression:
class Item
{
....
public bool flag;
....
}
void CheckItem(Item? item)
{
if ((item?.flag ?? true) || GetNextCheck(item))
{
....
}
return;
}In the corrected version of the condition, the 'item?.flag ?? true' expression is first evaluated. Only then the '||' operator is evaluated.
This diagnostic is classified as:
You can look at examples of errors detected by the V3177 diagnostic. |
V3178. Calling method or accessing property of potentially disposed object may result in exception.
The analyzer detected the method call or accessing the property of an object for which the 'Dispose' method or its equivalent was called earlier. It may result in the exception thrown.
Let's look at the example:
public void AppendFileInformation(string path)
{
FileStream stream = new FileStream(path,
FileMode.Open,
FileAccess.Read);
....
stream.Close();
....
if (stream.Length == stream.Position)
{
Console.WriteLine("End of file has been reached.");
....
}
....
}The condition checks if the entire file has been read. The check compares the current position of the stream and the stream length. But accessing the 'Length' property results in 'ObjectDisposedException'. The reason for exception is that the 'Close' method is called for the 'stream' variable above its condition. For the 'FileStream' class, the 'Close' method is equivalent to the 'Dispose' method. Therefore, the 'stream' resources are released.
Let's examine the correct implementation of 'AppendFileInformation':
public void AppendFileInformation(string path)
{
using (FileStream stream = new FileStream(path,
FileMode.Open,
FileAccess.Read))
{
....
if (stream.Length == stream.Position)
{
Console.WriteLine("End of file has been reached.");
}
....
}
....
}For the method to operate correctly, the 'using' statement is better. In this case:
- at the end of the scope defined by the 'using' statement, the 'stream' resources are released automatically;
- outside the boundaries of the 'using' statement, the object cannot be accessed. It gives extra protection against exceptions of the 'ObjectDisposedException' type;
- even if an exception occurs in the 'using' statement, the resources are still released.
One more error may be as following:
public void ProcessFileStream(FileStream stream)
{
....
bool flag = CheckAndCloseStream(stream);
AppendFileInformation(stream);
....
}
public bool CheckAndCloseStream(FileStream potentiallyInvalidStream)
{
....
potentiallyInvalidStream.Close();
....
}
public void AppendFileInformation(FileStream streamForInformation)
{
....
if (streamForInformation.Length == streamForInformation.Position)
{
Console.WriteLine("End of file has been reached.");
}
....
}The resources of an object (referenced by the 'stream' variable) are released after we call 'CheckAndCloseStream' in the 'ProcessFileStream' method. The 'stream' variable is then passed to the 'AppendFileInformation' method. Accessing the 'Length' property inside the method results in 'ObjectDisposedException'.
The correct implementation of 'ProcessFileStream' would be as following:
public void ProcessFileStream(FileStream stream)
{
....
AppendFileInformation(stream);
bool flag = CheckAndCloseStream(stream);
....
}The 'CheckAndCloseStream' method call swapped places with the 'AppendFileInformation' method call. As a result, the 'stream' resources are released after other actions are performed. Therefore, no exception is thrown.
This diagnostic is classified as:
V3179. Calling element access method for potentially empty collection may result in exception.
The analyzer detected that a potentially empty collection has a method call that throws an exception if there are no elements in the collection.
To better understand this, let's look at the following example:
public static bool ComparisonWithFirst(List<string> list,
string strForComparison)
{
string itemForComparison = null;
if (list != null && !list.Any())
{
itemForComparison = list.First();
}
....
}An attempt to access the first element from the collection results in 'InvalidOperationException'. Inside the then branch the collection is empty, because the 'list' has been checked for containing no elements.
Let's look at the fixed version:
public static bool ComparisonWithFirst(List<string> list,
string strForComparison)
{
string itemForComparison = null;
if (list != null && list.Any())
{
itemForComparison = list.First();
}
....
}If we pass an empty collection to the method that doesn't expect this, we can get a similar error.
public static void ProcessList(List<string> list)
{
if (list.Any())
return;
CompareFirstWithAll(list);
}
public static void CompareFirstWithAll(List<string> list)
{
string itemForComparison = list.First();
....
}The 'ProcessList' method contains a typo, so the empty 'list' collection is passed to the 'CompareFirstWithAll' method. The 'CompareFirstWithAll' method does not expect to receive an empty collection.
Let's look at the fixed version:
public static void ProcessList(List<string> list)
{
if (!list.Any())
return;
CompareFirstWithAll(list);
}This diagnostic is classified as:
V3180. The 'HasFlag' method always returns 'true' because the value '0' is passed as its argument.
The analyzer has detected the call of the 'HasFlag' method, that always returns 'true' because the argument value is '0'.
Let's look at the following example:
public enum RuntimeEvent
{
Initialize = 1,
BeginRequest = 2,
BeginSessionAccess = 4,
ExecuteResource = 8,
EndSessionAccess = 16,
EndRequest = 32
}
public void FlagsTest()
{
....
RuntimeEvent support = GetSupportEvent();
....
Assert.True(support.HasFlag( RuntimeEvent.EndRequest
& RuntimeEvent.BeginRequest),
"End|Begin in End|SessionEnd");
....
}'support' is an enumeration instance of the 'RuntimeEvent' type. The variable gets the value after the 'GetSupportEvent' method is called. After initialization, 'support' is checked for the flag with a bitwise 'AND' value for 'EndRequest' and 'BeginRequest'.
A check like this makes no sense, because the expression '32 & 2' is zero. If the 'HasFlag' argument is zero, the result of the method call is always 'true'. Therefore, the test passes regardless of the 'support' value. Such code looks suspicious.
The correct version of the check might look as follows:
public void FlagsTest()
{
....
RuntimeEvent support = GetSupportEvent();
....
Assert.True(support.HasFlag( RuntimeEvent.EndRequest
| RuntimeEvent.BeginRequest),
"End|Begin in End|SessionEnd");
....
}This diagnostic is classified as:
You can look at examples of errors detected by the V3180 diagnostic. |
V3181. The result of '&' operator is '0' because one of the operands is '0'.
The analyzer has detected that there is a bitwise 'AND' (&) operation with an operand equal to 0. A code fragment may contain incorrect operator or operand.
Example:
public enum TypeAttr
{
NotPublic = 0x0,
Public = 0x1,
NestedPublic = 0x2,
NestedPrivate = 0x3
}
public static bool IsNotPublic(TypeAttr type)
{
return (type & TypeAttr.NotPublic) == TypeAttr.NotPublic;
}The 'IsNotPublic' method checks if the argument of the 'TypeAttr' type has the 'NotPublic' flag.
Such a method of checking doesn't have any practical sense since the 'TypeAttr.NotPublic' flag has a zero value, which means using this flag as an operand of the '&' operator always results in a zero value. Thus, in the presented implementation, we always get the true condition.
The correct implementation of the check may look as follows:
public static bool IsNotPublic(TypeAttr type)
{
return type == TypeAttr.NotPublic;
}The analyzer will also issue a warning for the use of the operand that is '0' with the '&=' operator. This code also looks questionable, because if one of the operands is '0', the result of the expression is also '0'.
This diagnostic is classified as:
You can look at examples of errors detected by the V3181 diagnostic. |
V3182. The result of '&' operator is always '0'.
The analyzer has detected the use of bitwise 'AND' (&) with operands that always make the result of the operation equal to 0. A code fragment may contain incorrect operator or operand.
Example:
public enum FlagType : ulong
{
Package = 1 << 1,
Import = 1 << 2,
Namespace = 1 << 3,
....
}
....
FlagType bitMask = FlagType.Package & FlagType.Import;Here, 'bitMask' is the 'FlagType' enumeration type object in which the bit mask is created.
This method of combining enumeration flags is incorrect. Bitwise 'AND' (&) between the 'FlagType.Package' and 'FlagType.Import' values are equal to zero, since these bit flags do not contain ones in the corresponding bits.
The correct implementation of combining flags may look as follows:
FlagType bitMask = FlagType.Package | FlagType.Import;This diagnostic is classified as:
You can look at examples of errors detected by the V3182 diagnostic. |
V3183. Code formatting implies that the statement should not be a part of the 'then' branch that belongs to the preceding 'if' statement.
The analyzer detected an instruction that belongs to an 'if' statement. However, the code formatting does not correspond with the logic of the code execution, so the code may contain an error.
Example:
string GetArgumentPositionStr(Argument argument)
{
if (argument.first)
return "first";
if (argument.second)
if (argument.third)
return "third";
return String.Empty;
}The example above lacks the 'then' branch for the 'if (argument.second)' conditional expression. That's why the incorrect code fragment works just as the following one:
if (argument.second)
{
if (argument.third)
return "third";
}The fixed code:
string GetArgumentPositionStr(Argument argument)
{
if (argument.first)
return "first";
if (argument.second)
return "second";
if (argument.third)
return "third";
return String.Empty;
}This diagnostic is classified as:
V3184. The argument's value is greater than the size of the collection. Passing the value into the 'Foo' method will result in an exception.
The analyzer has detected that the index passed to the method is greater than or equal to the number of elements of the collection. This can cause an exception.
Let's look at the following example to delve deeper into this issue:
public static void Foo()
{
List<string> list = new List<string>(20) { "0", "1", "2" };
list.RemoveAt(list.Count);
}If we try to remove an element, an exception is thrown. The 'RemoveAt' method throws an exception when the first argument is greater than or equal to the number of elements in the collection.
Here's the fixed version of the code:
public static void Foo()
{
List<string> list = new List<string>(20) { "0", "1", "2" };
list.RemoveAt(list.Count - 1);
}Let's look at a more complex example of an error:
public static void ProcessList()
{
List<string> list = new List<string>(20) { "0", "1", "2" };
string str = GetStringOrNull(list, list.Count); // <=
}
public static string GetStringOrNull(List<string> list, int index)
{
if (index > list.Count)
return null;
return list.ElementAt(index);
}The 'list' collection is passed to the 'GetStringOrNull' method, which contains an error in the condition of the 'if' statement. The method should return 'null' when such arguments are passed to it, but an exception is thrown due to the error.
The fixed code:
public static void ProcessList()
{
List<string> list = new List<string>(20) { "0", "1", "2" };
string str = GetStringOrNull(list, list.Count);
}
public static string GetStringOrNull(List<string> list, int index)
{
if (index >= list.Count)
return null;
return list.ElementAt(index);
}This diagnostic is classified as:
V3185. An argument containing a file path could be mixed up with another argument. The other function parameter expects a file path instead.
The analyzer has detected a strange argument passed to the method as a file path. The argument may have been mixed up with another argument of this method.
Example:
void AppendText(FileInfo file, string fileContent)
{
var filePath = file.FullName;
File.AppendAllText(fileContent, filePath);
}The 'AppendText' method above is used to add the 'fileContent' string to a file. The file path from 'file.FullName' is written to the 'filePath' variable. After that, 'filePath' and 'fileContent' are used as arguments for the 'File.AppendAllText' method that adds text to the file. This method takes the path to the file as the first argument, and as the second argument – a string to be written. However, in the example above, these two arguments are mixed up. The result of using this method depends on the contents of 'fileContent':
- If 'fileContent' does not fit the file path format, the 'System.IOException' exception is thrown;
- Otherwise, a new file is created and the value from the 'filePath' variable is written to it.
To solve this problem, you need to rearrange the arguments of the 'File.AppendAllText' method in the correct order:
void AppendText(FileInfo file, string fileContent)
{
var filePath = file.FullName;
File.AppendAllText(filePath, fileContent);
}This diagnostic is classified as:
V3186. The arguments violate the bounds of collection. Passing these values into the method will result in an exception.
The analyzer has detected a suspicious method call that performs operations on a collection fragment. The arguments passed to the method are incorrect — they violate the bounds of the collection. As a result, an exception is thrown.
Consider an example:
int[] arr = new int[] { 0, 1, 3, 4 };
var indexOfOdd = Array.FindIndex(arr,
startIndex: 2,
count: 3,
x => x % 2 == 1);The 'FindIndex' method gets the following arguments:
- 'arr' is an array where an element index will be searched;
- 'startIndex: 2' is an element from which the search starts;
- 'count: 3' is a number of items to be iterated, starting from 'startIndex: 2';
- 'x => x %2 == 1' is a predicate containing a condition to compare the element.
The method returns either the index of the first element where the predicate is true, or '-1'.
The 'arr' array consists of four elements, so the index of the last element is '3'. The developer is trying to access the element with the '4' index. In this case, the corresponding exception will be thrown.
The correct implementation of the element index search may look as follows:
int[] arr = new int[] { 0, 1, 3, 4 };
var indexOfOdd = Array.FindIndex(arr,
startIndex: 2,
count: 2,
x => x % 2 == 1);Alternatively, you can use the method overloading that does not specify the 'count' parameter. In this case, the iteration will always end at the last element of the collection:
int[] arr = new int[] { 0, 1, 3, 4 };
var indexOfOdd = Array.FindIndex(arr,
startIndex: 2,
x => x % 2 == 1);Also, we can iterate the collection in reverse order. For example:
int[] arr = new int[] { 0, 1, 3, 4 };
var lastEvenInd = Array.FindLastIndex(arr,
startIndex: 1,
count: 3,
x => x % 2 == 0);Here the arguments perform the same roles, but the elements will be iterated in reverse order. The search area is formed from an element with the '1' index and two preceding elements. Thus, the method will need to access the '-1' index. Since this behavior is incorrect, an exception will be thrown.
In this case, the correct implementation of the index search may look as follows:
int[] arr = new int[] { 0, 1, 3, 4 };
var lastEvenInd = Array.FindLastIndex(arr,
startIndex: 1,
count: 2,
x => x % 2 == 0);Let's consider a more complex example:
var list = new List<int> { 2, 3, 5, 7 };
var index = GetFirstEvenIndex(list, 1, list.Count);
....
public int GetFirstEvenIndex(List<int> lst, int startIndex, int count)
{
return lst.FindIndex(startIndex, count, x => x % 2 == 0);
}Here are the parameters of the 'GetFirstEvenIndex' method:
- 'lst' is a collection where the index of the first even number in the specified range is searched;
- 'startIndex' is an element from which the search starts;
- 'count' is a number of elements in the processed range.
Here the search range is formed from the element with the '1' index to the element with the 'list.Count' index inclusive. Thus, the method will need to access the index placed out of bounds. Since this behavior is incorrect, an exception will be thrown.
The correct code for passing arguments to the method may look as follows:
var list = new List<int> { 2, 3, 5, 7 };
var startIndex = 1;
var index = GetFirstEvenIndex(list, startIndex, list.Count - startIndex);This diagnostic is classified as:
V3187. Parts of an SQL query are not delimited by any separators or whitespaces. Executing this query may lead to an error.
The analyzer has detected that a space or some other separator character between words may be missing in a SQL query. This typo could have been caused by concatenation, interpolation, or a call to the 'String.Format' method to get a SQL query string.
Example:
public Customer GetCustomerData(ulong id)
{
string query = "SELECT c.Email, c.Phone, " +
"c.firstName, c.lastName FROM customers c" + // <=
$"WHERE customers.id = {id}";
var sqlCommand = new SqlCommand(query);
....
}The fragment shows how the SQL query is created to retrieve customer data by customer ID. Note that the query was received by concatenating two strings with no space at the junction. Because of this error, the SQL query contains a typo — "cWHERE" — which makes it invalid.
To fix the problem, you need to add the missing space:
public Customer GetCustomerData(ulong id)
{
string query = "SELECT c.Email, c.Phone, " +
"c.firstName, c.lastName FROM customers c " +
$"WHERE customers.id = {id}";
var sqlCommand = new SqlCommand(query);
....
}V3188. Unity Engine. The value of an expression is a potentially destroyed Unity object or null. Member invocation on this value may lead to an exception.
The analyzer detected dereference of a potentially destroyed or 'null' object. This may cause an exception to be thrown.
Look at the following example:
void ProcessTransform(UnityEngine.Transform transform)
{
if (transform == null)
{
var position = transform.position;
....
}
}Here, the 'position' property is accessed when 'transform' is either a destroyed object or equal to 'null'. Both options cause an exception to be thrown.
In this case, changing the comparison operator can fix the error:
void ProcessTransform(UnityEngine.Transform transform)
{
if (transform != null)
{
var position = transform.position;
....
}
}V3189. The assignment to a member of the readonly field will have no effect when the field is of a value type. Consider restricting the type parameter to reference types.
The analyzer has detected that a value is assigned to the member of the 'readonly' field, and the field may be of a value type. If the field is of a value type, no change to the field member will occur.
This error occurs because value types directly contain their own data. If the field type is explicitly defined as value type, the compiler will find such an error. However, if the field type is a generic parameter, the code will compile successfully. Because of this, there may be a situation when something is written to a member of the 'readonly' field, but the member's value does not change.
Example:
private interface ITable
{
int Rows { get; set; }
}
private class Table<T> where T : ITable
{
private readonly T _baseTable;
public void SetRows(int x)
{
_baseTable.Rows = x; // <=
}
}The class has the '_baseTable' field, the type of which is a generic parameter. In the 'SetRows' method, the argument's value is assigned to the 'Rows' property of this field.
Below is an example of using this class:
private struct RelationTable : ITable
{
public int Rows { get; set; }
}
....
static void DoSomething()
{
Table<RelationTable> table = new Table<RelationTable>();
table.SetRows(10);
}In this case, calling 'SetRows' will not affect the value of the 'Rows' property in any way. To protect the code from such errors, you need to add type constrains:
private interface ITable
{
int Rows { get; set; }
}
private class Table<T> where T : class, ITable
{
private readonly T _baseTable;
public void SetRows(int x)
{
_baseTable.Rows = x;
}
}V3190. Concurrent modification of a variable may lead to errors.
The analyzer has detected a possible error in the code: several threads change a shared resource without synchronization.
Let's look at the example:
ConcurrentBag<String> GetNamesById(List<String> ids)
{
String query;
ConcurrentBag<String> result = new();
Parallel.ForEach(ids, id =>
{
query = $@"SELECT Name FROM data WHERE id = {id}";
result.Add(ProcessQuery(query));
});
return result;
}The 'GetNamesById' method returns names based on the list of identifiers. The 'Parallel.ForEach' method processes all the elements of the 'ids' collection for this purpose. The method creates and executes an SQL query for each element.
The problem is that the captured local variable 'query' is a shared resource of threads executing in 'Parallel.ForEach'. Different threads will access the same object asynchronously. This may result in incorrect program behavior.
Below is a description of a possible error:
- In the first thread, an SQL query with an 'id' equal to 42 is written to the 'query' variable. This value should then be passed to 'ProcessQuery'.
- In the second thread, a new SQL query with an 'id' equal to 12 is written to 'query'.
- Both threads call 'ProcessQuery' using the 'query' value with 'id' equal to 12.
- As a result, 'ProcessQuery' is called twice with the same value. In this case, the value assigned in the first thread is lost.
The correct method implementation may look like this:
ConcurrentBag<String> GetNamesById(List<String> ids)
{
ConcurrentBag<String> result = new();
Parallel.ForEach(ids, id =>
{
String query = $@"SELECT Name FROM data WHERE id = {id}";
result.Add(ProcessQuery(query));
});
return result;
}Here, each thread handles its own 'query' variable. This code causes no issues since threads do not share resources.
Look at another example:
int CountFails(List<int> ids)
{
int count = 0;
Parallel.ForEach(ids, id =>
{
try
{
DoSomeWork(id);
}
catch (Exception ex)
{
count++;
}
});
return count;
}The 'CountFails' method counts the exceptions when executing operations on the 'ids' collection elements. There is also an unsynchronized access to a shared resource in this code. The increment and decrement operations are not atomic, so the correct exception counting is not guaranteed in this case.
The correct method implementation may look like this:
int CountFails(List<int> ids)
{
int count = 0;
Parallel.ForEach(ids, id =>
{
try
{
DoSomeWork(id);
}
catch (Exception ex)
{
Interlocked.Increment(ref count);
}
});
return count;
}The 'Interlocked.Increment' method is used for correct counting. The method increments a variable atomically.
This diagnostic is classified as:
V3191. Iteration through collection makes no sense because it is always empty.
The analyzer has detected an attempt to iterate through an empty collection. This operation makes no sense: probably, there is an error in the code.
Let's look at the example:
private List<Action> _actions;
....
public void Execute()
{
var remove = new List<Action>();
foreach (var action in _actions)
{
try
{
action.Invoke();
}
catch (Exception ex)
{
Logger.LogError(string.Format("Error invoking action:\n{0}", ex));
}
}
foreach (var action in remove)
_actions.Remove(action);
}The 'Execute' method invokes delegates from the '_actions' list one by one. It also catches and logs errors that occur during the method execution. In addition to the main loop, there is another one at the end of the method. The loop should remove the delegates that are stored in the 'remove' collection from the '_actions' list.
The issue is that the 'remove' collection will always be empty. It is created at the beginning of the method, but is not filled during the method's execution. Thus, the last loop will never be executed.
The correct method's implementation may look like this:
public void Execute()
{
var remove = new List<Action>();
foreach (var action in _actions)
{
try
{
action.Invoke();
}
catch (Exception ex)
{
Logger.LogError(string.Format("Error invoking action:\n{0}", ex));
remove.Add(action);
}
}
foreach (var action in remove)
_actions.Remove(action);
}Now we add the delegates that caused exceptions to the 'remove' collection, so that we can remove them later.
The analyzer may issue a warning for a method call that iterates through a collection.
Look at another example:
int ProcessValues(int[][] valuesCollection,
out List<int> extremums)
{
extremums = new List<int>();
foreach (var values in valuesCollection)
{
SetStateAccordingToValues(values);
}
return extremums.Sum();
}The 'ProcessValues' method takes arrays of numbers for processing. In this case, we are interested in the 'extremums' collection: it is created empty and is not filled during the method execution. 'ProcessValues' returns the result of calling the 'Sum' method on the 'extremums' collection. The code looks wrong because calling 'Sum' always returns 0.
The correct method's implementation may look as follows:
int ProcessValues(int[][] valuesCollection,
out List<int> extremums)
{
extremums = new List<int>();
foreach (var values in valuesCollection)
{
SetStateAccordingToValues(values);
extremums.Add(values.Max());
}
return extremums.Sum();
}V3192. Type member is used in the 'GetHashCode' method but is missing from the 'Equals' method.
The analyzer has detected a possible error: a class member is missing from the 'Equals' method but is used in the 'GetHashCode' method.
Look at the following code:
public class UpnpNatDevice
{
private EndPoint hostEndPoint;
private string serviceDescriptionUrl;
private string controlUrl;
public override bool Equals(object obj)
{
if (obj is UpnpNatDevice other)
{
return hostEndPoint.Equals(other.hostEndPoint)
&& serviceDescriptionUrl == other.serviceDescriptionUrl;
}
return false;
}
public override int GetHashCode()
{
return hostEndPoint.GetHashCode()
^ controlUrl.GetHashCode()
^ serviceDescriptionUrl.GetHashCode();
}
}In this example, the 'controlUrl' field is missing from the 'Equals' method but is used in 'GetHashCode'. There can be two reasons:
- The developers may have forgotten about the comparison of 'controlUrl' in the 'Equal' method.
- The developers decided not to use the 'controlUrl' field in the 'Equals' method.
Both reasons lead to the same problem — the 'GetHashCode' method can return different values for two equivalent objects. According to the Microsoft documentation, the 'GetHashCode' method should return equal hash codes for any two equal objects. So, call to 'Equals' returns 'True' for these objects.
In this case, the 'Equals' method returns 'True' for two objects with equal 'hostEndPoint' and 'serviceDescriptionUrl' fields. The result of 'GetHashCode' also depends on 'controlUrl'. This can indicate an error. Also, this implementation may negatively affect the correct work with the collections: 'Hashtable', 'Dictionary<TKey,TValue>', etc.
The fixed version:
public override bool Equals(object obj)
{
if (obj is UpnpNatDevice other)
{
return hostEndPoint.Equals(other.hostEndPoint)
&& serviceDescriptionUrl == other.serviceDescriptionUrl
&& controlUrl == other.controlUrl;
}
return false;
}This diagnostic is classified as:
V3193. Data processing results are potentially used before asynchronous output reading is complete. Consider calling 'WaitForExit' overload with no arguments before using the data.
The analyzer has detected that data processing results can be used before all operations of their creation are complete. In this case, an application uses incorrect or incomplete output data.
Look at the example:
public void Run()
{
var process = new Process();
process.StartInfo.FileName = GetProcessFile();
process.StartInfo.UseShellExecute = false;
process.StartInfo.RedirectStandardOutput = true;
StringBuilder data = new StringBuilder();
process.OutputDataReceived +=
(sender, args) => data.AppendLine(args.Data); // <=
process.Start();
process.BeginOutputReadLine();
WriteData(data.ToString()); // <=
}The code runs the process and saves its result to the 'data' variable. Then the collected results are passed to the 'WriteData' method. The 'data.ToString' method may be called before the entire process output has been processed. For example, if the process outputs several strings, not all of them may be added to the 'data' variable by the time 'ToString' is called.
To solve the issue, make sure that reading of the entire process output has been completed. To do this, call the 'WaitForExit' method with no arguments:
public void Run()
{
var process = new Process();
process.StartInfo.FileName = GetProcessFile();
process.StartInfo.UseShellExecute = false;
process.StartInfo.RedirectStandardOutput = true;
StringBuilder data = new StringBuilder();
process.OutputDataReceived +=
(sender, args) => data.AppendLine(args.Data);
process.Start();
process.BeginOutputReadLine();
process.WaitForExit();
WriteData(data.ToString());
}Calling the 'WaitForExit' method in this way returns control only after the output processing is complete. Please note that the 'WaitForExit(Int32)' overload lacks this feature. That is why the following code may work incorrectly:
public void Run()
{
var process = new Process();
....
StringBuilder data = new StringBuilder();
process.OutputDataReceived +=
(sender, args) => data.AppendLine(args.Data); // <=
process.Start();
process.BeginOutputReadLine();
if (process.WaitForExit(3000))
{
WriteData(data.ToString()); // <=
}
else
{
.... // throw timeout error
}
}In this example, getting the value from the 'data' variable is done after the process has closed. However, the reading of the process output may not be complete by the time 'ToString' is called. You can learn more about this behavior in the documentation for the 'WaitForExit' method. To ensure that the processing is completed, call the method with no arguments:
public void Run()
{
var process = new Process();
....
StringBuilder data = new StringBuilder();
process.OutputDataReceived +=
(sender, args) => data.AppendLine(args.Data);
process.Start();
process.BeginOutputReadLine();
if (process.WaitForExit(3000))
{
process.WaitForExit();
WriteData(data.ToString());
}
else
{
.... // throw timeout error
}
}This diagnostic is classified as:
V3194. Calling 'OfType' for collection will return an empty collection. It is not possible to cast collection elements to the type parameter.
The analyzer has detected an issue when calling 'OfType' returns an empty collection. This behavior occurs because it is not possible to cast the type of the collection items to the type on which 'OfType' filters.
Look at the example:
public struct SyntaxToken {....}
public class InvocationExpressionSyntax : ExpressionSyntax {....}
public List<SyntaxToken> GetAllTokens() {....}
public List<ExpressionSyntax> GetAllExpressions() {....}
void ProcessInvocationExpressions()
{
var result = GetAllTokens().OfType<InvocationExpressionSyntax>();
....
}In 'ProcessInvocationExpressions', items of the 'InvocationExpressionSyntax' type are to be handled. For this, the collection is filtered with the 'OfType' method. However, the method is called on a collection with items of the 'SyntaxToken' type. The filtering results in an empty collection, since instances of the 'SyntaxToken' structure cannot be 'InvocationExpressionSyntax'.
In the above example, the method for getting a collection with items of the 'ExpressionSyntax' type has been mistaken for another method. 'GetAllExpressions' should be used instead of 'GetAllTokens'. The correct implementation of 'ProcessInvocationExpressions' is the following:
void ProcessInvocationExpressions()
{
var result = GetAllExpressions().OfType<InvocationExpressionSyntax>();
....
}In this implementation, the collection with items of the 'ExpressionSyntax' type is filtered out. This is the base type for 'InvocationExpressionSyntax'. Therefore, 'ExpressionSyntax' can be cast to 'InvocationExpressionSyntax'. Thus, calling 'OfType' can result in a non-empty collection.
This diagnostic is classified as:
V3195. Collection initializer implicitly calls 'Add' method. Using it on member with default value of null will result in null dereference exception.
The analyzer has detected that during the initialization of the collection, the exception of the 'NullReferenceException' type is thrown. It can occur if the collection is a property/field which is initialized when the object is created.
The example:
class Container
{
public List<string> States { get; set; }
}
void Process(string? message)
{
var container = new Container
{
States = { "Red", "Yellow", "Green" }
};
}In the 'Process' method, the object of the 'Container' type is created. When the object is created, the 'States' list is initialized. During its initialization, the exception of the 'NullReferenceException' type is thrown. It happens because the 'States = { "Red", "Yellow", "Green" }' construct sequentially calls three 'Add' methods on the 'States' property. The object of the 'List<string>' type has the 'null' value by default. Therefore, in this case, the 'Add' method is called on a property that has the 'null' value.
To avoid the exception, assign a value to a property when it is declared:
class Container
{
public List<string> States { get; set; } = new List<string>();
}Now, during the initialization, no exception occurs when the class object is created.
Here is another option:
void Process(string? message)
{
var container = new Container
{
States = new() { "Red", "Yellow", "Green" }
};
}In this case, the object of the list is created using 'new()' first, and then the items are added to it.
This diagnostic is classified as:
V3196. Parameter is not utilized inside the method body, but an identifier with a similar name is used inside the same method.
The analyzer has detected a suspicious code fragment where one of the parameters is not in use. At the same time, the value of a similarly named variable, field, or property is used in the method/constructor body. The value may have been mistakenly used instead of the parameter value of the method.
Let's look at the example:
public GridAnswerData(int questionId, ....)
{
this.QuestionId = QuestionId;
....
}In this constructor, the property is assigned its own value. This is obviously a typo, and the value of the 'questionId' parameter should be assigned to the 'this.QuestionId' property. So, you can resolve the issue this way:
public GridAnswerData(int questionId, ....)
{
this.QuestionId = questionId;
....
}Take a look at another example:
public async void Save(string filePath = null)
{
using(var writer = new StreamWriter(FilePath))
{
....
await writer.WriteAsync(Data);
}
}In this case, the path to the file where some data should be saved is passed to the 'Save' method as the 'filePath' argument. However, the save is done to another file instead, the path to which is returned by the 'FilePath' property. We can assume that the 'FilePath' property should be used only when the 'filePath' argument is set to 'null'. The fixed code may look as follows:
public async void Save(string filePath = null)
{
var path = filePath ?? FilePath;
using(var writer = new StreamWriter(path))
{
....
await writer.WriteAsync(Data);
}
}Even if this assumption is incorrect, an unused parameter in a method signature can be confusing. It may also lead to errors when you use this method in the future.
V3197. The compared value inside the 'Object.Equals' override is converted to a different type that does not contain the override.
The analyzer detected a potential error related to checking an incorrect type in the overridden 'Equals' method.
Look at the example:
private class FirstClass
{
....
public override bool Equals(object obj)
{
SecondClass other = obj as SecondClass; // <=
if (other == null)
{
return false;
}
return Equals(other);
}
public bool Equals(FirstClass other)
{
....
}
}In the overridden 'Equals' method of the 'FirstClass' class, an error occurs when checking the 'obj' type. The 'FirstClass' type should be used instead of the 'SecondClass' type.
As a result, if an object of the 'FirstClass' type is passed to the overridden 'Equals' method, the method always returns 'false'.
Moreover, if an object of the 'SecondClass' type is passed as a parameter, the same overridden 'Equals' method is called. It results in recursion and a 'StackOverflowException'.
Let's look at the fixed version:
private class FirstClass
{
....
public override bool Equals(object obj)
{
FirstClass other = obj as FirstClass;
if (other == null)
{
return false;
}
return Equals(other);
}
}This diagnostic is classified as:
V3198. The variable is assigned the same value that it already holds.
The analyzer has detected that a variable is assigned a value that it already holds.
Let's look at the following example:
public long GetFactorial(long it)
{
long currentValue = 1;
for (int i = 1; i <= it; i++)
{
currentValue = currentValue * currentValue;
}
return currentValue;
}The 'GetFactorial' method should return the factorial value that matches the parameter. However, the method always returns 1. This happens because at each iteration of the loop, the 'currentValue' variable is assigned a value that it already holds.
To fix it, replace one of the multipliers with 'i':
for (int i = 1; i <= it; i++)
{
currentValue = currentValue * i;
}This diagnostic is classified as:
V5301. OWASP. An exception handling block does not contain any code.
The analyzer has detected an empty exception handling block ('catch' or 'finally'). Inappropriate exception handling may decrease the application's reliability.
In some cases, inappropriate exception handling may result in a vulnerability. Insufficient logging and monitoring are pointed out as a separate category on OWASP Top 10 Application Security Risks 2017: A10:2017-Insufficient Logging & Monitoring.
The following example contains an empty 'catch' block:
try
{
someCall();
}
catch (Exception e)
{
}Code like this is not necessarily faulty, of course. But simply suppressing an exception without taking any further precautions against it is a strange practice since such insufficient exception handling may let defects stay unnoticed.
Logging is one example of how you can handle an exception. At least it will prevent the exception from passing unnoticed:
try
{
someCall();
}
catch (Exception e)
{
logger.error("Message", e);
}An empty 'finally' block is no less suspicious. It may indicate incomplete implementation of some logic necessary for reliable behavior of the program. Consider the following example:
try
{
someCall();
}
catch (Exception e)
{ .... }
finally
{
}This code is very likely to be faulty or simply redundant. Unlike the empty 'catch' block, which can be used to suppress an exception, the empty 'finally' block has no practical use at all.
This diagnostic is classified as:
|
V5302. OWASP. Exception classes should be publicly accessible.
The analyzer has detected an exception class inaccessible to external classes. If such an exception is thrown, the external code will have to catch instances of the nearest accessible parent class such as the base class of all exceptions, 'Throwable'. In this case, it becomes more difficult to handle specific exceptions, because the external code will not be able to clearly identify the problem that has arisen.
Lack of clear identification of exceptions poses an additional security risk because some specific exceptions may require specific handling rather than general handling. Insufficient logging and monitoring (including exception identification) are pointed out as a separate category on OWASP Top 10 Application Security Risks 2017: A10:2017-Insufficient Logging & Monitoring.
Consider the following simple example taken from a real project:
public class TxnLogToolkit implements Closeable
{
static class TxnLogToolkitException extends Exception
{
....
private int exitCode;
TxnLogToolkitException(int exitCode, ....)
{
super(....);
this.exitCode = exitCode;
}
int getExitCode()
{
return exitCode;
}
}
....
}To correctly handle a given exception, the exception class must be declared as 'public':
public class TxnLogToolkit implements Closeable
{
public static class TxnLogToolkitException extends Exception
{
....
private int exitCode;
public TxnLogToolkitException(int exitCode, ....)
{
super(....);
this.exitCode = exitCode;
}
public int getExitCode()
{
return exitCode;
}
}
....
}Now the code of external classes will be able to catch this exception and handle the specific situation.
Keep in mind that declaring an exception class as 'public' may be insufficient if it is a nested class, as in the following example:
class OperatorHelper
{
public static class OpCertificateException extends CertificateException
{
private Throwable cause;
public OpCertificateException(String msg, Throwable cause)
{
super(msg);
this.cause = cause;
}
public Throwable getCause()
{
return cause;
}
}
}Here, the exception class is nested into 'OperatorHelper' class, which is implicitly has 'package-private'. Therefore, the 'OpCertificateException' will also only be available within the current package, even though it has the 'public' access modifier. The analyzer recognizes situations like that and issues the warning.
This diagnostic is classified as:
|
V5303. OWASP. The object was created but it is not being used. The 'throw' keyword could be missing.
The analyzer detected an error related to the fact the instance of the exception class is created, but in doing so, is not used anyway.
Here's an example of incorrect code:
int checkIndex(int index)
{
if (index < 0)
new IndexOutOfBoundsException("Index Out Of Bounds!!!");
return index;
}In this fragment, the 'throw' statement is missing, so executing this code will only result in creating an instance of a class without it being used in any way, and the exception won't be generated. The correct version of this code should look something like this:
int checkIndex(int index)
{
if (index < 0)
throw new IndexOutOfBoundsException("Index Out Of Bounds!!!");
return index;
}This diagnostic is classified as:
|
V5304. OWASP. Unsafe double-checked locking.
The analyzer has detected a potential error related to unsafe use of the double-checked locking pattern.
Double-checked locking is a pattern used to reduce the overhead of acquiring a lock. The locking condition is first checked without synchronization. And only if the condition is true, the thread attempts to acquire the lock. Thus, locking occurs only when it is indeed necessary.
The most common mistake when implementing this pattern is publishing an object before initializing it:
class TestClass
{
private static volatile Singleton singleton;
public static Singleton getSingleton()
{
if (singleton == null)
{
synchronized (TestClass.class)
{
if (singleton == null)
{
singleton = new Singleton();
singleton.initialize(); // <=
}
}
}
return singleton;
}
}In a multi-threaded environment, one of the threads could see an already created object and use it even if that object has not been initialized yet.
A similar issue might occur when the object is reassigned in the synchronized block depending on some conditions. Some other thread may well start working with the object after its first assignment without knowing that some other object is meant to be used further in the program.
Such errors are fixed by using a temporary variable:
class TestClass
{
private static volatile Singleton singleton;
public static Singleton getSingleton()
{
if (singleton == null)
{
synchronized (TestClass.class)
{
if (singleton == null)
{
Singleton temp = new Singleton();
temp.initialize();
singleton = temp;
}
}
}
return singleton;
}
}Another common mistake when implementing this pattern is skipping the 'volatile' modifier when declaring the field being accessed:
class TestClass
{
private static Singleton singleton;
public static Singleton getSingleton()
{
if (singleton == null)
{
synchronized (TestClass.class)
{
if (singleton == null)
{
Singleton temp = new Singleton();
temp.initialize();
singleton = temp;
}
}
}
return singleton;
}
}An object of class 'Singleton' could be created several times because the 'singleton == null' check could see the value 'null' cached in the thread. Besides, the compiler could alter the order of operations over non-volatile fields and, for example, swap the call to the object initialization method and the storing of the reference to that object in the field, thus resulting in using the object, which is yet to be initialized.
One of the reasons why such errors are dangerous is that the program will run correctly in most cases. In this particular case, the incorrect behavior may manifest itself depending on the JVM version, concurrency level, thread scheduler's decisions, and other factors. Such complex conditions are extremely difficult to reproduce manually.
This diagnostic is classified as:
|
V5305. OWASP. Storing credentials inside source code can lead to security issues.
The analyzer detected a block of code that contains what seems to be sensitive data, such as passwords.
Storing such data in the source code can lead to broken access control and providing users with privileges not intended for public use. Having the program's bytecode, anyone can extract all the string literals used in it. With open-source projects, disclosing such information becomes even easier since an attacker can study the source code directly.
Thus, all sensitive data may become publicly available. Vulnerabilities resulting from insufficient protection of sensitive data make a separate category on OWASP Top 10 Application Security Risks 2017: A2:2017-Broken Authentication.
Consider the following example:
public static void main(String[] arg)
{
....
JSch jsch = new JSch();
Session session = jsch.getSession(user, host, 22);
session.setPassword("123fj");
....
}In this code snippet, the password is stored in the code. Therefore, an attacker can easily obtain data.
Instead of storing sensitive data in the code, it is better to use, for example, storages which store data in encrypted form. Regular users don't have direct access to it.
In such a case, the code may look as follows:
public static void main(String[] arg)
{
....
JSch jsch = new JSch();
Session session = jsch.getSession(user, host, 22);
session.setPassword(dataStorage.getPassword);
....
}This diagnostic is classified as:
V3501. AUTOSAR. Octal constants should not be used.
This diagnostic rule is based on the software development guidelines developed by AUTOSAR (AUTomotive Open System ARchitecture).
Octal numeric literals and escape sequences should not be used. The use of octal literals could hinder code readability, especially when skimming through it. Misinterpreting numeric values may result in various mistakes.
Here is an example of code triggering this warning:
if (val < 010)
{
....
}When skimming through the code, you may overlook the actual value of the numeric literal, which is 8, not 10. To eliminate this warning, rewrite the literal in decimal or hexadecimal form:
if (val < 8)
{
....
}This diagnostic is classified as:
|
V3502. AUTOSAR. Size of an array is not specified.
This diagnostic rule is based on the software development guidelines developed by AUTOSAR (AUTomotive Open System ARchitecture).
Explicitly specifying the array size makes code clearer and helps to prevent mistakes leading to an array overrun due to its exact size being unknown to the programmer.
The analyzer issues this warning when it detects a declaration of an array with the 'extern' specifier, provided that the array size is not specified explicitly. For example:
extern int arr[];To eliminate the warning, specify the array size explicitly.
extern int arr[12];If the array size can be inferred from the initializer, the warning is not issued.
int arr1[] = {1, 2, 3};This diagnostic is classified as:
|
V3503. AUTOSAR. The 'goto' statement shouldn't jump to a label declared earlier.
This diagnostic rule is based on the software development guidelines developed by AUTOSAR (AUTomotive Open System ARchitecture).
The use of a 'goto' statement that jumps to a previously declared label obscures the code and, therefore, makes it harder to maintain.
Here is an example of code that will trigger this warning:
void init(....)
{
....
again:
....
if (....)
if (....)
goto again;
....
}To eliminate the warning, delete the 'goto' statement or rewrite the code so that the 'goto' statement is followed, rather than preceded, by the label it refers to.
This diagnostic is classified as:
|
V3504. AUTOSAR. The body of a loop\conditional statement should be enclosed in braces.
This diagnostic rule is based on the software development guidelines developed by AUTOSAR (AUTomotive Open System ARchitecture).
The bodies of the statements 'while', 'do-while', 'for', 'if', 'if-else', and 'switch' should be enclosed in braces.
Braces clearly define which of the statements belong to the body, make the code clearer, and help to prevent certain errors. For example, with braces absent, the programmer could misinterpret indentation or overlook the ';' character written accidentally after the statement.
Example 1:
void example_1(....)
{
if (condition)
if (otherCondition)
DoSmt();
else
DoSmt2();
}The format of this code does not match its execution logic and may confuse the programmer. Adding the braces makes the code unambiguous:
void example_1(....)
{
if (condition)
{
if (otherCondition)
{
DoSmt();
}
else
{
DoSmt2();
}
}
}Example 2:
void example_2(....)
{
while (count < 10)
DoSmt1(); DoSmt2();
}The format of this code does not match its execution logic either since only the 'DoSmt1()' expression belongs to the loop.
Fixed version:
void example_2(....)
{
while (count < 10)
{
DoSmt1();
DoSmt2();
}
}Note: an 'if' statement immediately following an 'else' statement does not have to be enclosed in braces. For example, the analyzer will keep silent about this code:
if (condition1)
{ .... }
else if (condition2)
{ .... }This diagnostic is classified as:
|
V3505. AUTOSAR. The function with the 'atof/atoi/atol/atoll' name should not be used.
This diagnostic rule is based on the software development guidelines developed by AUTOSAR (AUTomotive Open System ARchitecture).
The analyzer issues the warning when it detects the following functions: 'atof', 'atoi', 'atol', 'atoll'.
Incorrect use of these functions may result in undefined behavior. This could happen when a function argument is not a valid C-string or if the resulting value does not fit into the return type.
Here is an example of code triggering this warning:
void Foo(const char *str)
{
int val = atoi(str);
....
}This diagnostic is classified as:
|
V3506. AUTOSAR. The function with the 'abort/exit/getenv/system' name should not be used.
This diagnostic rule is based on the software development guidelines developed by AUTOSAR (AUTomotive Open System ARchitecture).
The analyzer issues the warning when it detects the following functions: 'abort', 'exit', 'getenv', 'system'.
The behavior of these functions is implementation-dependent. Besides, using such functions as 'system' may cause vulnerabilities.
Here is an example of code triggering this warning:
void Foo(FILE *pFile)
{
if (pFile == NULL)
{
abort();
}
....
}This diagnostic is classified as:
|
V3507. AUTOSAR. The macro with the 'setjmp' name and the function with the 'longjmp' name should not be used.
This diagnostic rule is based on the software development guidelines developed by AUTOSAR (AUTomotive Open System ARchitecture).
The analyzer issues the warning when it detects the 'setjmp' or 'longjmp' names because misusing them may result in undefined behavior.
Here is an example of code triggering this warning:
jmp_buf j_buf;
void foo()
{
setjmp(j_buf);
}
int main()
{
foo();
longjmp(j_buf, 0);
return 0;
}The 'longjmp' function is called after the function calling 'setjmp' returns. The result is undefined.
This diagnostic is classified as:
|
V3508. AUTOSAR. Unbounded functions performing string operations should not be used.
This diagnostic rule is based on the software development guidelines developed by AUTOSAR (AUTomotive Open System ARchitecture).
The analyzer issues the warning when it detects the following functions: 'strcpy', 'strcmp', 'strcat', 'strchr', 'strspn', 'strcspn', 'strpbrk', 'strrchr', 'strstr', 'strtok', 'strlen'.
Incorrect use of these functions may result in undefined behavior since they do not perform bound checking when reading from or writing to the buffer.
Here is an example of code triggering this warning:
int strcpy_internal(char *dest, const char *source)
{
int exitCode = FAILURE;
if (source && dest)
{
strcpy(dest, source);
exitCode = SUCCESS;
}
return exitCode;
}This diagnostic is classified as:
|
V3509. AUTOSAR. Unions should not be used.
This diagnostic rule is based on the software development guidelines developed by AUTOSAR (AUTomotive Open System ARchitecture).
The analyzer issues the warning when it detects a union declaration.
Incorrect use of unions may cause various problems, such as reading incorrect values or undefined behavior.
For example, undefined behavior occurs when attempting to read from a member other than the one that the latest write operation was performed on.
Here is an example of code triggering this warning:
union U
{
unsigned char uch;
unsigned int ui;
} uni;
....
uni.uch = 'w';
int ui = uni.ui;This diagnostic is classified as:
|
V3510. AUTOSAR. Declaration should contain no more than two levels of pointer nesting.
This diagnostic rule is based on the software development guidelines developed by AUTOSAR (AUTomotive Open System ARchitecture).
The analyzer issues the warning when it detects a declaration that contains a nested pointer more than two levels deep. Such pointers obscure the code and, therefore, may lead to various mistakes.
Here is an example of code triggering this warning:
void foo(int **ppArr[])
{
....
}This diagnostic is classified as:
|
V3511. AUTOSAR. The 'if' ... 'else if' construct should be terminated with an 'else' statement.
This diagnostic rule is based on the software development guidelines developed by AUTOSAR (AUTomotive Open System ARchitecture).
Every 'if ... else if' series must end with an 'else' branch. The analyzer issues the warning when the ending 'else' is missing. An 'else' statement at the end indicates that all the possible cases have been considered, thus making the code clearer.
Here is an example of code triggering this warning:
if (condition)
{
....
}
else if (other_condition)
{
....
}To eliminate the warning and indicate to the programmer maintaining the code that none of the previous conditions is true, add the ending 'else' branch. In this branch, you should include the necessary operations or comments.
if (condition)
{
....
}
else if (other_condition)
{
....
}
else
{
// No action needed
}This diagnostic is classified as:
|
V3512. AUTOSAR. Literal suffixes should not contain lowercase characters.
This diagnostic rule is based on the software development guidelines developed by AUTOSAR (AUTomotive Open System ARchitecture).
All literal suffixes should be uppercase.
Using lowercase suffixes obscures the code. For example, you may confuse an 'l' suffix with the numeral one (1), which could cause various mistakes.
Here are examples of literals triggering this warning:
12l; 34.0f; 23u;The warning is not issued when the literals are written in the following form:
12L; 34.0F; 23U;This diagnostic is classified as:
|
V3513. AUTOSAR. Every switch-clause should be terminated by an unconditional 'break' or 'throw' statement.
This diagnostic rule is based on the software development guidelines developed by AUTOSAR (AUTomotive Open System ARchitecture).
Each label of a 'switch' statement should end with a 'break' statement or a 'throw' expression placed outside the condition.
Adding the ending statements guarantees that the execution flow will not "fall through" to the next label and also helps avoid mistakes when adding new labels.
The only exception to this rule is a series of empty labels.
Here is an example of code triggering this warning:
void example_1(int cond, int a)
{
switch (cond)
{
case 1:
case 2:
break;
case 3: // <=
if (a == 42)
{
DoSmth();
}
case 4: // <=
DoSmth2();
default: // <=
;
}
}Fixed code:
void example_1(int cond, int a)
{
switch (cond)
{
case 1:
case 2:
break;
case 3:
if (a == 42)
{
DoSmth();
}
break;
case 4:
DoSmth2();
break;
default:
/* No action required */
break;
}
}This diagnostic is classified as:
|
V3514. AUTOSAR. The 'switch' statement should have 'default' as the last label.
This diagnostic rule is based on the software development guidelines developed by AUTOSAR (AUTomotive Open System ARchitecture).
A 'switch' statement should have 'default' as the last label.
Adding a 'default' label at the end of every 'switch' statement makes the code clearer and guarantees that any possible case where none of the labels matches the value of the control variable will be handled. Since such situations have to be dealt with somehow, every 'default' label should contain (in addition to 'break' or 'throw') an expression or comment explaining why no actions are carried out.
Example 1:
void example_1(int i)
{
switch (i)
{
case 1:
DoSmth1();
break;
default: // <=
DoSmth42();
break;
case 3:
DoSmth3();
break;
}
}Fixed code:
void example_1(int i)
{
switch (i)
{
case 1:
DoSmth1();
break;
case 3:
DoSmth3();
break;
default:
DoSmth42();
break;
}
}Example 2:
enum WEEK
{
SUNDAY, MONDAY, TUESDAY, WEDNESDAY, THURSDAY, FRIDAY, SATURDAY
} weekDay;
void example_2()
{
int isWorkday;
switch (weekDay)
{
case MONDAY:
case TUESDAY:
case WEDNESDAY:
case THURSDAY:
case FRIDAY:
isWorkday = 1;
break;
case SATURDAY:
case SUNDAY:
isWorkday = 0;
break;
default: // <=
break;
}Fixed code:
enum WEEK
{
SUNDAY, MONDAY, TUESDAY, WEDNESDAY, THURSDAY, FRIDAY, SATURDAY
} weekDay;
void example_2()
{
int isWorkday;
switch (weekDay)
{
case MONDAY:
case TUESDAY:
case WEDNESDAY:
case THURSDAY:
case FRIDAY:
isWorkday = 1;
break;
case SATURDAY:
case SUNDAY:
isWorkday = 0;
break;
default:
assert(false);
break;
}This diagnostic is classified as:
|
V3515. AUTOSAR. All integer constants of unsigned type should have 'U' suffix.
This diagnostic rule is based on the software development guidelines developed by AUTOSAR (AUTomotive Open System ARchitecture).
The analyzer has detected an unsigned integer literal without a 'U'. Such literals obscure the code as their type is ambiguous. Besides, the same literals can be of different types in various data models.
Using suffixes to explicitly specify the type helps to avoid ambiguity when reading numeric literals.
Here is an example of code triggering the warning (provided that the literal is of unsigned type on the platform under analysis):
auto typemask = 0xffffffffL;This diagnostic is classified as:
|
V3516. AUTOSAR. A switch-label should only appear at the top level of the compound statement forming the body of a 'switch' statement.
This diagnostic rule is based on the software development guidelines developed by AUTOSAR (AUTomotive Open System ARchitecture).
A label's scope should be a compound statement forming the body of the 'switch' statement. It means that the label should not be nested in any block other than the body of the 'switch', and that body should be a compound statement.
Therefore, all labels of one 'switch' should belong to the same scope. Following this rule helps to keep the code clear and well-structured.
Example 1:
void example_1(int param, bool b)
{
switch (param)
{
case 1:
DoSmth1();
if (b)
{
case 2: // <=
DoSmth2();
}
break;
default:
assert(false);
break;
}
}This code is not clear enough. To eliminate the warning, rewrite the code as follows:
void example_1(int param, bool b)
{
switch (param)
{
case 1:
DoSmth1();
if (b)
{
DoSmth2();
}
break;
case 2:
DoSmth2();
break;
default:
assert(false);
break;
}
}The following example will also trigger the warning because the body of the 'switch' statement is not compound:
void example_2(int param)
{
switch (param)
default:
DoDefault();
}Fixed code:
void example_2(int param)
{
switch (param)
{
default:
DoDefault();
break;
}
}This diagnostic is classified as:
|
V3517. AUTOSAR. The functions from time.h/ctime should not be used.
This diagnostic rule is based on the software development guidelines developed by AUTOSAR (AUTomotive Open System ARchitecture).
The analyzer issues this warning when it detects the following functions: 'clock', 'time', 'difftime', 'ctime', 'asctime', 'gmtime', 'localtime', 'mktime'.
These functions have unspecified or implementation-dependent behavior, so they may return time and date in different formats (depending on the environment, implementation of the standard library, and so on).
Here is an example of code triggering this warning:
const char* Foo(time_t *p)
{
time_t t = time(p);
return ctime(t);
}This diagnostic is classified as:
|
V3518. AUTOSAR. A switch-expression should not have Boolean type. Consider using of 'if-else' construct.
This diagnostic rule is based on the software development guidelines developed by AUTOSAR (AUTomotive Open System ARchitecture).
A Boolean value can be cast to an integer and, therefore, can be used as a control variable in a 'switch' statement. However, it is preferable to use an 'if-else' construct in such cases as it conveys the developer's intentions in a clearer and more explicit way.
Original code:
int foo(unsigned a, unsigned b)
{
while (a != 0 && b != 0)
{
switch (a > b) // <=
{
case 0:
a -= b;
break;
default:
b -= a;
break;
}
}
return a;
}Better version:
int foo(unsigned a, unsigned b)
{
while (a != 0 && b != 0)
{
if (a > b)
{
b -= a;
}
else
{
a -= b;
}
}
return a;
}This diagnostic is classified as:
|
V3519. AUTOSAR. The comma operator should not be used.
This diagnostic rule is based on the software development guidelines developed by AUTOSAR (AUTomotive Open System ARchitecture).
Avoid using the 'comma' operator as it may be confusing to code maintainers.
Look at the following example:
int foo(int x, int y) { .... }
foo( ( 0, 3), 12 );This code could be confusing to a programmer who is not familiar with the function's signature. They could think that the function is called with three arguments, but it is not so: the 'comma' operator in the '(0, 3)' expression will evaluate the left and right arguments and return the latter. As a result, the function call will actually look like this:
foo( 3, 12 );This warning is issued in other cases as well, for example:
int myMemCmp(const char *s1, const char *s2, size_t N)
{
for (; N > 0; ++s1, ++s2, --N) { .... }
}This diagnostic is classified as:
|
V3520. AUTOSAR. Any label should be declared in the same block as 'goto' statement or in any block enclosing it.
This diagnostic rule is based on the software development guidelines developed by AUTOSAR (AUTomotive Open System ARchitecture).
Excessive use of 'goto' statements complicates the code structure and obscures the code.
To make the code clearer, it is recommended that you discard jumps to nested blocks or between blocks of the same level.
Example 1:
void V2532_pos1()
{
...
goto label;
...
{
label:
...
}
}The 'goto' statement here refers control to a nested block, which makes this code non-compliant.
No warning will be produced on the following code:
void V2532_neg1()
{
...
label:
...
{
goto label;
...
}
}Note: the bodies of switch labels are considered composite statements even if they are not enclosed in braces. For this reason, jumps to the body of a switch label from outer code and jumps between different switch labels do not comply with the rule.
Consider the following examples.
Jumping to a switch label from outer code (non-compliant):
void V2532_pos2(int param)
{
goto label;
switch (param)
{
case 0:
break;
default:
label:;
break;
}
}Jumping between switch labels (non-compliant):
void V2532_pos3(int param)
{
switch (param)
{
case 0:
goto label;
break;
default:
label:
break;
}
}Jumping from a switch label to outer code (OK):
void V2532_neg2(int param)
{
label:
switch (param)
{
case 0:
goto label;
break;
default:
break;
}
}Jumping within the bounds of one switch label (OK):
void neg3(int param)
{
switch (param)
{
case 0:
{
...
{
goto label;
}
}
label:
break;
default:
break;
}
}This diagnostic is classified as:
|
V3521. AUTOSAR. The loop counter should not have floating-point type.
This diagnostic rule is based on the software development guidelines developed by AUTOSAR (AUTomotive Open System ARchitecture).
Since floating-point numbers cannot accurately represent all real numbers, the number of iterations may vary for loops relying on such variables.
Consider the following example:
void foo(void) {
for (float A = 0.1f; A <= 10.0f; A += 0.1f) {
....
}
}This loop may iterate 99 or 100 times. The accuracy of operations involving real numbers depends on the compiler, optimization mode, and many other things.
It is better to rewrite the loop as follows:
void foo(void) {
for (int count = 1; count <= 100; ++count) {
float A = count / 10.0f;
}
}Now it is guaranteed to iterate exactly 100 times, while the 'A' variable can be used for the calculations.
This diagnostic is classified as:
|
V3522. AUTOSAR. Unreachable code should not be present in the project.
This diagnostic rule is based on the software development guidelines developed by AUTOSAR (AUTomotive Open System ARchitecture).
Unreachable code may be a sign of a programmer's error and complicates support of code.
For purposes of optimization, the compiler may remove unreachable code. Unreachable code, not removed by the compiler can waste resources. For example, it can increase the size of the binary file or cause unnecessary instruction caching.
Let's consider the first example:
void Error()
{
....
exit(1);
}
FILE* OpenFile(const char *filename)
{
FILE *f = fopen(filename, "w");
if (f == nullptr)
{
Error();
printf("No such file: %s", filename);
}
return f;
}The 'printf(....)' function will never print an error message as the 'Error()' function doesn't return control. A proper way of fixing code depends on the behavior logic initially intended by a programmer. Perhaps, the function must return control. It is also possible that the order of expressions is wrong and the correct code should be as follows:
FILE* OpenFile(const char *filename)
{
FILE *f = fopen(filename, "w");
if (f == nullptr)
{
printf("No such file: %s", filename);
Error();
}
return f;
}Let's consider the second example:
char ch = strText[i];
switch (ch)
{
case '<':
...
break;
case '>':
...
break;
case 0xB7:
case 0xBB:
...
break;
...
}Here the branch after "case 0xB7:" and "case 0xBB:" will never regain control. The 'ch' variable is of the 'char' type and therefore the range of its values lies within [-128..127]. The result of the "ch == 0xB7" and "ch==0xBB" expressions will always be false. The 'ch' variable has to be of the 'unsigned char' type so that the code was correct. Fixed code:
unsigned char ch = strText[i];
switch (ch)
{
case '<':
...
break;
case '>':
...
break;
case 0xB7:
case 0xBB:
...
break;
...
}Let's consider the third example:
if (n < 5) { AB(); }
else if (n < 10) { BC(); }
else if (n < 15) { CD(); }
else if (n < 25) { DE(); }
else if (n < 20) { EF(); } // This branch will never be executed.
else if (n < 30) { FG(); }Due to improper intersection of ranges under conditions, one of the branches will never be executed. Fixed code:
if (n < 5) { AB(); }
else if (n < 10) { BC(); }
else if (n < 15) { CD(); }
else if (n < 20) { EF(); }
else if (n < 25) { DE(); }
else if (n < 30) { FG(); }This diagnostic is classified as:
|
V3523. AUTOSAR. Functions should not have unused parameters.
This diagnostic rule is based on the software development guidelines developed by AUTOSAR (AUTomotive Open System ARchitecture).
Unused function parameters frequently appear after code refactoring. The function signature does not match its implementation, it's difficult to immediately find out if it is a programmer's error.
Let's consider the example:
static bool CardHasLock(int width, int height)
{
const double xScale = 0.051;
const double yScale = 0.0278;
int lockWidth = (int)floor(width * xScale);
int lockHeight = (int)floor(width * yScale);
....
}From the code you can see that the 'height' parameter was never used in the body of the function. Most likely, there is an error and the initialization of the 'lockHeight' variable has to be as follows:
int lockHeight = (int)floor(height * yScale);This diagnostic is classified as:
|
V3524. AUTOSAR. The value of uninitialized variable should not be used.
This diagnostic rule is based on the software development guidelines developed by AUTOSAR (AUTomotive Open System ARchitecture).
If a variable of a POD type isn't initialized explicitly and doesn't have an initializer by default, its value will be undefined. Usage of such value will lead to undefined behavior.
Simple synthetic example:
int Aa = Get();
int Ab;
if (Ab) // Ab - uninitialized variable
Ab = Foo();
else
Ab = 0;Usually errors of using uninitialized variables occur through misprints. For example, it may appear that a different variable should be used in this place. Correct code variant:
int Aa = Get();
int Ab;
if (Aa) // OK
Ab = Foo();
else
Ab = 0;This diagnostic is classified as:
|
V3525. AUTOSAR. Function with a non-void return type should return a value from all exit paths.
This diagnostic rule is based on the software development guidelines developed by AUTOSAR (AUTomotive Open System ARchitecture).
The analyzer has detected a function with a non-void return type which doesn't return a value on all the paths of execution. According to the C++ standard, this can lead to undefined behavior.
Let's consider an example in which an undefined value is returned only occasionally:
BOOL IsInterestingString(char *s)
{
if (s == NULL)
return FALSE;
if (strlen(s) < 4)
return;
return (s[0] == '#') ? TRUE : FALSE;
}There is a typo in the code. If a string length is less than 4 characters, the function will return an undefined value. Correct variant:
BOOL IsInterestingString(char *s)
{
if (s == NULL)
return FALSE;
if (strlen(s) < 4)
return FALSE;
return (s[0] == '#') ? TRUE : FALSE;
}Note. The analyzer tries to identify the cases when the absence of the return value is not an error. Here's a code example, which will be considered safe:
int Foo()
{
...
exit(10);
}This diagnostic is classified as:
|
V3526. AUTOSAR. Expression resulting from the macro expansion should be surrounded by parentheses.
This diagnostic rule is based on the software development guidelines developed by AUTOSAR (AUTomotive Open System ARchitecture).
The analyzer has detected a potentially incorrect macro definition. The macro and its parameters should be enclosed in parentheses.
When macro parameters or expression are not parenthesized, the intended logic may get disrupted after expanding the macro.
Here is an example of code that will trigger this warning:
#define DIV(x, y) (x / y)This example demonstrates the use of the faulty macro:
Z = DIV(x + 1, y + 2);Expanding the macro will result in the following expression:
Z =(x + 1 / y + 2);To keep the intended logic, the macro definition should be rewritten as follows:
#define DIV(x,y) ((x) / (y))This diagnostic is classified as:
|
V3527. AUTOSAR. The return value of non-void function should be used.
This diagnostic rule is based on the software development guidelines developed by AUTOSAR (AUTomotive Open System ARchitecture).
It is possible to call a non-void function without using its return value afterward. There could be an error behind such behavior.
Values returned by non-void functions must always be used. Example of non-compliant code:
int Foo(int x)
{
return x + x;
}
void Bar(int x)
{
Foo(x);
}If the loss of the return value was planned by the developer, it can be cast to the type 'void'. Example of compliant code:
void Bar(int x)
{
(void)Foo(x);
}This diagnostic is classified as:
|
V3528. AUTOSAR. The address of an object with local scope should not be passed out of its scope.
This diagnostic rule is based on the software development guidelines developed by AUTOSAR (AUTomotive Open System ARchitecture).
Copying an object's address to a pointer/reference with a long lifetime may cause that pointer/reference to become "dangling" after the original object has ceased to exist. This is a case of memory safety violation. Using data referenced by a "dangling" pointer/reference leads to undefined behavior.
First example of non-compliable code:
int& Foo( void )
{
int some_variable;
....
return some_variable;
}Second example of non-compliable code:
#include <stddef.h>
void Bar( int **ptr )
{
int some_variable;
....
if (ptr != NULL)
*ptr = &some_variable;
}This diagnostic is classified as:
|
V3529. AUTOSAR. Floating-point values should not be tested for equality or inequality.
This diagnostic rule is based on the software development guidelines developed by AUTOSAR (AUTomotive Open System ARchitecture).
When comparing values of real types for equality or non-equality, the results may vary depending on the processor being used and compiler settings.
Example of non-compliant code:
const double PI_div_2 = 1.0;
const double sinValue = sin(M_PI / 2.0);
if (sinValue == PI_div_2) { .... }To compare values of real types correctly, either use the predefined constant 'std::numeric_limits<float>::epsilon()' or 'std::numeric_limits<double>::epsilon()' or create your own constant 'Epsilon' of custom precision.
Fixed code:
const double PI_div_2 = 1.0;
const double sinValue = sin(M_PI / 2.0);
// equality
if (fabs(a - b) <= std::numeric_limits<double>::epsilon()) { .... };
// inequality
if (fabs(a - b) > std::numeric_limits<double>::epsilon()) { .... };In some cases, it is allowed to compare two real numbers using the '==' or '!=' operator, for example, when checking a variable for a known value:
bool foo();
double bar();
double val = foo() ? bar() : 0.0;
if (val == 0.0) { .... }The analyzer does not issue the warning if a value is compared with itself. Such a comparison is useful to check a variable for NaN:
bool isnan(double value) { return value != value; }However, a better style is to implement this check through the 'std::isnan' function.
This diagnostic is classified as:
|
V3530. AUTOSAR. Variable should be declared in a scope that minimizes its visibility.
This diagnostic rule is based on the software development guidelines developed by AUTOSAR (AUTomotive Open System ARchitecture).
Variables should be declared in as narrow a scope as possible. This will help to avoid potential errors caused by inadvertent use of variables outside their intended scope, as well as minimize memory consumption and increase the program's performance.
Example of non-compliant code:
static void RenderThrobber(RECT *rcItem, int *throbbing, ....)
{
....
int width = rcItem->right - rcItem->left;
....
if (*throbbing)
{
RECT rc;
rc.right = width;
....
}
.... // width is not used anywhere else
}The 'width' variable is used only inside the 'if' block; therefore, it would be reasonable to declare it inside that block. That way, 'width' will be evaluated only if the condition is true, thus saving time. In addition, this will help to prevent incorrect use of the variable in the future.
This diagnostic is classified as:
|
V3531. AUTOSAR. Expressions with enum underlying type should have values corresponding to the enumerators of the enumeration.
This diagnostic rule is based on the software development guidelines developed by AUTOSAR (AUTomotive Open System ARchitecture).
The analyzer has detected an unsafe cast of a number to an enumeration. This number may be out of the range of enum values.
Consider the following example:
enum TestEnum { A, B, C };
TestEnum Invalid = (TestEnum)42;Since the standard does not specify a base type for enum, casting a number that is out of the range of enum elements results in unspecified behavior in standards older than C++17 and undefined behavior starting with C++17.
To avoid this, make sure you check numbers before casting them. As an alternative, you could explicitly specify the base type for enum or use 'enum class' whose base type is 'int' by default.
The fixed code – version 1:
enum TestEnum { A, B, C, Invalid = 42 };Version 2:
enum TestEnum : int { A, B, C };
TestEnum Invalid = (TestEnum)42;Version 3:
enum class TestEnum { A, B, C };
TestEnum Invalid = (TestEnum)42;This diagnostic is classified as:
|
V3532. AUTOSAR. Unary minus operator should not be applied to an expression of the unsigned type.
This diagnostic rule is based on the software development guidelines developed by AUTOSAR (AUTomotive Open System ARchitecture).
When applying the unary minus operator to a variable of type 'unsigned int', 'unsigned long', or 'unsigned long long', that variable will keep its type and stay 'unsigned', which makes this operation meaningless.
Applying the unary minus operator to a variable of a shorter 'unsigned' integer type resulting from integer promotion may result in getting a 'signed' value, which is not a good practice, so such an operation will also trigger the warning.
Example of non-compliant code:
unsigned int x = 1U;
int y = -x;This diagnostic is classified as:
|
V3533. AUTOSAR. Expression containing increment (++) or decrement (--) should not have other side effects.
This diagnostic rule is based on the software development guidelines developed by AUTOSAR (AUTomotive Open System ARchitecture).
Using a decrement (--) or increment (++) operation along with other operators in one expression is not recommended. Using them in an expression that has other side effects makes the code less readable and may result in undefined behavior. A safer practice is to isolate the decrement/increment operators in separate expressions.
Example of non-compliant code:
i = ++i + i--;This code attempts to modify one variable at one sequence point, which results in undefined behavior.
This diagnostic is classified as:
|
V3534. AUTOSAR. Incorrect shifting expression.
This diagnostic rule is based on the software development guidelines developed by AUTOSAR (AUTomotive Open System ARchitecture).
In a bitwise shift operation, the value of the right operand must be within the range [0 .. N - 1], where N is the number of bits representing the left operand. Failing to follow this rule leads to undefined behavior.
Example of non-compliant code:
(int32_t) 1 << 128u;
(unsigned int64_t) 2 >> 128u;
int64_X >>= 64u;
any_var << -2u;The following example is a snippet from a real application, where an incorrect bitwise shift operation results in undefined behavior:
UINT32 m_color1_mask;
UINT32 m_color2_mask;
#define ARRAY_LENGTH(x) (sizeof(x) / sizeof(x[0]))
PALETTE_INIT( montecar )
{
static const UINT8 colortable_source[] =
{
0x00, 0x00, 0x00, 0x01,
0x00, 0x02, 0x00, 0x03,
0x03, 0x03, 0x03, 0x02,
0x03, 0x01, 0x03, 0x00,
0x00, 0x00, 0x02, 0x00,
0x02, 0x01, 0x02, 0x02,
0x00, 0x10, 0x20, 0x30,
0x00, 0x04, 0x08, 0x0c,
0x00, 0x44, 0x48, 0x4c,
0x00, 0x84, 0x88, 0x8c,
0x00, 0xc4, 0xc8, 0xcc
};
....
for (i = 0; i < ARRAY_LENGTH(colortable_source); i++)
{
UINT8 color = colortable_source[i];
if (color == 1)
state->m_color1_mask |= 1 << i; // <=
else if (color == 2)
state->m_color2_mask |= 1 << i; // <=
prom_to_palette(machine, i,
color_prom[0x100 + colortable_source[i]]);
}
....
}The value 1 is shifted by i bits to the left at the i-th iteration of the loop. Starting with the 32-nd iteration (given that int is a 32-bit type), the 'i' variable will be taking values within the range [0 .. 43], which is larger than the allowed range.
This diagnostic is classified as:
|
V3535. AUTOSAR. Operand of sizeof() operator should not have other side effects.
This diagnostic rule is based on the software development guidelines developed by AUTOSAR (AUTomotive Open System ARchitecture).
The 'sizeof()' operator does not execute the expression passed to it but only evaluates the type of the resulting expression and returns its size at compile time. Therefore, no assembler code is generated for any code inside 'sizeof()' (unevaluated context) and no operations inside it will ever be executed.
For that reason, to avoid such loss of operations, the operand passed to 'sizeof()' must not have any other side effects.
Example of non-compliant code:
int x = ....;
....
size_t s = n * sizeof(x++);To achieve the desired behavior, the snippet should be rewritten as follows:
int x = ....;
....
++x;
size_t s = n * sizeof(x);This diagnostic is classified as:
|
V3536. AUTOSAR. A pointer/reference parameter in a function should be declared as pointer/reference to const if the corresponding object was not modified.
This diagnostic rule is based on the software development guidelines developed by AUTOSAR (AUTomotive Open System ARchitecture).
The analyzer has detected a situation where an object is passed to a function by pointer or reference without being further modified in the body of the function. This may be a sign of a programming mistake. If this is really the programmer's intention not to modify the object, then the function's signature lacks precision without the 'const' qualifier. Adding 'const' helps prevent potential bugs and make the function's implementation clearer.
Example of non-compliant code:
size_t StringEval(std::string &str)
{
return str.size();
}The 'str' variable here is used only to perform a read operation even though it is passed by a non-constant reference. Explicitly declaring the function's parameter constant would signal to the maintainer that the function does not modify the object, and prevent any potential bugs that may occur when changing the function itself.
Fixed code:
size_t StringEval(const std::string &str)
{
return str.size();
}This diagnostic is classified as:
|
V3537. AUTOSAR. Subtraction, >, >=, <, <= should be applied only to pointers that address elements of the same array.
This diagnostic rule is based on the software development guidelines developed by AUTOSAR (AUTomotive Open System ARchitecture).
The C/C++ standard specifies (C++17 § 8.5.9 paragraph 3) that applying the operator '-', '>', '>=', '<', or '<=' to two pointers that do not point to the elements of the same array is undefined/unspecified behavior. Therefore, if two pointers point to different array objects, then these objects must be elements of the same array to be comparable.
Example of non-compliant code:
int arr1[10];
int arr2[10];
int *pArr1 = arr1;
if (pArr1 < arr2)
{
....
}The following code is also non-compliant:
int arr1[10];
int arr2[10];
int *pArr1 = &arr1[1];
int *pArr2 = &arr2[1];
int len = pArr1 - pArr2;To learn more about why pointer comparisons may lead to errors, see the article: "Pointers are more abstract than you might expect in C".
This diagnostic is classified as:
|
V3538. AUTOSAR. The result of an assignment expression should not be used.
This diagnostic rule is based on the software development guidelines developed by AUTOSAR (AUTomotive Open System ARchitecture).
Using the assignment operation in subexpressions introduces an additional side effect making the code less readable and more susceptible to new mistakes.
Besides, following this rule significantly reduces the risk of confusing the operators '=' and '=='.
Example of non-compliant code:
int Inc(int i)
{
return i += 1; // <=
}
void neg(int a, int b)
{
int c = a = b; // <=
Inc(a = 1); // <=
if(a = b) {} // <=
}This diagnostic is classified as:
|
V3539. AUTOSAR. Array indexing should be the only form of pointer arithmetic and it should be applied only to objects defined as an array type.
This diagnostic rule is based on the software development guidelines developed by AUTOSAR (AUTomotive Open System ARchitecture).
This rule advises against the use of address arithmetic. The only form of address arithmetic it allows is the subscript operation ('[]') applied to an entity declared as an array.
Exception: the rule allows the use of the increment and decrement operations ('++' and '--').
The use of address arithmetic makes the program less readable and may cause the maintainer to misinterpret the code. The use of indexing, on the contrary, is explicit and makes the code clearer; even if an expression using the subscript operator to index an array contains a mistake, it will be much easier to find. The same is true for increment/decrement operations: they explicitly convey the developer's intention to successively loop over a memory block that makes a continuous data region.
Example of non-compliant code:
int arr[] = { 0, 1, 2 };
int *p = arr + 1; //+V2563
p += 1; //+V2563
int *q = p[1]; //+V2563Fixed code:
int arr[] = { 0, 1, 2 };
int *p = &arr[1];
++p;This diagnostic is classified as:
|
V3540. AUTOSAR. There should be no implicit integral-floating conversion.
This diagnostic rule is based on the software development guidelines developed by AUTOSAR (AUTomotive Open System ARchitecture).
The code should not contain implicit conversions from floating-point types to integer types, and vice versa.
Integer types are:
- 'signed char', 'unsigned char',
- 'short', 'unsigned short',
- 'int', 'unsigned int',
- 'long', 'unsinged long',
- 'long long', 'unsigned long long'.
Floating-point types are:
- 'float',
- 'double',
- 'long double'.
Implicit conversion from floating-point types to integer types may result in losing some part of the value (for example, the decimal part) or lead to undefined behavior if the floating-point value cannot be represented as an integer value.
Implicit conversion from integer types to floating-point types may result in imprecise representation not meeting the developer's expectations.
Example of non-compliant code:
void foo1(int x, float y);
void foo2()
{
float y = 10;
int x = 10.5;
foo1(y, x);
}Example of code considered compliant from the point of view of this diagnostic:
void foo1(int x, float y);
void foo2()
{
float y = static_cast<float>(10);
int x = static_cast<int>(10.5);
foo1(static_cast<int>(y), static_cast<float>(x));
}This diagnostic is classified as:
|
V3541. AUTOSAR. A function should not call itself either directly or indirectly.
This diagnostic rule is based on the software development guidelines developed by AUTOSAR (AUTomotive Open System ARchitecture).
Functions should not call themselves either directly or indirectly. Recursion can lead to elusive bugs such as stack overflow in the case of very deep recursion.
Example of non-compliant code:
#include <stdint.h>
uint64_t factorial(uint64_t n)
{
return n > 1 ? n * factorial(n - 1) : 1;
}Recursive calls should be replaced with loops wherever possible. The following example demonstrates how this can be applied to the code above:
#include <stdint.h>
uint64_t factorial(uint64_t n)
{
uint64_t result = 1;
for (; n > 1; --n)
{
result *= n;
}
return result;
}This diagnostic is classified as:
|
V3542. AUTOSAR. Constant expression evaluation should not result in an unsigned integer wrap-around.
This diagnostic rule is based on the software development guidelines developed by AUTOSAR (AUTomotive Open System ARchitecture).
As specified by the C++ standard, an overflow of values of unsigned types results in a wrap-around. Using this mechanism in evaluation of expressions at runtime is a well-known practice (unlike signed types, where an overflow leads to undefined behavior).
However, an unsigned integer wrap-around in expressions evaluated at compile time may be misleading.
Example of non-compliant code:
#include <stdint.h>
#define C1 (UINT_MAX)
#define C2 (UINT_MIN)
....
void foo(unsigned x)
{
switch(x)
{
case C1 + 1U: ....; break;
case C2 - 1U: ....; break;
}
}According to this rule, an unsigned integer wrap-around that occurs when evaluating a constant expression of unsigned type, it will not be treated as an error if the expression will never be evaluated:
#include <stdint.h>
#define C UINT_MAX
....
unsigned foo(unsigned x)
{
if(x < 0 && (C + 1U) == 0x42) ....;
return x + C;
}The '(C + 1U)' expression resulting in an overflow will not be executed since the 'x < 0' condition is always true. Therefore, the second operand of the logical expression will not be evaluated.
This diagnostic is classified as:
|
V3543. AUTOSAR. Cast should not remove 'const' / 'volatile' qualification from the type that is pointed to by a pointer or a reference.
This diagnostic rule is based on the software development guidelines developed by AUTOSAR (AUTomotive Open System ARchitecture).
Removing the 'const' / 'volatile' qualifier can lead to undefined behavior.
- Changing an object declared as 'const' using a pointer/reference to a non-'const' type leads to undefined behavior.
- Accessing an object declared as 'volatile' using a pointer/reference to a non-'volatile' type leads to undefined behavior.
The compiler can optimize the code if undefined behavior occurs. In the code below, for example, the compiler can make the loop infinite:
inline int foo(bool &flag)
{
while (flag)
{
// do some stuff...
}
return 0;
}
int main()
{
volatile bool flag = true;
return foo(const_cast<bool &>(flag));
}Another example of non-compliant code:
void my_swap(const int *x, volatile int *y)
{
auto _x = const_cast<int*>(x);
auto _y = const_cast<int*>(y);
swap(_x, _y);
}
void foo()
{
const int x = 30;
volatile int y = 203;
my_swap(&x, &y); // <=
}This diagnostic is classified as:
|
V3544. AUTOSAR. The 'operator &&', 'operator ||', 'operator ,' and the unary 'operator &' should not be overloaded.
This diagnostic rule is based on the software development guidelines developed by AUTOSAR (AUTomotive Open System ARchitecture).
The built-in operators '&&', '||', '&' (address-of), and ',' have a specific evaluation order and semantics. When overloaded, they can no longer maintain their specific behavior, and the programmer may not know about that.
1) When overloaded, logical operators no longer support lazy evaluation. When using built-in operators, the second operand is not evaluated if the first operand of '&&' is 'false' or if the first operand of '||' is 'true'. Overloading these operators makes such optimization impossible:
class Tribool
{
public:
Tribool(bool b) : .... { .... }
friend Tribool operator&&(Tribool lhs, Tribool rhs) { .... }
friend Tribool operator||(Tribool lhs, Tribool rhs) { .... }
....
};
// Do some heavy weight stuff
bool HeavyWeightFunction();
void foo()
{
Tribool flag = ....;
if (flag || HeavyWeightFunction()) // evaluate all operands
// no short-circuit evaluation
{
// Do some stuff
}
}The compiler will not be able to optimize this code and will have to execute the "heavy-weight" function, which could have been avoided if the built-in operator had been used.
2) Overloading the unary operator '&' (address-of) can also lead to non-obvious issues. Consider the following example:
// Example.h
class Example
{
public:
Example* operator&() ;
const Example* operator&() const;
};
// Foo.cc
#include "Example.h"
void foo(Example &x)
{
&x; // call overloaded "operator&"
}
// Bar.cc
class Foobar;
void bar(Example &x)
{
&x; // may call built-in or overloaded "operator&"!
}The behavior observed in the second case is considered unspecified according to the C++ standard ($8.3.1.5), which means that applying the 'address-of' operator to the 'x' object may result in randomly calling the built-in operator or its overloaded version.
3) The built-in operator "comma" evaluates the left operand and ignores the resulting value; it then evaluates the right operand and returns its value. The built-in comma operator also guarantees that any side effects of the left operand will have taken place before it starts evaluating the right operand.
There is no such guarantee in the case of the overloaded version (before C++17), so the code below may output 'foobar' or 'barfoo':
#include <iostream>
template <typename T1, typename T2>
T2& operator,(const T1 &lhs, T2 &rhs)
{
return rhs;
}
int main()
{
std::cout << "foo", std::cout << "bar";
return 0;
}This diagnostic is classified as:
|
V3545. AUTOSAR. Operands of the logical '&&' or the '||' operators, the '!' operator should have 'bool' type.
This diagnostic rule is based on the software development guidelines developed by AUTOSAR (AUTomotive Open System ARchitecture).
Using the logical operators '!', '&&', and '||' with variables of a type other than 'bool' is pointless; it does not seem to be the intended behavior and may be a sign of a mistake. The programmer probably intended to use a bitwise operator ('&', '|', or '~').
Example of non-compliant code:
void Foo(int x, int y, int z)
{
if ((x + y) && z)
{
....
}
}
void Bar(int *x)
{
if (!x)
{
....
}
}Fixed code:
void Foo(int x, int y, int z)
{
if ((x + y) & z)
{
....
}
}
void Foo(int x, int y, int z)
{
if ((x < y) && (y < z))
{
....
}
}
void Bar(int *x)
{
if (x == NULL)
{
....
}
}This diagnostic is classified as:
|
V3546. AUTOSAR. Conversions between pointers to objects and integer types should not be performed.
This diagnostic rule is based on the software development guidelines developed by AUTOSAR (AUTomotive Open System ARchitecture).
Conversions between pointers to objects and integer types can lead to undefined, unspecified, or implementation-specific behavior. For that reason, it's not recommended to use such conversions.
Example of non-compliant code 1:
struct S { int16_t i; int16_t j; } *ps = ....;
int i64 = reinterpret_cast<int>(ps);Example of non-compliant code 2:
void foo(int i) {}
void wrong_param_type()
{
char *pc = ....;
foo((int) pc);
}Example of non-compliant code 3:
int wrong_return_type()
{
double *pd = ....;
return (int) pd;
}This diagnostic is classified as:
|
V3547. AUTOSAR. Identifiers that start with '__' or '_[A-Z]' are reserved.
This diagnostic rule is based on the software development guidelines developed by AUTOSAR (AUTomotive Open System ARchitecture).
As defined by the C++ standard, macro names and identifiers that contain the '__' sequence anywhere or begin with '_[A-Z]' are reserved for use in the language and standard library implementation. The same rule applies to the C language as well, except that the '__' sequence should be at the beginning of a reserved identifier.
Declaring such identifiers outside the standard library may cause problems. For example, this code:
#define _BUILTIN_abs(x) (x < 0 ? -x : x)
#include <cmath>
int foo(int x, int y, bool c)
{
return abs(c ? x : y)
}may change the behavior of the 'abs' function if this function is implemented through the use of the compiler's built-in (intrinsic) function as follows:
#define abs(x) (_BUILTIN_abs(x))This diagnostic is classified as:
|
V3548. AUTOSAR. Functions should not be declared at block scope.
This diagnostic rule is based on the software development guidelines developed by AUTOSAR (AUTomotive Open System ARchitecture).
A function declared at the block scope will also be visible in the namespace enclosing the block.
Look at the example:
namespace Foo
{
void func()
{
void bar(); // <=
bar();
}
}
void Foo::bar() // Function 'bar' is visible here
{
}The programmer wanted to narrow the scope of the function by declaring it in the 'func' function block. However, the 'bar' function is also visible outside the 'Foo' namespace. Therefore, one should declare the function explicitly in the enclosing namespace:
namespace Foo
{
void bar();
void func()
{
bar();
}
}
void Foo::bar() // Function 'bar' is visible
{
}Also, due to the ambiguity of the C++ grammar, the function declaration may look like an object declaration:
struct A
{
void foo();
};
int main()
{
A a();
a.foo(); // compile-time error
}This problem is known as "Most vexing parse": the compiler resolves this ambiguity of "declaring a function or an object" in favor of "declare a function". Therefore, despite the programmer's intention to declare an object of the 'A' class and call the 'A::foo' non-static member function, the compiler will perceive this as a declaration of the 'a' function, that does not accept parameters and returns type 'A'.
To avoid confusion, the analyzer also warns about such declarations.
This diagnostic is classified as:
|
V3549. AUTOSAR. The global namespace should only contain 'main', namespace declarations and 'extern "C"' declarations.
This diagnostic rule is based on the software development guidelines developed by AUTOSAR (AUTomotive Open System ARchitecture) .
Declarations in the global space clutter the list of available identifiers. New identifiers added to the block's scope may be similar to identifiers in the global space. This can confuse a developer and lead to incorrect identifier choice.
To guarantee the developer's expectations, all identifiers must be located inside the corresponding namespaces.
The analyzer issues a warning for the following code example:
int x1;
void foo();According to the rule, this code should look like this:
namespace N1
{
int x1;
void foo();
}Another possible version with the extern "C" may look like this:
extern "C"
{
int x1;
}
extern "C" void bar();Here is what the AUTOSAR standard suggests. If the name of the type alias contains the size of its final type, we can use 'typedef' in the global namespace.
The analyzer doesn't issue warnings for the following code example:
typedef short int16_t;
typedef int INT32;
typedef unsigned long long Uint64;The analyzer issues warnings for the following code example:
typedef std::map<std::string, std::string> TestData;
typedef int type1;This diagnostic is classified as:
|
V3550. AUTOSAR. The identifier 'main' should not be used for a function other than the global function 'main'.
This diagnostic rule is based on the software development guidelines developed by AUTOSAR (AUTomotive Open System ARchitecture) .
The 'main' function should only be present in the global namespace. This way a developer will be sure - if the 'main' function appears, it is always the entry point to the program.
The analyzer issues a warning for the following code example:
namespace N1
{
int main();
}Another code example that triggers the analyzer:
namespace
{
int main();
}If we rewrite the code by the rule, we will get the following:
namespace N1
{
int start();
}This diagnostic is classified as:
|
V3551. AUTOSAR. An identifier with array type passed as a function argument should not decay to a pointer.
This diagnostic rule is based on the software development guidelines developed by AUTOSAR (AUTomotive Open System ARchitecture) .
If you pass an array to a function by pointer, you will lose the array size. As a result, the function may receive an array with a fewer number of elements as an argument than it is expected. During execution the function may violate array bounds. This will result in undefined behaviour.
Pass the array only by reference not to lose data on the array size. If a function needs to handle arrays of different lengths, use a class to encapsulate the array and its size.
Example of code that does not follow the rule:
void foo(int *ptr);
void bar(int arr[5])
void bar(const char chars[30]);
int main
{
int array[5] = { 1, 2, 3 };
foo(array);
bar(array);
}Acceptable version:
Void bar(int (&arr)[5]);
int main
{
int array[7] = { 1, 2, 3, 4, 5 };
bar(array);
}Another code example that does not follow the rule:
void bar(const char chars[30]);
int main()
{
bar("something"); //const char[10]
}An acceptable version with a class for encapsulation:
template <typename T>
class ArrayView
{
T *m_ptr;
size_t m_size;
public:
template <size_t N>
ArrayView(T (&arr)[N]) noexcept: m_ptr(arr), m_size(N) {}
// ....
};
void bar(ArrayView<const char> arr);
int main()
{
bar("something");
}This diagnostic is classified as:
|
V3552. AUTOSAR. Cast should not convert a pointer to a function to any other pointer type, including a pointer to function type.
This diagnostic rule is based on the AUTOSAR (AUTomotive Open System ARchitecture) software development standard.
When a pointer to a function is cast to any other pointer, undefined behavior occurs. Type casting between pointers to functions of incompatible types causes undefined behavior when this function is called.
The code below violates this rule - all four type casts are invalid:
void foo(int32_t x);
typedef void (*fp)(int16_t x);
void bar()
{
fp fp1 = reinterpret_cast<fp>(&foo);
fp fp2 = (fp)foo;
void* vp = reinterpret_cast<void*>(fp1);
char* chp = (char*)fp1;
}Using such pointers to call the function may potentially cause segmentation errors.
This diagnostic is classified as:
|
V3553. AUTOSAR. The standard signal handling functions should not be used.
This diagnostic rule is based on the software development guidelines developed by AUTOSAR (AUTomotive Open System ARchitecture).
Standard library functions of the header files <signal.h> / <csignal> may be dangerous. Their behavior depends on the implementation, and their use may cause undefined behavior.
The use of signal handlers in a multithreaded program, for example, could be one of the reasons for undefined behavior. Other reasons you will find here.
The analyzer issues this warning when it detects the following functions:
- signal;
- raise.
Here is an example of code triggering this warning:
#include <csignal>
void handler(int sig) { .... }
void foo()
{
signal(SIGINT, handler);
}This diagnostic is classified as:
|
V3554. AUTOSAR. The standard input/output functions should not be used.
This diagnostic rule is based on the AUTOSAR (AUTomotive Open System ARchitecture) manual for software development.
The standard library functions from the '<stdio.h>' / '<cstdio>' and '<wchar.h>' header files can be dangerous. Their behavior depends on the implementation. Besides, their use might lead to undefined behavior.
Look at the code fragment:
#include <stdio.h>
void InputFromFile(FILE *file); // Read from 'file'
void foo()
{
FILE *stream;
....
InputFromFile(stream);
fflush(stream);
}First, code reads data via the 'stream' file descriptor, which is then passed to the 'fflush' function. This sequence of operations leads to undefined behavior.
The analyzer issues a warning if it detects the use of any functions defined in the '<stdio.h>' / '<cstdio>' and '<wchar.h>' header files:
- fopen;
- fclose;
- freopen;
- fflush;
- setbuf;
- setvbuf;
- etc.
For example, the analyzer issues a warning for the code below:
#include <stdio.h>
void foo(const char *filename, FILE *oldFd)
{
FILE *newFd = freopen(filename, "r", oldFd);
....
}This diagnostic is classified as:
|
V3555. AUTOSAR. The 'static' storage class specifier should be used in all declarations of functions that have internal linkage.
This diagnostic rule is based on the software development guidelines developed by AUTOSAR (AUTomotive Open System ARchitecture).
A function declared once with 'internal linkage', when redeclared or defined, will also have 'internal linkage'. This may not be obvious to developers, and therefore you should explicitly specify the 'static' specifier in each declaration and definition.
The following code does not comply with the rule, since the definition does not reflect the internal linkage type specified in the 'foo' function declaration with the 'static' keyword:
static void foo(int x);
void foo(int x)
{
....
}According to the rule, the code fragment should be as follows:
static void foo(int x);
static void foo(int x)
{
....
}In the example below, the definition of the 'foo' function with the 'extern' storage class specifier does not specify the 'external linkage' type, as it might seem. The linkage type remains 'internal linkage':
static void foo(int x);
extern void foo(int x)
{
....
}The correct option:
extern void foo(int x);
extern void foo(int x)
{
....
}This diagnostic is classified as:
|
V5001. OWASP. It is highly probable that the semicolon ';' is missing after 'return' keyword.
The analyzer found a code fragment where the semicolon ';' is probably missing.
Here is an example of code that causes generating the V5001 diagnostic message:
void Foo();
void Foo2(int *ptr)
{
if (ptr == NULL)
return
Foo();
...
}The programmer intended to terminate the function's operation if the pointer ptr == NULL. But the programmer forgot to write the semicolon ';' after the return operator which causes the call of the Foo() function. The functions Foo() and Foo2() do not return anything and therefore the code is compiled without errors and warnings.
Most probably, the programmer intended to write:
void Foo();
void Foo2(int *ptr)
{
if (ptr == NULL)
return;
Foo();
...
}But if the initial code is still correct, it is better to rewrite it in the following way:
void Foo2(int *ptr)
{
if (ptr == NULL)
{
Foo();
return;
}
...
}The analyzer considers the code safe if the "if" operator is absent or the function call is located in the same line with the "return" operator. You might quite often see such code in programs. Here are examples of safe code:
void CPagerCtrl::RecalcSize()
{
return
(void)::SendMessageW((m_hWnd), (0x1400 + 2), 0, 0);
}
void Trace(unsigned int n, std::string const &s)
{ if (n) return TraceImpl(n, s); Trace0(s); }This diagnostic is classified as:
|
V5002. OWASP. An empty exception handler. Silent suppression of exceptions can hide the presence of bugs in source code during testing.
An exception handler was found that does not do anything.
Consider this code:
try {
...
}
catch (MyExcept &)
{
}Of course, this code is not necessarily incorrect. But it is very odd to suppress an exception by doing nothing. Such exception handling might conceal defects in the program and complicate the testing process.
You must react to exceptions somehow. For instance, you may add "assert(false)" at least:
try {
...
}
catch (MyExcept &)
{
assert(false);
}Programmers sometimes use such constructs to return control from a number of nested loops or recursive functions. But it is bad practice because exceptions are very resource-intensive operations. They must be used according to their intended purpose, i.e. for possible contingencies that must be handled on a higher level.
The only thing where you may simply suppress exceptions is destructors. A destructor must not throw exceptions. But it is often not quite clear what to do with exceptions in destructors and the exception handler might well remain empty. The analyzer does not warn you about empty handlers inside destructors:
CClass::~ CClass()
{
try {
DangerousFreeResource();
}
catch (...) {
}
}This diagnostic is classified as:
V5003. OWASP. The object was created but it is not being used. The 'throw' keyword could be missing.
The analyzer has detected a strange use of the std::exception class or derived class. The analyzer generates this warning when an object of the std::exception / CException type is created but not being used.
For example:
if (name.empty())
std::logic_error("Name mustn't be empty");The error is this: the key word 'throw' is missing by accident. As a result, this code does not generate an exception in case of an error. This is the fixed code:
if (name.empty())
throw std::logic_error("Name mustn't be empty");This diagnostic is classified as:
|
V5004. OWASP. Consider inspecting the expression. Bit shifting of the 32-bit value with a subsequent expansion to the 64-bit type.
The analyzer has detected a potential error in an expression containing a shift operation: a 32-bit value is shifted in the program. The resulting 32-bit value is then explicitly or implicitly cast to a 64-bit type.
Consider an example of incorrect code:
unsigned __int64 X;
X = 1u << N;This code causes undefined behavior if the N value is higher than 32. In practice, it means that you cannot use this code to write a value higher than 0x80000000 into the 'X' variable.
You can fix the code by making the type of the left argument 64-bit.
This is the correct code:
unsigned __int64 X;
X = 1ui64 << N;The analyzer will not generate the warning if the result of an expression with the shift operation fits into a 32-bit type. It means that significant bits don't get lost and the code is correct.
This is an example of safe code:
char W = 7;
long long Q = W << 10;The code works in the following way. At first, the 'W' variable is extended to the 32-bit 'int' type. Then a shift operation is performed and we get the value 0x00001C00. This number fits into a 32-bit type, which means that no error occurs. At the last step this value is extended to the 64-bit 'long long' type and written into the 'Q' variable.
This diagnostic is classified as:
|
V5005. OWASP. A value is being subtracted from the unsigned variable. This can result in an overflow. In such a case, the comparison operation can potentially behave unexpectedly.
The analyzer has detected a potential overrun.
The following operations are executed:
- some value is being subtracted from an unsigned variable;
- the result is compared to a certain value (operators <, <=, >, >= are used).
If an overrun occurs during the subtraction, the check result might be different from what the programmer expects.
Consider the simplest case:
unsigned A = ...;
int B = ...;
if (A - B > 1)
Array[A - B] = 'x';The programmer believes that this check will protect the code against an array overrun. But this check won't help if A < B.
Let A = 3 and B = 5;
Then 0x00000003u - 0x00000005i = FFFFFFFEu
The "A - B" expression has the "unsigned int" type according to the C++ standards. It means that "A - B" will equal FFFFFFFEu. This number is higher than one. As a result, memory outside the array's boundaries will be addressed.
There are two ways to fix the code. First, we may use variables of signed types to participate in calculations:
intptr_t A = ...;
intptr_t B = ...;
if (A - B > 1)
Array[A - B] = 'x';Second, we can change the condition. How exactly it should be done depends on the result we want to get and the input values. If B >= 0, we just need to write the following code:
unsigned A = ...;
int B = ...;
if (A > B + 1)
Array[A - B] = 'x';If the code is correct, you may turn off the diagnostic message for this line using the "//-V5005" comment.
This diagnostic is classified as:
|
V5006. OWASP. More than N bits are required to store the value, but the expression evaluates to the T type which can only hold K bits.
The analyzer has detected a potential error in an expression using shift operations. Shift operations cause an overflow and loss of the high-order bits' values.
Let's start with a simple example:
std::cout << (77u << 26);The value of the "77u << 26" expression equals 5167382528 (0x134000000) and is of the 'unsigned int' type at the same time. It means that the high-order bits will be truncated and you'll get the value 872415232 (0x34000000) printed on the screen.
Overflows caused by shift operations usually indicate a logic error or misprint in the code. It may be, for example, that the programmer intended to define the number '77u' as an octal number. If this is the case, the correct code should look like this:
std::cout << (077u << 26);No overflow occurs now; the value of the "077u << 26" expression is 4227858432 (0xFC000000).
If you need to have the number 5167382528 printed, the number 77 must be defined as a 64-bit type. For example:
std::cout << (77ui64 << 26);Now let's see what errors we may come across in real life. The two samples shown below are taken from real applications.
Example 1.
typedef __UINT64 Ipp64u;
#define MAX_SAD 0x07FFFFFF
....
Ipp64u uSmallestSAD;
uSmallestSAD = ((Ipp64u)(MAX_SAD<<8));The programmer wants the value 0x7FFFFFF00 to be written into the 64-bit variable uSmallestSAD. But the variable will store the value 0xFFFFFF00 instead, as the high-order bits will be truncated because of the MAX_SAD<<8 expression being of the 'int' type. The programmer knew that and decided to use an explicit type conversion. Unfortunately, he made a mistake when arranging parentheses. This is a good example to demonstrate that such bugs can easily be caused by ordinary mistakes. This is the fixed code:
uSmallestSAD = ((Ipp64u)(MAX_SAD))<<8;Example 2.
#define MAKE_HRESULT(sev,fac,code) \
((HRESULT) \
(((unsigned long)(sev)<<31) | \
((unsigned long)(fac)<<16) | \
((unsigned long)(code))) )
*hrCode = MAKE_HRESULT(3, FACILITY_ITF, messageID);The function must generate an error message in a HRESULT-variable. The programmer uses the macro MAKE_HRESULT for this purpose, but in a wrong way. He suggested that the range for the first argument 'severity' was to be from 0 to 3 and must have mixed these figures up with the values needed for the mechanism of error code generation used by the functions GetLastError()/SetLastError().
The macro MAKE_HRESULT can only take either 0 (success) or 1 (failure) as the first argument. For details on this issue see the topic on the CodeGuru website's forum: Warning! MAKE_HRESULT macro doesn't work.
Since the number 3 is passed as the first actual argument, an overflow occurs. The number 3 "turns into" 1, and it's only thanks to this that the error doesn't affect program execution. I've given you this example deliberately just to show that it's a frequent thing when your code works because of mere luck, not because it is correct.
The fixed code:
*hrCode = MAKE_HRESULT(SEVERITY_ERROR, FACILITY_ITF, messageID);This diagnostic is classified as:
|
V5007. OWASP. Consider inspecting the loop expression. It is possible that the 'i' variable should be incremented instead of the 'n' variable.
The analyzer has detected a potential error in a loop: there may be a typo which causes a wrong variable to be incremented/decremented.
For example:
void Foo(float *Array, size_t n)
{
for (size_t i = 0; i != n; ++n)
{
....
}
}The variable 'n' is incremented instead of the variable 'i'. It results in an unexpected program behavior.
This is the fixed code:
for (size_t i = 0; i != n; ++i)This diagnostic is classified as:
|
V5008. OWASP. Classes should always be derived from std::exception (and alike) as 'public'.
The analyzer has detected a class derived from the std::exception class (or other similar classes) through the private or protected modifier. What is dangerous about such inheritance is that in case of nonpublic inheritance, the attempt to catch a std::exception will fail.
The error is often a result of the programmer forgetting to specify an inheritance type. According to the language rules, the default inheritance type is private inheritance. It results in exception handlers behaving other way than expected.
For example, see the following incorrect code:
class my_exception_t : std::exception // <=
{
public:
explicit my_exception_t() { }
virtual const int getErrorCode() const throw() { return 42; }
};
....
try
{ throw my_exception_t(); }
catch (const std::exception & error)
{ /* Can't get there */ }
catch (...)
{ /* This code executed instead */ }The code to catch all the standard and user exceptions "catch (const std::exception & error)" won't work properly because private inheritance does not allow for implicit type conversion.
To make the code run correctly, we need to add the public modifier before the base class std::exception in the list of base classes:
class my_exception_t : public std::exception
{
....
}This diagnostic is classified as:
|
V5009. OWASP. Unchecked tainted data is used in expression.
The analyzer has detected the use of external data without preliminary check. Putting too much trust in such data may have various negative implications, including security issues.
At present, the V5009 diagnostic detects the following error patterns:
- Unchecked tainted data is used in index.
- Unchecked tainted data is used in the argument that is expected to contain verified data.
- Corrupting a pointer by changing its value using unchecked tainted data.
- Division by unchecked tainted data.
Each pattern is discussed in detail below.
Example of suspicious code using unchecked tainted data in index:
size_t index = 0;
....
if (scanf("%zu", &index) == 1)
{
....
DoSomething(arr[index]); // <=
}Executing this code may result in indexing beyond the bounds of the 'arr' array if the user enters a value that is negative or greater than the maximum index valid for this array.
The correct version of this code checks the value passed before indexing into the array:
if (index < ArraySize)
DoSomething(arr[index]);Example of suspicious code using unchecked tainted data as an argument to a function:
char buf[1024];
char username [256];
....
if (scanf("%255s", username) == 1)
{
if (snprintf(buf, sizeof(buf) - 1, commandFormat, username) > 0)
{
int exitCode = system(buf); // <=
....
}
....
}This code is vulnerable as the program passes the user input to the command-line interpreter without checking it. For example, entering "&cmd" in Windows could give the user access to the command-line interpreter.
The correct version of the code must execute an additional check of the data read:
if (IsValid(username))
{
if (snprintf(buf, sizeof(buf) - 1, commandFormat, username) > 0)
{
int exitCode = system(buf);
....
}
....
}
else
{
printf("Invalid username: %s", username);
....
}Example of suspicious code with pointer corruption:
size_t offset = 0;
int *pArr = arr;
....
if (scanf("%zu", &offset) == 1)
{
pArr += offset; // <=
....
DoSomething(pArr);
}In this example, the value of the 'pArr' pointer becomes corrupt because adding the unchecked tainted value 'offset' may cause the pointer to start referencing beyond the array bounds. This poses a risk of corrupting some data (which will be referred to by 'pArr') with unpredictable consequences.
The correct version of the code checks the validity of the offset:
if (offset <= allowableOffset)
{
pArr += offset;
....
DoSomething(pArr);
}The example of suspicious code with division by unchecked tainted data:
if (fscanf(stdin, "%zu", &denominator) == 1)
{
targetVal /= denominator;
}This code may result in division by 0 if a corresponding value is entered by a user.
Correct code performs a check of values validation:
if (fscanf(stdin, "%zu", &denominator) == 1)
{
if (denominator > MinDenominator && denominator < MaxDenominator)
{
targetVal /= denominator;
}
}This diagnostic is classified as:
V5010. OWASP. The variable is incremented in the loop. Undefined behavior will occur in case of signed integer overflow.
The analyzer has detected a potential signed integer overflow in a loop. Overflowing signed variables leads to undefined behavior.
Consider the following example:
int checksum = 0;
for (....) {
checksum += ....;
}This is an abstract algorithm to calculate a checksum. It implies the possibility of overflowing the 'checksum' variable, but since this variable is signed, an overflow will result in undefined behavior. The code above is incorrect and must be rewritten.
You should use unsigned types whose overflow semantics are well-defined.
Fixed code:
unsigned checksum = 0;
for (....) {
checksum += ...
}Some programmers believe that there is nothing bad about signed overflow and that they can predict their program's behavior. This is a wrong assumption because there are many possible outcomes.
Let's examine how errors of this type occur in real-life programs. One developer left a post on the forum complaining about GCC's acting up and incorrectly compiling his code in optimization mode. He included the code of a string checksum function that he used in his program:
int foo(const unsigned char *s)
{
int r = 0;
while(*s) {
r += ((r * 20891 + *s *200) | *s ^ 4 | *s ^ 3) ^ (r >> 1);
s++;
}
return r & 0x7fffffff;
}His complaint is that the compiler does not generate code for the bitwise AND (&), which makes the function return negative values although it should not.
The developer believes this has to do with some bug in the compiler, but in fact it is his own fault since he wrote incorrect code. The function does not work properly because of undefined behavior occurring in it.
The compiler sees that the 'r' variable is used to calculate and store a sum. It assumes that this variable cannot overflow because that would be considered undefined behavior, which the compiler should not investigate and take into account whatsoever. So, the compiler assumes that since the 'r' variable cannot store a negative value after the loop terminates, then the 'r & 0x7fffffff' operation, which sets off the sign bit, is unnecessary, so it simply returns the value of the 'r' variable from the function.
It is defects like this that diagnostic V5010 is designed for. To fix the code, you should simply use an unsigned variable to calculate the checksum.
Fixed code:
int foo(const unsigned char *s)
{
unsigned r = 0;
while(*s) {
r += ((r * 20891 + *s *200) | *s ^ 4 | *s ^ 3 ) ^ (r >> 1);
s++;
}
return (int)(r & 0x7fffffff);
}References:
- Andrey Karpov. Undefined behavior is closer than you think.
- Will Dietz, Peng Li, John Regehr, and Vikram Adve. Understanding Integer Overflow in C/C++.
This diagnostic is classified as:
|
V5011. OWASP. Possible overflow. Consider casting operands, not the result.
The analyzer has detected a suspicious type cast: the result of a binary operation over 32-bit values is cast to a 64-bit type.
Consider the following example:
unsigned a;
unsigned b;
....
uint64_t c = (uint64_t)(a * b);This cast is redundant: type 'unsigned' would have been automatically promoted to type 'uint64_t' anyway when executing the assignment operation.
The developer must have intended to take measures against a possible overflow but failed to do that properly. When multiplying 'unsigned' variables, the overflow will take place anyway, and only then will the meaningless product be explicitly promoted to type 'uint64_t'.
It is one of the operands that should have been cast instead to avoid the overflow. Fixed code:
uint64_t c = (uint64_t)a * b;This diagnostic is classified as:
|
V5012. OWASP. Potentially unsafe double-checked locking.
The analyzer has detected a potential error that has to do with unsafe use of the "double-checked locking" pattern. This pattern is used to reduce the overhead of acquiring a lock. First the locking criterion is checked without synchronization, and only if this criterion is met, will the thread attempt to acquire the lock. That is, locking will occur only if the check indicates that locking is required.
Consider the following example:
static std::mutex mtx;
class TestClass
{
public:
void Initialize()
{
if (!initialized)
{
std::lock_guard lock(mtx);
if (!initialized) // <=
{
resource = new SomeType();
initialized = true;
}
}
}
/* .... */
private:
bool initialized = false;
SomeType *resource = nullptr;
};
}In this example, the compiler optimizes the order of assigning values to the variables 'resource' and 'initialized', which could lead to an error. That is, the 'initialized' variable will be assigned the value 'true' first and only then will the memory for an object of type 'SomeType' be allocated and the variable 'resource' initialized.
Because of this inversion, an error may occur when the object is accessed from another thread: the 'resource' variable will not be initialized yet, while the 'intialized' flag will be already set to 'true'.
One of the problems with this type of errors is that the program seems to be running correctly since the described situation will occur only every now and then, depending on the processor's architecture.
Additional links:
- Scott Meyers and Andrei Alexandrescu. C++ and the Perils of Double-Checked Locking.
- Stack Overflow. What the correct way when use Double-Checked Locking with memory barrier in c++?
This diagnostic is classified as:
|
V5013. OWASP. Storing credentials inside source code can lead to security issues.
The analyzer has detected data that may be confidential. Credentials can be used as such data.
If you store credentials in the source code, an intruder might access and make use of the data not intended for public use. Having access to a build, an attacker can use a disassembler to see all the string literals used in it. In the case of open-source projects, everything is even easier - an attacker can view even the source code.
Thus, all secret data can become publicly available. Vulnerabilities associated with insufficient security of confidential data are identified as a separate risk category in the OWASP Top 10 Application Security Risks 2017: A2:2017-Broken Authentication.
Consider an example:
bool LoginAsAdmin(const std::string &userName,
const std::string &password)
{
if (userName == "admin" && password == "sRbHG$a%")
{
....
return true;
}
return false;
}In this example, the password used to log in as an administrator is stored in the code. An attacker can easily get the authorization data and perform actions as a system administrator.
Instead of storing secret data in code, it is better to use, for example, storage classes. This way, data will be stored in encrypted form. Ordinary users do not have direct access to it. In this case, the code may look, for example, like this:
bool LoginAsAdmin(const DataStorage &secretStorage,
const std::string &userName,
const std::string &password)
{
var adminData = secretStorage.GetAdminData();
if ( userName == adminData.UserName
&& password == adminData.Password)
{
....
return true;
}
return false;
}This diagnostic is classified as:
V5601. OWASP. Storing credentials inside source code can lead to security issues.
The analyzer has detected a block of code that contains what seems to be sensitive data, such as passwords.
Storing such data in the source code can lead to broken access control and providing the user with privileges not intended for public use. Any user who has access to the build can see all the string literals used in it. This can be done easily by studying the metadata or the IL code using the ildasm utility. With open-source projects, disclosing such information becomes even easier since the attacker can study the source code directly.
Thus, all sensitive data may become publicly available. Vulnerabilities resulting from insufficient protection of sensitive data make a separate category on OWASP Top 10 Application Security Risks 2017: A2:2017-Broken Authentication.
Consider the following example:
bool LoginAsAdmin(string userName, string password)
{
if (userName == "admin" && password == "sRbHG$a%")
{
....
return true;
}
return false;
}In this snippet, the password used to log in as Administrator is stored inside the code. By studying the build's metadata or the IL code, the attacker can easily get access to the authorization data and, therefore, all the administrative privileges.
Instead of storing sensitive data in the source code, use, for example, storages that store data in encrypted form and cannot be directly accessed by regular users. This is what code using such a storage may look like:
bool LoginAsAdmin(DataStorage secretStorage,
string userName,
string password)
{
var adminData = secretStorage.GetAdminData();
if ( userName == adminData.UserName
&& password == adminData.Password)
{
....
return true;
}
return false;
}This diagnostic is classified as:
V5602. OWASP. The object was created but it is not being used. The 'throw' keyword could be missing.
The analyzer has detected a potential error when an instance of a class derived from 'System.Exception' is created but not being used in any way.
Here's an example of incorrect code:
public void DoSomething(int index)
{
if (index < 0)
new ArgumentOutOfRangeException();
else
....
}In this fragment, the 'throw' statement is missing, so executing this code will only result in creating an instance of a class derived from 'System.Exception' without it being used in any way, and the exception won't be generated. The correct version of this code should look something like this:
public void DoSomething(int index)
{
if (index < 0)
throw new ArgumentOutOfRangeException();
else
....
}This diagnostic is classified as:
|
V5603. OWASP. The original exception object was swallowed. Stack of original exception could be lost.
The analyzer detected that the original object of a caught exception was not used properly when re-throwing from a catch block. This issue makes some errors hard to detect since the stack of the original exception is lost.
Further we will discuss a couple of examples of incorrect code. The first example:
public Asn1Object ToAsn1Object()
{
try
{
return Foo(_constructed, _tagNumber);
}
catch (IOException e)
{
throw new ParsingException(e.Message);
}
}In this code, the programmer wanted to transform the caught I/O exception into a new exception of type 'ParsingException'. However, only the message from the first exception is included, so some of the information is lost.
The fixed version of the code:
public Asn1Object ToAsn1Object()
{
try
{
return Foo(_constructed, _tagNumber);
}
catch (IOException e)
{
throw new ParsingException(e.Message, e);
}
}In the fixed version, the original exception is re-thrown as an inner one, so all the information about the original error is saved.
Here's the second example:
private int ReadClearText(byte[] buffer, int offset, int count)
{
int pos = offset;
try
{
....
}
catch (IOException ioe)
{
if (pos == offset) throw ioe;
}
return pos - offset;
}In this case, the caught I/O exception is thrown again, completely erasing the stack of the original error. To avoid this defect, we just need to re-throw the original exception.
The fixed version of the code:
private int ReadClearText(byte[] buffer, int offset, int count)
{
int pos = offset;
try
{
....
}
catch (IOException ioe)
{
if (pos == offset) throw;
}
return pos - offset;
}This diagnostic is classified as:
|
V5604. OWASP. Potentially unsafe double-checked locking. Use volatile variable(s) or synchronization primitives to avoid this.
The analyzer detected a possible error related to unsafe use of the "double-checked locking" pattern. This software design pattern is used to reduce the overhead of acquiring a lock by first testing the locking criterion without actually acquiring the lock. Only if the locking criterion check indicates that locking is required, does the actual locking logic proceed. That is, locking will be performed only if really needed.
Consider the following example of unsafe implementation of this pattern in C#:
private static MyClass _singleton = null;
public static MyClass Singleton
{
get
{
if(_singleton == null)
lock(_locker)
{
if(_singleton == null)
{
MyClass instance = new MyClass();
instance.Initialize();
_singleton = instance;
}
}
return _singleton;
}
}In this example, the pattern is used to implement "lazy initialization" – that is, initialization is delayed until a variable's value is needed for the first time. This code will work correctly in a program that uses a singleton object from one thread. To ensure safe initialization in a multithreaded program, a construct with the lock statement is usually used. However, it's not enough in our example.
Note the call to method 'Initialize' of the 'Instance' object. When building the program in Release mode, the compiler may optimize this code and invert the order of assigning the value to the '_singleton' variable and calling to the 'Initialize' method. In that case, another thread accessing 'Singleton' at the same time as the initializing thread may get access to the object before initialization is over.
Here's another example of using the double-checked locking pattern:
private static MyClass _singleton = null;
private static bool _initialized = false;
public static MyClass Singleton;
{
get
{
if(!_initialized)
lock(_locker)
{
if(!_initialized)
{
_singleton = new MyClass();
_initialized = true;
}
}
return _singleton;
}
}Like in the previous example, compiler optimization of the order of assigning values to variables '_singleton' and '_initialized' may cause errors. That is, the '_initialized' variable will be assigned the value 'true' first, and only then will a new object of the 'MyClass' type, be created and the reference to it be assigned to '_singleton'.
Such inversion may cause an error when accessing the object from a parallel thread. It turns out that the '_singleton' variable will not be specified yet while the '_initialized' flag will be already set to 'true'.
One of the dangers of these errors is the seeming correctness of the program's functioning. Such false impression occurs because this problem won't occur very often and will depend on the architecture of the processor used, CLR version, and so on.
There are several ways to ensure thread-safety when using the pattern. The simplest way is to mark the variable checked in the if condition with the 'volatile' keyword:
private static volatile MyClass _singleton = null;
public static MyClass Singleton
{
get
{
if(_singleton == null)
lock(_locker)
{
if(_singleton == null)
{
MyClass instance = new MyClass();
instance.Initialize();
_singleton = instance;
}
}
return _singleton;
}
}The volatile keyword will prevent the variable from being affected by possible compiler optimizations related to swapping write/read instructions and caching its value in processor registers.
For performance reasons, it's not always a good solution to declare a variable as volatile. In that case, you can use the following methods to access the variable: 'Thread.VolatileRead', 'Thread.VolatileWrite', and 'Thread.MemoryBarrier'. These methods will put barriers for reading/writing memory only where necessary.
Finally, you can implement "lazy initialization" using the 'Lazy<T>' class, which was designed specifically for this purpose and is available in .NET starting with version 4.
See also: Detecting the incorrect double-checked locking using the V3054 diagnostic.
This diagnostic is classified as:
|
V5605. OWASP. Unsafe invocation of event, NullReferenceException is possible. Consider assigning event to a local variable before invoking it.
The analyzer detected a potentially unsafe call to an event handler that may result in 'NullReferenceException'.
Consider the following example:
public event EventHandler MyEvent;
void OnMyEvent(EventArgs e)
{
if (MyEvent != null)
MyEvent(this, e);
}In this code, the 'MyEvent' field is tested for 'null', and then the corresponding event is invoked. The null check helps to prevent an exception if there are no event subscribers at the moment when the event is invoked (in this case, 'MyEvent' will be null).
Suppose, however, there is one subscriber to the 'MyEvent' event. Then, at the moment between the null check and the call to the event handler by the 'MyEvent()' invocation, the subscriber may unsubscribe from the event - for example on a different thread:
MyEvent -= OnMyEventHandler;Now, if the 'OnMyEventHandler' handler was the only subscriber to 'MyEvent' event, the 'MyEvent' field will have a null value, but because in our hypothetical example the null check has already executed on another thread where the event is to be invoked, the line 'MyEvent()' will be executed. This situation will cause a 'NullReferenceException'.
Therefore, a null check alone is not enough to ensure safe event invocation. There are many ways to avoid the potential error described above. Let's see what these ways are.
The first solution is to create a temporary local variable to store a reference to event handlers of our event:
public event EventHandler MyEvent;
void OnMyEvent(EventArgs e)
{
EventHandler handler = MyEvent;
if (handler != null)
handler(this, e);
}This solution will allow calling event handlers without raising the exception. Even if the event subscriber gets unsubscribed at the point between testing 'handler' for null and invoking it, as in our first example, the 'handler' variable will still be storing the reference to the original handler, and this handler will be invoked correctly despite the fact that the 'MyEvent' event no longer contains this handler.
Another way to avoid the error is to assign an empty handler, with an anonymous method or lambda expression, to the event field at its initialization:
public event EventHandler MyEvent = (sender, args) => {};This solution guarantees that the 'MyEvent' field will never have a null value, as such anonymous method cannot be unsubscribed (unless it's stored in a separate variable, of course). It also enables us to do without a null check before invoking the event.
Finally, starting with C# version 6.0 (Visual Studio 2015), you can use the '?.' operator to ensure safe event invocation:
MyEvent?.Invoke(this, e);This diagnostic is classified as:
|
V5606. OWASP. An exception handling block does not contain any code.
The analyzer has detected an empty exception handling block ('catch' or 'finally'). Inappropriate exception handling may decrease the application's reliability.
In some cases, inappropriate exception handling may result in a vulnerability. Insufficient logging and monitoring are pointed out as a separate category on OWASP Top 10 Application Security Risks 2017: A10:2017-Insufficient Logging & Monitoring.
The following example contains an empty 'catch' block:
try
{
someCall();
}
catch
{
}Code like this is not necessarily faulty, of course. But simply suppressing an exception without taking any further precautions against it is a strange practice since such insufficient exception handling may let defects stay unnoticed.
Logging is one example of how you can handle an exception. At least it will prevent the exception from passing unnoticed:
try
{
someCall();
}
catch (Exception e)
{
Logger.Log(e);
}An empty 'finally' block is no less suspicious. It may indicate incomplete implementation of some logic necessary for reliable behavior of the program. Consider the following example:
try
{
someCall();
}
catch
{ .... }
finally
{
}This code is very likely to be faulty or simply redundant. Unlike the empty 'catch' block, which can be used to suppress an exception, the empty 'finally' block has no practical use at all.
This diagnostic is classified as:
V5607. OWASP. Exception classes should be publicly accessible.
The analyzer has detected an exception class inaccessible to other builds. If such an exception is thrown, the external code will have to catch instances of the nearest accessible parent class such as the base class of all exceptions, 'Exception'. This hinders exception handling since the code of other builds cannot identify the problem precisely.
Lack of clear identification of exceptions poses an additional security risk because some specific exceptions may require specific handling rather than general handling. Insufficient logging and monitoring (including exception identification) are pointed out as a separate category on OWASP Top 10 Application Security Risks 2017: A10:2017-Insufficient Logging & Monitoring.
Consider the following simple example taken from a real project:
internal sealed class ResourceException : Exception
{
internal ResourceException(string? name, Exception? inner = null)
: base(name, inner)
{
}
}To correctly handle a given exception, the exception class must be declared as 'public':
public sealed class ResourceException : Exception
{
internal ResourceException(string? name, Exception? inner = null)
: base(name, inner)
{
}
}This will enable other builds to catch and handle this particular exception.
Keep in mind that declaring an exception class as 'public' may be insufficient if it is a nested class, as in the following example:
namespace SomeNS
{
class ContainingClass
{
public class ContainedException : Exception {}
....
}
}Here, the exception class is nested into 'ContainingClass', which is implicitly declared as 'internal'. Therefore, 'ContainedException' will also be accessible only within the scope of the current build even though it bears the 'public' specifier. The analyzer recognizes situations like that and issues the warning.
This diagnostic is classified as:
|
V5608. OWASP. Possible SQL injection. Potentially tainted data is used to create SQL command.
The analyzer detected an SQL command that uses data received from an external source, without a prior check. This can cause an SQL injection if the data is compromised.
An SQL injection is identified as a separate risk category in the OWASP Top 10 Application Security Risks 2017: A1:2017-Injection.
Consider an example:
void ProcessUserInfo()
{
using (SqlConnection connection = new SqlConnection(_connectionString))
{
....
String userName = Request.Form["userName"];
using (var command = new SqlCommand()
{
Connection = connection,
CommandText = "SELECT * FROM Users WHERE UserName = '" + userName + "'",
CommandType = System.Data.CommandType.Text
})
{
using (var reader = command.ExecuteReader())
....
}
}
}In this case, we receive the value of the 'userName' variable from an external source - 'Request.Form'. Then the SQL command is formed. It is dangerous to use data in this way without any check - this way attackers get to use different ways to introduce commands.
For example, an attacker can enter a special command instead of the expected value of the user name. This way all users' data will be extracted from the base and then processed.
An example of such a compromised string:
' OR '1'='1To protect against such requests, you should check the input data or, for example, use parameterized commands.
Code sample with parameterized commands used:
void ProcessUserInfo()
{
using (SqlConnection connection = new SqlConnection(_connectionString))
{
....
String userName = Request.Form["userName"];
using (var command = new SqlCommand()
{
Connection = connection,
CommandText = "SELECT * FROM Users WHERE UserName = @userName",
CommandType = System.Data.CommandType.Text
})
{
var userNameParam = new SqlParameter("@userName", userName);
command.Parameters.Add(userNameParam);
using (var reader = command.ExecuteReader())
....
}
}
}The analyzer also considers methods' parameters from other builds to be unsafe sources. Users of such builds can expect that data will be checked inside the called method. However, neither a user of the library nor its developer has checked the input data. This omission can cause vulnerabilities when using compromised data.
Consider an example:
public class DBHelper
{
public void ProcessUserInfo(String userName)
{
....
var command = "SELECT * FROM Users WHERE userName = '" + userName + "'";
ExecuteCommand(command);
....
}
private void ExecuteCommand(String rawCommand)
{
using (SqlConnection connection = new SqlConnection(_connectionString))
{
....
using (var sqlCommand = new SqlCommand(rawCommand, connection))
{
using (var reader = sqlCommand.ExecuteReader())
....
}
}
}
}The 'DBHelper' class provides the 'ProcessUserInfo' method for external use, since 'ProcessUserInfo' is available from other builds. However, the 'userName' parameter of this method is not checked in any way before use. The value obtained from the outside is directly used to form the command (the 'command' variable). Next, the received command is passed to the 'ExecuteCommand' method. In this method it is used without a prior check to create an object of the 'SqlCommand' type.
In this case, the analyzer will issue a warning due to the call to the 'ExecuteCommand' method that receives the tainted string as an argument.
Now let's look at a possible use case for the 'ProcessUserInfo' method:
static void TestHelper(DBHelper helper)
{
var userName = Request.Form["userName"];
helper.ProcessUserInfo(userName);
}A developer who has written such code may not have access to the 'DBHelper' class code. The author might rely on the input data check inside the 'ProcessUserInfo' method. But neither the current code nor the code of the 'ProcessUserInfo' method has checked the data, so this code will be vulnerable to an SQL injection.
Although such cases can lead to a vulnerability, we don't know the explicit external data source when analyzing the 'DBHelper' code. Therefore, you will get a warning with a low certainty level if the input data source is methods' parameters available for external builds.
This diagnostic is classified as:
|
V5609. OWASP. Possible path traversal vulnerability. Potentially tainted data is used as a path.
The analyzer detected external data used as paths to files or directories without a prior check. This way, the application may become vulnerable to path traversal attacks.
Attacks of this type are in a separate risk category in OWASP Top 10 Application Security Risks 2017: A5:2017-Broken Access Control.
Consider an example:
HttpResponse response;
HttpRequest request;
private void SendUserFileContent(string userDirectory)
{
....
string userFileRelativePath = request.QueryString["relativePath"];
string fullPath = Path.Combine(userDirectory,
userFileRelativePath);
var content = File.ReadAllText(fullPath);
....
response.Write(content);
}This method sends a file content from a specified user's folder. The user must have access only to the contents of files inside this repository.
As a relative path, it uses a value from an external source—'Request.QueryString'. An attacker can access the contents of any files in the system as there are no checks.
For example, each user's folder may store the userInfo.xml file, that contains different information, which may be sensitive. At the same time, the code runs on Windows. How does an attacker get access to data of the user 'admin'? It only takes to pass the following string to 'Request. QueryString["relativePath"]':
..\admin\userInfo.xmlTo protect against such an attack, a simple check for '..\' at the beginning of the string is not enough. For example, a string as follows can be passed to get the same data:
someFolder\..\..\admin\userInfo.xmlAnother opportunity for attack is to pass an absolute path instead of a relative one. If one of the 'Path.Combine' arguments is an absolute path, then all previously written arguments are ignored. For example, the method can be called as follows:
Path.Combine("folder", "childFolder", "C:\Users\Admin\secret.txt")The returned string - 'C:\Users\Admin\secret.txt'. Thus, the lack of input data check allows an attacker to access any file on the system. Follow the link to the official OWASP website. You'll get more details on path traversal attacks and ways to perform them.
To avoid path traversal, use varied approaches to check input data. In the above example, you can use a check for substrings ":" and "..\":
HttpResponse response;
HttpRequest request;
private void SendUserFileContent(string userDirectory)
{
....
string userFileRelativePath = request.QueryString["relativePath"];
if ( !userFileRelativePath.Contains(":")
&& !userFileRelativePath.Contains(@"..\"))
{
string fullPath = Path.Combine(userDirectory,
userFileRelativePath);
var content = File.ReadAllText(fullPath);
....
response.Write(content);
}
else
{
....
}
}The analyzer also considers methods' parameters available from other assemblies to be insecure data sources. This topic is covered in details in the article: "Why You Should Check Values of Public Methods' Parameters".
Consider an example of code running on Windows:
public class UserFilesManager
{
private const string UsersDirectoryAbsolutePath = ....;
private HttpResponse response;
private string userName;
public void WriteUserFile(string relativePath)
{
string path = Path.Combine(UsersDirectoryAbsolutePath,
userName,
relativePath);
WriteFile(path);
}
private void WriteFile(string absolutePath)
{
response.Write(File.ReadAllText(absolutePath));
}
}The analyzer will issue a low certainty level warning for a call of the 'WriteFile' method inside 'WriteUserFile'. After calling 'Path.Combine', insecure data gets from 'relativePath' to 'path'. Then this data acts as an argument of the 'WriteFile' call and is used as a path. This way, user input can get into the 'File.ReadAllText' method without checking, which makes this code vulnerable to path traversal.
Check parameters to protect against the attack. In this case, the check must take place before calling 'Path.Combine', because the value that 'Path.Combine' returns will be an absolute path anyway.
public void WriteUserFile(string relativePath)
{
if (relativePath.Contains(":") || relativePath.Contains(@"..\"))
{
....
return;
}
string path = Path.Combine(UsersDirectoryAbsolutePath,
userName,
relativePath);
WriteFile(path);
}This diagnostic is classified as:
|
You can look at examples of errors detected by the V5609 diagnostic. |
V5610. OWASP. Possible XSS vulnerability. Potentially tainted data might be used to execute a malicious script.
The analyzer detected tainted data that might be used to execute a malicious script. XSS vulnerability may occur.
OWASP Top 10 Application Security Risks 2017 provides a separate category for Cross-Site Scripting (XSS): A7:2017-Cross-Site Scripting (XSS).
HTTP request parameters, HTTP request body, and HTML input fields are frequent targets for XSS attacks.
Consider the simplest example of XSS delivered through URL parameters:
void OpenHtmlPage()
{
WebBrowser.Navigate(TargetSiteUrl.Text);
}In this case, the user inputs a string in the 'TargetSiteUrl.Text' text field and runs the code. The webpage defined in 'TargetSiteUrl.Text' opens.
Suppose the webpage displays the string set in the 'inputData' URL parameter.

If a user defines the <script>alert("XSS Injection")</script> element in the 'inputData' URL parameter, this code is executed when the browser renders the webpage. The string used in the script is displayed in a separate window:

The executed JavaScript code in the URL parameter is an XSS attack. By means of social engineering, an attacker can make a user insert a similar request with a malicious script in the 'TargetSiteUrl.Text' field. As a result, an attacker can gain access to a user account. For example, a hacker might use browser cookies. Thus, an attacker may steal confidential data or perform malicious actions on behalf of the user.
This XSS attack would have failed if the string in the 'TargetSiteUrl.Text' field had encoded special HTML characters before being used in the 'WebBrowser.Navigate' method:
void OpenHtmlPage()
{
var encodedUrl = System.Net.WebUtility.HtmlEncode(TargetSiteUrl.Text);
WebBrowser.Navigate(encodedUrl);
}In this case, the malicious script would not be executed. The page would simply display the following code:
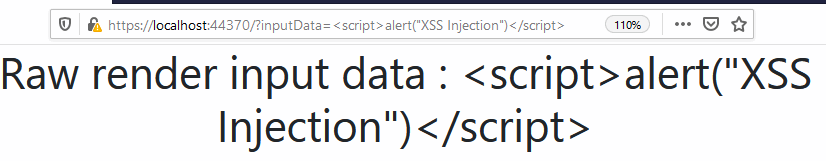
Also, an attacker may use website input fields to make an XSS attack. Some websites allow users to leave comments and view other visitors' comments after signing in. A website database stores such comments. Only authorized users may view comments on the webpage. If comments do not encode special HTML characters before being displayed, an interesting XSS attack is possible.
An attacker might sign up and leave a comment containing a malicious script, which will be saved in the database. Then, this comment is visible to all authorized users. If a webpage displays a comment where special HTML characters aren't encoded, an attacker may execute a malicious script in the browser of each authorized user who decides to view comments. Thus, an attacker may get cookies of several users at once. If a cookie stores an authentication token, the attacker will have some time to log in to the other users' accounts.
An example of code which displays users comments on the webpage:
using (var sqlConnection = ....)
{
var command = ....;
....
var reader = command.ExecuteReader();
while (reader.Read())
{
....
var userComment = reader.GetString(1);
....
Response.Write("<p>");
Response.Write(userComment);
Response.Write("</p>");
....
}
}To prevent such XSS attack, a programmer should process data either before recording it to a database or before its rendering on a website.
The fixed code for displaying comments stored in the database (the data is encoded before being displayed) can be as follows:
using (var sqlConnection = ....)
{
var command = ....;
....
var reader = command.ExecuteReader();
while (reader.Read())
{
....
var userComment = reader.GetString(1);
var encodedComment = WebUtility.HtmlEncode(userComment);
....
Response.Write("<p>");
Response.Write(encodedComment);
Response.Write("</p>");
....
}
}The analyzer also considers public methods' parameters potential sources of tainted data. This topic is covered in detail in the note "Why You Should Check Values of Public Methods' Parameters".
Consider an example of code:
public class UriHelper
{
WebBrowser WebBrowser = new WebBrowser();
private string _targetSite = "http://mysite.com";
public void ProcessUrlQuery(string urlQuery)
{
var urlRequest = _targetSite + "?" + urlQuery;
OpenWebPage(urlRequest);
}
private void OpenWebPage(string urlWithQuery)
{
WebBrowser.Navigate(urlWithQuery);
}
}While analyzing the source code of the 'ProcessUrlQuery' method, the analyzer issues a low certainty level warning on the 'OpenWebPage' method. The analyzer detects tainted data passed from the 'urlQuery' parameter to the 'Navigate' method.
The 'urlQuery' parameter is used in string concatenation. That's why the 'urlRequest' variable also contains tainted data. Then, the 'OpenWebPage' method receives 'urlRequest'. 'urlRequest' serves as the 'Navigate' method's argument. Thus, user input may get into the 'Navigate' method unverified. That makes this code vulnerable to XSS.
You can prevent XSS attacks the way described in the example above - just encode the request string before passing the argument to the 'Navigate' method:
public class UriHelper
{
WebBrowser WebBrowser = new WebBrowser();
private string _targetSite = "http://mysite.com";
public void ProcessUrlQuery(string urlQuery)
{
var urlRequest = _targetSite + "?" + urlQuery;
OpenWebPage(urlRequest);
}
private void OpenWebPage(string urlWithQuery)
{
var encodedUrlWithQuery =
System.Net.WebUtility.HtmlEncode(urlWithQuery);
WebBrowser.Navigate(encodedUrlWithQuery);
}
}This diagnostic is classified as:
|
V5611. OWASP. Potential insecure deserialization vulnerability. Potentially tainted data is used to create an object using deserialization.
The analyzer detected data from an external source that may be used to create an object during deserialization. Such code may cause various vulnerabilities.
Insecure deserializations form a separate risk category in OWASP Top 10 Application Security Risks 2017: A 8:2017-Insecure Deserialization.
Consider a synthetic example:
[Serializable]
public class User
{
....
public bool IsAdmin { get; private set; }
....
}
private static User GetUserFromFile(string filePath)
{
User user = null;
using (var fileStream = new FileStream(filePath, FileMode.Open))
{
var soapFormatter = new SoapFormatter();
user = (User) soapFormatter.Deserialize(fileStream);
}
return user;
}
static void Main(string[] args)
{
Console.WriteLine("Please provide the path to the file.");
var userInput = Console.ReadLine();
User user = GetUserFromFile(userInput);
if (user?.IsAdmin == true)
// Performs actions with elevated privileges
else
// Performs actions with limited privileges
}When running the 'Main' method, the console application will request a path to the file from a user. After you specify this path, the file contents will be deserialized into a 'User' type object. If you deserialized the object from the file successfully and the object's 'IsAdmin' property is 'true', actions with higher privileges will be made. Otherwise, privileges will be limited. Data from file is deserialized by the SOAP serializer into an object of 'User' type. Therefore, you can see the structure of an object in the file:
<SOAP-ENV:Envelope xmlns:xsi=....
xmlns:xsd=....
xmlns:SOAP-ENC=....
xmlns:SOAP-ENV=....
xmlns:clr=....
SOAP-ENV:encodingStyle=....>
<SOAP-ENV:Body>
<a1:Program_x002B_User id="ref-1" xmlns:a1=....>
<_x003C_UserId_x003E_k__BackingField>1</_x003C_UserId_x003E_k__BackingField>
<_x003C_UserName_x003E_k__.... id="ref-3">Name</_x003C_UserName_x003E_k__....>
<_x003C_IsAdmin_x003E_k__....>false</_x003C_IsAdmin_x003E_k__....>
</a1:Program_x002B_User>
</SOAP-ENV:Body>
</SOAP-ENV:Envelope>With this information, an attacker can change the value of the 'IsAdmin' property with a private setter to 'true' instead of 'false':
<_x003C_IsAdmin_x003E_k__....>true</_x003C_IsAdmin_x003E_k__....>This way the attacker will be able to get higher privileges for the deserialized object when deserializing the object from file. As a result, the program will perform actions that were initially unavailable to the object from the file. For example, the attacker will be able to steal sensitive data or perform malicious activities that were unavailable before modifying the object from the file.
To get rid of this vulnerability, you must ensure that the attacker will not be able to know the object structure when accessing the file. To do this, use encryption of data that is written to the file. C# has a 'CryptoStream' class to help with this:
private static void SerializeAndEncryptUser(User user,
string filePath,
byte[] key,
byte[] iv)
{
using (var fileStream = new FileStream(filePath, FileMode.CreateNew))
{
using (Rijndael rijndael = Rijndael.Create())
{
rijndael.Key = key;
rijndael.IV = iv;
var encryptor = rijndael.CreateEncryptor(rijndael.Key, rijndael.IV);
using (var cryptoStream = new CryptoStream(fileStream,
encryptor,
CryptoStreamMode.Write))
{
var soapFormatter = new SoapFormatter();
soapFormatter.Serialize(cryptoStream, user);
}
}
}
}This code encrypts the data obtained when the 'User' object is serialized before writing data to the file. When you process the file contents in the 'GetUserFromFile' method, you will need to decrypt the data before deserialization using 'CryptoStream':
private static User GetUserFromFile(string filePath, byte[] key, byte[] iv)
{
User user = null;
using (var fileStream = new FileStream(filePath, FileMode.Open))
{
using (Rijndael rijndael = Rijndael.Create())
{
rijndael.Key = key;
rijndael.IV = iv;
var decryptor = rijndael.CreateDecryptor(rijndael.Key,
rijndael.IV);
using (var cryptoStream = new CryptoStream(fileStream,
decryptor,
CryptoStreamMode.Read))
{
var soapFormatter = new SoapFormatter();
user = (User) soapFormatter.Deserialize(cryptoStream);
}
}
}
return user;
}This way the attacker will not know the structure and contents of the object from the file. The intruder will not be able to get higher privileges by changing the value of the 'isAdmin' property in the file. This will fix the problem of unsecure deserialization in the described example.
For more robust protection against this type of vulnerabilities, follow a few more rules, listed in the relevant OWASP Top 10 section.
The analyzer also considers methods' parameters available from other assemblies to be tainted data sources. This topic is covered in details in the article: "Why You Should Check Values of Public Methods' Parameters".
Consider an example:
public class DeserializationHelper
{
public T DesrializeFromStream<T>(Stream stream)
{
T deserializedObject = default;
using(var streamReader = new StreamReader(stream))
{
deserializedObject = DeserializeXml<T>(streamReader);
}
return deserializedObject;
}
private T DeserializeXml<T>(StreamReader streamReader)
{
return (T) new XmlSerializer(typeof(T)).Deserialize(streamReader);
}
}Here the analyzer will issue a low-certainty level warning for the 'DeserializeXml' method call when checking the 'DesrializeFromStream' method. The tool tracked the transfer of tainted data from the 'stream' parameter to the 'StreamReader' constructor. The 'Deserialize' method receives the 'streamReader' object.
You can secure from unsafe deserialization in this code in the same way as in the example above using the 'CryptoStream' class:
public class DeserializationHelper
{
public T DesrializeFromFile<T>(Stream stream, ICryptoTransform transform)
{
T deserializedObject = default;
using (var cryptoStream = new CryptoStream(stream,
transform,
CryptoStreamMode.Read))
{
using (var streamReader = new StreamReader(cryptoStream))
{
deserializedObject = DeserializeXml<T>(streamReader);
}
}
return deserializedObject;
}
private T DeserializeXml<T>(StreamReader streamReader)
{
return (T) new XmlSerializer(typeof(T)).Deserialize(streamReader);
}
}This diagnostic is classified as:
|
You can look at examples of errors detected by the V5611 diagnostic. |
V5612. OWASP. Do not use old versions of SSL/TLS protocols as it may cause security issues.
The analyzer detected the use of old SSL/TLS protocol versions in the code. This can make an application vulnerable to attacks like man-in-the-middle, BEAST, etc.
Problems related to outdated protocols can be attributed to two categories from OWASP Top Ten 2017:
Example:
public void Run(ApplePushChannelSettings settings)
{
....
var certificates = new X509CertificateCollection();
....
var stream = new SslStream(....);
stream.AuthenticateAsClient(settings.FeedbackHost,
certificates,
SslProtocols.Tls, // <=
false);
....
}In the code above, the 'SslProtocols.Tls' entity represents the 1.0 version of the TLS protocol. This version is outdated and is not recommended, because TLS 1.0 is vulnerable to a number of attacks, including the previously mentioned BEAST.
Experts recommend newer versions of protocols, for example, TLS 1.2:
public void Run(ApplePushChannelSettings settings)
{
....
var certificates = new X509CertificateCollection();
....
var stream = new SslStream(....);
stream.AuthenticateAsClient(settings.FeedbackHost,
certificates,
SslProtocols.Tls12,
false);
....
}Protocol versions below TLS 1.2 are not recommended because they may cause security problems. Such protocols are SSL 2.0 and 3.0, as well as TLS 1.0 and 1.1.
Experts also do not recommend using the 'SslProtocols.Default' value, because it corresponds to the use of outdated protocols: SSL 3.0 or TLS 1.0.
As a rule, the most suitable values are 'SslProtocols.None' and 'SecurityProtocolType.SystemDefault'. They allow the operating system to choose the data transfer protocol. If for some reason these values do not suit in your scenario, set the newest version available.
The analyzer also issues a warning if the outdated protocols are used in a called method:
SslStream _sslStream;
public string TargetHost { get; set; }
public X509CertificateCollection Certificates { get; set; }
private void PrepareSslStream()
{
....
var protocol = SslProtocols.Ssl3 | SslProtocols.Tls12;
Authenticate(protocol); // <=
....
}
private void Authenticate(SslProtocols protocol)
{
_sslStream.AuthenticateAsClient(TargetHost,
Certificates,
protocol,
true);
}In the code above, the 'Authenticate' method takes a value, that represents the SSL 3.0 and TLS 1.2 protocols, as a parameter. The method uses them to set protocols that the standard 'AuthenticateAsClient' method will use. This triggers the analyzer's warning, because SSL 3.0 is outdated and its use may lead to new vulnerabilities in the code.
In this case, the fix is the same as before - exclude the insecure protocol from the list of the available ones:
private void PrepareSslStream()
{
....
var protocol = SslProtocols.Tls12;
Authenticate(protocol);
....
}Additional resources:
- Transport Layer Security (TLS) best practices with the .NET Framework
- Testing for Weak SSL TLS Ciphers Insufficient Transport Layer Protection
- Transport Layer Protection Cheat Sheet
- Manipulator-in-the-middle attack
- Man-in-the-browser attack
This diagnostic is classified as:
|
V5613. OWASP. Use of outdated cryptographic algorithm is not recommended.
The analyzer found that an outdated encryption or hashing algorithm is used in the application. Such algorithms may lead to sensitive data exposure, key leakage, broken authentication, etc.
Vulnerabilities associated with insecure cryptographic algorithms can be classified in the following categories of OWASP Top Ten 2017:
Let's consider an example:
private static string CalculateSha1(string text, Encoding enc)
{
var buffer = enc.GetBytes(text);
using var cryptoTransformSha1 = new SHA1CryptoServiceProvider(); // <=
var hash = BitConverter.ToString(cryptoTransformSha1.ComputeHash(buffer))
.Replace("-", string.Empty);
return hash.ToLower();
}Checking the fragment, the analyzer issues a warning that it is not recommended to use the SHA1 algorithm. It has well-known collision problems. Thus, it's unsafe to use such an algorithm.
Instead of outdated algorithms, you should use modern ones. In the above example, one of the solutions is to replace SHA1 with SHA256:
private static string CalculateSha256(string text, Encoding enc)
{
var buffer = enc.GetBytes(text);
using var cryptoTransformSha256 = new SHA256CryptoServiceProvider();
var hash = BitConverter.ToString(cryptoTransformSha256.ComputeHash(buffer))
.Replace("-", string.Empty);
return hash.ToLower();
}The Microsoft website provides documentation for standard implementations of cryptographic algorithms. Generally, classes that implement outdated algorithms are marked with a special warning in the documentation. Here are some of them:
It is also not recommended to use classes that inherit ones specified above.
The official OWASP website provides various methods to check an application for potential vulnerabilities associated with insecure encryption algorithms.
This diagnostic is classified as:
V5614. OWASP. Potential XXE vulnerability. Insecure XML parser is used to process potentially tainted data.
The analyzer has detected the use of an insecurely configured XML parser that processes tainted data. This can make an application vulnerable to an XXE attack.
OWASP Top 10 Application Security Risks 2017 has a separate risk category for XXE attacks: A4:2017 – XML External Entities (XXE). They are also included in the A05:2021 category – Security Misconfiguration OWASP Top 10 2021.
What is an XXE attack?
XML files may contain the document type definition (DTD). DTD allows us to define and use XML entities. Entities can be fully defined inside the document (they can be a string, for example), or they can refer to external resources. That's why it's called an XXE attack: XML eXternal Entities.
External entities can be defined via URI. As a result, the XML parser processes this URI and puts the resulting content into an XML document.
The following example is an XML document that contains an external entity:
<?xml version="1.0" encoding="utf-8" ?>
<!DOCTYPE foo [
<!ENTITY xxe SYSTEM "file://D:/XXETarget.txt">
]>
<foo>&xxe;</foo>The 'xxe' entity is defined in this XML. A developer may configure a parser to process external entities. In this case, instead of '&xxe;', the parser inserts the contents of the 'D:\XXETarget.txt' file.
Thus, an attack is possible if:
- an attacker can pass an XML file with external entities to an application, which parses this file;
- an XML parser has an insecure configuration;
- parsing data (entity values) can get back to an attacker.
As a result, an attacker can reveal the contents of data from the machine on which the application is running, and which is engaged in parsing the XML file.
Vulnerable code examples
PVS-Studio issues a warning if it detects an insecurely configured XML parser that processes an external data in code.
Let's look at a simple example. We have an application that accepts queries as XML files and processes items with the corresponding ID. If an XML-file has the incorrect ID, the application warns the user about it.
The application works with the following XML file format:
<?xml version="1.0" encoding="utf-8" ?>
<shop>
<itemID>62</itemID>
</shop>Let's say the following code fragment processes XML files:
static void ProcessItemWithID(String pathToXmlFile)
{
XmlReaderSettings settings = new XmlReaderSettings()
{
XmlResolver = new XmlUrlResolver(),
DtdProcessing = DtdProcessing.Parse
};
using (var fileReader = File.OpenRead(pathToXmlFile))
{
using (var reader = XmlReader.Create(fileReader, settings))
{
while (reader.Read())
{
if (reader.Name == "itemID")
{
var itemIDStr = reader.ReadElementContentAsString();
if (long.TryParse(itemIDStr, out var itemIDValue))
{
// Process item with the 'itemIDValue' value
Console.WriteLine(
$"An item with the '{itemIDValue}' ID was processed.");
}
else
{
Console.WriteLine($"{itemIDStr} is not valid 'itemID' value.");
}
}
}
}
}
}For the XML file above, the application outputs the following string:
An item with the '62' ID was processed.If we insert something else in the ID instead of the number (the "Hello world" string, for example), the application reports an error:
"Hello world" is not valid 'itemID' value.The code runs as we expected. However, the following factors make the code vulnerable to XXE attacks:
- the XML content comes from the user;
- the developer configures the XML parser to process external entities;
- the output can be passed back to the user.
Take a look at an XML file below. Attackers can use it to compromise this code fragment:
<?xml version="1.0" encoding="utf-8" ?>
<!DOCTYPE foo [
<!ENTITY xxe SYSTEM "file://D:/MySecrets.txt">
]>
<shop>
<itemID>&xxe;</itemID>
</shop>An attacker declares the 'xxe' external entity in this file. The XML parser processes this entity. The 'D:/MySecrets.txt' file is on the machine where the application is running. As a result of the processing, the user gets the file contents (for example, 'This is an XXE attack target.'):
This is an XXE attack target. is not valid 'itemID' value.If we want to protect ourselves from this attack, we can prohibit processing external entities — we assign the 'null' value to the 'XmlResolver' property. Also, we can prohibit or ignore DTD processing by writing 'Prohibit' / 'Ignore' to 'DtdProcessing'.
An example of secure settings:
XmlReaderSettings settings = new XmlReaderSettings()
{
XmlResolver = null,
DtdProcessing = DtdProcessing.Prohibit
};Note: if you use various types, the vulnerability to XXE attacks may look different. For example, the code fragment below is also vulnerable to an XXE attack:
static void ProcessXML(String pathToXmlFile)
{
XmlDocument xmlDoc = new XmlDocument();
xmlDoc.XmlResolver = new XmlUrlResolver();
using (var xmlStream = File.OpenRead(pathToXmlFile))
{
xmlDoc.Load(xmlStream);
Console.WriteLine(xmlDoc.InnerText);
}
}Here XML is loaded via an instance of the 'XmlDocument' type. At the same time, a developer explicitly sets a dangerous value for 'XmlResolver'. DTD processing is implicitly enabled. If we want to prohibit external entities processing, we can write the 'null' value to the 'XmlResolver' property.
The analyzer also takes into account interprocedural calls. Take a look at the example:
static FileStream GetXmlFileStream(String pathToXmlFile)
{
return File.OpenRead(pathToXmlFile);
}
static XmlDocument GetXmlDocument()
{
XmlDocument xmlDoc = new XmlDocument()
{
XmlResolver = new XmlUrlResolver()
};
return xmlDoc;
}
static void LoadXmlInternal(XmlDocument xmlDoc, Stream input)
{
xmlDoc.Load(input);
Console.WriteLine(xmlDoc.InnerText);
}
static void XmlDocumentTest(String pathToXmlFile)
{
using (var xmlStream = GetXmlFileStream(pathToXmlFile))
{
var xmlDoc = GetXmlDocument();
LoadXmlInternal(xmlDoc, xmlStream);
}
}In this case the analyzer issues a warning for calling the 'LoadXmlInternal' method. The analyzer has detected the following:
- the 'xmlDoc' parser obtained from the 'GetXmlDocument' method can process external entities;
- 'xmlStream' received from the 'GetXmlStream' method contains data received from an external source (read from the file);
- the 'xmlDoc' parser and the tainted data are passed to the 'LoadXmlInternal' method. This method processes the XML file.
Note that the analyzer also sees method parameters (available from other assemblies) as tainted data sources. You can read more about it in the article: "Why you should check values of public methods' parameters".
For example, the analyzer issues a warning of low certainty level for the following code fragment. Here the insecure data source is a parameter of a publicly available method:
public static void XmlDocumentTest(Stream xmlStream)
{
XmlDocument doc = new XmlDocument()
{
XmlResolver = new XmlUrlResolver()
};
doc.Load(xmlStream);
Console.WriteLine(doc.InnerText);
}Note that settings of some XML parsers were changed in different versions of .NET Framework.
Look at the following code fragment:
static void XmlDocumentTest(String pathToXml)
{
var xml = File.ReadAllText(pathToXml);
XmlDocument doc = new XmlDocument();
doc.LoadXml(xml);
Console.WriteLine(doc.InnerText);
}This code fragment is resistant to XXE attacks in .NET Framework 4.5.2 and newer versions. The 'XmlResolver' property has the 'null' value by default. As a result, the external entities are not processed.
In .NET Framework 4.5.1 and older versions this code fragment is vulnerable to XXE attacks — the 'XmlResolver' property is not 'null' by default, thus it processes external entities.
PVS-Studio takes into account the default settings of parsers that depend on .NET Framework / .NET version used in the analyzed project.
To protect your code from XXE attacks make sure that you disable the DTD processing and prohibit external entities processing. In various XML parsers the settings may differ. But usually, 'DtdProcessing' ('ProhibitDtd' in older versions of .NET Framework) and 'XmlResolver' properties are responsible for processing external entities.
This diagnostic is classified as:
|
V5615. OWASP. Potential XEE vulnerability. Insecure XML parser is used to process potentially tainted data.
The analyzer has detected the use of an insecurely configured XML parser that processes external data. This can make an application vulnerable to an XEE attack (also called a 'billion laughs' attack or an XML bombs attack).
XEE attacks are included in OWASP Top 10 2017: A4:2017 – XML External Entities (XXE), and OWASP Top 10 2021: A05:2021 – Security Misconfiguration.
What is an XEE attack?
XML files may contain the document type definition (DTD). DTD allows us to define and use XML entities. Entities can either refer to some external resource or be fully defined inside the document. In the latter case, they can be represented by a string or other entities, for example.
An XML file with examples of such entities:
<?xml version="1.0" encoding="utf-8" ?>
<!DOCTYPE foo [
<!ENTITY lol "lol">
<!ENTITY lol1 "&lol;&lol;">
]>
<foo>&lol1;</foo>The file contains the 'lol' and 'lol1' entities. We define the first one through a string, and the second one through other entities. The value of the 'lol1' entity results in the 'lollol' string.
We can increase the nesting and the number of entities. For example:
<?xml version="1.0" encoding="utf-8" ?>
<!DOCTYPE foo [
<!ENTITY lol "lol">
<!ENTITY lol1 "&lol;&lol;&lol;&lol;&lol;&lol;&lol;&lol;&lol;&lol;">
<!ENTITY lol2 "&lol1;&lol1;&lol1;&lol1;&lol1;&lol1;&lol1;&lol1;&lol1;&lol1;">
]>
<foo>&lol2;</foo>The 'lol2' entity expands as follows:
lollollollollollollollollollollollollollollollollollollollollollollol
lollollollollollollollollollollollollollollollollollollollollollollol
lollollollollollollollollollollollollollollollollollollollollollollol
lollollollollollollollollollollollollollollollollollollollollollollol
lollollollollollollollolSo-called XML bombs are created in a similar way, by increasing the number of nested entities. XML bombs are small files that enlarge when entities are expanded. That's where this type of attack got its name:
- XEE (XML Entity Expansion)
- billion laughs (because of a multiple repetition of 'lol').
Thus, a hacker can perform a DoS attack with XML bombs if:
- an attacker can pass an XML bomb to an application;
- an XML parser that processes this file has an insecure configuration.
You can read about a real-world example of an application vulnerability to XEE in the article: "How Visual Studio 2022 ate up 100 GB of memory and what XML bombs had to do with it".
Vulnerable code examples
Look at the example:
static void XEETarget(String pathToXml)
{
XmlReaderSettings settings = new XmlReaderSettings()
{
DtdProcessing = DtdProcessing.Parse,
MaxCharactersFromEntities = 0
};
using (var xml = File.OpenRead(pathToXml))
{
using (var reader = XmlReader.Create(xml, settings))
{
while (reader.Read())
{
if (reader.NodeType == XmlNodeType.Text)
Console.WriteLine(reader.Value);
}
}
}
}In this example, the 'reader' object parses an XML file. However, this parser is vulnerable to XML bombs because it was created with insecure settings, where:
- the DTD processing is allowed. The 'DtdProcessing' property has the 'DtdProcessing.Parse' value;
- the developer didn't set limits on the size of entities. The 'MaxCharactersFromEntities' property is set to 0.
As a result, the parser may freeze trying to parse an XML bomb and start consuming a large amount of memory.
Note that the processed data comes from an external source — they are read from the file along 'pathToXml'. The analyzer detects a combination of these factors and issues a warning.
If we want to make a parser resistant to XEE attacks, we can:
- prohibit or ignore DTD processing — set the 'Prohibit' / 'Ignore' value for the 'DtdProcessing' property. In older .NET Framework versions, the 'ProhibitDtd' property is used instead of 'DtdProcessing'. 'ProhibitDtd' must have the 'true' value to prohibit the DTD processing.
- set limits on the maximum size of entities.
Below is an example of settings in which the DTD processing is allowed, but the maximum size of entities is limited:
XmlReaderSettings settings = new XmlReaderSettings()
{
DtdProcessing = DtdProcessing.Parse,
MaxCharactersFromEntities = 1024
};If the size of entities exceeds the limits during the XML file parsing, the 'reader' parser generates an exception of the 'XmlException' type.
The analyzer also takes into account interprocedural calls. Let's change the example above:
static XmlReaderSettings GetDefaultSettings()
{
var settings = new XmlReaderSettings();
settings.DtdProcessing = DtdProcessing.Parse;
settings.MaxCharactersFromEntities = 0;
return settings;
}
public static void XEETarget(String pathToXml)
{
using (var xml = File.OpenRead(pathToXml))
{
using (var reader = XmlReader.Create(xml, GetDefaultSettings()))
{
ProcessXml(reader);
}
}
}
static void ProcessXml(XmlReader reader)
{
while (reader.Read())
{
// Process XML
}
}In this case the analyzer issues a warning for calling the 'ProcessXml' method, since it tracks that:
- the XML file is processed inside 'ProcessXml';
- the developer created the XML parser with insecure settings came from the 'GetDefaultSettings' method;
- the parser processes potentially tainted data (read from the 'pathToXml' file).
Besides, the analyzer points out the code fragments corresponding to the actions listed above.
Note that the analyzer also sees method parameters (available from other assemblies) as tainted data sources. You can read more about it in the article: "Why you should check values of public methods' parameters".
Example:
public class XEETest
{
public static void XEETarget(Stream xmlStream)
{
var rs = new XmlReaderSettings()
{
DtdProcessing = DtdProcessing.Parse,
MaxCharactersFromEntities = 0
};
using (var reader = XmlReader.Create(xmlStream, rs))
{
while (reader.Read())
{
// Process XML
}
}
}
}The analyzer issues a low certainty level warning for this code, since the source of tainted data – a parameter of a publicly available method – is used in a dangerously configured XML parser.
Note that in different .NET Framework versions default settings may vary. Therefore, the same code fragment may be vulnerable to XEE attacks, or be resistant.
An example of this fragment:
static void XEETarget(String pathToXml)
{
using (var xml = File.OpenRead(pathToXml))
{
var settings = new XmlReaderSettings()
{
DtdProcessing = DtdProcessing.Parse
};
using (var reader = XmlReader.Create(xml, settings))
{
while (reader.Read())
{
// Process XML
}
}
}
}This code fragment is vulnerable to XEE attacks in .NET Framework 4.5.1 and older versions. It does not set limits on entities size — the value of the 'MaxCharactersFromEntities' property is 0. In .NET Framework 4.5.2 and newer versions a limit on entities size is set by default. As a result, this code fragment is resistant to XEE attacks.
This diagnostic is classified as:
V5616. OWASP. Possible command injection. Potentially tainted data is used to create OS command.
The analyzer has detected the creation of the OS-level command from unverified data. The data was received from an external source. This may cause the command injection vulnerability.
The OWASP Top 10 Application Security Risks puts command injections in the following categories:
- A1:2017-Injection in the 2017 list;
- A3:2021-Injection in the 2021 list.
Look at the example:
HttpRequest _request;
string _pathToExecutor;
private void ExecuteOperation()
{
....
String operationNumber = _request.Form["operationNumber"];
Process.Start("cmd", $"/c {_pathToExecutor} {operationNumber}");
....
}In this code fragment the application reads the number of operation that the called process should execute. Thus, the number of operations is strictly limited. An attacker may pass a string as the "operationNumber" parameter's value. This string allows executing unauthorized actions. As a result, "operationNumber" may contain the following string:
0 & del /q /f /s *.*Let's assume that the 'executor.exe' path is written to '_pathToExecutor'. As a result of calling 'Process.Start' the system performs the following command:
cmd /c executor.exe 0 & del /q /f /s *.*The '&' character is interpreted as a command separator. The 'del' instruction with such arguments deletes all files in the current and nested directories (if the application has the sufficient file access rights). Thus, the correctly selected value in the "operationNumber" parameter performs malicious actions.
In order to avoid this vulnerability, you should always check the input data. The specific implementation of this check depends on the situation. In the code fragment above it is enough to make sure that a number is written to the 'operationNumber' variable:
private void ExecuteOperation()
{
String operationNumber = _request.Form["operationNumber"];
if (uint.TryParse(operationNumber, out uint number))
Process.Start("cmd", $"/c {_pathToExecutor} {number}");
}The method parameters available from other builds are also source of insecure data. Although, the analyzer issues low-level warnings for such sources. You can read the explanation of this position in the "Why you should check values of public methods' parameters" note.
Let's take the following code fragment as an example:
private string _userCreatorPath;
public void CreateUser(string userName, bool createAdmin)
{
string args = $"--name {userName}";
if (createAdmin)
args += " --roles ADMIN";
RunCreatorProcess(args); // <=
}
private void RunCreatorProcess(string arguments)
{
Process.Start(_userCreatorPath, arguments).WaitForExit();
}In this code fragment, the 'RunCreatorProcess' method creates a process. This process, in turn, creates a user. This user obtains the administrator permissions only if the 'createAdmin' flag has the 'true' value.
The code from the library that depends on the current one may call the 'CreateUser' method to create a user. The developer may pass, for example, a query parameter to the 'userName' parameter. There's a high probability that there would be no checks in the caller code. The developer would expect them to be in the 'CreateUser' method. Thus, both the library and the code that uses it, don't have the 'userName' validation.
As a result, the correctly selected name allows an attacker to create a user with the administrator permissions. This would not depend on the 'createAdmin' flag value (it will be 'false' in most cases). Let's assume that the following string is written to the 'userName' parameter:
superHacker --roles ADMINAfter substitution, the argument string will look the same as if 'createAdmin' was set to 'true':
--name superHacker --roles ADMINThus, even without the administrator permissions, an attacker can create a user with such permissions and use it for their own purposes.
In this case, you should check the username for forbidden characters. For example, you can allow using only Latin letters and numbers:
public void CreateUser(string userName, bool createAdmin)
{
if (!Regex.IsMatch(userName, @"^[a-zA-Z0-9]+$"))
{
// error handling
return;
}
string args = $"--name {userName}";
if (createAdmin)
args += " --roles ADMIN";
RunCreatorProcess(args);
}This diagnostic is classified as:
V5617. OWASP. Assigning potentially negative or large value as timeout of HTTP session can lead to excessive session expiration time.
The analyzer detected code that specifies an infinite or a very long session expiration time. This can cause problems and expose the authenticated user's data.
Errors related to incorrectly set session expiration time are in the following OWASP Top 10 Application Security Risks categories:
- A2:2017-Broken Authentication on the 2017 list;
- A7:2021-Identification and Authentication Failures on the 2021 list.
Example 1:
public void ConfigureSession(HttpContext current, ....)
{
HttpSessionState session = current.Session;
session.Timeout = -1;
....
}The 'HttpSessionState.Timeout' property value stands for the session expiration time in minutes.
Assigning a negative value to the 'Timeout' property can potentially set the timeout to a potentially infinite period. This means, that if a user does not log out correctly, their private data can be compromised. For example, the next person who uses the same computer can access that user's data, because the original user is still authenticated, the session hasn't been terminated and is still active.
In some other case, an attacker can steal an authentication token and, if the timeout is potentially infinite, that attacker will have more time to perform unauthorized access. Someone can steal an authentication token by, for example, perform an XSS attack.
Example 2:
public void ConfigureSession(HttpContext current, ....)
{
HttpSessionState session = current.Session;
session.Timeout = 120;
....
}This example is similar to the first one: it is a threat, and its vulnerability can be exploited.
The analyzer considers code to be correct if the timeout is set to a period of under two hours:
public void ConfigureSession(HttpContext current, ....)
{
HttpSessionState session = current.Session;
session.Timeout = 30;
....
}Most libraries and frameworks set the default timeout value to 30 minutes or less.
The analyzer issues a Medium-level warning if the timeout value is too high and a High-level warning if the timeout is infinite.
This diagnostic is classified as:
|
V5618. OWASP. Possible server-side request forgery. Potentially tainted data is used in the URL.
The analyzer detected an attempt to access a remote resource without checking URL provided by the user. The use of unverified external data to generate an address can cause Server-Side Request Forgery.
Vulnerabilities of the Server-Side Request Forgery type are allocated to a separate risk category in the OWASP Top 10 Application Security Risks 2021: A10:2021-Server-Side Request Forgery.
Look at the example:
void ServerSideRequestForgery()
{
var url = Request.QueryString["url"];
WebRequest request = WebRequest.Create(url);
WebResponse response = request.GetResponse();
using (Stream stream = response.GetResponseStream())
{
using (StreamReader reader = new StreamReader(stream))
{
....
}
}
response.Close();
} In this example, 'url' may contain tainted data since it comes from an external source. A request is generated from this address, and it's executed server-side. The request can be sent to any web resource or the server itself.
Thus, attackers can perform malicious actions by sending requests to resources that they don't have direct access to.
An example of compromised data:
http://localhost/admin/delete?username=testSSRFAn attacker can delete the user with the help of such a request.
When fighting SSRF, don't use a prohibited list or regular expressions. An attacker can easily evade these restrictions by:
- Redirection — an attacker can create an external resource that redirects to another URL as a response.
- Alternate representations:
http://2130706433/ = http://127.0.0.1
http://0x7f000001/ = http://127.0.0.1 An example of fighting SSRF by using verification of the external data:
string ServerSideRequestForgery()
{
var url = Request.QueryString["url"];
if (!whiteList.Contains(url))
return "Forbidden URL";
WebRequest request = WebRequest.Create(url);
....
} This diagnostic is classified as:
|
V5619. OWASP. Possible log injection. Potentially tainted data is written into logs.
The analyzer has detected data written into logs from an external source without validation. This can violate logging processes or compromise the contents of log files.
Errors related to data logging belong to A09:2021 – Security Logging and Monitoring Failures category of the OWASP Top 10 Application Security Risks list.
If logging of user input is performed without validation, an attacker can inject arbitrary data into logs.
Consider an example — let's say logs are stored in text format. An attacker can use different ways to find out the storage type — it's easy if the project is open source. Moreover, attackers can use other attacks. A possible log can look as follows:
INFO: User 'SomeUser' entered value: '2022'.
INFO: User 'SomeUser' logged out.
The code that performs logging can look as follows:
public class InputHelper
{
HttpRequest Request {get; set;}
Logger logger;
string UserName;
void ProcessUserInput()
{
string userInput = Request["UserInput"];
string logMessage = "INFO: User '"
+ UserName
+ "' entered value: '"
+ userInput + "'.";
logger.Log(logMessage);
....
}
}In this case, an attacker can inject arbitrary data about events that never happened.
Let's say, an attacker enters the following:
2022/r/nINFO: User 'Admin' logged out.
Logs will contain the following information that can mislead the developer analyzing the logs:
INFO: User 'SomeUser' entered value: '2022'.
INFO: User 'Admin' logged out.
Let's consider another type of attack. For example, if logs are stored in XML format, an attacker can inject data that will make the contents of the report incorrect. Moreover, the following parsing of ready-made logs might produce incorrect data or fail with an error. Here is an example of vulnerable code:
public class InputHelper
{
HttpRequest Request {get; set;}
Logger logger;
void ProcessUserInput()
{
string userID = Request["userID"];
logger.Info(userID); // <=
....
}
}An attacker can inject an unclosed tag and make it impossible to parse an XML file.
Possible vulnerabilities depend on architecture, input settings, logger, log output and other parts of logging system. For example, a log injection attack in XML format allows attackers to:
- violate the process of adding new log entries;
- violate the process of viewing ready-made logs;
- exploit an XEE vulnerability (for more details, see the V5615 diagnostic);
- exploit an XXE vulnerability (for more details, see the V5614 diagnostic);
- exploit an insecure deserialization vulnerability (for more details, see the V5611 diagnostic).
You can prevent some attacks by escaping characters so that they are not treated as part of XML syntax. For example, the initial character of the "<" tag should be escaped as "<". Some standard .NET methods, used to work with XML (for example, 'XNode' descendants), implement escaping of data written to an XML tree. Besides XML infrastructure, .NET provides stand-alone classes to ensure data security. Here's an example of a more secure code with encoding:
public class InputHelper
{
HttpRequest Request {get; set;}
Logger logger;
string EscapeCharsForXmlLog(string userInput)
{
return SecurityElement.Escape(userInput);
}
void ProcessUserInput()
{
string userInput = Request["userID"];
userInput = EscapeCharsForXmlLog(userInput);
logger.Info(userInput); // <=
....
}
}Here's another example: the JSON standard prohibits null characters ("\0") in files. If an attacker introduces this character, it can break the process of saving or viewing ready-made logs. The null character should be escaped as "\u0000".
One more example: suppose logs are stored in relational DBMS that uses SQL. If input data is not verified, this can lead to an SQL injection attack (for more details, see the V5608 diagnostic).
The analyzer also considers method parameters from other assemblies potential sources of tainted data. The following article covers this topic in detail: "Why you should check values of public methods' parameters". Consider an example:
public class InputHelper
{
Logger logger;
public void ProcessInput(string input)
{
Log("Input logged:" + input);
}
private void Log(string input)
{
logger.Log(LogLevel.Information, input);
}
}In this case, the analyzer will issue a warning of low certainty level for the 'Log' method. The infected result of string concatenation is used for logging.
As in the example above, you can make this code more secure by encoding the string:
public class InputHelper
{
Logger logger;
public void ProcessInput(string input)
{
Log(SecurityElement.Escape("Input logged:" + input));
}
private void Log(string input)
{
logger.Log(LogLevel.Information, input);
}
}This diagnostic is classified as:
|
V5620. OWASP. Possible LDAP injection. Potentially tainted data is used in a search filter.
The analyzer has detected potentially tainted data used to form an LDAP search filter. This can lead to an LDAP injection if the data is compromised. LDAP injection attacks are similar to SQL injection attacks.
LDAP injection vulnerabilities belong to the OWASP Top 10 Application Security Risks 2021: A3:2021-Injection.
Consider an example:
public void Search()
{
....
string user = textBox.Text;
string password = pwdBox.Password;
DirectoryEntry de = new DirectoryEntry();
DirectorySearcher search = new DirectorySearcher(de);
search.Filter = $"(&(userId={user})(UserPassword={password}))";
search.PropertiesToLoad.Add("mail");
search.PropertiesToLoad.Add("telephonenumber");
SearchResult sresult = search.FindOne();
if(sresult != null)
{
....
}
....
}In this example, a search filter is formed to provide some personal data to a user with a valid username and password. The filter contains the values of 'user' and 'password' variables obtained from an external source. It's dangerous to use such data because this gives an attacker the opportunity to fake the search filter.
To better understand the attack, let's consider some examples.
If "PVS" is written in 'user' and "Studio" is written in 'password', we receive the following query:
LDAP query: (&(userId=PVS)(UserPassword=Studio))In this case, we get the expected data from the user and if such a combination of user and password exists, access will be granted.
But let's assume that 'user' and 'password' variables contain the following values:
user: PVS)(userId=PVS))(|(userId=PVS)
password: AnyIf we use these strings in the template, we will get the following filter:
LDAP query: (&(userId=PVS)(userId=PVS))(|(userId=PVS)(UserPassword=Any))Such a search filter guarantees access even if an attacker enters an incorrect password. This happens because LDAP processes the first filter and ignores (|(userId=PVS)(UserPassword=Any)).
To prevent such attacks, it's worth validating all input data or escaping all special characters in user data. There are methods that automatically escape all unsafe values.
Here's the code fragment containing an automatic escaping method from the Microsoft namespace — 'Microsoft.Security.Application.Encoder':
public void Search()
{
....
string user = textBox.Text;
string password = pwdBox.Password;
DirectoryEntry de = new DirectoryEntry();
DirectorySearcher search = new DirectorySearcher(de);
user = Encoder.LdapFilterEncode(user);
password = Encoder.LdapFilterEncode(password);
search.Filter = $"(&(userId={user})(UserPassword={password}))";
search.PropertiesToLoad.Add("mail");
search.PropertiesToLoad.Add("telephonenumber");
SearchResult sresult = search.FindOne();
if (sresult != null)
{
....
}
....
}The analyzer also considers public method parameters potential sources of tainted data. This topic is covered in detail in the following article: "Why you should check values of public methods' parameters".
Consider an example:
public class LDAPHelper
{
public void Search(string userName)
{
var filter = "(&(objectClass=user)(employeename=" + userName + "))";
ExecuteQuery(filter);
}
private void ExecuteQuery(string filter)
{
DirectoryEntry de = new DirectoryEntry();
DirectorySearcher search = new DirectorySearcher(de);
search.Filter = filter;
search.PropertiesToLoad.Add("mail");
search.PropertiesToLoad.Add("telephonenumber");
SearchResult sresult = search.FindOne();
if (sresult != null)
{
....
}
}
}The analyzer issues a warning of low level of certainty when analyzing the 'Search' method for the 'ExecuteQuery' call. PVS-Studio detected tainted data passed from the 'userName' parameter to the 'filter' variable and then to 'ExecuteQuery'.
In this case, we can use the same protection method.
public class LDAPHelper
{
public void Search(string userName)
{
userName = Encoder.LdapFilterEncode(userName);
var filter = "(&(objectClass=user)(employeename=" + userName + "))";
ExecuteQuery(filter);
}
private void ExecuteQuery(string filter)
{
DirectoryEntry de = new DirectoryEntry();
DirectorySearcher search = new DirectorySearcher(de);
search.Filter = filter;
....
}
}This diagnostic is classified as:
|
V5621. OWASP. Error message contains potentially sensitive data that may be exposed.
The analyzer has detected the exposure of potentially sensitive data contained in the error message. Such data includes messages and stack traces of exceptions.
Errors related to the implicit exposure of sensitive data belong to the A04:2021 – Insecure Design category of the OWASP Top 10 Application Security Risks.
Let's consider an example:
public void Foo(string value)
{
try
{
int intVal = int.Parse(value);
....
}
catch (Exception e)
{
Console.WriteLine(e.StackTrace); // <=
}
}It is not recommended to show stack traces of exceptions to users. This may lead to the exposure of project details. For example, the names of libraries used in the project may be exposed. If these libraries contain known vulnerabilities, an attacker can exploit this information to attack the project.
Also, stack trace of exception for standard .NET exception classes may be exposed with the help of the 'ToString' method:
public void Foo(string value)
{
try
{
int intVal = int.Parse(value);
....
}
catch (Exception e)
{
Console.WriteLine(e.ToString()); // <=
}
}Keep in mind that 'ToString' is called inside output methods that take 'object' as an argument:
Console.WriteLine(e);To solve this architecture issue, you can prevent the output of sensitive information. For example, you can use resources explicitly related to exceptions, but not containing sensitive information. Here's a simple example with 'enum':
enum ErrorCode
{
/// <summary>
/// ArgumentNull exception occurred
/// </summary>
ArgumentNull,
....
Unknown
}
public void Foo(string value)
{
try
{
int intVal = int.Parse(value);
....
}
catch (Exception e)
{
ErrorCode errCode = e switch
{
ArgumentNullException => ErrorCode.ArgumentNull,
....
_ => ErrorCode.Unknown
};
Console.WriteLine("An error has occurred: " + errCode); // <=
}
}This diagnostic is classified as:
|
V5622. OWASP. Possible XPath injection. Potentially tainted data is used in the XPath expression.
The analyzer has detected unverified external data used to form the XPath expression. This can cause an XPath Injection.
Vulnerabilities related to injections belong to the OWASP Top 10 Application Security Risks: A3:2021-Injection.
Look at the example:
class UserData
{
HttpRequest request;
XPathNavigator navigator;
void RetrieveUserData()
{
string username = request.Form["username"];
string password = request.Form["password"];
string hashedPassword = Hash(password);
string query = $@"//users/user[
username/text() = '{username}' and
passwordHash/text() = '{hashedPassword}']
/data/text()";
object res = navigator.Evaluate(query);
....
}
}In this example, the XPath expression is used to get user data from an XML file. The username is stored "as is" and the password is stored encrypted.
An attacker can pass any data as a username and password. The check will be compromised, if an expression that makes the XPath condition always true is passed in the input data. Since the password is stored in an encrypted form, the unsafe expression should be injected together with the username.
For example, let the username be 'john'. To the username, let's append an expression of the following type:
' or ''='Any set of characters can be entered instead of a password. Then the XPath expression will look as follows:
[
username/text()='john' or ''='' and
passwordHash/text() = '750084105bcbe9d2c89ba9b'
]Now the expression contains the 'or' operator. Let's consider how the expression is evaluated:
- Since this username exists, the expression "username/text()='john'" is true.
- Random characters were entered as a password, so the PasswordHash/text() = '750084105bcbe9d2c89ba9b' expression is false.
- The "=" expression is always true.
- The priority of the 'and' operator is higher than 'or', so the "=" and PasswordHash/text() = '750084105bcbe9d2c89ba9b' expression is evaluated. The result is false.
- The 'or' operator is last to be executed. The "username/text()='john' or false" expression is true. Consequently, the whole condition is true.
Thus, the result of the XPath query will be the user data of 'john' regardless of whether the correct password was entered or not. This can lead to data leakage.
Do not use unverified external data in XPath expressions. To increase security, it is worth escaping potentially dangerous characters in external data. Examples of such characters are "<", ">" and "'". Escaping may be performed with the 'SecurityElement.Escape' method:
class UserData
{
HttpRequest request;
XPathNavigator navigator;
void RetrieveUserData()
{
string username = request.Form["username"];
string password = request.Form["password"];
username = SecurityElement.Escape(username);
string hashedPassword = Hash(password);
string query = $@"//users/user[
username/text()= '{username}' and
passwordHash/text() ='{hashedPassword}']
/data/text()";
object res = navigator.Evaluate(query);
....
}
}There are other ways to prevent XPath injections. For example, Microsoft suggests implementing a resolver class. This class may be used in methods of the 'XPathNavigator' class. These methods accept the XPath expression's string and the object that implements the 'IXmlNamespaceResolver' interface.
Inside the XPath expression, you can set custom variables and functions that will be processed by the resolver. This approach is not a solution to the XPath injection problem. However, setting custom variables allows to use an approach similar to the parameterization of SQL queries.
In addition, the analyzer considers methods' parameters from other assemblies to be unsafe sources. This topic is covered in more detail in the following article: "Why you should check values of public methods' parameters". Look at the example:
public class UserData
{
XPathNavigator navigator;
public object RetrieveUserData(string username,
string password)
{
string hashedPassword = Hash(password);
string query = $@"//users/user[
username/text()= '{username}' and
passwordHash/text() = '{hashedPassword}']
/data/text()";
return EvaluateXpath(query);
}
private object EvaluateXpath(string xpath)
{
object res = navigator.Evaluate(xpath);
....
}
}In this example, the 'RetrieveUserData' method can be called from other assemblies. The 'username' and 'password' parameters of this method are not checked before use in the XPath query. The resulting expression in the 'query' variable is passed to the 'EvaluateXpath' method. In the method, the expression is used without a prior check. In this case, the analyzer will issue a warning of low level of certainty.
This diagnostic is classified as:
|
V5623. OWASP. Possible open redirect vulnerability. Potentially tainted data is used in the URL.
The analyzer detected redirection from one resource to another. The URL for redirection is received from an external source and wasn't checked. A compromised URL may lead to an open redirect vulnerability.
Open redirect vulnerabilities belong to OWASP Top 10 Application Security Risks 2021: A1:2021- Broken Access Control.
Look at the example:
void Foo()
{
string url = Request.QueryString["redirectUrl"];
....
if (loggedInSuccessfully)
Response.Redirect(url);
}In this example, 'url' may contain tainted data since it is obtained from an external resource. The data is used to redirect a client to the address written in 'url'. This logic of the program makes it easier to steal the user's data via phishing attacks.
An example of a compromised URL:
URL: http://mySite.com/login?redirectUrl=http://attacker.com/The possible scenario of an attack:
- a user receives a link from an attacker and follows it;
- they go to a website they trust. The website requests authorization. After they enter login and password, they are redirected to a fake website. The fake website looks exactly like the original one;
- the phishing website also requests login and password. The user thinks that they made a typo and logs in again;
- the attacker who created this website gets the data. After that the user is redirected to the original website. The user may not even notice their data was stolen.
The main danger of the open redirect vulnerability is that the link received from the attacker actually redirects to a website the user trusts. So, the victim is most likely to follow it.
To protect from open redirect, check that you're redirected to a local address or an address from a white list.
Let's look at how we can fight an open redirect vulnerability. Using the 'IsLocalUrl' method from the 'Microsoft.AspNet.Membership.OpenAuth' namespace, you can check if the address is local:
void Foo()
{
string url = Request.QueryString["url"];
if (OpenAuth.IsLocalUrl(url))
Response.Redirect(url);
else
throw ....;
}The code checks whether the received URL is local. If it is local, the link opens.
The analyzer also considers the parameters of methods available from other builds as sources of unsafe data. You can read more about it in the article: "Why you should check values of public methods' parameters".
Look at the example:
public class UriHelper
{
public void ProcessUrlQuery(HttpResponse resp, string url)
{
RedirectUrl(url, resp);
}
private void RedirectUrl(string redirectUrl, HttpResponse resp)
{
resp.Redirect(redirectUrl);
}
}The analyzer detects that unsafe data from the 'url' parameter is passed to the 'RedirectUrl' method. Inside this method, the data is not checked and used for redirection.
You can protect from it the same way described above.
This diagnostic is classified as:
|
V5624. OWASP. Use of potentially tainted data in configuration may lead to security issues.
The analyzer detected that the data from the external source is used in configuration. This may lead to the security issue.
Vulnerabilities of this type belong to the OWASP Top 10 Application Security Risks 2021: A5:2021 - Security Misconfiguration
Let's take an example:
public void ExecuteSqlQuery(....)
{
....
string catalog = Request.QueryString["catalog"];
using (SqlConnection dbConnection = IO.GetDBConnection())
{
dbConnection.ConnectionString = $"Data Source=....; " +
$"Initial Catalog={catalog}; " +
$"User ID=....; " +
$"Password=....;";
....
}
....
}In this example, a database connection string is created. Data is written into the 'Initial Catalog' parameter without proper validation, so an attacker can pass any directory name. As a result, they can get unauthorized access to private information.
In order to defend against similar attacks, developers need to check input data. Here is an example of how to correctly create a connection string:
public void ExecuteSqlQuery(...., HashSet<string> validCatalogNames)
{
....
string catalog = Request.QueryString["catalog"];
if(!validCatalogNames.Contains(catalog))
return;
using(SqlConnection dbConnection = IO.GetDBConnection())
{
dbConnection.ConnectionString = $"Data Source=....; " +
$"Initial Catalog={catalog}; " +
$"User ID=....; " +
$"Password=....;";
....
}
....
}In this code fragment the if-statement checks if 'catalog' is in the 'validCatalogNames' collection. Thus, users will have access only to a certain list of directories. This approach will prevent attackers from obtaining private information.
This diagnostic is classified as:
V5625. OWASP. Referenced package contains vulnerability.
- When does the analyzer issue a warning?
- How to manage such warnings?
- Suppressing warnings about vulnerable dependencies
The analyzer found that the assemblies used in the project may contain some known vulnerabilities. Such dependencies may lead to vulnerabilities in the application.
Such problem is covered by the A6: Vulnerable and Outdated Components category listed in the OWASP Top Ten 2021.
When does the analyzer issue a warning?
For example, the project uses the log4net assembly of the 1.2.13 version. This is the only assembly in the log4net 2.0.3 package that contains the CVE-2018-1285 vulnerability. Therefore, when a developer uses dependency capabilities, some vulnerabilities may appear in the project that references such dependency.
The analyzer also covers transitive dependencies — dependencies of libraries project depends on.
For example, MySQL.Data (version 8.0.22 and newer) is one of the RepoDb.MySQL 1.1.4 package's dependencies. In turn, MySQL.Data 8.0.22 depends on the Google.Protobuf (version 3.11.4 and newer) and the SSH.NET (version 2016.1.0 and newer) packages.

The analyzer knows that:
- all versions of the Google.Protobuf package up to 3.15.0 contain CVE-2021-22570;
- all versions of the SSH.NET package up to 2020.0.2 contain CVE-2022-29245.
Thus, any projects that use RepoDb.MySQL 1.1.4 can transitively depend on the SSH.NET and Google.Protobuf vulnerable assemblies. Vulnerabilities in such dependencies can also cause various problems in apps. Although, these problems are less likely to occur in transitive dependencies than in direct dependencies, and the certainty level of warnings is lower.
How to manage such warnings?
If a project dependency contains a vulnerability, it's necessary to get rid of this vulnerability or protect your project from possible risks. This will help secure the project. First, you need to determine if a project references a dependency directly or not.
If a project references a dependency directly, then you can find the dependency's name or even its version in the project dependencies list. To find package dependency, click the Installed tab in the NuGet Package Manager window. In Visual Studio, this window looks as follows:
If a project references a dependency indirectly, you can trace a package chain or a library chain that connect the project with the vulnerable dependency. You can use various software tools to do this. For example, Visual Studio 2022 provides search within external items:

This feature helps find the full chain of project dependencies up to the vulnerable package. A similar search is also available in the JetBrains Rider environment.
With the JetBrains dotPeek tool you can explore the references hierarchy for any assembly. You need to open the needed assembly and click the References Hierarchy item in the shortcut menu:

The opened panel displays the dependency tree of the chosen assembly:

Possible solutions for vulnerable dependencies are examined below.
Updating the dependency
Typically, not all versions of a package or an assembly contain a vulnerability. If a project depends on a vulnerable item directly, it's better to use another version of the dependency.
Let's consider a case when a project uses an indirect vulnerable dependency. For example, the project depends on an assembly A, and the assembly A depends on a vulnerable assembly B.

If B has secure versions, you can try one of the following scenarios:
- Update the assembly A – so the version of B may change.
- Set the assembly B as a direct dependency of the project. Do not forget to choose a secure version of B. As a result, the assembly A will have to use this version. IMPORTANT: Using the last scenario, you need to check that the project dependencies (including A) are compatible with the new version of B. If these versions aren't compatible, try to update the assemblies to compatible secure version of B.
You can deal with more deep dependencies in the same way. For example, if a project depends on an assembly A, and the assembly A depends on an assembly B, and an assembly B depends on a vulnerable assembly C.
Changing a dependency
If there are no secure versions of a package/assembly, or they cannot be updated, try to change the library.
It gets worse if a project depends on a vulnerable library indirectly. In this case, you need to change a direct dependency that is the reason why the project becomes dependent on the vulnerable library. That is, when a project depends on a library A, and the library A depends on a vulnerable library B, then you need to change the library A.
Ensuring security on the project side
If none of the above scenarios fit, you need to understand the nature of the vulnerability in the used library, and how this vulnerability affects the app. With this information you need to fix the application code. These fixes will protect from an exploit. You can add additional input data validation or refuse to use a part of the dependency capabilities in favor of more secure methods.
Most likely, you will need to suppress the warnings of the diagnostic. Continue reading to found out the way to do it.
Suppressing warnings about vulnerable dependencies
Since V5625 is a project-level diagnostic, its warnings are not related to any specific code fragment. That's why you can't mark the analyzer's messages as false positives by adding a comment like "//-V5625" to the code. You can't also baseline such analyzer's warnings with suppress files.
To suppress V5625 messages, use the diagnostic configuration file – a text file with the pvsconfig extension added to a project or a solution.
To add a configuration file in Visual Studio, you need to select a project or a solution and click 'Add New Item...' in the shortcut menu. Then, click 'PVS-Studio Filters File' in the appeared window.

The configuration file added to the project is valid for all files of this project. The configuration file added to the solution is valid for all projects' files added tothis solution.
To suppress the warning of the V5625 diagnostic rule to a specific library, add the following line to pvsconfig:
//-V::5625::{Google.Protobuf 3.6.1}Then the analyzer will stop issuing V5625 that contains the "Google.Protobuf 3.6.1" substring.
You can also specify the level:
//-V::5625:2:{Google.Protobuf 3.6.1}In this case, the diagnostic rule will not issue a warning if it has a second certainty level (Medium), and its warning contains the "Google.Protobuf 3.6.1" substring.
To learn more about the pvsconfig files, read the documentation.
This diagnostic is classified as:
V5626. OWASP. Possible ReDoS vulnerability. Potentially tainted data is processed by regular expression that contains an unsafe pattern.
The analyzer detected that a potentially dangerous regular expression is used for processing data from external source. This can make an application vulnerable to a ReDoS attack.
What is a ReDoS attack?
ReDoS is a denial of service attack caused by a vulnerable regular expression. The aim of an attacker is to pass a tainted string to a regular expression. The string is designed in such a way that evaluating it will require the maximum amount of time.
A regular expression is vulnerable if it meets the following conditions:
- There are two subexpressions, and one of them includes another. One of the following quantifiers is applied to each of them: '*', '+', '*?', '+?', '{...}'. For example, the 'x+' subexpression is included in '(x+)*');
- There is a string that can be matched with both subexpressions. For example, the 'xxxx' string may fit both the 'x+' and the '(x+)*' templates.
Therefore, when receiving a warning of this diagnostic rule, you should check a regular expression for presence of subexpressions of the following forms:
- ...(a+)+...
- ...(b?a*c?)+...
- ...(.+a+c?)*?...
- ...(a+){x}...
- ...(...|a...|...|a?...|...)+..., etc.
Here 'a', 'b', 'c' can be:
- separate characters;
- a set of characters in square brackets '[...]';
- a subexpression in parenthesis '(...)';
- any class of characters that are supported by a regular expression ('\d', '\w', '.', etc.).
It is also important that after these subexpressions there should be at least one subexpression not marked with quantifiers '?' or '*'. For example: '(x+)+y', '(x+)+$', '(x+)+(...)', ' (x+)+[...]'.
Let's analyze this issue on the example of '(x+)+y'. In this expression, the 'x+' pattern can match any number of 'x' characters. The string that matches the '(x+)+y' pattern consists of any number of substrings matched with 'x+'. As a result, there is a large number of options for matching the same string with a regular expression.
You can see several options for matching the 'xxxx' string with the '(x+)+y' template in the table below:

Every time a regular expression fails to find the 'y' character at the end of the string, it starts checking the next option. Only after checking all of them, the regular expression gives the answer – no matches were found. However, this process can be executed for a catastrophically long time, depending on the length of the substring corresponding to the vulnerable pattern.
The graph below shows how the (x+)+y regular expression's calculation time depends on the number of characters in the input strings of the 'xx....xx' form:

Look at the code example:
Regex _datePattern = new Regex(@"^(-?\d+)*$");
public bool IsDateCorrect(string date)
{
if (_datePattern.IsMatch(date))
....
}In this example, the date is checked with a regular expression. If the date is correct, the regular expression works as expected. The situation changes if the application receives the following string as the date:
3333333333333333333333333333333333333333333333333333333333333 Hello ReDoS!In this case, processing with a regular expression will take a long time. Receiving several requests with similar data may create a heavy load on the application.
A possible solution is to limit the time a regular expression spends on processing the input string:
Regex _datePattern = new Regex(@"^(-?\d+)*$",
RegexOptions.None,
TimeSpan.FromMilliseconds(10));Look at another example. The '(\d|[0-9]?)' subexpression was intentionally added to the regular expression to show the essence of the problem.
Regex _listPattern = new Regex(@"^((\d|[0-9]?)(,\s|\.))+$(?<=\.)");
public void ProcessItems(string path)
{
using (var reader = new StreamReader(path))
{
while (!reader.EndOfStream)
{
string line = reader.ReadLine();
if (line != null && _listPattern.IsMatch(line))
....
}
}
}Here, the data is read from the file. A regular expression checks the data for compliance with the following pattern: the string should be a list, each element of which is a digit or an empty string. The correct input may look like this:
3, 4, 5, 3, 4, 5, 3, 4, 5, 3, 4, 5, 3, 4, 5, 3, 4, 5, 3, 4, 5, 3, 4, 5, 3, 4.When processing such data, the regular expression works in normal time. However, if we pass the same string but without the dot at the end, the application will take much more time to process it.
The regular expression uses the '\d' and '[0-9]?' subexpressions, which can be matched with the same values. Note that the '? ' quantifier is applied to the second subexpression and the '+' quantifier is applied to the '((\d|[0-9]?)(,\s|\.))' parent subexpression. This leads to a large number of possible matches in the string. If we remove at least one of these quantifiers, the ReDoS attack won't happen.
In this example, to eliminate the ReDoS vulnerability, it is enough to remove the unnecessary matches:
Regex _listPattern = new Regex(@"^([0-9]?(,\s|\.))+$(?<=\.)");You can read more about ReDoS vulnerabilities on the OWASP website.
How to eliminate a ReDoS vulnerability?
There are several options. Let's inspect them using the '^(-?\d+)*$' regular expression as an example.
Option 1. Add a limit on the processing time a regular expression spends on a string. This can be done by setting the 'matchTimeout' parameter when you create the 'Regex' object or when you call a static method:
RegexOptions options = RegexOptions.None;
TimeSpan timeout = TimeSpan.FromMilliseconds(10);
Regex datePattern = new Regex(@"^(-?\d+)*$", options, timeout);
Regex.IsMatch(date, @"^(-?\d+)*$", options, timeout);Option 2. Use atomic groups '(?>...)'. Atomic groups disable the search for all possible combinations of characters corresponding to a subexpression, being limited to only one:
Regex datePattern = new Regex(@"^(?>-?\d+)*$");Option 3. Rewrite the regular expression by removing the dangerous pattern. Suppose that the '^(-?\d+)*$' expression is designed to search for a date of the '27-09-2022' form. In this case it can be replaced with a more reliable analogue:
Regex datePattern = new Regex (@"^(\d{2}-\d{2}-\d{4})$");Here any substring is matched with no more than one subexpression due to the mandatory check of the '-' character between the '\d{...}' templates.
This diagnostic is classified as:
V5627. OWASP. Possible NoSQL injection. Potentially tainted data is used to create query.
The analyzer has detected unverified external data that is used to create a query to a NoSQL database. This can lead to a NoSQL injection if the data is compromised.
Injections make a separate category in the OWASP Top 10 Application Security Risks 2021: A3:2021-Injection.
Look at the following example:
public IFindFluent<BsonDocument, BsonDocument> Authentication()
{
String log = Request.Form["login"];
String pass = Request.Form["password"];
String filter = "{$where: \"function() {" +
$"return this.login=='{log}' && this.password=='{pass}'"+
";}\"}";
return collection.Find(filter);
}The 'Authentication' method looks for a user account in MongoDB, the NoSQL database, by username and password. The 'filter' string that contains JavaScript code is created for this. This string helps filter the search results. In SQL, the following query operates in a similar fashion: SELECT * FROM collection WHERE login = @log AND password = @pass.
The values of the 'log' and 'pass' strings from an external source are used to create the filter. Such use of unverified data allows attackers to inject malicious code in a query.
The following example shows how an attacker could use this string instead of the expected 'pass' value:
"-1' || this.login == 'admin"Then accessing the database may look as follows:
{$where: "function()
{
return this.login == 'doesn't matter'
&& this.password == '-1'
|| this.login == 'admin';
}"}In this case, the query will return the administrator account data.
To protect users against NoSQL injections, databases provide tools for creating parameterized queries.
Here is an example of a secure query:
public IFindFluent<BsonDocument, BsonDocument> Authentication()
{
String log = Request.Form["login"];
String pass = Request.Form["password"];
var filter = Builders<BsonDocument>.Filter.Eq("login", log)
& Builders<BsonDocument>.Filter.Eq("password", pass);
return collection.Find(filter);
}The filter is created here with the help of a special 'Builders' class. Due to this, the query will be parameterized and external data will not be able to affect the filter's logic.
The analyzer also considers the parameters of methods available from other builds as sources of insecure data. You can read more about it in our note: "Why you should check values of public methods' parameters".
Here's the example:
public class MongoDBRep
{
public void DeleteItemsByCounter(string count)
{
DeleteMany(count);
}
private void DeleteMany(string count)
{
var filter = "{$where:\"function(){return this.count == "+count+";}\"}";
collection.DeleteMany(filter);
}
}Here, potentially tainted data from the 'count' parameter is passed to the 'DeleteMany' method, where tainted data is used without verification to delete records from the database.
Attackers can create a query of the type as follows:
{$where: "function()
{
return this.count == -999
|| 1 == 1;
}"}Execution of this query causes all database documents to be deleted, regardless of the 'count' field value.
In this case, we recommend you to protect yourself in the same way that was given above.
This diagnostic is classified as:
|
V5628. OWASP. Possible Zip Slip vulnerability. Potentially tainted data is used in the path to extract the file.
The analyzer has detected a file extraction operation using an unsecure path that includes a file name. If the file name contains "dot-dot-slash" sequences, this operation will result in a Zip Slip vulnerability in the application.
Zip Slip occurs when an application receives an archive with malicious files. These files contain "dot-dot-slash" sequences in the name ("../../evil.csx"). If such an archive is extracted, an attacker can overwrite any files that can be accessed by the application.
Most archive creation tools and operation systems don't allow users to create files with '../../evil.csx' names. However, there are tools that allow attackers to create files with such names. This makes the Zip Slip attack possible.
Consider an example of vulnerable code:
public void ExtractArchive(ZipArchive archive, string destinationDirectory)
{
var entries = archive.Entries;
foreach (var entry in entries)
{
var extractPath = Path.Combine(destinationDirectory, entry.FullName);
entry.ExtractToFile(extractPath, true);
}
}Inside the loop, the files are extracted from the archive to the directory located in the 'destinationDirectory' path. With the help of the 'Path.Combine' method, an extract path is created for each file. Then, the result is written to the 'extractPath' variable. Next, 'extractPath' is used as an argument of the 'entry.ExtractToFile' method that extracts the file into the target path.
Suppose that the archive should be extracted to the 'C:\ApplicationFiles\UserFiles' directory. However, if the 'entry.FullName' property returns the '\..\config.ini' string, the file will get into the root directory of the application — 'C:\ApplicationFiles'. If the name of the extracted file and, for example, the name of the application configuration file match, the latter will be overwritten.
We can secure the code in the previous example as follows:
public void ExtractArchive(ZipArchive archive, string destinationDirectory)
{
var destinationDirectoryFullPath = Path.GetFullPath(destinationDirectory);
foreach (var entry in archive.Entries)
{
var extractPath = Path.Combine(destinationDirectory, entry.FullName);
var extractFullPath = Path.GetFullPath(extractPath);
if (!extractFullPath.StartsWith(destinationDirectoryFullPath))
{
throw new IOException("Zip Slip vulnerability");
}
entry.ExtractToFile(extractFullPath);
}
}The 'Path.GetFullPath' method processes the 'extractPath' path — the result is written to the 'extractFullPath' variable. During this operation, the path containing "dot-dot-slash" sequences will be replaced with a similar one that does not include them.
Then, with the help of the 'extractFullPath.StartsWith' method, we check whether the directory for extracting the file has not changed as a result of the previous operation. If the directory has changed, an exception is thrown.
This diagnostic is classified as:
V6001. There are identical sub-expressions to the left and to the right of the 'foo' operator.
The analyzer has detected a code fragment that is very likely to have a logical error in it. The program text contains an operator (<, >, <=, >=, ==, !=, &&, ||, -, /, &, |, ^) whose both operands are identical subexpressions.
Consider this example:
if (a.x != 0 && a.x != 0)In this case, the '&&' operator is surrounded by identical subexpressions "a.x != 0", which enables the analyzer to detect a mistake made through carelessness. A correct version of this code, which won't trigger the diagnostic, should look as follows:
if (a.x != 0 && a.y != 0)The analyzer compares the code blocks, taking into account inversion of the expression's parts in relation to the operator. For example, it will detect the error in the following code:
if (a.x > a.y && a.y < a.x)This diagnostic is classified as:
You can look at examples of errors detected by the V6001 diagnostic. |
V6002. The switch statement does not cover all values of the enum.
The analyzer has detected a 'switch' statement where selection is done for a variable of the enum type, and some of the enumeration elements are missing in the 'switch' statement. This may indicate an error.
Consider this example:
enum Fruit { APPLE, ORANGE, BANANA, PEAR, PEACH, PINEAPPLE }
int SomeMethod(Fruit fruit)
{
int res = 0;
switch (fruit)
{
case APPLE:
res = calculate(10); break;
case BANANA:
res = calculate(20); break;
case PEAR:
res = calculate(30); break;
case PINEAPPLE:
res = calculate(40); break;
}
// code
return res;
}The 'Fruit' enumeration in this code contains 5 named constants, while the 'switch' statement, selecting among the values of this enumeration, only selects among 4 of them. This is very likely a mistake.
It may be that a programmer added a new constant during refactoring but forgot to add it into the list of cases in the 'switch' statement, or simply skipped it by mistake, as it sometimes happens with large enumerations. This results in incorrect processing of the missing value.
The correct version of this code should look like this:
int SomeMethod(Fruit fruit)
{
int res = 0;
switch (fruit)
{
case APPLE:
res = calculate(10); break;
case BANANA:
res = calculate(20); break;
case PEAR:
res = calculate(30); break;
case PINEAPPLE:
res = calculate(40); break;
case ORANGE:
res = calculate(50); break;
}
// code
return res;
}The analyzer doesn't output the warning every time there are missing enumeration elements in the 'switch' statement; otherwise, there would be too many false positives. There are a number of empirical exceptions from this rule, the main of which are the following:
- A default-branch is present;
- The missing constant's name includes the words "None", "Unknown", and the like.
- The missing constant is the very last in the enumeration and its name includes the words "end", "num", "count", and the like.
- The enumeration consists of only 1 or 2 constants;
- And so on.
This diagnostic is classified as:
|
You can look at examples of errors detected by the V6002 diagnostic. |
V6003. The use of 'if (A) {...} else if (A) {...}' pattern was detected. There is a probability of logical error presence.
The analyzer has detected a potential error in a construct consisting of conditional statements.
Consider the following example:
if (a == 1)
Foo1();
else if (a == 2)
Foo2();
else if (a == 1)
Foo3();In this code, the 'Foo3()' method will never get control. We are most likely dealing with a logical error here and the correct version of this code should look as follows:
if (a == 1)
Foo1();
else if (a == 2)
Foo2();
else if (a == 3)
Foo3();This diagnostic is classified as:
|
You can look at examples of errors detected by the V6003 diagnostic. |
V6004. The 'then' statement is equivalent to the 'else' statement.
The analyzer has detected a suspicious code fragment with an 'if' statement whose both true- and false-statements are absolutely identical. It is often a sign of an error.
For example:
if (condition)
result = FirstFunc(val);
else
result = FirstFunc(val);Regardless of the variable's value, the same actions will be performed. This code is obviously incorrect and should have looked something like this:
if (condition)
result = FirstFunc(val);
else
result = SecondFunc(val);This diagnostic is classified as:
You can look at examples of errors detected by the V6004 diagnostic. |
V6005. The 'x' variable is assigned to itself.
The analyzer has detected a potential error when a variable is assigned to itself.
Consider the following example taken from a real-life application:
void change(int width, int height, int length)
{
this.mWidth = width;
this.mHeight = height;
this.mLength = this.mLength;
}From the code, it becomes obvious that a developer wanted to change the values of the object properties according to the accepted parameters in the method, but an error occurred and the property 'mLength' was assigned a value of the very same property instead of the value of the argument 'length'.
The correct version of this code should have looked as follows:
void change(int width, int height, int length)
{
this.mWidth = width;
this.mHeight = height;
this.mLength = length;
}This diagnostic is classified as:
|
You can look at examples of errors detected by the V6005 diagnostic. |
V6006. The object was created but it is not being used. The 'throw' keyword could be missing.
The analyzer detected an error related to the fact the instance of the exception class is created, but in doing so, is not used anyway.
Here's an example of incorrect code:
int checkIndex(int index)
{
if (index < 0)
new IndexOutOfBoundsException("Index Out Of Bounds!!!");
return index;
}In this fragment, the 'throw' statement is missing, so executing this code will only result in creating an instance of a class without it being used in any way, and the exception won't be generated. The correct version of this code should look something like this:
int checkIndex(int index)
{
if (index < 0)
throw new IndexOutOfBoundsException("Index Out Of Bounds!!!");
return index;
}This diagnostic is classified as:
You can look at examples of errors detected by the V6006 diagnostic. |
V6007. Expression is always true/false.
The analyzer detects potentially incorrect conditional expressions, which are always true/false when calculating.
Case 1.
Incorrectly formatted condition is always true or false.
Such conditions do not necessarily indicate a bug, but they need reviewing.
Example of incorrect code:
String str = ...;
if (!str.equals("#") || !str.isEmpty()){
...
} else {
...
}The else branch in this code will never be executed because regardless of what value the 'str' variable refers to, one of the two comparisons with a string will always be true. To fix this error, we need to use operator && instead of ||. This is the fixed version of the code:
This is the fixed version of the code:
String str = ...;
if (!str.equals("#") && !str.isEmpty()){
...
} else {
...
}Case 2.
Two conditional successive operators contain mutex conditions.
Examples of mutex conditions:
- "A == B" and "A != B";
- "A > B" and "A <= B";
- "A < B" and "B < A";
- and so on.
This error can occur as a result of a typo or bad refactoring.
Consider the following example of incorrect code:
if (x == y)
if (y != x)
DoSomething(x, y);In this fragment, the 'DoSomething' method will never be called because the second condition will always be false when the first one is true. One of the variables used in the comparison is probably wrong. In the second condition, for example, variable 'z' should have been used instead of 'x':
if (x == y)
if (y != z)
DoSomething(x, y);Case 3.
A longer and shorter string is being searched in the expression. With that, the shorter string is a part of the longer one. In the result, one of the comparisons is redundant or contains an error.
Consider the following example:
if (str.contains("abc") || str.contains("abcd"))If substring "abc" is found, the check will not execute any further. If substring "abc" is not found, then searching for longer substring "abcd" does not make sense either.
To fix this error, we need to make sure that the substrings were defined correctly or delete extra checks, for example:
if (str.contains("abc"))Here's another example:
if (str.contains("abc"))
Foo1();
else if (str.contains("abcd"))
Foo2();In this code, function 'Foo2' will never be called. We can fix the error by reversing the check order to make the program search for the longer substring first and then search for the shorter one:
if (str.contains("abcd"))
Foo2();
else if (str.contains("abc"))
Foo1();This diagnostic is classified as:
You can look at examples of errors detected by the V6007 diagnostic. |
V6008. Potential null dereference.
The analyzer detected a code fragment that may cause a null-dereference issue.
Consider the following examples, which trigger the V6008 diagnostic message:
if (obj != null || obj.isEmpty()) { ... }
if (obj == null && obj.isEmpty()) { ... }All the conditions contain a logical mistake that results in null dereference. This mistake appears as the result of bad code refactoring or a typo.
The following are the fixed versions of the samples above:
if (obj == null || obj.isEmpty()) { .... }
if (obj != null && obj.isEmpty()) { .... }These are very simple situations, of course. In real-life code, an object may be tested for null and used in different lines. If you see the V6008 warning, examine the code above the line that triggered it and try to find out why the reference is null.
Here's an example where an object is checked and used in different lines:
if (player == null) {
....
String currentName = player.getName();
....
}The analyzer will warn you about the issue in the line inside the 'if' block. There is either an incorrect condition or some other variable should have been used instead of 'player'.
Sometimes programmers forget that when testing two objects for null, one of them may appear null and the other non-null. It will result in evaluating the entire condition, and null dereference. For example:
if ((text == null && newText == null) && text.equals(newText)) {
....
}This condition can be rewritten in the following way:
if ((text == null && newText == null) ||
(text != null && newText != null && text.equals(newText))) {
....
}This diagnostic is classified as:
You can look at examples of errors detected by the V6008 diagnostic. |
V6009. Function receives an odd argument.
The analyzer detected a possible error that has to do with passing a suspicious value as an argument to a function.
Consider the following examples:
Invalid index
String SomeMethod(String mask, char ch)
{
String name = mask.substring(0, mask.indexOf(ch));
...
return name;
}IndexOf() returns the position of a specified argument. If the argument is not found, the function returns the value '-1'. And passing a negative index to function substring() results in an 'StringIndexOutOfBoundsException'.
The fixed version:
String SomeMethod(String mask, char ch)
{
int pos = mask.indexOf(ch);
if (pos < 0) return "error";
String name = mask.substring(0, pos);
...
return name;
}Null argument
String[] SplitFunc(String s, String d) {
...
if (d == null) {
return s.split(d);
}
return null;
}For several reasons an incorrect check was performed because of what an argument equal null is passed to the function split. In the result, the function will generate an exception 'NullPointerException'.
Correct variant:
String[] SplitFunc(String s, String d) {
...
if (d != null) {
return s.split(d);
}
return null;
}Comparing with itself
...
return obj.equals(obj);A fragment of code returns the result of comparing of an object with itself. Isn't it strange? Most likely, a comparing with another object has taken place:
...
return obj.equals(obj2);This diagnostic is classified as:
You can look at examples of errors detected by the V6009 diagnostic. |
V6010. The return value of function 'Foo' is required to be utilized.
The analyzer has detected a suspicious call on a method whose return value is not used. Calling certain methods doesn't make sense without using their return values.
Consider the following example:
String prepare(String base, int a, double d)
{
String str = base + " /\\ " +
String.valueOf(a) + " /\\ " +
String.valueOf(d);
...
str.replace("/", "\\");
...
return str;
}From the code, it becomes obvious that a string calls the method 'replace' but, in doing so, the result of a call is ignored. As it is known, the method 'replace' returns a new changed string and does not change the content of the string, which called this method. Subsequently, a string with a needed substitution will not be used. That is why, code has to be corrected as follows so that the changes would be taken into account:
String prepare(String base, int a, double d)
{
String str = base + " /\\ " +
String.valueOf(a) + " /\\ " +
String.valueOf(d);
...
str = str.replace("/", "\\");
...
return str;
}This diagnostic is classified as:
|
You can look at examples of errors detected by the V6010 diagnostic. |
V6011. The expression contains a suspicious mix of integer and real types.
The analyzer detected a possible error in an expression where integer and real data types are used together. Real data types include types 'float' and 'double'.
Let's how the error can reveal itself in practice.
boolean IsInRange(int object_layer_width, int object_layer_height)
{
return object_layer_height != 0 &&
object_layer_width/object_layer_height > 0.1 &&
object_layer_width/object_layer_height < 10;
}An integer value is compared to the constant '0.1', and that's very strange. Assume the variables have the following values:
- object_layer_width = 20;
- object_layer_height = 100;
The programmer expects that division of these numbers will give '0.2'; it fits into the range (0.1..10).
But in fact the division result will be 0. Division is performed over integer data types, and though the result is extended to the type 'double' when compared to '0.1' a bit later, it is too late. To fix the code we need to perform an explicit type conversion beforehand:
boolean IsInRange(int object_layer_width, int object_layer_height)
{
return object_layer_height != 0 &&
(double)object_layer_width/object_layer_height > 0.1 &&
(double)object_layer_width/object_layer_height < 10;
}This diagnostic is classified as:
|
You can look at examples of errors detected by the V6011 diagnostic. |
V6012. The '?:' operator, regardless of its conditional expression, always returns one and the same value.
The analyzer has detected a potential error when using the ternary operator "?:". Regardless of the condition's result, one and the same statement will be executed. There is very likely a typo somewhere in the code.
Consider the following, simplest, example:
int A = B ? C : C;In either case, the A variable will be assigned the value of the C variable.
Let's consider the example, where it is not that easy to notice such an error:
double calc(Box bx, int angle, double scale )
{
return Math.tan((angle % 2 == 0 ?
bx.side_x : bx.side_x) * 0.42) * scale;
};This code has been formatted. In reality, though, it may be written in one line, so it's no wonder that a typo may stay unnoticed. The error here has to do with the member of the "side_x" class being used both times. The correct version of this code should look as follows:
double calc(Box bx, int angle, double scale )
{
return Math.tan((angle % 2 == 0 ?
bx.side_x : bx.side_y) * 0.42) * scale;
};This diagnostic is classified as:
You can look at examples of errors detected by the V6012 diagnostic. |
V6013. Comparison of arrays, strings, collections by reference. Possibly an equality comparison was intended.
Analyzer has detected a situation where srtings/arrays/collections are compared using the operator '=='. Most likely comparison of content was implied and actually a direct comparison of object references is taking place.
Let's look at the example of incorrect comparison of strings:
if (str1 == "example") {}
if (str1 == str2) {}In these cases, if the contents of ' str1 ' and ' str2 ' are identical and are equal to "example", then conditions will be false, because the '==' operator compares the addresses of objects, and not the contents of strings. If it is required to compare strings by content, the correct variant of the code will look like as follows:
if (str1.equals("example")) {}
if (str1.equals(str2)) {}Let's look at the example of incorrect comparison of arrays:
int[] a = ...;
int[] b = ...;
...
if (a.equals(b)) { ... }For arrays, the call of method 'equals' is the same as the '==' operator. The object addresses are compared, not the content. In order to compare arrays by content, you must rewrite the code as follows:
if (Arrays.equals(a ,b){ ... }The operator '==' behaves the same way both with collections, arrays and strings.
This diagnostic is classified as:
|
You can look at examples of errors detected by the V6013 diagnostic. |
V6014. It's odd that this method always returns one and the same value of NN.
The analyzer has detected a strange method: it does not have any state and does not change any global variables. At the same time, it has several return points returning the same numerical, string, enum, constant or read only field value.
This code is very odd and might signal a possible error. The method is most likely intended to return different values.
Consider the following simple example:
int Foo(int a)
{
if (a == 33)
return 1;
return 1;
}This code contains an error. Let's change one of the returned values to fix it. You can usually identify the necessary returned values only when you know the operation logic of the whole application in general
This is the fixed code:
int Foo(int a)
{
if (a == 33)
return 1;
return 2;
}This diagnostic is classified as:
You can look at examples of errors detected by the V6014 diagnostic. |
V6015. Consider inspecting the expression. Probably the '!='/'-='/'+=' should be used here.
The analyzer has detected a potential error, related to a strange usage of operators ('=!', '=-', '=+'). Most likely, their usage is incorrect and one of the following operators should be used here: '!=', '-=', '+='.
Operator '=!'
Example of suspicious code:
boolean a = ... ;
boolean b = ... ;
...
if (a =! b)
{
...
}It's most probably that this code should check that the 'a' variable is not equal to 'b'. If so, the correct code should look like follows:
if (a != b)
{
...
}The analyzer accounts for formatting in the expression. That's why if it is exactly assignment you need to perform - not comparison - you should specify it through parentheses or blanks. The following code samples are considered correct:
if (a = !b)
...
if (a=(!b))
...Operator '=-'
Example of suspicious code:
int size = ... ;
int delta ... ;
...
size =- delta;This code may be correct, but it is highly probable that there is a misprint and the programmer actually intended to use the '-=' operator. This is the fixed code:
size -= delta;If the code is correct, you may type in an additional space between the characters '=' and '-' to remove the V6015 warning. This is an example of correct code where the warning is not generated:
size = -delta;Operator '=+'
Example of suspicious code:
int size = ... ;
int delta ... ;
...
size =+ delta;This is the fixed code:
size+=delta;If this code is correct, you may remove '+' or type in an additional space to prevent showing the V6015 warning. The following is an example of correct code where the warning is not generated:
size = delta;
size = +delta;
This diagnostic is classified as:
V6016. Suspicious access to element by a constant index inside a loop.
The analyzer detected a possible error that has to do with trying to access the elements of an array or list using the same constant index at each iteration of a 'for' loop.
Consider the following example:
void transform(List<Integer> parameters, ...)
{
for (int i = 0; i < parameters.size(); i++)
{
int element = parameters.get(0);
...
}
...
}In this code, the programmer wanted the value of the i-th element of the 'parameters' array to be assigned to variable 'element' at each loop iteration, but because of a typo only the first element is accessed all the time. Another explanation is that the programmer probably used the element at index zero for debugging and then forgot to change the index value.
Fixed code:
void transform(List<Integer> parameters, ...)
{
for (int i = 0; i < parameters.size(); i++)
{
int element = parameters.get(i);
...
}
...
}You can look at examples of errors detected by the V6016 diagnostic. |
V6017. The 'X' counter is not used inside a nested loop. Consider inspecting usage of 'Y' counter.
The analyzer detected a possible error in two or more nested 'for' loops, when the counter of one of the loops is not used because of a typo.
Consider the following synthetic example of incorrect code:
for (int i = 0; i < N; i++)
for (int j = 0; j < M; j++)
sum += matrix[i][i];The programmer wanted to process all the elements of a matrix and find their sum but made a mistake and wrote variable 'i' instead of 'j' when indexing into the matrix.
Fixed version:
for (int i = 0; i < N; i++)
for (int j = 0; j < M; j++)
sum += matrix[i][j];V6018. Constant expression in switch statement.
The analyzer detected a constant expression in a 'switch' statement. This usually indicates the presence of a logic error in the code.
Consider the following synthetic example:
int i = 1;
switch (i)
{
....
}The condition of the 'switch' statement is represented by a variable whose value can be computed at compilation time. This situation could have resulted from code refactoring: the previous version of the code changed the variable's value but then it was modified and the variable turned out to be no longer assigned any value.
This diagnostic is classified as:
|
V6019. Unreachable code detected. It is possible that an error is present.
The analyzer detected code that will never be executed. It may signal the presence of a logic error.
This diagnostic is designed to find blocks of code that will never get control.
Consider the following example:
void printList(List<Integer> list) {
if (list == null) {
System.exit(-999);
System.err.println("Error!!! Output empty!!! list == null");
}
list.forEach(System.out::println);
}The ''prinln (...)' function will never print the error message, as the 'System.exit(...)' function does not return control. The exact way of fixing this error depends on the logic intended by the programmer. The function could be meant to return control, or maybe the expressions are executed in the wrong order and the code was actually meant to look like this:
void printList(List<Integer> list) {
if (list == null) {
System.err.println("Error!!! Output empty!!! list == null");
System.exit(-999);
}
list.forEach(System.out::println);
}Here is another example:
void someTransform(int[] arr, int n, boolean isErr, int num, int den)
{
if (den == 0 || isErr)
{
return;
}
...
for (int i = 0; i < n; ++i)
{
if (!isErr || arr[i] <= 0)
continue;
arr[i] += 2 * num/den;
}
...
}In this fragment the code 'arr[i] += 2 * num/den;' was not executed. Checks of a variable 'isErr' in the beginning of the method and loop are contradictory and changes of this variable between the checks aren't. Therefore, the operator 'continue' will be executed for each step of the loop. Most likely, this happened because of refactoring.
Example of suspicious code:
void someTransform(int[] arr, int n, boolean isErr, int num, int den)
{
if (den == 0 || isErr)
{
return;
}
...
for (int i = 0; i < n; ++i)
{
if (arr[i] <= 0)
continue;
arr[i] += 2 * num/den;
}
...
}This diagnostic is classified as:
You can look at examples of errors detected by the V6019 diagnostic. |
V6020. Division or mod division by zero.
The analyzer detected a potential division by zero.
Consider the following example:
if (maxHeight >= 0)
{
fx = height / maxHeight;
}It is checked in the condition if the value of the maxHeight variable is non-negative. If this value equals 0, a division by zero will occur inside the if statement's body. To fix this issue, we must ensure that the division operation is executed only when maxHeight refers to a positive number.
The fixed version of the code:
if (maxHeight > 0)
{
fx = height / maxHeight;
}This diagnostic is classified as:
|
You can look at examples of errors detected by the V6020 diagnostic. |
V6021. The value is assigned to the 'x' variable but is not used.
This diagnostic rule detects only cases when incorrect value is assigned to a variable which is reassigned with a new value or is not used at all.
Case 1.
One and the same variable is assigned a value twice. In addition, the variable itself is not used between these assignments.
Consider this example:
A = GetA();
A = GetB();The 'A' variable being assigned values twice might indicate a bug. The code should have most probably looked like this:
A = GetA();
B = GetB();Cases when the variable is used between the assignments are treated as correct and do not trigger the warning:
A = 1;
A = Foo(A);Case 2.
Local variable is assigned a value, but the variable is not used further anywhere until the exit of the method.
Consider the following example:
String GetDisplayName(Titles titles, String name)
{
String result = null;
String tmp = normalize(name);
if (titles.isValidName(name, tmp)){
result = name;
}
return name;
}The programmer wanted the method to return the 'result' variable, which gets initialized depending on how 'isValidName' executes, but made a typo that causes the method to return the variable 'name' all the time. The fixed code should look like this:
String GetDisplayName(Titles titles, String name)
{
String result = null;
String tmp = normalize(name);
if (titles.isValidName(name, tmp)){
result = name;
}
return result;
}This diagnostic is classified as:
|
You can look at examples of errors detected by the V6021 diagnostic. |
V6022. Parameter is not used inside method's body.
The analyzer detected a suspicious situation when one parameter of a method is never used while another parameter is used several times. It may be a sign of an error.
Consider the following example:
private static bool CardHasLock(int width, int height)
{
const double xScale = 0.051;
const double yScale = 0.0278;
int lockWidth = (int)Math.Round(height * xScale);
int lockHeight = (int)Math.Round(height * yScale);
....
}The 'width' parameter is never used in the method body while the 'height' parameter is used twice, including the initialization of the 'lockWidth' variable. This code is very likely to contain an error and the 'lockWidth' variable should be actually initialized in the following way:
int lockWidth = (int)Math.Round(width * xScale);This diagnostic is classified as:
|
You can look at examples of errors detected by the V6022 diagnostic. |
V6023. Parameter 'A' is always rewritten in method body before being used.
The analyzer detected a possible error in a method's body. One of the method's parameters is rewritten before being used. Therefore, the value passed to the method is simply lost.
This error can manifest itself in a number of ways. Consider the following example:
void Foo1(int A, int B)
{
A = Calculate(A);
B = Calculate(A);
// do smt...
}There is a typo here that will result in the 'B' object being assigned an incorrect value. The fixed code should look like this:
void Foo1(int A, int B)
{
A = Calculate(A);
B = Calculate(B);
// do smt...
}Let's see one more example of this error:
void Foo2(List<Integer> list, int count)
{
list = new ArrayList<Integer>(count);
for (int i = 0; i < count; ++i)
list.add(MyRnd(i));
}This method was meant to initialize a list with some values. But what actually takes place is copying of the reference ('list'), which stores the address of the memory block in the heap where the list (or 'null' if memory wasn't allocated) is stored. Therefore, when we allocate memory for the list once again, the memory block's address is written into a local copy of the reference while the original reference (outside the method) remains unchanged. It results in additional work on memory allocation, list initialization, and subsequent garbage collection.
Perhaps, the method should be rewritten in the following way:
List<Integer> Foo2(int count)
{
List<Integer> list = new ArrayList<>(count);
for (int i = 0; i < count; ++i)
list.add(MyRnd(i));
}
...
list = Foo2(count);You can look at examples of errors detected by the V6023 diagnostic. |
V6024. The 'continue' operator will terminate 'do { ... } while (false)' loop because the condition is always false.
The analyzer detected a code fragment that may mislead programmers reading it. Not all developers know that using the "continue" statement in a "do { ... } while(false)" loop will terminate it instead of continuing its execution.
So, after executing the 'continue' statement, the '(false)' condition will be checked and the loop will terminate because the condition is false.
Consider the following example:
int i = 1;
do
{
System.out.print(i);
i++;
if (i < 3)
continue;
System.out.print('A');
} while (false);The programmer may expect the program to print '12A', but it will actually print '1'.
Even if the code was intended to work that way and there is no error, it is still recommended to revise it. For example, you can use the 'break' statement:
int i = 1;
do
{
System.out.print(i);
i++;
if (i < 3)
break;
System.out.print('A');
} while (false);The code has become clearer; one can immediately see that the loop will terminate if the "(i < 3)" condition is true. In addition, it won't trigger the analyzer warning anymore.
If the code is incorrect, it must be fixed. There are no set rules as to how exactly it should be rewritten since it depends on the code's execution logic. For example, if you need the program to print '12A', it is better to rewrite this fragment as follows:
for (int i = 1; i < 3; ++i)
System.out.print(i);
System.out.print('A');This diagnostic is classified as:
V6025. Possibly index is out of bound.
When indexing into a variable of type 'array', 'list', or 'string', an 'IndexOutOfBoundsException' exception may be thrown if the index value is outbound the valid range. The analyzer can detect some of such errors.
For example, it may happen when iterating through an array in a loop:
int[] buff = new int[25];
for (int i = 0; i <= 25; i++)
buff[i] = 10;Keep in mind that the first item's index is 0 and the last item's index is the array size minus one. Fixed code:
int[] buff = new int[25];
for (int i = 0; i < 25; i++)
buff[i] = 10;Errors like that are found not only in loops but in conditions with incorrect index checks as well:
void ProcessOperandTypes(int opCodeValue, byte operandType)
{
byte[] OneByteOperandTypes = new byte[0xff];
if (opCodeValue < 0x100)
{
OneByteOperandTypes[opCodeValue] = operandType;
}
...
}Fixed version:
void ProcessOperandTypes(int opCodeValue, byte operandType)
{
byte[] OneByteOperandTypes = new byte[0xff];
if (opCodeValue < 0xff)
{
OneByteOperandTypes[opCodeValue] = operandType;
}
...
}Programmers also make mistakes of this type when accessing a particular item of an array or list.
private Map<String, String> TransformListToMap(List<String> config)
{
Map<String, String> map = new HashMap<>();
if (config.size() == 10)
{
map.put("Base State", config.get(0));
...
map.put("Sorted Descending Header Style", config.get(10));
}
...
return map;
}In this example, the programmer made a mistake in the number of entries in the 'config' list. The fixed version should look like this:
private Map<String, String> TransformListToMap(List<String> config)
{
Map<String, String> map = new HashMap<>();
if (config.size() == 11)
{
map.put("Base State", config.get(0));
...
map.put("Sorted Descending Header Style", config.get(10));
}
...
return map;
}This diagnostic is classified as:
You can look at examples of errors detected by the V6025 diagnostic. |
V6026. This value is already assigned to the 'b' variable.
The analyzer has detected a possible error that has to do with meaningless variable assignments.
Consider this example:
int a, b, c;
...
a = b;
c = 10;
b = a;The "b = a" assignment statement in this code does not make sense. It might be a typo or just unnecessary operation. This is what the correct version of the code should look like:
a = b;
c = 10;
b = a_2;This diagnostic is classified as:
|
You can look at examples of errors detected by the V6026 diagnostic. |
V6027. Variables are initialized through the call to the same function. It's probably an error or un-optimized code.
The analyzer detected a possible error that deals with two different variables being initialized by the same expression. Not all of such expressions are treated as unsafe but only those where function calls are used (or expressions that are very long).
Here is the simplest case:
sz1 = s1.length();
sz2 = s1.length();Two different variables are assigned the same size of a string. Having looked at the variables 'sz1' and 'sz2' we can conclude that a typo took place. Correct code fragment will be as follows:
sz1 = s1.length();
sz2 = s2.length();If the analyzer issued a warning for the fragment of code,
x = expression;
y = expression;Here are the options in this regard:
- Code contains an error and 'expression' has to be corrected.
- Code is correct. If 'expression' requires a lot of calculations, it's better to write 'y = x;'.
You can look at examples of errors detected by the V6027 diagnostic. |
V6028. Identical expression to the left and to the right of compound assignment.
The analyzer detected identical subexpressions to the left and to the right of a compound assignment operator. This operation may be incorrect or meaningless, or can be simplified.
Consider the following example:
x += x + 5;Perhaps the programmer simply wanted to add the value 5 to the 'x' variable. In that case, the fixed code would look like this:
x = x + 5;Or perhaps they wanted to add the value 5 but wrote an extra 'x' variable by mistake. Then the code should look like this:
x += 5;However, it is also possible that the code is written correctly, but it looks too complicated and should be simplified:
x = x * 2 + 5;Now consider the following example:
x += x;This operation is equivalent to multiplying the value of a variable by two. This is what a clearer version would look like:
x *= 2;Here is one more expression:
y += top - y;We are trying to add the difference of the variables 'top' and 'y' to the 'y' variable. Resolving this expression produces the following result:
y = y + top – y;It can be simplified, as the 'y' variable is subtracted from itself, which does not make sense:
y = top;You can look at examples of errors detected by the V6028 diagnostic. |
V6029. Possible incorrect order of arguments passed to method.
The analyzer detected a suspicious sequence of arguments passed to a method. Perhaps, some arguments are misplaced.
An example of suspicious code:
void SetARGB(short A, short R, short G, short B) { .... }
void Foo(){
short A = 0, R = 0, G = 0, B = 0;
....
SetARGB(A, R, B, G);
....
}When defining the object color, the programmer accidentally swapped the blue and green color parameters.
The fixed version of the code should look like this:
SetARGB(A, R, G, B);This diagnostic is classified as:
You can look at examples of errors detected by the V6029 diagnostic. |
V6030. The function located to the right of the '|' and '&' operators will be called regardless of the value of the left operand. Consider using '||' and '&&' instead.
The analyzer has detected a possible typo in a logical expression: a bitwise operator (& or |) is used instead of a logical one (&& or ||). This means that the right operand will be evaluated regardless of the result of the left operand.
Consider the following example:
if (foo() | bar()) {}Using bitwise operations is suboptimal from the performance viewpoint when the operands are represented by relatively resource-intensive operations. Besides, such code could cause errors because of different types participating in the expression and different operation precedence. There are also situations where the right operand must not be executed if evaluation of the left one has failed, in which case the program could attempt to access uninitialized resources. Finally, bitwise operations do not guarantee the operand evaluation order.
Fixed code:
if (foo() || bar()) {}This diagnostic is classified as:
You can look at examples of errors detected by the V6030 diagnostic. |
V6031. The variable 'X' is being used for this loop and for the outer loop.
The analyzer detected a potential error: a nested loop utilizes a variable as its counter, which is also used in an outer loop.
In a schematic form, this error looks in the following way:
int i = 0, j = 0;
for (i = 0; i < 5; i++)
for (i = 0; i < 5; i++)
arr[i][j] = 0;Of course, this is an artificial sample, so we may easily see the error, but in a real application, the error might be not so apparent. This is the correct code:
int i = 0, j = 0;
for (i = 0; i < 5; i++)
for (j = 0; j < 5; j++)
arr[i][j] = 0;Using one variable both for the outer and inner loops is not always a mistake. Consider a sample of correct code the analyzer won't generate the warning for:
for (c = lb; c <= ub; c++)
{
if (!(xlb <= calc(c) && calc(c) <= ub))
{
Range r = new Range(xlb, xlb + 1);
for (c = lb + 1; c <= ub; c++)
r = DoUnion(r, new Range(calc(c), calc(c) + 1));
return r;
}
}In this code, the inner loop "for (c = lb + 1; c <= ub; c++)" utilizes the "c" variable as a counter. The outer loop also uses the "c" variable. But there is no error here. After the inner loop is executed, the "return r;" operator will perform exit from the function.
This diagnostic is classified as:
|
V6032. It is odd that the body of 'Foo_1' function is fully equivalent to the body of 'Foo_2' function.
The analyzer outputs this warning when it detects that two functions are implemented in the same way. The presence of two identical functions in code is not an error in itself, but such code should be inspected.
This diagnostic is meant for detecting the following type of bugs:
class Point
{
....
int GetX() { return mX; }
int GetY() { return mX; }
};A typo makes two different functions do the same thing. This is the correct version of this code:
int GetX() { return mX; }
int GetY() { return mY; }In the example above, the bodies of the functions GetX() and GetY() being alike is obviously a sign of a bug. However, there would be too many false positives if we set the analyzer to output this warning every time it encounters functions with identical bodies. That's why it relies on a number of exceptions for cases when it shouldn't output the warning. Such cases include the following:
- Functions with identical bodies use no other variables but arguments. For example: "bool IsXYZ() { return true; }";
- Functions with identical bodies are repeated more than twice;
- The functions' bodies consist of only the throw() statement;
- Etc.
You can look at examples of errors detected by the V6032 diagnostic. |
V6033. An item with the same key has already been added.
The analyzer detected the following strange situation: items are being added to a dictionary (containers of type 'map', etc.) or set (containers of type 'set', etc.) while having the same keys that are already present in these containers, which will result in ignoring the newly added items. This issue may be a sign of a typo and result in incorrect filling of the container.
Consider the following example with incorrect dictionary initialization:
Map<String, Integer> map = new HashMap<String, Integer>() {{
put("a", 10);
put("b", 20);
put("a", 30); // <=
}};The programmer made a typo in the last line of the code performing dictionary initialization, as the 'a' key is already in the dictionary. As a result, this dictionary will contain 2 values.
To fix the error, we need to use a correct key value:
Map<String, Integer> map = new HashMap<String, Integer>() {{
put("a", 10);
put("b", 20);
put("c", 30);
}};A similar error may occur when initializing a set:
HashSet<String> someSet = new HashSet<String>(){{
add("First");
add("Second");
add("Third");
add("First"); // <=
add("Fifth");
}};A typo results in an attempt to write string 'First' instead of the 'Fourth' key to the 'someSet' set, but since this key is already in the set, it will be ignored.
To fix this error, we need to fix the initialization list:
HashSet<String> someSet = new HashSet<String>(){{
add("First");
add("Second");
add("Third");
add("Fourth");
add("Fifth");
}};This diagnostic is classified as:
You can look at examples of errors detected by the V6033 diagnostic. |
V6034. Shift by N bits is inconsistent with the size of type.
Analyzer detected a likely error that has to do with shifting a value of integer number by 'N' bits, 'N' being greater than the length of this type in bits.
Consider the following example:
long convert(int x, int y, int shift)
{
if (shift < 0 || shift > 32) {
return -1;
}
return (x << shift) + y;
}In this case, a developer wanted to get the 64-bit number from two 32-bit ones, having shifted 'x' for some number of bits 'shift' and having merged the small and the great part. It is possible that 'shift' may have the value equal to 32. As 'x' is 32-bit number at the moment of shifting, then a shift for 32 bits is equal to a shift for 0 bit, which will lead to incorrect result.
This is what the fixed version of the code could look like:
long convert(int x, int y, int shift)
{
if (shift < 0 || shift > 32) {
return -1;
}
return ((long)x << shift) + y;
}This diagnostic is classified as:
|
You can look at examples of errors detected by the V6034 diagnostic. |
V6035. Double negation is present in the expression: !!x.
Analyzer has detected a potential error related to double negation of a variable. Such duplication is confused, and, most likely, contains an error.
Consider the following example:
if (!(( !filter )))
{
....
}This error most likely appeared during code refactoring. For example, a part of a complex logical expression was removed while the negation of the whole result wasn't. As a result, we've got an expression with an opposite meaning.
The fixed version of the code may look like this:
if ( filter )
{
....
}or this:
if ( !filter )
{
....
}V6036. The value from the uninitialized optional is used.
The analyzer has detected an addressing to the object Optional, which, in turn, is potentially empty. In such a case, there the 'NoSuchElementException' exception will be generated.
Let's consider an example:
PClient getClient(boolean cond, String name, String company, /*args*/)
{
Optional<PClient> optClient = cond ?
Optional.of(new PClient(name, company)) : Optional.empty();
...
PClient pClient = optClient.get();
...
return pClient;
}After executing the first string, the 'optClient' object can be initialized by an empty Optional depending on the condition. In such a case, a string 'optClient.get()' will generate an exception for which there is no check. This could happen because of carelessness or after refactoring. As an option, code can be corrected as follows:
PClient getClient(boolean cond, String name, String company, /*args*/)
{
Optional<PClient> optClient = cond ?
Optional.of(new PClient(name, company)) : Optional.empty();
...
if (optClient.isPresent())
{
PClient pClient = optClient.get();
...
return pClient;
}
else
{
return null;
}
}This diagnostic is classified as:
You can look at examples of errors detected by the V6036 diagnostic. |
V6037. An unconditional 'break/continue/return/goto' within a loop.
The analyzer has detected a suspicious loop where one of the following statements is used: continue, break, return, goto, or throw. These statements are executed all the time, irrespective of any conditions.
For example:
for(int k = 0; k < max; k++)
{
if (k == index)
value = Calculate(k);
break;
}In this code, the 'break' statement doesn't belong to the 'if' statement, which will cause it to execute all the time, regardless of whether or not the 'k == index' condition is true, and the loop body will iterate only once. The correct version of this code should look like this:
for(int k = 0; k < max; k++)
{
if (k == index)
{
value = Calculate(k);
break;
}
}This diagnostic is classified as:
|
You can look at examples of errors detected by the V6037 diagnostic. |
V6038. Comparison with 'double.NaN' is meaningless. Use 'double.isNaN()' method instead.
The analyzer detected that a variable of type float or double is compared with a Float.NaN or Double.NaN value. As stated in the documentation (15.21.1), if two Double.NaN values are tested for equality by using the '==' operator, the result is false. So, no matter what value of 'double' type is compared with Double.NaN, the result is always false.
Consider the following example:
void Func(double d) {
if (d == Double.NaN) {
....
}
}It's incorrect to test the value for NaN using operators '==' and '!= '. Instead, method Float.isNaN() or Double.isNaN() should be used. The fixed version of the code:
void Func(double d) {
if (Double.isNaN(d)) {
....
}
}This diagnostic is classified as:
V6039. There are two 'if' statements with identical conditional expressions. The first 'if' statement contains method return. This means that the second 'if' statement is senseless.
The analyzer has detected an issue when the 'then' part of the 'if' operator never gets control. It happens because there is another 'if' before which contains the same condition whose 'then' part contains the unconditional 'return' operator. It may signal both a logical error in the program and an unnecessary second 'if' operator.
Consider the following example of incorrect code:
if (l >= 0x06C0 && l <= 0x06CE) return true;
if (l >= 0x06D0 && l <= 0x06D3) return true;
if (l == 0x06D5) return true; // <=
if (l >= 0x06E5 && l <= 0x06E6) return true;
if (l >= 0x0905 && l <= 0x0939) return true;
if (l == 0x06D5) return true; // <=
if (l >= 0x0958 && l <= 0x0961) return true;
if (l >= 0x0985 && l <= 0x098C) return true;In this case, the 'l == 0x06D5' condition is doubled, and we just need to remove one of them to fix the code. However, it may be that the value being checked in the second case should be different from the first one.
This is the fixed code:
if (l >= 0x06C0 && l <= 0x06CE) return true;
if (l >= 0x06D0 && l <= 0x06D3) return true;
if (l == 0x06D5) return true;
if (l >= 0x06E5 && l <= 0x06E6) return true;
if (l >= 0x0905 && l <= 0x0939) return true;
if (l >= 0x0958 && l <= 0x0961) return true;
if (l >= 0x0985 && l <= 0x098C) return true;This diagnostic is classified as:
|
You can look at examples of errors detected by the V6039 diagnostic. |
V6040. The code's operational logic does not correspond with its formatting.
The analyzer detected a possible error: the formatting of the code after a conditional statement does not correspond with the program's execution logic. Opening and closing braces may be missing.
Consider the following example:
if (a == 1)
b = c; d = b;In this code, the assignment 'd = b;' will be executed all the time regardless of the 'a == 1' condition.
If it is really an error, the code can be fixed by adding the braces:
if (a == 1)
{ b = c; d = b; }Here is one more example of incorrect code:
if (a == 1)
b = c;
d = b;Again, we need to put in the braces to fix the error:
if (a == 1)
{
b = c;
d = b;
}If it is not an error, the code should be formatted in the following way to prevent the displaying of warning V6040:
if (a == 1)
b = c;
d = b;This diagnostic is classified as:
V6041. Suspicious assignment inside the conditional expression of 'if/while/do...while' statement.
The analyzer has detected an 'if'/ 'while'/'do...while' statement whose conditional expression contains the assignment operator '='. Such constructs often signal the presence of errors. The programmer probably intended to use the '==' operator rather than '='.
Consider the following example:
void func(int x, boolean skip, ...)
{
if (skip = true) {
return;
}
...
if ((x > 50) && (x < 150)) {
...
}
...
}This code has a typo in it: rather than checking the 'skip' variable, the programmer is changing its value. As a result, the condition will always be true and the 'return' statement will be executed all the time. Fixed code:
if (skip == true){
return;
}or:
if (skip){
return;
}This diagnostic is classified as:
|
V6042. The expression is checked for compatibility with type 'A', but is cast to type 'B'.
The analyzer detected a likely error that has to do with checking if an expression is compatible with one type and casting it to another type inside the body of the conditional statement.
Consider the following example:
if (a instanceof A)
{
return (B)a;
}The programmer must have made a mistake, since a type conversion like that is very likely to cause a bug. What was actually meant is either to check the expression for type 'B' or cast it to type 'A'.
This is what the correct version could look like:
if (a instanceof B)
{
return (B)a;
}This diagnostic is classified as:
You can look at examples of errors detected by the V6042 diagnostic. |
V6043. Consider inspecting the 'for' operator. Initial and final values of the iterator are the same.
The analyzer has detected a potential error: initial and finite counter values coincide in the 'for' operator. Using the 'for' operator in such a way will cause the loop to be executed only once or not to be executed at all.
Consider the following example:
void BeginAndEndForCheck(int beginLine, int endLine)
{
for (int i = beginLine; i < beginLine; i++)
{
...
}
...
}The loop body is never executed. Most likely, there is a misprint and "i < beginLine" should be replaced with the correct expression "i < endLine". This is the correct code:
for (int i = beginLine; i < endLine; i++)
{
...
}Another example:
for (int i = n; i <= n; i++)
...This loop's body will be executed only once. This is probably not what the programmer intended.
This diagnostic is classified as:
You can look at examples of errors detected by the V6043 diagnostic. |
V6044. Postfix increment/decrement is senseless because this variable is overwritten.
Analyzer detected a likely error that has to do with using a postfix increment or decrement in an assignment to the same variable.
Consider the following example:
int i = 5;
// Some code
i = i++;The increment operation here will not affect the expression result and the 'i' variable will be assigned the value 5 after executing this code.
This is explained by the fact that postfix increment and decrement operations are executed after evaluating the right operand of the assignment operator, while the result of the assignment is temporarily cached and is assigned later to the left part of the expression after the increment/decrement operation has executed. Therefore, the result of the increment/decrement is overwritten with the result of the whole expression.
As for the correct version of this code, it can look differently depending on the intended behavior.
This error may be a typo and the programmer unintentionally wrote variable 'i' twice in the assignment statement. Then the correct version could look as follows:
int i = 5;
// Some code
q = i++;Another scenario is that the programmer did not know that the postfix increment operator adds one to the value of the variable but returns its initial value. Then the assignment statement is redundant and the fixed code could look like this:
int i = 5;
// Some code
i++;This diagnostic is classified as:
|
V6045. Suspicious subexpression in a sequence of similar comparisons.
The analyzer has detected a code fragment that is very likely to contain a typo. The fragment is a sequence of similar comparisons of class members, but one of the subexpressions is different from the others in that it compares a pair of members of different names, while the others compare pairs of members of the same name.
Consider the following example:
if (a.x == b.x && a.y == b.y && a.z == b.y)In this code, the 'a.z == b.y' subexpression is different from the other subexpressions in the sequence and is very likely a result of a typo made by the programmer when editing the copied code fragment. This is the correct version, which would not trigger the warning:
if (a.x == b.x && a.y == b.y && a.z == b.z)The analyzer outputs this warning for sequences of three and more comparisons.
V6046. Incorrect format. Consider checking the N format items of the 'Foo' function.
The analyzer has detected a possible error related to use of formatting methods: String.format, System.out.format, System.err.format, etc. The format string does not correspond with actual arguments passed to the method.
Here are some simple examples:
Unused arguments.
int A = 10, B = 20;
double C = 30.0;
System.out.format("%1$s < %2$s", A, B, C);Format item '%3$s' is not specified, so variable 'C' won't be used.
Possible correct versions of the code:
//Remove extra argument
System.out.format("%1$s < %2$s", A, B);
//Fix format string
System.out.format("%1$s < %2$s < %3$s", A, B, C);Number of arguments passed is less than expected.
int A = 10, B = 20;
double C = 30.0;
System.out.format("%1$s < %2$s < %3$s", A, B);A much more dangerous situation occurs when a function receives fewer arguments than expected. This leads to an exception.
Possible correct versions of the code:
//Add missing argument
System.out.format("%1$s < %2$s < %3$s", A, B, C);
//Fix indices in format string
System.out.format("%1$s < %2$s", A, B);The analyzer doesn't output the warning given that:
- The number of format items specified matches the number of arguments.
- The format object is used a number of times:
int row = 10;
System.out.format("Line: %1$s; Index: %1$s", row);This diagnostic is classified as:
You can look at examples of errors detected by the V6046 diagnostic. |
V6047. It is possible that this 'else' branch must apply to the previous 'if' statement.
Analyzer detected a potential error in logical conditions: code's logic does not coincide with the code formatting.
Consider this sample:
if (X)
if (Y) Foo();
else
z = 1;The code formatting disorientates you so it seems that the "z = 1" assignment takes place if X == false. But the 'else' branch refers to the nearest operator 'if'. In other words, this code is actually analogous to the following code:
if (X)
{
if (Y)
Foo();
else
z = 1;
}So, the code does not work the way it seems at first sight.
If you get the V6047 warning, it may mean one of the two following things:
1) Your code is badly formatted and there is no error actually. In this case you need to edit the code so that it becomes clearer and the V6047 warning is not generated. Here is a sample of correct editing:
if (X)
if (Y)
Foo();
else
z = 1;2) A logical error has been found. Then you may correct the code, for instance, this way:
if (X) {
if (Y)
Foo();
} else {
z = 1;
}This diagnostic is classified as:
V6048. This expression can be simplified. One of the operands in the operation equals NN. Probably it is a mistake.
The analyzer allows to detect suspicious operations such as '+', '-', '<<', '>>' where one of the operands is equal to 0, or the operation '*', '/', '%' with the operand, equal to 1.
The V6048 diagnostic rule helps to perform code refactoring and sometimes detect errors.
These are examples of constructs that cause this diagnostic message to appear:
int y = 1;
...
int z = x * y;This code can be simplified. For example:
int z = x;This diagnostic is classified as:
You can look at examples of errors detected by the V6048 diagnostic. |
V6049. Classes that define 'equals' method must also define 'hashCode' method.
The analyzer has detected a user type which overrides the method 'equals', but it doesn't override the method 'hashCode', and vice versa. This can lead to incorrect functioning of the custom type in combination with such collections as HashMap, HashSet and Hashtable, as they actively use 'hashCode' and 'equals' in their work.
Let's consider an example with the usage of HashSet:
public class Employee {
String name;
int age;
public Employee(String name, int age) {
this.name = name;
this.age = age;
}
public String getName() { return name; }
public void setName(String name) { this.name = name; }
public int getAge() { return age; }
public void setAge(int age) { this.age = age; }
public String getFullInfo() {
return this.name + " - " + String.valueOf(age);
}
@Override
public boolean equals(Object obj) {
if (obj == this)
return true;
if (!(obj instanceof Employee))
return false;
Employee employee = (Employee) obj;
return employee.getAge() == this.getAge()
&& employee.getName() == this.getName();
}
}
public static void main(String[] args)
{
HashSet<Employee> employees = new HashSet<>();
employees.add(new Employee("OLIVER", 25));
employees.add(new Employee("MUHAMMAD", 54));
employees.add(new Employee("OLIVER", 25));
employees.forEach(arg -> System.out.println(arg.getFullInfo()));
}In the result of the program work, this will be issued on console:
OLIVER - 25
MUHAMMAD - 54
OLIVER - 25As we can see, despite the fact that the type 'Employee' overrides the method 'equals', it is not enough. In the course of executing the program we didn't manage to receive an expected result, and the collection contains repeated elements. To eliminate this problem one has to add the overriding of the method 'hashCode' in the declaration of the type 'Employee':
public class Employee {
...
@Override
public boolean equals(Object obj) {
if (obj == this)
return true;
if (!(obj instanceof Employee))
return false;
Employee employee = (Employee) obj;
return employee.getAge() == this.getAge()
&& employee.getName() == this.getName();
}
@Override
public int hashCode() {
int result=17;
result=31*result+age;
result=31*result+(name!=null ? name.hashCode():0);
return result;
}
}
public static void main(String[] args)
{
HashSet<Employee> employees = new HashSet<>();
employees.add(new Employee("OLIVER", 25));
employees.add(new Employee("MUHAMMAD", 54));
employees.add(new Employee("OLIVER", 25));
employees.forEach(arg -> System.out.println(arg.getFullInfo()));
}Now run the program again. In the result, this will be issued on the console:
MUHAMMAD - 54
OLIVER - 25We received a correct result: the collection contains only unique elements.
This diagnostic is classified as:
|
V6050. Class initialization cycle is present.
This diagnostic detects cases of incorrect declaration order of static class fields, as well as cases where static fields depend on other classes. Such defects make the code hard to maintain or result in incorrect class initialization.
Case 1.
Using a static field before it gets initialized.
Consider the following artificial example:
public class Purse
{
static private Purse reserve = new Purse(10);
static private int scale = 5 + (int) (Math.random() * 5);
private int deposit;
Purse() {
deposit = 0;
}
Purse(int initial) {
deposit = initial * scale;
}
...
}As you know, when a class is used for the first time, static fields are the first to be initialized and they are initialized in the order in which they are declared. So, in this example, 'reserve' is initialized first, and 'scale' is initialized after that.
This is how the static field 'reserve' is initialized:
- The 'Purse' constructor is called with the argument 'initial = 10'.
- While evaluating the 'initial * scale' expression in this constructor, the field 'scale' is not yet initialized and has the default value (0) rather than the value within the range [5;10].
As a result, the 'deposit' field of the object 'reserve' will not be initialized in the desired way.
To fix this, we need to change the declaration order of the static fields:
public class Purse
{
static private int scale = 5 + (int) (Math.random() * 5);
static private Purse reserve = new Purse(10);
private int deposit;
Purse() {
deposit = 0;
}
Purse(int initial) {
deposit = initial * scale;
}
...
}Case 2.
Mutual dependence of static fields of different classes.
Consider the following artificial example:
public class A {
public static int scheduleWeeks = B.scheduleDays / 7 + 1;
....
}
....
public class B {
public static int scheduleDays = A.scheduleWeeks * 7 + 7;
....
}The static field 'A.scheduleWeeks' depends on the static field 'B.scheduleDays', and vice versa. The classes may get initialized in one order or another, and so may the static fields. If the 'A' class is initialized first, then 'A.scheduleWeeks' will refer to the value 2 and 'B.scheduleDays', the value 7. If the 'B' class is initialized first, then 'A.scheduleWeeks' will refer to the value 1 and 'B.scheduleDays', the value 14. This is not the way programmers would like their code to behave. To fix the defect, we should revise how the fields are initialized to remove their mutual dependence.
For example, initializing one of the static fields to a constant would make them no longer dependent on each other:
public class A {
public static int scheduleWeeks = B.scheduleDays / 7 + 1;
....
}
....
public class B {
public static int scheduleDays = 14;
....
}With this fix, 'B.scheduleDays' will always refer to 14 and 'A.scheduleWeeks' to 3.
Case 3.
A static field of one class is initialized by a static method of another class, and that method, in its turn, uses a static method or field of the first class.
Consider the following artificial example:
public class A {
public static int scheduleWeeks = B.getScheduleWeeks();
public static int getScheduleDays() { return 21; }
....
}
....
public class B {
public static int getScheduleWeeks() {return A.getScheduleDays()/7;}
....
}No matter which of the classes is initialized first, the field 'A.scheduleWeeks' will be assigned the value 3. Even so, initializing fields in a way like that makes the code hard to read and maintain.
This snippet could be fixed in the following way:
public class A {
public static int scheduleWeeks = B.getScheduleWeeks();
....
}
....
public class B {
public static int getScheduleDays() { return 21; }
public static int getScheduleWeeks() {return B.getScheduleDays()/7;}
}This diagnostic is classified as:
|
You can look at examples of errors detected by the V6050 diagnostic. |
V6051. Use of jump statements in 'finally' block can lead to the loss of unhandled exceptions.
The analyzer has detected a return/break/continue or other statement of this type used inside a 'finally' block. Such use of these statements may result in losing an unhandled exception thrown in a 'try' or 'catch' block. As stated by JLS [14.20.2], if the 'finally' block terminates in such a way, all exceptions thrown in 'try' or 'catch' will be suppressed.
Consider the following example:
int someMethod(int a, int b, int c) throws SomeException
{
int value = -1;
...
try
{
value = calculateTransform(a, b, c);
...
}
finally
{
System.out.println("Result of someMethod()");
return value; // <=
}
}Even though its signature says it may throw an exception, the 'someMethod' method will never actually do that because executing the 'return' statement will suppress that exception and it will never leave the method body.
Programmers may deliberately use this technique to suppress exceptions. If that is the case, delete the exception-throwing statement in the method signature to prevent the analyzer from issuing a warning.
int someMethod(int a, int b, int c)
{
int value = -1;
...
try
{
value = calculateTransform(a, b, c);
...
}
finally
{
System.out.println("Result of someMethod()");
return value;
}
}Let's modify the previous example a bit:
int someMethod(int a, int b, int c) throws SomeException
{
int value = -1;
...
try
{
value = calculateTransform(a, b, c);
...
}
catch (SomeException se)
{
...
throw se;
}
finally
{
System.out.println("Result of someMethod()");
return value; // <=
}
}This code will trigger the warning too. Here we have an exception handler named 'SomeException', which performs some actions and then re-throws the exception downstream. After that, the 'finally' block terminates and the function returns 'value'. And what about the exception? Well, after it is re-thrown in the handler, it will never leave the method.
To fix that, we should change the code as follows:
int someMethod(int a, int b, int c) throws SomeException
{
int value = -1;
...
try
{
value = calculateTransform(a, b, c);
...
}
catch (SomeException se)
{
...
throw se;
}
finally
{
System.out.println("Result of someMethod()");
}
return value;
}Now, whenever an exception is thrown, it is guaranteed to be re-thrown outside the 'someMethod' method, just as suggested by the method signature.
This diagnostic is classified as:
|
You can look at examples of errors detected by the V6051 diagnostic. |
V6052. Calling an overridden method in parent-class constructor may lead to use of uninitialized data.
The analyzer has detected a parent-class constructor that uses a method overridden in the derived class. As a result, the overridden method can be used by uninitialized class fields.
This behavior occurs when you fail to follow the class initialization procedure stated in JLS [12.5].
Consider the following example:
public class Parent {
private String parentStr = "Black";
public Parent () {
printInfo();
}
public void printInfo () {
System.out.println("Parent::printInfo");
System.out.println("parentStr: " + parentStr);
System.out.println("-----------------");
}
....
}
public class Child extends Parent {
private int childInt;
private String childStr;
public Child() {
super();
this.childInt = 25;
this.childStr = "White";
}
public void printInfo () {
super.printInfo();
System.out.println("Child::printInfo");
System.out.println("childInt: "+childInt+";childStr: "+childStr);
System.out.println("-----------------");
}
....
}If we execute the following line:
Child obj = new Child();the program will print:
Parent::printInfo
parentStr: Black
-----------------
Child::printInfo
childInt: 0 ; childStr: null
-----------------As seen from this fragment, the overridden method 'printInfo' was called in the parent-class constructor of the 'Parent' class, while the derived 'Child' class was not fully initialized – hence the default values, rather than user-specified values, of the 'childInt' and 'childStr' fields.
The conclusion is this: make sure your parent-class constructors do not use methods that could be overridden in child classes. And if you do use a class method in a constructor, declare it final or private.
This diagnostic is classified as:
|
V6053. Collection is modified while iteration is in progress. ConcurrentModificationException may occur.
The analyzer has detected a collection that gets modified while being iterated, although it was not designed for concurrent modification. This may raise a 'ConcurrentModificationException'.
Consider several examples of faulty code.
Example 1:
List<Integer> mylist = new ArrayList<>();
....
for (Integer i : mylist)
{
if (cond)
{
mylist.add(i * 2);
}
}Example 2:
List<Integer> myList = new ArrayList<>();
....
Iterator iter = myList.iterator();
while (iter.hasNext())
{
if (cond)
{
Integer i = (Integer) iter.next();
myList.add(i * 2);
}
}Example 3:
Set<Integer> mySet = new HashSet<>();
....
mySet.stream().forEach(i -> mySet.add(i * 2));However, the analyser will keep silent if a collection permits concurrent modification:
List<Integer> mylist = new CopyOnWriteArrayList<>();
....
for (Integer i : mylist)
{
if (cond)
{
mylist.add(i + 1);
}
}It will also keep silent if the loop terminates immediately after the collection is modified:
List<Integer> mylist = new ArrayList<>();
....
for (Integer i : mylist)
{
if (cond)
{
mylist.add(i + 1);
break;
}
}This diagnostic is classified as:
|
You can look at examples of errors detected by the V6053 diagnostic. |
V6054. Classes should not be compared by their name.
The analyzer has detected class comparison by name. Such comparison is considered incorrect since, as stated by the JVM specification, classes have unique names only inside a package.
In addition to logical errors, such code may sometimes get exposed to various vulnerabilities due to unknown behavior of an untrusted class.
Consider the following example:
if (obj.getClass().getSimpleName().equals("Plane"))
{
....
}This code should be rewritten as follows:
if(obj.getClass().equals(ArrayList.class))
{
....
}or:
if (obj instanceof Plane)
{
....
}or:
if (obj.getClass().isAssignableFrom(Plane.class))
{
....
}This diagnostic is classified as:
|
V6055. Expression inside assert statement can change object's state.
The analyzer has detected a problem where an 'assert' statement contains a method modifying an object's state. How exactly such methods are called depends on the settings of the Java Virtual Machine, which means the program's behavior may differ from what is expected.
Consider the following example:
void someFunction(List<String> listTokens)
{
....
assert "<:>".equals(listTokens.remove(0));
....
}What we are interested in here is the call 'listTokens.remove(0)'. This method removes the first element in 'listTokens' and thus modifies the collection. The removed string is then returned to be compared with some expected string. The problem is that if assertions are disabled for the project, the expression will not be evaluated and, therefore, the first element of the collection will not be removed, which may affect the program's subsequent behavior.
To avoid such situations, make sure your assert statements do not contain calls to functions that change objects' contents.
This is what the fixed version looks like:
void someFunction(List<String> listTokens)
{
....
boolean isFirstStr = "<:>".equals(listTokens.remove(0));
assert isFirstStr;
....
}This diagnostic is classified as:
|
V6056. Implementation of 'compareTo' overloads the method from a base class. Possibly, an override was intended.
The analyzer has detected a situation where the 'compareTo' method of a parent class, which implements the 'Comparable<T>' interface, is overloaded in the child class. However, it is very unlikely that the programmer really meant to overload the parent class's method.
This is an example of a class that does method overloading rather than overriding:
public class Human implements Comparable<Human>
{
private String mName;
private int mAge;
....
Human(String name, int age)
{
mName = name;
mAge = age;
}
....
public int compareTo(Human human)
{
int result = this.mName.compareTo(human.mName);
if (result == 0)
{
result = Integer.compare(this.mAge, human.mAge);
}
return result;
}
}
public class Employee extends Human
{
int mSalary;
....
public Employee(String name, int age, int salary) {
super(name, age);
mSalary = salary;
}
....
public int compareTo(Employee employee)
{
return Integer.compare(this.mSalary, employee.mSalary);
}
}So, we have two classes: the base class 'Human' and derived class 'Employee'. 'Human' implements the 'Comparable<Human>' interface and defines the 'compareTo' method. The derived class 'Employee' extends the base class and overloads the 'compareTo' method. The comparison method returns one of the following results:
- negative value if the current object is less than the passed one;
- 0 if objects are equal;
- positive value if the current object is greater than the passed one;
The implications may be as follows:
1) If we create 'Employee' objects using a reference to the base class and then call to the 'compareTo' method, the objects will not be compared properly:
Human emp1 = new Employee("Andrew", 25, 33000);
Human emp2 = new Employee("Madeline", 29, 31000);
System.out.println(emp1.compareTo(emp2));What will be printed is the value -12, which suggests that the emp1 object is logically less than emp2. But that is not so. The programmer must have really intended to compare the objects' 'mSalary' fields, which would produce just an opposite result. This bug occurred because the programmer had overloaded the comparison method rather than overriding it, so when it was called, it was called from the 'Human' class.
2) As you know, lists of elements implementing the 'Comparable<T>' interface can be automatically sorted using 'Collections.sort'/'Arrays.sort', and such elements can be used as keys in sorted collections, without the need to specify a comparator. With such method overloading, the sort will be performed in a way different from what the programmer intended and defined in the derived class. The dangerous thing about this is that in such cases, the comparison method is called implicitly, which makes the bug very difficult to find.
Let's run the following code:
List<Human> listEmployees = new ArrayList<>();
listEmployees.add(new Employee("Andrew", 25, 33000));
listEmployees.add(new Employee("Madeline", 29, 31000));
listEmployees.add(new Employee("Hailey", 45, 55000));
System.out.println("Before: ");
listEmployees.forEach(System.out::println);
Collections.sort(listEmployees);
System.out.println("After: ");
listEmployees.forEach(System.out::println);The program will print the following:
Before:
Name: Andrew; Age: 25; Salary: 33000
Name: Madeline; Age: 29; Salary: 31000
Name: Hailey; Age: 45; Salary: 55000
After:
Name: Andrew; Age: 25; Salary: 33000
Name: Hailey; Age: 45; Salary: 55000
Name: Madeline; Age: 29; Salary: 31000As you can see, the list is sorted by a different field, not 'mSalary'. The reason is just the same.
To fix this problem, we need to make sure that the comparison method is overridden, not overloaded:
public class Employee extends Human
{
....
public int compareTo(Human employee)
{
if (employee instanceof Employee)
{
return Integer.compare(this.mSalary,
((Employee)employee).mSalary);
}
return -1;
}
....
}The code will now work just as expected.
In the first case, the program will produce the value 1 (emp1 is logically greater than emp2).
In the second case, it will print the following:
Name: Andrew; Age: 25; Salary: 33000
Name: Madeline; Age: 29; Salary: 31000
Name: Hailey; Age: 45; Salary: 55000
After:
Name: Madeline; Age: 29; Salary: 31000
Name: Andrew; Age: 25; Salary: 33000
Name: Hailey; Age: 45; Salary: 55000V6057. Consider inspecting this expression. The expression is excessive or contains a misprint.
The analyzer has detected a redundant comparison that could be a potential bug.
Consider the following simple example:
if (arr[42] == 10 && arr[42] != 3)This condition will be true if 'Aa[42] == 10'. The second part of the expression is pointless. It means that one of the two scenarios takes place here:
1) The expression can be simplified. Fixed code:
if (arr[42] == 10)2) The expression is incorrect. Fixed code:
if (arr[42] == 10 && arr[43] != 3)Here is another example with a suspicious condition:
if ((3 < value) && (value > 10))The condition will be true only when 'value > 10'. This will most likely mean an error, and the programmer must have actually expected 'value' to fall into the range (3;10):
if ((3 < value) && (value < 10))The following article discusses this type of issues in detail and offers a few tips on how to avoid them: "Logical Expressions in C/C++. Mistakes Made by Professionals".
This diagnostic is classified as:
|
V6058. Comparing objects of incompatible types.
The analyzer has detected a potential error that has to do with calling a comparison function on objects of incompatible types. This warning is triggered by such functions as equals, assertEquals, assertArrayEquals, etc.
The following examples demonstrate incorrect use of comparison functions:
Example 1:
String param1 = ...;
Integer param2 = ...;
...
if (param1.equals(param2))
{...}Example 2:
List<String> list = Arrays.asList("1", "2", "3");
Set<String> set = new HashSet<>(list);
if (list.equals(set))
{...}In both examples, objects of incompatible types are compared. The comparison will always evaluate to 'false' as the implementations of 'equals' check if the type of the specified object corresponds to that of the current object.
String:
public boolean equals(Object anObject)
{
...
if (anObject instanceof String)
{
...
}
return false;
}List:
public boolean equals(Object o)
{
...
if (!(o instanceof List))
return false;
...
}If you get a V6058 warning on your code, you are very likely to have a mistake in it and you should compare some other objects.
Example 1:
...
String param1 = ...;
String param3 = ...;
...
if (param1.equals(param3))
{...}Example 2:
...
List<String> list = Arrays.asList("1", "2", "3");
List<String> list2 = ...;
...
if (list.equals(list2))
{...}This diagnostic is classified as:
You can look at examples of errors detected by the V6058 diagnostic. |
V6059. Odd use of special character in regular expression. Possibly, it was intended to be escaped.
The analyzer has detected a strange regular expression, the use of which leads to a result different from what the programmer expects.
Consider the following example:
String[] arr = "Hot. Cool. Yours".split(".");After executing this line, the array will be lacking the expected elements {"Hot", " Cool", " Yours"}. Instead, it will be an empty array. This has to do with the fact that the dot is a special character in a regular expression and has its own purpose. To make a dot a separator in your string, use it as follows:
String[] arr = "Hot. Cool. Yours".split("\\.");The analyzer will also warn you if your regular expression consists only of these characters:
- "|"
- "^"
- "$"
This diagnostic is classified as:
V6060. The reference was used before it was verified against null.
The analyzer has detected a potential error that could result in using a null object.
What the analyzer detects is the situation where the object is used first and only then checked for the value 'null'. This means one of the two things:
1) If the object equals 'null', an error will occur.
2) The program executes correctly all the time since the object never equals 'null'. Therefore, the check is redundant.
Consider the following code snippet triggering the warning:
boolean isSomething(String str)
{
String prepareStr = prepare(str);
if (prepareStr.contains("*?*"))
{
...
}
...
return prepareStr == null ? false : prepareStr.contains("?*?");
}So, is it a potential bug or redundant comparison in the code above? The 'prepareStr' variable participates in some calculations first and is checked for 'null' at the end. Both situations might take place here. And if the 'prepare' method can return 'null', you must modify the code:
boolean isSomething(String str)
{
String prepareStr = prepare(str);
if (prepareStr == null) {
return false;
}
if (prepareStr.contains("*?*"))
{
//...
}
//...
return prepareStr.contains("?*?");
}If 'prepare' does not return 'null', you can simply remove the check to make it easier for your fellow programmers.
This diagnostic is classified as:
You can look at examples of errors detected by the V6060 diagnostic. |
V6061. The used constant value is represented by an octal form.
The analyzer has detected a suspicious constant in octal form. This warning is output if there are no other octal constants nearby. Such "lone" octal constants are often errors.
Using octal constants is not a mistake in itself. They are a convenient tool for bit manipulation and are used in code that deals with networks or external devices. However, an average programmer does not use this notation often and may forget that adding a 0 before a decimal number turns that number into an octal one.
Consider the following example:
void compute(int red, int blue, int green)
{
int color = 2220 * red +
7067 * blue +
0713 * green;
// ...
}The error is not easy to notice in code like that, but it is still there. Here, the last constant "0713" is written in octal form and its actual value is 459, not 713. Fixed code:
void compute(int red, int blue, int green)
{
int color = 2220 * red +
7067 * blue +
713 * green;
// ...
}As mentioned earlier, this warning is triggered only by "lone" octal constants, with no other such constants nearby. For that reason, the analyzer considers the following code safe and keeps silent:
short bytebit[] = {01, 02, 04, 010, 020, 040, 0100, 0200 };This diagnostic is classified as:
|
V6062. Possible infinite recursion.
The analyzer has detected a possible case of infinite recursion. It is very likely to result in a stack overflow and throwing a 'StackOverflow' exception.
Let's consider the example from the real project which resulted in such a situation:
@Override
public void glGenTextures(IntBuffer textures) {
gl.glGenTextures(textures);
checkError();
}
@Override
public void glGenQueries(int num, IntBuffer ids) {
glGenQueries(num, ids); // <=
checkError();
}A developer made a typo and called the wrong method, which became the reason of infinite recursion occurrence. The method 'glGenQueries' had to be called from the 'gl' object in the way it is usually done in other functions.
Fixed example:
@Override
public void glGenTextures(IntBuffer textures) {
gl.glGenTextures(textures);
checkError();
}
@Override
public void glGenQueries(int num, IntBuffer ids) {
gl.glGenQueries(num, ids);
checkError();
}This diagnostic is classified as:
You can look at examples of errors detected by the V6062 diagnostic. |
V6063. Odd semicolon ';' after 'if/for/while' operator.
The analyzer has detected a potential defect that has to do with a semicolon ';' after an 'if', 'for' or 'while' statement.
Consider the following example:
int someMethod(int value, int a, int b, int c, ...)
{
int res = -1;
....
if (value > (a - b)/c);
{
....
res = calculate(value);
}
....
return res;
}Fixed code:
int someMethod(int value, int a, int b, int c, ...)
{
int res = -1;
....
if (value > (a - b)/c)
{
....
res = calculate(value);
}
....
return res;
}This diagnostic is classified as:
|
V6064. Suspicious invocation of Thread.run().
The analyzer has detected a suspicious direct call of Thread.run(). Invoking a thread in a way like that may be confusing. When calling the run() method of the Thread object directly, all operations contained in the body of run() will be executed in the current thread rather than the newly created one.
Consider the following example:
private class Foo implements Runnable
{
@Override
public void run() {/*...*/}
}
....
Foo foo = new Foo();
new Thread(foo).run();
....In this code, the body of the run() method will be executed in the current thread. Does the programmer really expect this? To have the body of the run() method execute in the new thread, use the start() method.
Fixed code:
private class Foo implements Runnable
{
@Override
public void run() {/*...*/}
}
....
Foo foo = new Foo();
new Thread(foo).start();
....This diagnostic is classified as:
|
V6065. A non-serializable class should not be serialized.
The analyzer has detected serialization of an object that lacks the implementation of the 'java.io.Serializable' interface. For correct serialization and deserialization of an object, make sure its class has this interface implemented.
Consider the following example:
class Dog
{
String breed;
String name;
Integer age;
....
}
....
Dog dog = new Dog();
....
ObjectOutputStream oos = new ObjectOutputStream(fos);
oos.writeObject(dog);
....If it comes to serializing the 'dog' object, a 'java.io.NotSerializableException' will be thrown. To ensure correct execution of this code, the 'java.io.Serializable' interface needs to be implemented in the 'Dog' class.
Fixed code:
class Dog implements Serializable
{
String breed;
String name;
Integer age;
....
}
....
Dog dog = new Dog();
....
ObjectOutputStream oos = new ObjectOutputStream(fos);
oos.writeObject(dog);
....V6066. Passing objects of incompatible types to the method of collection.
The analyzer has detected a potential error that has to do with calling a collection method on an object whose type is different from that of the collection. This warning is triggered by such functions as remove, contains, removeAll, containsAll, retainAll, etc.
Consider the following example of incorrect use of the 'remove' method:
List<String> list = ...;
Integer index = ...;
...
list.remove(index);The programmer intended to remove an object from the list by index, but they did not take into account that the index is an object of type 'Integer' rather than a primitive integer type. What will be called is an overloaded 'remove' method expecting an object, not an 'int'. Objects of types 'Integer' and 'String' are incompatible, so using the method as shown above will cause an error.
If the type of the "index" variable cannot be changed for some reason, the code can be fixed as follows:
List<String> list = ...;
Integer index = ...;
...
list.remove(index.intValue());This diagnostic is classified as:
|
You can look at examples of errors detected by the V6066 diagnostic. |
V6067. Two or more case-branches perform the same actions.
The analyzer has detected a situation where different case labels of a switch statement contain the same code. Those are often redundant code, which could be improved by merging the labels. On the other hand, identical code fragments may also result from the use of the copy-paste technique, in which case they are errors rather than simply redundant code.
Consider the following example of redundant code:
public static String getSymmetricCipherName(SymmetricKeyAlgorithmTags tag)
{
switch (tag)
{
case DES:
return "DES";
case AES_128:
return "AES";
case AES_192:
return "AES";
case AES_256:
return "AES";
case CAMELLIA_128:
return "Camellia";
case CAMELLIA_192:
return "Camellia";
case CAMELLIA_256:
return "Camellia";
case TWOFISH:
return "Twofish";
default:
throw new IllegalArgumentException("....");
}
}In real projects there are cases when it is needed to perform equal actions. In order to make the code more readable, one can write the code more densely:
public static String getSymmetricCipherName(SymmetricKeyAlgorithmTags tag)
{
switch (tag)
{
case DES:
return "DES";
case AES_128:
case AES_192:
case AES_256:
return "AES";
case CAMELLIA_128:
case CAMELLIA_192:
case CAMELLIA_256:
return "Camellia";
case TWOFISH:
return "Twofish";
default:
throw new IllegalArgumentException("....");
}
}The next example is taken from a real application and demonstrates faulty behavior resulting from a typo:
protected boolean condition(Actor actor) throws ....
{
....
if (fieldValue instanceof Number)
{
....
switch (tokens[2])
{
case "=":
case "==":
passing = (Double) fieldValue
==
Double.parseDouble(secondValue);
break;
case "!":
case "!=":
passing = (Double) fieldValue
==
Double.parseDouble(secondValue);
break;
case "<=":
passing = ((Number) fieldValue).doubleValue()
<=
Double.parseDouble(secondValue);
break;
....
}
....
}
....
}There is a typo in the code of the marks '!' and '!=' which apparently occurred due to copy-paste. After viewing other case branches, we can conclude that the comparison operator '!=' had to be used instead of '=='.
Fixed code:
protected boolean condition(Actor actor) throws ....
{
....
if (fieldValue instanceof Number)
{
....
switch (tokens[2])
{
case "=":
case "==":
passing = (Double) fieldValue
==
Double.parseDouble(secondValue);
break;
case "!":
case "!=":
passing = (Double) fieldValue
!=
Double.parseDouble(secondValue);
break;
case "<=":
passing = ((Number) fieldValue).doubleValue()
<=
Double.parseDouble(secondValue);
break;
....
}
....
}
....
}This diagnostic is classified as:
You can look at examples of errors detected by the V6067 diagnostic. |
V6068. Suspicious use of BigDecimal class.
The analyzer has found that the BigDecimal class is being used in a way that may lead to unexpected behavior.
This warning is output in the following cases:
1. When the constructor is called on a floating-point value.
Example of non-compliant code:
BigDecimal bigDecimal = new BigDecimal(0.6);The documentation covers some aspects of using the constructor this way.
Without going into much detail, an object created in a way like that will have the value 0.59999999999999997779553950749686919152736663818359375 rather than 0,6. This has to do with the fact that floating-point numbers cannot be represented with perfect precision.
The BigDecimal class, however, is primarily used in high-precision calculations. For example, there is precision-critical software that human lives depend on (such as software for airplanes, rockets, or medical equipment). In such software, error even in the 30th decimal digit can be catastrophic.
To avoid that, use one of the following techniques to create BigDecimal objects:
BigDecimal bigDecimal1 = BigDecimal.valueOf(0.6);
BigDecimal bigDecimal2 = new BigDecimal("0.6");2. When the 'equals' method is called whereas the programmer must have intended 'compareTo'.
It is generally assumed that objects should be compared using the 'equals' methods. And this cannot be argued!
When working with an object of the BigDecimal class, the programmer may view it as simply working with an object that could contain a very big real number. So when calling the 'equals' method, they assume that the values under comparison are equivalent.
In that case, the following code may surprise them:
BigDecimal bigDecimal1 = BigDecimal.valueOf(0.6);
BigDecimal bigDecimal2 = BigDecimal.valueOf(0.60);
....
if (bigDecimal1.equals(bigDecimal2)) // false
{
// code
}The trick is that when using the 'equals' method, it is not only the value itself that participates in the comparison but also the number of its significant decimal digits. This is something that the developer may not expect. To compare values without taking their significant decimal digits into consideration, use the 'compareTo' method:
BigDecimal bigDecimal1 = BigDecimal.valueOf(0.6);
BigDecimal bigDecimal2 = BigDecimal.valueOf(0.60);
....
if (bigDecimal1.compareTo(bigDecimal2) == 0) // true
{
// code
}This diagnostic is classified as:
|
V6069. Unsigned right shift assignment of negative 'byte' / 'short' value.
The analyzer has detected an unsigned right shift assignment operation (>>>=) applied to a potentially negative value of type 'byte' or 'short'. Such a shift may lead to unpredictable results.
When right-shifting a value, you often want to avoid promotion of the sign bit and have the vacant bits on the left padded with 0's, no matter the sign of the most significant bit. This is what the unsigned bitwise right shift operator, >>>, is used for.
The shift can also be combined with the assignment operator (>>>=), but the program's behavior may be non-obvious when using such a compound operator with the type 'byte' or 'short'. This has to do with the fact that values of these types will be first implicitly cast to 'int' and right-shifted, and then they will get truncated when casting back to the original type.
If you try compiling the following code sample:
void test(byte byteValue, boolean isFlag)
{
....
if (isFlag)
{
byteValue = byteValue >>> 5;
}
....
}you will get this error:
error: incompatible types:
possible lossy conversion from int to byte
byteValue = byteValue >>> 5;
^It proves what was said above about type promotion to 'int', and the compiler will not allow casting 'int' to 'byte' unless it is done explicitly. It means that you know what you are doing. If you compile the same snippet after changing it slightly:
....
byteValue >>>= 5;
....it will compile well. When executing this code, the value will be promoted, shifted, and then demoted back to the original type.
Because of that, such shift assignment operations involve behavior that the developer might not expect. When applying such an operation to a positive number, the code will be working as expected. But what about negative numbers?
The following contrived example demonstrates what happens when using a right shift assignment with the value -1 of type 'byte':
byte byteValue = -1; // 0xFF or 0b1111_1111
byteValue >>>= 4;
assertTrue(byteValue == 0x0F); // byteValue == 0b0000_1111Since the value is 8 bits (i.e. one byte) long, the developer expects to have only the 4 least significant bits left as a result of the unsigned right shift by 4 bits. However, to their surprise, 'assertTrue' fails!
This happens because 'byteValue' is implicitly promoted to 'int', shifted, and truncated back to 'byte':
byteValue == 0xFF (byte): 11111111
Promotion to 'int' : 11111111 11111111 11111111 11111111
Shift by 4 : 00001111 11111111 11111111 11111111
Casting to 'byte' : 11111111It may seem as if the unsigned shift (>>>=) does not work properly. But it is actually consistent and logical. It is just that there is this subtle detail, which you have to keep in mind when working with values of type 'byte' or 'short'.
V6070. Unsafe synchronization on an object.
The analyzer has detected synchronization on an object that can lead to hidden concurrency issues because the synchronized object may be used implicitly in other logically unrelated parts of the program.
The problem is that if you synchronize on:
- 'this';
- objects of integer wrapper classes (Byte, Short, Integer, Long),
- a Boolean object,
- a String object,
it may result in potential deadlocks and nondeterministic behavior.
This may happen because such objects can be reused in different parts of the program.
The essence of the problem with synchronization by the given objects is that the object used for locking is shared. Such an object can be used for locking in another place without the knowledge of the developer who used the object for locking for the first time. This, in turns, leaves open the likelihood of a deadlock on the same object.
Let's consider a synthetic example of a deadlock when synchronizing by 'this':
class SynchroThis
{
void doSmt()
{
synchronized(this)
{
// do smt
}
}
}
....
SynchroThis obj = new SynchroThis();
synchronized(obj)
{
Thread t = new Thread(() -> obj.doSmt());
t.start();
t.join();
}
....As a result, the program will never terminate, as a deadlock is occurring by the instance of the SynchroThis class (first deadlock in the main thread by 'obj', the second - in a 't' thread by 'this').
To avoid possible deadlocks, you should use, for example, a private field as an object of locking:
class A
{
private final Object lock = new Object();
void foo()
{
synchronized(lock)
{
// do smt
}
}
}Let's consider a synthetic example of synchronization by an object of the Byte type:
class FirstClass
{
private final Byte idLock;
....
public FirstClass(Byte id, ....)
{
idLock = id;
....
}
....
public void calculateFromFirst(....)
{
synchronized (idLock) // <=
{
....
}
}
}
class SecondClass
{
private final Byte idLock;
....
public SecondClass(Byte id, ....)
{
idLock = id;
....
}
....
public void calculateFromSecond(....)
{
synchronized (idLock) // <=
{
....
}
}
}Suppose that Thread N1 works with an object of class 'FirstClass' and Thread N2, with an object of class 'SecondClass'.
Now consider the following scenario:
- The field 'idLock' of the object of class 'FirstClass' has the value 100, and the same is true for the object of class 'SecondClass';
- Thread N1 starts to execute the 'calculateFromFirst' method and keeps running for some time;
- Thread N2 starts (immediately afterward) to execute the 'calculateFromSecond' method.
So, we have two different threads executing completely different logic for different objects. What do we get as a result? Thread N2 will be waiting for Thread N1 to finish executing in the synchronized block on the object 'idLock'. Why does it happen?
Like every object, variables created using wrapper classes will be stored in the heap. Each such object will have its own address in the heap. But there is one tricky detail that must be always taken into account. Integer wrapper classes created using autoboxing with the value within the range [-128..127] are cached by the JVM. That is why such wrappers with identical values within that range will be in fact references to the same object.
This is what has happened in our example. The synchronization is done on the same object in memory, which is an absolutely unexpected behavior.
Besides integer wrapper classes, you should also avoid synchronizing on objects of the following classes:
- Boolean;
- String (as synchronization may happen to occur on the string stored in the string pool).
Synchronizing on such objects is unsafe. It's recommended to use the above method with a private field. But if for any reason it doesn't suit you, you should explicitly create objects using a constructor. This guarantees that the objects will have different addresses. Here is an example of safe code:
class FirstClass
{
private final Byte idLock;
....
public FirstClass(Byte id, ....)
{
idLock = new Byte(id);
....
}
....
public void calculateFromFirst(....)
{
synchronized (idLock)
{
....
}
}
}
....More information here.
This diagnostic is classified as:
|
V6071. This file is marked with copyleft license, which requires you to open the derived source code.
The analyzer has detected a file marked with a copyleft license, which requires you to open the rest of the source code. This may be unacceptable for many commercial projects.
If you develop an open-source project, you can simply ignore this warning and turn it off.
Here is an example of a comment that will cause the analyzer to issue the warning:
/* This program is free software: you can redistribute it and/or modify
* it under the terms of the GNU General Public License as published by
* the Free Software Foundation, either version 3 of the License, or
* (at your option) any later version.
*
* This program is distributed in the hope that it will be useful,
* but WITHOUT ANY WARRANTY; without even the implied warranty of
* MERCHANTABILITY or FITNESS FOR A PARTICULAR PURPOSE. See the
* GNU General Public License for more details.
*
* You should have received a copy of the GNU General Public License
* along with this program. If not, see <https://www.gnu.org/licenses/>.
*/For proprietary projects
If you include a file with this type of license (GPL3 in this case) into a proprietary project, you will be required to open the rest of your source code due to the specifics of this license.
Such copyleft licenses are called "viral license" because of their tendency to affect other project files. The problem is that using at least one such file in a proprietary project automatically renders the entire source code open and compels you to distribute it along with the binary files.
This diagnostic detects the following viral licenses:
- AGPL-3.0
- GPL-2.0
- GPL-3.0
- LGPL-3.0
If you discover that your proprietary project uses files with a copyleft license, you have one of the following options:
- Exclude this code (library) from your project;
- Replace the library;
- Make your project open-source.
For open-source projects
We understand that this diagnostic is irrelevant to open-source projects. The PVS-Studio team contributes to the development of open-source software by helping to fix bugs found in such software and offering free license options to open-source developers. However, our product is a B2B solution, so this diagnostic is enabled by default.
If your code is distributed under one of the copyleft licenses from the list above, you can turn this diagnostic off in one of the following ways:
- in the plugin for IntelliJ IDEA remove the tick from Settings > PVS-Studio > Warnings > V6071;
- in the plugin for Gradle add the section disabledWarnings = ["V6071"];
- in the plugin Maven add the section <disabledWarnings>V6071</disabledWarnings>;
- parameter --disable V6071 when running pvs-studio.jar manually.
Adding to the list of unsafe licenses
If you know of some other types of viral licenses that our tool does not yet detect, you can inform us about them using the feedback form so that we could add detection of those in the next release.
References
- GNU General Public License
- Viral license
- Ways to Get a Free PVS-Studio License
- Suppression of false alarms
V6072. Two similar code fragments were found. Perhaps, this is a typo and 'X' variable should be used instead of 'Y'.
The analyzer detected a code fragment probably containing a typo. It is very likely that this code was written by using the Copy-Paste technique.
The V6072 diagnostic looks for two adjacent code blocks similar in structure and different in one variable, which is used several times in the first block but only once in the second. This discrepancy suggests that the programmer forgot to change that variable to the proper one. The diagnostic is designed to detect situations where a code block is copied to make another block and the programmer forgets to change the names of some of the variables in the resulting block.
Consider the following example:
if (x > 0)
{
Do1(x);
Do2(x);
}
if (y > 0)
{
Do1(y);
Do2(x); // <=
}In the second block, the programmer must have intended to use variable 'y', not 'x':
if (x > 0)
{
Do1(x);
Do2(x);
}
if (y > 0)
{
Do1(y);
Do2(y);
}The following example is more complex.
....
if(erendlinen>239) erendlinen=239;
if(srendlinen>erendlinen) srendlinen=erendlinen;
if(erendlinep>239) erendlinep=239;
if(srendlinep>erendlinen) srendlinep=erendlinep; // <=
....The defect in this example is not that easy to see. The variables have similar names, which makes it much more difficult to diagnose the error. In the second block, variable 'erendlinep' should be used instead of 'erendlinen'.
This is what the fixed code should look like:
....
if(erendlinen>239) erendlinen=239;
if(srendlinen>erendlinen) srendlinen=erendlinen;
if(erendlinep>239) erendlinep=239;
if(srendlinep>erendlinep) srendlinep=erendlinep; // <=
....Obviously, 'erendlinen' and 'erendlinep' are poorly chosen variable names. An error like that is almost impossible to catch when carrying out code review. Even with the analyzer pointing at it directly, it is still not easy to notice. Therefore, take your time and make sure to examine the code closely when encountering a V6072 warning.
This diagnostic is classified as:
You can look at examples of errors detected by the V6072 diagnostic. |
V6073. It is not recommended to return null or throw exceptions from 'toString' / 'clone' methods.
The analyzer has detected an overridden 'toString' or 'clone' method that can return a 'null' value or throw an exception.
The 'toString' / 'clone' method must always return a string / object respectively. Returning an invalid value contradicts the method's implicit contract.
The following example demonstrates incorrect overriding of the 'toString' method:
@Override
public String toString()
{
return null;
}The developer who would be using or maintaining the program in the future is likely to call this method to get the textual representation of the object. Since they are unlikely to check the return result for null, using it may lead to throwing a 'NullPointerException'. If you want the method to return an empty or unknown value as the object's textual representation, it is recommended to use an empty string:
@Override
public String toString()
{
return "";
}Throwing an exception is another bad practice when implementing the 'toString' method. This is demonstrated by the following synthetic example:
@Override
public String toString()
{
if(hasError)
{
throw new IllegalStateException("toString() method error encountered");
}
....
}The user of the class is very likely to call this method at a point where no exception throwing and handling is provided for.
If you want an error message to appear when generating an object's textual representation, either return the message text as a string or log the error:
....
@Override
public String toString()
{
if(hasError)
{
logger.warn("toString() method error encountered");
return "Error encountered";
}
....
}All said above holds true for the 'clone' method. When calling it, you count only on one of the two possible outcomes:
- if the copy operation is not supported for this instance, you expect a 'CloneNotSupportedExcexption';
- if copying is possible, the method is guaranteed to create and return a correct copy of the object.
But you never expect either of the following options:
- throwing an unexpected exception;
- getting null instead of the correct copy.
This diagnostic is classified as:
|
V6074. Non-atomic modification of volatile variable.
The analyzer has detected a non-atomic modification of a 'volatile' variable, which may result in a race condition.
As you know, the use of 'volatile' guarantees that the actual value of the marked variable will be known to each thread. It is also important to mention that the 'volatile' modifier is used to tell the JVM that every assignment to this variable and every read from it must be atomic.
One may assume that marking variables as 'volatile' should be enough to use them safely in a multithreaded application, but what about operations modifying a 'volatile' variable whose future value depends on the current one?
Such operations are as follows:
- var++, --var, ...
- var += smt, var *= smt, ...
- ...
The following example demonstrates using a 'volatile' variable as a counter (counter++).
class Counter
{
private volatile int counter = 0;
....
public void increment()
{
counter++; // counter = counter + 1
}
....
}This increment operation looks like a single operation, but in reality it is a sequence of read-modify-write operations. This is where the race condition stems from.
Suppose we have two threads simultaneously handling an object of class Counter and incrementing the 'counter' variable (10):
[counter == 10, temp == 10] Thread N1 reads the value of 'counter' into a temporary variable.
[counter == 10, temp == 11] Thread N1 modifies the temporary variable.
[counter == 10, temp == 10] Thread N2 reads the value of 'counter' into a temporary variable.
[counter == 11, temp == 11] Thread N1 writes the value of the temporary variable into 'counter'.
[counter == 11, temp == 11] Thread N2 modifies the temporary variable.
[counter == 11, temp == 11] Thread N2 writes the value of the temporary variable into 'counter'.
We expected the 'counter' variable to have the resulting value 12 (not 11) since the two threads were incrementing the same variable. The threads could also increment the variable in turn, which is where we would get the expected result. The result of this operation may vary every time it is executed!
To avoid such behavior of atomic operations on shared variables, you can use the following techniques:
- A 'synchronized' block,
- Classes from the java.util.concurrent.atomic package,
- Locks from the java.util.concurrent.locks package
This is one version of how the example above could be fixed:
class Counter
{
private volatile int counter = 0;
....
public synchronized void increment()
{
counter++;
}
....
}Another version:
class Counter
{
private final AtomicInteger counter = new AtomicInteger(0);
....
public void increment()
{
counter.incrementAndGet();
}
....
}This diagnostic is classified as:
|
You can look at examples of errors detected by the V6074 diagnostic. |
V6075. The signature of method 'X' does not conform to serialization requirements.
The analyzer has detected a user serialization method that does not meet the interface's requirements. If the user serialization fails to meet the requirements, the Serialization API ignores it.
If default serialization behavior is insufficient for the user class, you can change it by implementing the following methods:
private void writeObject(java.io.ObjectOutputStream out)
throws IOException
private void readObject(java.io.ObjectInputStream in)
throws IOException, ClassNotFoundException;
private void readObjectNoData()
throws ObjectStreamException;
ANY-ACCESS-MODIFIER Object writeReplace()
throws ObjectStreamException;
ANY-ACCESS-MODIFIER Object readResolve()
throws ObjectStreamException;However, user implementations of these methods should strictly follow the requirements determined by their signatures; otherwise the default serialization will be preferred over the user serialization. This is explained in more detail here.
The problem is that 'java.io.Serializable' is an empty interface and is just a marker for the serialization mechanism. Therefore, when user-implemented logic is used, the compiler, for instance, cannot recognize incorrectly defined methods since they are just ordinary user methods.
Consider the following synthetic example, which you may well encounter in real-life software:
class Base implements Serializable
{
....
}
class Example extends Base
{
....
void writeObject(java.io.ObjectOutputStream out)
throws IOException
{
throw new NotSerializableException("Serialization is not supported!");
}
void readObject(java.io.ObjectInputStream in)
throws IOException, ClassNotFoundException
{
throw new NotSerializableException("Deserialization is not supported!");
}
}Suppose we had a serializable base class. Then we needed to create a derived class but no longer wished it to be serializable. We wrote the necessary stub methods and went on writing the code. But now we discover that our derived class – despite our wish – is still serializable! This happens because our methods do not meet the interface's requirements. This defect can be fixed by changing the default modifier to private:
class Base implements Serializable
{
....
}
class Example extends Base
{
....
private void writeObject(java.io.ObjectOutputStream out)
throws IOException
{
throw new NotSerializableException("Serialization is not supported!");
}
private void readObject(java.io.ObjectInputStream in)
throws IOException, ClassNotFoundException
{
throw new NotSerializableException("Deserialization is not supported!");
}
....
}This diagnostic is classified as:
|
V6076. Recurrent serialization will use cached object state from first serialization.
The analyzer has detected a situation where an object already written to the stream is getting modified and written again to the same stream. Because of the specifics of the 'java.io.ObjectOuputStream' class, the modified state of the object being serialized will be ignored in favor of the original state.
Objects are serialized by the 'java.io.ObjectOuputStream' class, which caches them when writing to the stream. It means that the same object will not be serialized twice: the class will serialize it the first time but only write a reference to the exact same original object to the stream the second time. This is what the problem is about. If we serialize an object, modify it, and then serialize it again, the 'java.io.ObjectOuputStream' class will not be aware of the changes made and treat the modified object as the same object that was serialized earlier.
This is demonstrated by the following contrived example, where an object is serialized after modification, with its modified state ignored:
ObjectOutputStream out = new ObjectOutputStream(....);
SerializedObject obj = new SerializedObject();
obj.state = 100;
out.writeObject(obj); // writing object with state = 100
obj.state = 200;
out.writeObject(obj); // writing object with state = 100 (vs expected 200)
out.close();There are two ways to avoid this behavior.
The simplest and most reliable solution is to create a new instance of the object and assign it a new state. For example:
ObjectOutputStream out = new ObjectOutputStream(....);
SerializedObject obj = new SerializedObject();
obj.state = 100;
out.writeObject(obj);
obj = new SerializedObject();
obj.state = 200;
out.writeObject(obj);
out.close();The second solution is less trivial. It is based on using the 'reset' method of the 'java.io.ObjectOuputStream' class. Use it only when you understand what exactly and why you are doing because the 'reset' method will reset the state of all the objects previously written to the stream. The following example demonstrates the use of this method:
ObjectOutputStream out = new ObjectOutputStream(....);
SerializedObject obj = new SerializedObject();
obj.state = 100;
out.writeObject(obj);
out.reset();
obj.state = 200;
out.writeObject(obj);
out.close();V6077. A suspicious label is present inside a switch(). It is possible that these are misprints and 'default:' label should be used instead.
The analyzer detected a potential error inside the switch operator. A label is used whose name is similar to 'default'. A misprint is probable.
Consider this sample:
int c = getValue();
double weightCoefficient = 0;
switch(c){
case 1:
weightCoefficient += 3 * (/*math formula #1*/);
case 2:
weightCoefficient += 7 * (/*math formula #2*/);
defalt:
weightCoefficient += 0.42;
}It seems that after the code's work is done, the value of the 'weightCoefficient' variable will be 0.42. Actually the 'weightCoefficient' variable will still equal zero. The point is that 'defalt' is a label, not the 'default' operator. This is the correct code:
int c = getValue();
double weightCoefficient = 0;
switch(c){
case 1:
weightCoefficient += 3 * (/*math formula #1*/);
case 2:
weightCoefficient += 7 * (/*math formula #2*/);
default:
weightCoefficient += 0.42;
}This diagnostic also triggers when the label name starts with 'case'. It's likely that the space symbol is absent. For example, 'case 1:' has to be written instead of 'case1:'.
This diagnostic is classified as:
|
V6078. Potential Java SE API compatibility issue.
This diagnostic rule detects Java SE APIs that will be removed or marked as deprecated in newer Java SE versions.
New Java SE versions are usually backward-compatible with the earlier versions. That is, an application developed on Java SE 8 should run without problems on Java SE 11. However, small compatibility issues between Java SE versions are still possible. They can be caused by changes to some of the APIs: methods or classes may get removed or deprecated, or their behavior may change, and so on.
If your company's policy about addressing compiler warnings is strict, you can solve some of the problems right away. For example, you could stop using a method or a class marked as deprecated, because such methods or classes are likely to cause your application to behave differently or even crash when moving to a new Java version.
The JDK also includes a tool called 'jdeps', which can help trace your application's dependencies on the JDK's internal APIs. But developers will typically run this tool only when they are about to port the application to a new Java version, while a wiser approach is to start thinking about this at the coding stage, and avoid dependencies on an API that is expected to be removed in the future Java SE releases.
The V6078 diagnostic will warn you beforehand if your code depends on certain functions and classes of Java SE APIs that you may have problems with in the newer Java versions. For instance, you will face such issues when your application is reported to be crashing on a user's machine after updating to a fresher Java version. Besides, it is highly likely that sooner or later you will need to clean up your code base from outdated APIs, so it better to perform such a cleaning on a regular basis instead of increasing your technical dept for the future.
The warning is issued in the following cases:
- A method/class/package has been removed in the target Java version;
- A method/class/package has been marked as deprecated in the target Java version;
- A method's signature has changed.
The rule currently supports compatibility analysis for Oracle Java SE 8 through 14. The V6078 rule is disabled by default. To enable the rule, you will need to activate and configure it.
IntellJ IDEA
When working in the IntelliJ IDEA plugin, you can enable the rule and configure it at the 'Settings > PVS-Studio > API Compatibility Issue Detection' tab in the settings:
- Source Java SE is the Java version that your application is based on
- Target Java SE is the Java version that you want to check the compatibility of APIs used in your application (Source Java SE) against
- Exclude packages are the packages you want to exclude from the compatibility analysis (packages are comma-separated)

Gradle
When working from the Gradle plugin, you need to configure the analyzer's settings in build.gardle:
apply plugin: com.pvsstudio.PvsStudioGradlePlugin
pvsstudio {
....
compatibility = true
sourceJava = /*version*/
targetJava = /*version*/
excludePackages = [/*pack1, pack2, ...*/]
}Maven
When working from the Maven plugin, you need to configure the analyzer's settings in pom.xml:
<build>
<plugins>
<plugin>
<groupId>com.pvsstudio</groupId>
<artifactId>pvsstudio-maven-plugin</artifactId>
....
<configuration>
<analyzer>
....
<compatibility>true</compatibility>
<sourceJava>/*version*/</sourceJava>
<targetJava>/*version*/</targetJava>
<excludePackages>/*pack1, pack2, ...*/</excludePackages>
</analyzer>
</configuration>
</plugin>
</plugins>
</build>Running the analyzer core directly
If you run the analyzer directly from the command line, use the following parameters to activate the compatibility analysis of selected Java SE APIs:
java -jar pvs-studio.jar /*other options*/ --compatibility
--source-java /*version*/ --target-java /*version*/
--exclude-packages /*pack1 pack2 ... */Example of V6078 warnings
Suppose we are working on an application based on Java SE 8 and have the following class:
/* imports */
import java.util.jar.Pack200;
public class SomeClass
{
/* code */
public static void someFunction(Pack200.Packer packer, ...)
{
/* code */
packer.addPropertyChangeListener(evt -> {/* code */});
/* code */
}
}Different rule settings will produce different results:
- Source Java SE – 8, Target Java SE – 9
- The 'addPropertyChangeListener' method will be removed.
- Source Java SE – 8, Target Java SE – 11
- The 'addPropertyChangeListener' method will be removed.
- The 'Pack200' class will be marked as deprecated.
- Source Java SE – 8, Target Java SE – 14
- The 'Pack200' class will be removed.
The 'addPropertyChangeListener' method of the class 'Pack200.Packer' was removed in Java SE 9. Next, in Java SE 11, the 'Pack200' class was marked as deprecated. And finally, in the version 14, that class was removed altogether.
Therefore, running your application on Java 11, you will get a 'java.lang.NoSuchMethodError', while running it on Java 14, you will get a 'java.lang.NoClassDefFoundError'.
Knowing about all these changes, you will be forewarned about potential issues of using such an APIs, and can immediately consider finding an alternative APIs for the task at hand.
V6079. Value of variable is checked after use. Potential logical error is present. Check lines: N1, N2.
The analyzer has detected the following issue. First, the value of a variable or expression is used as an index to an array or collection. And only then is this value compared with 0 or the size of the array or collection. This may indicate a logic error in the code or a typo in one of the comparisons.
Consider the following example:
int idx = getPosition(buf);
buf[idx] = 42;
if (idx < 0) return -1;If the value of 'idx' happens to be less than zero, evaluating the 'buf[idx] ' expression will cause an error. The analyzer will point out two lines when reporting this code. The first line is where the 'idx' variable is compared with 0. The second line is where 'idx' was used prior to the check.
Fixed version:
int idx = getPosition(buf);
if (idx < 0) return -1;
buf[idx] = 42;Similarly, the analyzer will issue a warning if the variable is compared with the array's size:
int[] buf = getArrayValue(/*params*/);
buf[idx] = 42;
if (idx < buf.length) return;Fixed version:
int[] buf = getArrayValue(/*params*/);
if (idx < buf.length) return;
buf[idx] = 42;The analyzer will also report an issue if the variable is used as an array index and checked in the same expression:
void f(int[] arr)
{
for (int i = 0; arr[i] < 10 && i < arr.length; i++)
{
System.out.println("arr[i] = " + arr[i]);
}
}In this case, if all the elements of the array are less than 10, the condition will be checking a value outside the array's bounds at the last iteration. And that means ArrayIndexOutOfBoundsException!
Fixed version:
void f(int[] arr)
{
for (int i = 0; i < arr.length && arr[i] < 10; i++)
{
System.out.println("arr[i] = " + arr[i]);
}
}This diagnostic is classified as:
You can look at examples of errors detected by the V6079 diagnostic. |
V6080. Consider checking for misprints. It's possible that an assigned variable should be checked in the next condition.
The analyzer has detected a situation when a variable is initialized or assigned a new value which is expected to be checked in the condition of a subsequent 'if' statement but another variable is checked instead.
This error is demonstrated by the following example:
int ret = foo(....);
if (ret != -1) { .... }
....
int ret2 = bar(....);
if (ret != -1) { .... } // <=Programmers often need to check the value returned by a function but use a wrong variable name in the condition of the 'if' statement. This mistake is typically made when you clone a code fragment but forget to modify the name of the variable in the condition. In the example above, the programmer forgot to change the name 'ret' to 'ret2'.
Fixed version:
int ret2 = bar(....);
if (ret2 != -1) { .... }The following example also demonstrates this mistake:
this.data = calculate(data, ....);
if (data != -1) ....;Both the variable and the field share the same name, which makes it easy to confuse one with the other.
This diagnostic is heuristic; it compares the names of the variables to conclude if there is a typo. It also performs a basic type check to reduce the number of false positives.
This diagnostic is classified as:
You can look at examples of errors detected by the V6080 diagnostic. |
V6081. Annotation that does not have 'RUNTIME' retention policy will not be accessible through Reflection API.
This diagnostic rule detects failed attempts to use the Reflection API for detecting annotations that do not have the 'RUNTIME' retention policy.
When an annotation is implemented, the 'Retention' meta-annotation needs to be applied to it to specify the annotation's lifetime:
- RetentionPolicy.SOURCE – annotations will be present only in source code.
- RetentionPolicy.CLASS – annotations will also be present in compiled code.
- RetentionPolicy.RUNTIME – annotations will also be visible at runtime.
If you have not meta-annotated your annotation with 'Retention', it will be defaulted to 'CLASS'.
When using the Reflection API to get information about any annotations present, you should keep in mind that only annotations with the 'RUNTIME' retention policy will be visible to reflection. An attempt to get information about an annotation that has the 'SOURCE' or 'CLASS' retention policy will fail.
Consider the following contrived example. Suppose we have the following annotation in our project:
package my.package;
import java.lang.annotation.*;
@Target({ElementType.METHOD, ElementType.FIELD, ElementType.PARAMETER, ....})
public @interface MyAnnotation {
int field_id() default -1;
String field_name() default "";
....
}Trying to check if a certain method has that annotation using the Reflection API:
void runMethod(Method method, ....)
{
....
if (method.isAnnotationPresent(MyAnnotation.class))
{
....
}
....
}will result in getting false all the time. This happens because the annotation was not marked with the 'Retention' meta-annotation. And, as said earlier, if it is not specified, the default value is 'CLASS'.
For your annotation to be accessible through the Reflection API, you need to explicitly specify the 'RUNTIME' retention policy:
package my.package;
import java.lang.annotation.*;
@Retention(RetentionPolicy.RUNTIME)
@Target({ElementType.METHOD, ElementType.FIELD, ElementType.PARAMETER, ....})
public @interface MyAnnotation {
int field_id() default -1;
String field_name() default "";
....
}In addition to the 'isAnnotationPresent' method, this diagnostic rule also checks getAnnotation, getAnnotationsByType, getDeclaredAnnotation, and getDeclaredAnnotationsByType.
V6082. Unsafe double-checked locking.
The analyzer has detected a potential error related to unsafe use of the double-checked locking pattern.
Double-checked locking is a pattern used to reduce the overhead of acquiring a lock. The locking condition is first checked without synchronization. And only if the condition is true, the thread attempts to acquire the lock. Thus, locking occurs only when it is indeed necessary.
The most common mistake when implementing this pattern is publishing an object before initializing it:
class TestClass
{
private static volatile Singleton singleton;
public static Singleton getSingleton()
{
if (singleton == null)
{
synchronized (TestClass.class)
{
if (singleton == null)
{
singleton = new Singleton();
singleton.initialize(); // <=
}
}
}
return singleton;
}
}In a multi-threaded environment, one of the threads could see an already created object and use it even if that object has not been initialized yet.
A similar issue might occur when the object is reassigned in the synchronized block depending on some conditions. Some other thread may well start working with the object after its first assignment without knowing that some other object is meant to be used further in the program.
Such errors are fixed by using a temporary variable:
class TestClass
{
private static volatile Singleton singleton;
public static Singleton getSingleton()
{
if (singleton == null)
{
synchronized (TestClass.class)
{
if (singleton == null)
{
Singleton temp = new Singleton();
temp.initialize();
singleton = temp;
}
}
}
return singleton;
}
}Another common mistake when implementing this pattern is skipping the 'volatile' modifier when declaring the field being accessed:
class TestClass
{
private static Singleton singleton;
public static Singleton getSingleton()
{
if (singleton == null)
{
synchronized (TestClass.class)
{
if (singleton == null)
{
Singleton temp = new Singleton();
temp.initialize();
singleton = temp;
}
}
}
return singleton;
}
}An object of class 'Singleton' could be created several times because the 'singleton == null' check could see the value 'null' cached in the thread. Besides, the compiler could alter the order of operations over non-volatile fields and, for example, swap the call to the object initialization method and the storing of the reference to that object in the field, thus resulting in using the object, which is yet to be initialized.
One of the reasons why such errors are dangerous is that the program will run correctly in most cases. In this particular case, the incorrect behavior may manifest itself depending on the JVM version, concurrency level, thread scheduler's decisions, and other factors. Such complex conditions are extremely difficult to reproduce manually.
This diagnostic is classified as:
|
You can look at examples of errors detected by the V6082 diagnostic. |
V6083. Serialization order of fields should be preserved during deserialization.
This diagnostic rule detects mismatching orders of serialization and deserialization of an object's fields.
When using the 'java.io.Serializable' interface, the JVM is in total control over serialization. Convenient as this approach may be, it is often not flexible or fast enough.
An alternative approach to serialization provided by the JVM is to use the 'java.io.Externalizable' interface with the methods 'writeExternal' and 'readExternal' overridden. The downside of this technique, however, is a high risk of breaking the order of writing and reading the fields, which could result in an elusive bug.
Consider the following example:
public class ExternalizableTest implements Externalizable
{
public String name;
public String host;
public int port;
....
@Override
public void writeExternal(ObjectOutput out) throws IOException
{
out.writeInt(port); // <=
out.writeUTF(name);
out.writeUTF(host);
}
@Override
public void readExternal(ObjectInput in) throws IOException
{
this.name = in.readUTF(); // <=
this.host = in.readUTF();
this.port = in.readInt();
}
}In this code, the object's fields are serialized in the following order: port, name, host, type. But they are deserialized in the order: name, host, port, type. The first field to be serialized is an integer, and the first field to be deserialized is a string. This mismatch leads to a 'java.io.EOFException'. You could call it "luck" because this bug will show up at the very first attempt to deserialize the object.
But what if we are not that "lucky" – like in this example:
public class ExternalizableTest implements Externalizable
{
public String name;
public String host;
public int port;
....
@Override
public void writeExternal(ObjectOutput out) throws IOException
{
out.writeInt(port);
out.writeUTF(name); // <=
out.writeUTF(host);
}
@Override
public void readExternal(ObjectInput in) throws IOException
{
this.port = in.readInt();
this.host = in.readUTF(); // <=
this.name = in.readUTF();
}
}The deserialization order is again different from the serialization order: the string fields 'name' and 'host' are swapped. In this case, the program will keep running without crashing, with the object successfully restored, but the fields will have their values swapped. A defect like that is not as easily detected.
Fixed version:
public class ExternalizableTest implements Externalizable
{
public String name;
public String host;
public int port;
....
@Override
public void writeExternal(ObjectOutput out) throws IOException
{
out.writeInt(port);
out.writeUTF(name);
out.writeUTF(host);
}
@Override
public void readExternal(ObjectInput in) throws IOException
{
this.port = in.readInt();
this.name = in.readUTF();
this.host = in.readUTF();
}
}V6084. Suspicious return of an always empty collection.
The analyzer has detected a 'return' statement that returns an always empty collection defined as a local variable.
This typically happens when you forget to add elements to the collection:
public List<Property> getProperties()
{
List<Property> properties = new ArrayList<>();
Property p1 = new Property();
p1.setName("property1");
p1.setValue(42);
return properties;
}The program will create an object of the appropriate type, but since the call 'properties.add(p1)' is missing, the 'getProperties' method will return incorrect data. Fixed code:
public List<Property> getProperties()
{
List<Property> properties = new ArrayList<>();
Property p1 = new Property();
p1.setName("property1");
p1.setValue(42);
properties.add(p1); // <=
return properties;
}When you need to return an empty collection, do so explicitly:
public List<Property> getMutableProperties()
{
return new ArrayList<>();
}
public List<Property> getImmutableProperties()
{
return Collections.emptyList();
}V6085. An abnormality within similar comparisons. It is possible that a typo is present inside the expression.
The analyzer found suspicious condition that may contain an error of copy-paste.
The diagnosis is empirical, that is why it is easier to demonstrate it on the example than to explain the working principle of the analyzer. Consider this example:
if (m_a != a ||
m_b != b ||
m_b != c) // <=
{
....
}Because of the similarity of the variable names, there is a typo in the code. An error is located on the third line. The variable 'c' should be compared with 'm_c' rather than with 'm_b'. It is difficult to notice the error even when reading this text. Please, pay attention to the variable names.
The right variant:
if (m_a != a ||
m_b != b ||
m_c != c)
{
....
}If the analyzer issued the warning V6085, then carefully read the corresponding code. Sometimes it is difficult to notice a typo.
This diagnostic is classified as:
V6086. Suspicious code formatting. 'else' keyword is probably missing.
The analyzer has detected a code fragment with an 'if' statement starting on the same line with the closing brace of the previous 'if' statement. The 'else' keyword is probably missing between the two 'if' statements, which makes the program work differently from what was expected.
Consider the following example:
public void fillTrialMessage(User user, Response response)
{
if (user.getTrialTime() > 7) {
// Do not set message
} if (user.getTrialTime() > 0) { // <=
response.setTrialMessage("Trial ends soon");
} else {
response.setTrialMessage("Trial has ended");
}
}The developer's intention here was to have the response message filled only when the trial version of the program is expiring soon or has already expired. However, because of the missing 'else' keyword, the message will be shown when there are still several months left before the end of the trial period. This is what the fixed version looks like:
public void fillTrialMessage(User user, Response response)
{
if (user.getTrialTime() > 7) {
// Do not set message
} else if (user.getTrialTime() > 0) {
response.setTrialMessage("Trial ends soon");
} else {
response.setTrialMessage("Trial has ended");
}
}If the developer never meant to use an else-if construct, the formatting should be fixed by moving the second 'if' statement to the next line:
public void doSomething()
{
if (condition1) {
foo();
}
if (condition2) {
bar();
} else {
baz();
}
}This style is more familiar to most programmers and will not provoke unnecessary suspicions. Besides, adhering to it will stop the analyzer from issuing an extra warning.
This diagnostic is classified as:
You can look at examples of errors detected by the V6086 diagnostic. |
V6087. InvalidClassException may occur during deserialization.
The analyzer has detected a situation where the absence of an available default constructor during deserialization may lead to a 'java.io.InvalidClassException'.
When using the 'java.io.Serializable' interface, the JVM is in total control over serialization. When an object is getting deserialized, memory is allocated for it, and the object's fields are filled with the values from the byte stream without calling the constructor. It is important to remember that if a serializable class has a non-serializable parent, the deserialization mechanism will call the latter's default constructor. If there is no such constructor, a 'java.io.InvalidClassException' is thrown.
Consider the following contrived example:
class Parent {
private String parentField;
public Parent(String field) {
this.parentField = field;
}
// ....
}
class Child extends Parent implements Serializable {
public String childField;
public Child() {
super("");
}
public Child(String field1, String field2) {
super(field1);
this.childField = field2;
}
// ....
}Since the parent class is not serializable, when deserializing the object of class 'Child', the built-in deserialization mechanism will attempt to call the default constructor and throw an exception if no such constructor is found.
For correct serialization, we only need to define an available default constructor in the parent class:
class Parent {
private String parentField;
public Parent() {
this.parentField = "";
}
public Parent(String field) {
this.parentField = field;
}
// ....
}When implementing the 'java.io.Externalizable' interface, user-implemented logic is called: serialization and deserialization are implemented by overriding the methods 'writeExternal' and 'readExternal'. During deserialization, the default public constructor is always called first and only then is the 'readExternal' method called on the resulting object. If no such constructor exists, a 'java.io.InvalidClassException' will be thrown.
class Parent implements Externalizable
{
private String field;
public Parent(String field) {
this.field = field;
}
public void writeExternal(ObjectOutput arg0) throws .... {
// serializable logic
}
public void readExternal(ObjectInput in) throws .... {
// deserializable logic
}
// ....
}This class has no appropriate constructor. An object of this class can be successfully serialized, but an attempt to restore a previously serialized object will result in throwing an exception.
To fix this, we only need to define an available constructor without parameters:
class Parent implements Externalizable
{
private String field;
public Parent() {
this.field = "";
}
public Parent(String field) {
this.field = field;
}
// ....
}V6088. Result of this expression will be implicitly cast to 'Type'. Check if program logic handles it correctly.
This diagnostic detects ternary operators with implicit cast of numeric types within them. Such casts may break the program's execution logic because of unexpected change of the object's type.
Consider the following example:
public void writeObject(Serializer serializer, Object o)
{
....
else if (o instanceof Integer)
{
serializer.writeInt((Integer) o);
}
else if (o instanceof Double)
{
serializer.writeDouble((Double) o);
}
....
}
public void serialize(Serializer serializer)
{
Object data = condition ? 5 : 0.5; // <=
writeObject(serializer, data);
}In this case, the actual argument of the 'writeObject' method will always be a number of type 'double': 5.0 or 0.5. This will result in executing the wrong branch of the if-else-if construct inside 'writeObject'. Fixing this bug involves replacing the ternary operator with an if-else block:
public void serialize(Serializer serializer)
{
if (condition)
{
writeObject(serializer, 5);
}
else
{
writeObject(serializer, 0.5);
}
// or
Object data;
if (condition)
{
data = 5;
}
else
{
data = 0.5;
}
writeObject(serializer, data);
}This bug is peculiar in that the interchangeable conditional statement and ternary operator may in reality behave differently.
V6089. It's possible that the line was commented out improperly, thus altering the program's operation logics.
The analyzer has detected a potential error that has to do with altered execution logic due to inappropriate commenting-out of a code fragment.
This diagnostic rule looks for comments that look like regular code between the beginning of an 'if (...)' statement and its 'then' branch, with the latter having suspicious formatting. In this case, it is possible that the 'then' branch, in its current form, is a result of bad refactoring.
Consider the following example:
if (hwndTaskEdit == null)
// hwndTaskEdit = getTask(...);
if (hwndTaskEdit != null)
{
...
}The program no longer makes sense as the condition of the second 'if' statement will never be true.
Fixed version:
// if (hwndTaskEdit == null)
// hwndTaskEdit = getTask(...);
if (hwndTaskEdit != null)
{
...
}The analyzer doesn't generate the warning if code formatting meets the program's execution logic.
For example:
if (isReady)
// some comment
if (isSmt)
{
...
}This diagnostic is classified as:
|
V6090. Field 'A' is being used before it was initialized.
The analyzer has detected an access inside a class constructor to a field that has not been initialized yet.
In Java, all fields are implicitly initialized with default values of appropriate types. For reference types, this default value is 'null'.
Consider the following example:
public class Test
{
private Object data;
private DataProvider dataProvider;
public Test(DataProvider provider)
{
this.data = dataProvider.get();
this.dataProvider = dataProvider;
}
}What is being accessed here is not a constructor parameter but a class field, which results in throwing a 'NullPointerException' every time this constructor is called. Fixed code:
public class Test
{
private Object data;
private DataProvider dataProvider;
public Test(DataProvider provider)
{
this.data = provider.get();
this.dataProvider = provider;
}
}Another error related to the use of uninitialized reference fields is to compare them with 'null'. The conditions involved are either always true or always false, which signals an error in the program's logic.
public class Test
{
private DataProvider dataProvider;
public Test()
{
if (dataProvider != null)
{
dataProvider = new DataProvider();
}
}
}The analyzer will not issue this warning if the field is initialized explicitly – even if with the 'null' value.
This diagnostic is classified as:
V6091. Suspicious getter/setter implementation. The 'A' field should probably be returned/assigned instead.
The analyzer has detected a getter/setter that accesses a field different from the one mentioned in the name.
Such errors usually result from inattention or inaccurate use of autocomplete or copy-paste.
Consider the following example:
public class Vector2i
{
private int x;
private int y;
public void setX(int x)
{
this.x = x;
}
public int getX()
{
return x;
}
public void setY(int y)
{
this.y = y;
}
public int getY()
{
return x; // <=
}
}Fixed code:
public class Vector2i
{
private int x;
private int y;
public void setX(int x)
{
this.x = x;
}
public int getX()
{
return x;
}
public void setY(int y)
{
this.y = y;
}
public int getY()
{
return y;
}
}To implement methods like that, it is better to use the means provided by the IDE or code generation provided by the Lombok library.
You can look at examples of errors detected by the V6091 diagnostic. |
V6092. A resource is returned from try-with-resources statement. It will be closed before the method exits.
The analyzer has detected a situation where an 'AutoCloseable' object used in a try-with-resources statement is being returned from a method.
The try-with-resources statement automatically closes all resources when exiting – that is, the resource will always be already closed when it's returned. In most cases, closed resources have no use, and calling their methods will almost always lead to an 'IOException'.
public InputStream getStreamWithoutHeader() throws IOException
{
try (InputStream stream = getStream())
{
stream.skip(HEADER_LENGTH);
return stream;
}
}In this case, 'stream' will be closed before the control is passed to the calling method, and it will be impossible to use this stream in any way.
Fixed code:
public InputStream getStreamWithoutHeader() throws IOException
{
InputStream stream = getStream();
stream.skip(HEADER_LENGTH);
return stream;
}V6093. Automatic unboxing of a variable may cause NullPointerException.
The analyzer has detected a code fragment where automatic unboxing of the 'null' value may take place, thus resulting in a 'NullPointerException'.
This error can often be found in comparison operations. For example, 'Boolean' can be used as a flag that can have one of three values: false, true, or unspecified; and you may want to check if a flag is explicitly set to a particular value by writing the following code pattern:
public void doSomething()
{
Boolean debugEnabled = isDebugEnabled();
if (debugEnabled == true)
{
...
}
}However, when a primitive value is being compared with a boxed one, the latter is always automatically unboxed, thus resulting in a 'NullPointerException'. The example code above can be fixed in a number of ways:
public void doSomething()
{
Boolean debugEnabled = isDebugEnabled();
if (debugEnabled != null && debugEnabled == true)
{
...
}
// or
if (Objects.equals(debugEnabled, true))
{
...
}
}Unlike most operators, the ternary operator allows mixing primitive and wrapper types in one expression as it automatically boxes the resulting value when casting it to the common type. This makes it easy to make a typo:
boolean x = httpRequest.getAttribute("DEBUG_ENABLED") != null
? (boolean) httpRequest.getAttribute("DEBUG_ENABLED")
: null;In this example, 'Boolean' is the common type for the operands of the ternary operator and the result of the expression is unboxed back into a primitive when assigned to the 'x' variable. This is what the fixed code looks like:
boolean x = httpRequest.getAttribute("DEBUG_ENABLED") != null
? (boolean) httpRequest.getAttribute("DEBUG_ENABLED")
: false;This diagnostic is classified as:
|
V6094. The expression was implicitly cast from integer type to real type. Consider utilizing an explicit type cast to avoid the loss of a fractional part.
The analyzer detected a possible error that has to do with a result of integer division being implicitly cast to type float. Such cast may lead to inaccurate result.
Consider the following example:
int totalTime = 1700;
int operationNum = 900;
double averageTime = totalTime / operationNum;The programmer expects the 'averageTime' variable to refer to value '1.888(8)', but because the division operation is applied to integer values and only then is the resulting value cast to type float, the variable will actually refer to '1.0'.
As in the previous case, there are two ways to fix the error.
One way is to change the variables' types:
double totalTime = 1700;
double operationNum = 900;
double averageTime = totalTime / operationNum;Another way is to use explicit type cast.
int totalTime = 1700;
int operationNum = 900;
double averageTime = (double)(totalTime) / operationNum;This diagnostic is classified as:
You can look at examples of errors detected by the V6094 diagnostic. |
V6095. Thread.sleep() inside synchronized block/method may cause decreased performance.
The analyzer has detected a call of the 'Thread.sleep(....)' method inside a synchronized block or function.
When calling 'Thread.sleep(....)', the current thread is suspended without releasing the lock on the object's captured monitor. As a result, other threads attempting to synchronize on that object will have to wait idly for the sleeping thread to wake up. This may lead to performance drop and in some cases, even to a deadlock.
Consider the following example:
private final Object lock = new Object();
public void doSomething() {
synchronized(lock) {
....
Thread.sleep(1000);
....
}
}It is better to use the 'lock.wait(....)' method instead of 'Thread.sleep()' to suspend the current thread for a specified time period and make it release the object's monitor to keep other threads from idling. However, keep in mind that in this case, the thread may be "woken up" before the specified timeout has elapsed. For that reason, you should have some condition checked to make sure that the thread has not been woken up earlier than intended:
private final Object lock = new Object();
public void doSomething() {
synchronized(lock) {
....
while(!ready()) {
lock.wait(1000)
}
....
}
}This diagnostic is classified as:
|
V6096. An odd precise comparison. Consider using a comparison with defined precision: Math.abs(A - B) < Epsilon or Math.abs(A - B) > Epsilon.
The analyzer has detected a suspicious code fragment where floating-point numbers are compared using operator '==' or '!='. Such code may contain a bug.
Let's discuss an example of correct code first:
double a = 0.5;
if (a == 0.5) //ok
++x;This comparison is correct. Before executing it, the 'a' variable is explicitly initialized to value '0.5', and it is this value the comparison is done over. The expression will evaluate to 'true'.
So, strict comparisons are permitted in certain cases - but not all the time. Here's an example of incorrect code:
double b = Math.sin(Math.PI / 6.0);
if (b == 0.5) //err
++x;The 'b == 0.5' condition proves false because the 'Math.sin(Math.PI / 6.0)' expression evaluates to 0.49999999999999994. This number is very close but still not equal to '0.5'.
One way to fix this is to compare the difference of the two values against some reference value (i.e. amount of error, which in this case is expressed by variable 'epsilon'):
double b = Math.sin(Math.PI / 6.0);
if (Math.abs(b - 0.5) < epsilon) //ok
++x;You should estimate the error amount appropriately, depending on what values are being compared.
The analyzer points out those code fragments where floating-point numbers are compared using operator '!=' or '==', but it's the programmer alone who can figure out whether or not such comparison is incorrect.
References:
This diagnostic is classified as:
V6097. Lowercase 'L' at the end of a long literal can be mistaken for '1'.
The analyzer has detected a declaration of a literal of type 'long' ending in a lowercase 'l'.
Consider the following example:
long value = 1111l;In this code, the lowercase letter 'l' can be easily confused with the numeral '1'. Depending on the current font, the difference between the characters may be, in some cases, entirely unnoticeable, which may lead to misinterpretation of the literal's value. To avoid confusion, we recommend declaring literals of type 'long' with the uppercase 'L' at the end:
long value = 1111L;This diagnostic rule does not produce the warning in every case. There are a few exceptions to it:
- the literal ending in 'l' is used more than twice in one expression;
- the literal is found in the declaration of the serialVersionUID field;
- and so on.
This diagnostic is classified as:
|
V6098. The method does not override another method from the base class.
The analyzer has detected a situation where a method of the base class or interface is not overridden by another method with a similar signature.
Consider a synthetic example:
public class Base
{
public String someThing()
{
return "Base";
}
}
public class Derived extends Base
{
public String something() // <=
{
return "Derived";
}
}In this code, when writing a method to override the 'someThing' method of the 'Derived' class, the programmer misspelled the method's name. This typo will make method overriding impossible, and its effect will reveal itself when you attempt to use polymorphism:
...
List<Base> list = new ArrayList<>();
list.add(new Base());
list.add(new Derived());
StringBuilder builder = new StringBuilder();
for (Base base : list)
{
builder.append(base.someThing());
}
String result = builder.toString();
...Because of that spelling mistake, the 'result' variable will be assigned the 'BaseBase' string instead of the intended 'BaseDerived'.
Java provides the '@Override' annotation to secure you from possible mistakes when overriding methods. If a method marked with this annotation is not overriding any method, the compiler will warn you and abort compilation.
The fixed version:
public class Base
{
public String someThing()
{
return "Base";
}
}
public class Derived extends Base
{
@Override
public String someThing() //ok
{
return "Derived";
}
}The following several examples demonstrate other situations that will trigger the warning.
import first.A;
public class Base
{
public void someThing(A input)
{
...
}
}
import second.A;
public class Derived extends Base
{
public void someThing(A input) // <=
{
...
}
}The spelling of the 'input' argument's name is the same in both method declarations, but these types are located in different packages, 'first' and 'second', which will result in method overloading rather than overriding.
package first;
public class Base
{
void someThing()
{
...
}
}
package second;
import first.Base;
public class Derived extends Base
{
void someThing() // <=
{
...
}
}In this example, the classes 'Base' and 'Derived' are located in different packages, 'first' and 'second' respectively. The 'someThing' method of the 'Base' class is declared without any modifiers and, therefore, has the default access level (package-private), which makes it inaccessible to the 'Derived' class located in a different package. Therefore, the method will not be overridden, and the analyzer will warn you about that.
V6099. The initial value of the index in the nested loop equals 'i'. Consider using 'i + 1' instead.
The analyzer has detected a faulty or suboptimal loop. A standard pattern is used where some operation is executed for every pair of elements of an array. This operation, however, is usually not required for a pair whose members are the same element, i.e. when 'i == j'.
For example:
for (int i = 0; i < size; i++)
for (int j = i; j < size; j++)
....It is highly possible that a more correct and effective way to traverse the arrays would probably be this:
for (int i = 0; i < size; i++)
for (int j = i + 1; j < size; j++)
....This diagnostic is classified as:
V6100. An object is used as an argument to its own method. Consider checking the first actual argument of the 'Foo' method.
The analyzer detected a method call in which an object is used as an argument to its own method. Most likely, this is erroneous code and the method should be passed another object.
Consider the example:
a.foo(a);Due to a typo the incorrect variable name is used here. The fixed version of this code should look like this:
a.foo(b);or this:
b.foo(a);And here's an example from a real application:
public class ByteBufferBodyConsumer {
private ByteBuffer byteBuffer;
....
public void consume(ByteBuffer byteBuffer) {
byteBuffer.put(byteBuffer);
}
}Here they are trying to insert its own values into the 'byteBuffer'.
Fixed code:
public class ByteBufferBodyConsumer {
private ByteBuffer byteBuffer;
....
public void consume(ByteBuffer byteBuffer) {
this.byteBuffer.put(byteBuffer);
}
}This diagnostic is classified as:
You can look at examples of errors detected by the V6100 diagnostic. |
V6101. compareTo()-like methods can return not only the values -1, 0 and 1, but any values.
The analyzer has detected an expression comparing the return value of the 'Comparable.compareTo' method or other similar method with a specific non-zero value (1 and -1 in particular). However, the contract of this method in the Java specification implies that it can return any positive or negative value.
Whether the 'compareTo == 1' construct will return a correct value depends on its implementation. For this reason, such comparison with a specific value is considered a bad practice, which in some cases may lead to elusive bugs. Instead, use the 'compareTo > 0' expression.
Consider the following example:
void smt(SomeType st1, SomeType st2, ....)
{
....
if (st1.compareTo(st2) == 1)
{
// some logic
}
....
}When working for a long time on a project, where the 'Comparable' interface is implemented in such a way that it allows comparing the return value of 'compareTo' with 1, the developer may get used to it. Switching over to another project, where the specifics of the method's implementation are different, the developer continues using this construct, which now returns different positive values depending on the circumstances.
The fixed version:
void smt(SomeType st1, SomeType st2, ....)
{
....
if (st1.compareTo(st2) > 0)
{
// some logic
}
....
}The analyzer also issues the warning when it encounters a comparison of two 'compareTo' methods' return values. Such a situation is very uncommon, but it still must be considered.
This diagnostic is classified as:
|
V6102. Inconsistent synchronization of a field. Consider synchronizing the field on all usages.
The analyzer has detected a field being accessed without synchronization while most previous accesses to this field occurred in synchronized context.
Incomplete synchronization can be a reason for a race condition, where the shared state is being modified by several threads at once, the output depending on the order of threads’ execution. This results in a variety of errors, which show up unexpectedly and often cannot be reproduced when debugging in similar conditions.
In other words, fields must either be synchronized on every usage or remain unsynchronized at all to avoid misleading the programmers who will be maintaining the code later. For this reason, if the analyzer issues a V6102 warning, make sure that all accesses to the field are synchronized.
Here is a simple example from a real project, where accesses to the 'acked' field are synchronized in all cases but one:
public class FixedTupleSpout implements IRichSpout
{
private static final Map<String, Integer> acked = new HashMap<>();
....
public static int getNumAcked(String stormId)
{
synchronized (acked)
{
return get(acked, stormId, 0);
}
}
public static void clear(String stormId)
{
acked.remove(stormId); // <=
....
}
public int getCompleted()
{
synchronized (acked)
{
ackedAmt = acked.get(_id);
}
....
}
public void cleanup()
{
synchronized (acked)
{
acked.remove(_id);
}
....
}
}Since the access to 'acked' in the 'clear' method is unsynchronized, this field is likely to be accessed from several different threads at once. Since 'acked' is an instance of a thread-unsafe collection HashMap, such access is very likely to corrupt the object’s internal state. To solve this issue, the 'acked.remove(stormId)' expression must be enclosed in a 'synchronized' block:
public class FixedTupleSpout implements IRichSpout
{
private static final Map<String, Integer> acked = new HashMap<>();
....
public static int getNumAcked(String stormId)
{
synchronized (acked)
{
return get(acked, stormId, 0);
}
}
public static void clear(String stormId)
{
synchronized (acked))
{
acked.remove(stormId);
}
....
}
public int getCompleted()
{
synchronized (acked)
{
ackedAmt = acked.get(_id);
}
....
}
public void cleanup()
{
synchronized (acked)
{
acked.remove(_id);
}
....
}
}This diagnostic is classified as:
V6103. Ignored InterruptedException could lead to delayed thread shutdown.
The analyzer found that the 'InterruptedException' in the 'catch' block was ignored. In this case, information about thread interrupts is lost, which can compromise the application's capacity to cancel functions or promptly stop working.
Each thread has an interrupt status – a hidden boolean field that stores information about whether the thread was interrupted or not. To apply this status, you need to call the method 'Thread.interrupt()'. By documentation, any method that can throw 'InterruptedException' clears the interrupt status when this occurs. The method can be, for example, 'Object.wait()', 'Thread.sleep()', or others. If you do not handle the exception properly, the fact of the interrupt will be lost. This will not allow the calling part of the program to react to the execution cancellation. However, there may be cases where the interrupt status will not be reset when 'InterruptedException' is thrown. For example, a custom interrupt implementation, methods of third-party libraries. It is not recommended to count on these scenarios.
There are options to ensure that information about thread interrupts is not lost. When catching 'InterruptedException' you should either set the interrupt flag using 'Thread.interrupt()' or throw the caught exception further without wrapping it in any other. If interrupt handling is meaningless, this exception must not be caught.
Consider an erroneous code example from a real application:
public void disconnect()
{
....
try
{
sendThread.join();
}
catch (InterruptedException ex)
{
LOG.warn("....", ex);
}
....
}The correct code must look like this:
public void disconnect()
{
....
try
{
sendThread.join();
}
catch (InterruptedException ex)
{
Thread.currentThread().interrupt();
LOG.warn("....", ex);
}
....
}This diagnostic is classified as:
V6104. A pattern was detected: A || (A && ...). The expression is excessive or contains a logical error.
The analyzer has detected an expression that can be reduced. Such redundancy may be a sign of a logical error.
Consider this example:
boolean firstCond, secondCond, thirdCond;
....
if (firstCond || (firstCond && thirdCond))
....This expression is redundant. If 'firstCond == true', the condition will always be true regardless of what value the 'thirdCond' variable refers to; and if 'firstCond == false', the condition will always be false – again, irrespective of the 'thirdCond' variable. Thus, the expression 'firstCond || (firstCond && thirdCond)' can be simplified:
if (firstCond)Perhaps the programmer made a mistake and wrote a wrong variable in the second subexpression. Then the correct version of this code should look like this:
if (firstCond || (secondCond && thirdCond))V6105. Consider inspecting the loop expression. It is possible that different variables are used inside initializer and iterator.
The analyzer found that the iterator section of the 'for' statement is incrementing or decrementing a variable that is not a counter.
Look at the example. Let's say we have an expression of the following type:
for (int i = 0; i != N; ++N)This code fragment probably contains an error. The 'i' variable should be used instead of the 'N' variable in the '++N' increment expression. Correct code should be as follows:
for (int i = 0; i != N; ++i)Let's consider another example:
for (int i = N; i >= 0; --N)This code snippet also contains an error. The 'i' variable should be used in the '--N decrement expression.
for (int i = N; i >= 0; --i)This diagnostic is classified as:
V6106. Casting expression to 'X' type before implicitly casting it to other type may be excessive or incorrect.
The analyzer found that after an explicit conversion of a variable to one numeric data type, a further implicit conversion to another numeric data type is performed. This usually indicates that an explicit conversion is either made mistakenly or unnecessary.
There are several types of conversion over numeric types in Java:
- In widening (implicit) conversions, a smaller data type is assigned to a larger type, for example: byte -> short -> int -> long -> float -> double. Those are safe since they do not lead to data loss after the conversion. The compiler performs them silently and does not issue warnings.
- In narrowing (explicit) conversions, a larger data type needs to be assigned to a smaller data type. In such cases, there is a risk of losing data, so explicit type conversion is always done manually, under the responsibility of the programmer.
When a sequence of explicit and implicit transformations occurs in the same context, it's a reason to take a closer look at the code.
Let's consider an example of a suspicious type conversion that occurred in one of the existing projects:
public void method(...., Object keyPattern, ....)
{
....
if (keyPattern instanceof Integer)
{
int intValue = (Integer) keyPattern;
....
}
else if (keyPattern instanceof Short)
{
int shortValue = (Short) keyPattern;
....
}
....
}After the 'keyPattern instanceof Short' check, the 'keyPattern' variable is explicitly cast to the 'Short' type. But when assigning a value to the 'shortValue' variable, an implicit casting of the previously made cast to the 'int' type takes place, since the 'shortValue' variable is of type 'int'. The Java compiler does not issue warnings here, since both conversions are valid. The programmer most likely wanted to specify the 'short' type for the 'shortValue' variable.
The corrected version of the code should look like this:
public void method(...., Object keyPattern, ....)
{
....
if (keyPattern instanceof Integer)
{
int intValue = (Integer) keyPattern;
....
}
else if (keyPattern instanceof Short)
{
short shortValue = (Short) keyPattern;
....
}
....
}This diagnostic is classified as:
V6107. The constant NN is being utilized. The resulting value could be inaccurate. Consider using the KK constant.
The analyzer has detected the use of low-precision constants in mathematical calculations.
Look at the example:
double pi = 3.141592654;This way of writing the 'pi' constant is not quite correct. It is preferable to use mathematical constants from the Math static class:
double pi = Math.PI;The analyzer does not output the warning when constants are explicitly defined as of the 'float' type, since the 'float' type has fewer significant digits than the 'double' type. That is why the following code will not trigger the analyzer:
float f = 3.14159f; //okThis diagnostic is classified as:
V6108. Do not use real-type variables in 'for' loop counters.
The analyzer has detected a real-type variable as the 'for' loop counters. Since floating-point numbers cannot accurately represent all real numbers, using such variables in a loop can lead to unexpected results, e.g. redundant iterations.
Let's take a closer look:
for (double i = 0.0; i < 1.0; i += 0.1) {
....
}The number of iterations in this loop will be 11 instead of the expected 10. When executing code without the 'strictfp' modifier in Java versions earlier than 17, the result of floating-point operations may also be platform-dependent. To avoid possible issues, it is better to use a counter of the integer type and perform calculations inside the loop body:
for (var i = 0; i < 10; i++) {
double counter = i / 10.0;
....
}Another reason to avoid using a real type is the danger of an infinite loop. Look at the following example:
for (float i = 100000000.0f; i <= 100000009.0f; i += 0.5f) {
....
}It occurs because the increment is too small relative to the number of significant figures. To prevent this, it is better to use an integer-type counter, and to avoid precision loss, use 'double' to store the value:
for (var i = 0; i < 19; i++) {
double value = 100000000.0d + i / 2d;
....
}This diagnostic is classified as:
V6109. Potentially predictable seed is used in pseudo-random number generator.
This diagnostic rule detects cases where a pseudo-random number generator is used. It may result in insufficient randomness or predictability of the generated number.
Case 1.
Creating a new object of the 'Random' type every time a random value is required. This is inefficient and may result in creating numbers that are not random enough, depending on the JDK.
Here is an example:
public void test() {
Random rnd = new Random();
}For a more efficient and random distribution, create an instance of the 'Random' class, save it, and reuse it.
static Random rnd = new Random();
public void test() {
int i = rnd.nextInt();
}Case 2.
The analyzer detected suspicious code that initializes the pseudo-random number generator with a constant value.
public void test() {
Random rnd = new Random(4040);
}Numbers generated by such a generator are predictable — they are repeated every time the program runs. To avoid this, do not use a constant number. For example, you can use the current system time instead:
static Random rnd = new Random(System.currentTimeMillis());
public void test() {
int i = rnd.nextInt();
}This diagnostic is classified as:
V6110. Using an environment variable could be unsafe or unreliable. Consider using trusted system property instead
This diagnostic rule detects the use of environment variables that can be replaced by a system property.
According to the documentation, this may result in the following issues:
- An attacker can control all environment variables of a program.
- Environment variables may have slightly different semantics or case sensitivity on different operating systems.
This increases the chance of unanticipated side effects. Therefore, if an environment variable contains information that is available by other means, the variable should not be used.
For example, if the operating system provides a user name, it is always available in the 'user.name' system property.
Here is an example of how not to write such code:
String user = System.getenv("USER");The fixed code:
String user = System.getProperty("java.name");Aside from direct calls to the 'System.getenv()' method, the diagnostic rule tracks methods by their signatures, which may indicate the return of environment variable values.
V6111. Potentially negative value is used as the size of an array.
The analyzer detected that a potentially negative value of a variable or expression might be used as the size of an array that is created.
Let's look at an example:
void process(boolean isNotCsv) {
String str = "column1,column2";
if (isNotCsv) {
str = "content";
}
var arr = new String[str.indexOf(',')];
....
}The value returned by the 'indexOf' method may be -1. This happens if the string does not contain the specified character. Then, when you create the 'arr' array, its length will be negative. This will result in the 'NegativeArraySizeException' type exception.
The fixed version of the 'process' method may look like this:
public static void process(boolean isNotCsv) {
String str = "column1,column2";
if (isNotCsv) {
str = "content";
} else {
var arr = new String[str.indexOf(',')];
....
}
....
}V6112. Calling the 'getClass' method repeatedly or on the value of the '.class' literal will always return the instance of the 'Class<Class>' type.
The 'getClass' method is used to get the type of the object the method was called on. Likewise, we can use the 'class' literal directly with the type, rather than with the object.
When the 'getClass' method is used with the 'class' literal, the 'Class' type information is retrieved. Let's look at the example:
var typeInfo = Integer.class.getClass();As a result of calling this method, the 'typeInfo' variable stores information about the 'Class' type. This is because the 'class' literal stores information of the 'Class<Integer>' type. When the 'getClass' method is called, we get the information about the 'Class' type, not about 'Integer'. If we need to get the information about the 'Integer' type, we can just use the 'class' literal:
var typeInfo = Integer.class;In addition, there may be an accidental duplication of the call to 'getClass':
Integer i = 0;
var typeInfo = i.getClass().getClass();Just like in the first example, the first call to 'getClass' returns an object of the 'Class<Integer>' type. Calling 'getClass' repeatedly returns the information about the 'Class' type, not about the 'Integer' type. To get the information about the 'Integer' type, just call the method once:
Integer i = 0;
var typeInfo = i.getClass();If we need the information about the 'Class' type, we can use the following statement:
var classType = Class.class;You still can use the 'getClass' method with 'Class.class', as the result will not change:
var classType = Class.class.getClass();Credits and acknowledgements
Trademarks
Windows, Visual Studio, Visual C++ are either registered trademarks or trademarks of Microsoft Corporation in the United States and/or other countries.
Other product and company names mentioned herein may be the trademarks of their respective owners.
C/C++
OpenC++ library
Portions of PVS-Studio are based in part of OpenC++. Bellow you can read OpenC++ Copyright Notice.
*** Copyright Notice
Copyright (c) 1995, 1996 Xerox Corporation.
All Rights Reserved.
Use and copying of this software and preparation of derivative works based upon this software are permitted. Any copy of this software or of any derivative work must include the above copyright notice of Xerox Corporation, this paragraph and the one after it. Any distribution of this software or derivative works must comply with all applicable United States export control laws.
This software is made available AS IS, and XEROX CORPORATION DISCLAIMS ALL WARRANTIES, EXPRESS OR IMPLIED, INCLUDING WITHOUT LIMITATION THE IMPLIED WARRANTIES OF MERCHANTABILITY AND FITNESS FOR A PARTICULAR PURPOSE, AND NOTWITHSTANDING ANY OTHER PROVISION CONTAINED HEREIN, ANY LIABILITY FOR DAMAGES RESULTING FROM THE SOFTWARE OR ITS USE IS EXPRESSLY DISCLAIMED, WHETHER ARISING IN CONTRACT, TORT (INCLUDING NEGLIGENCE) OR STRICT LIABILITY, EVEN IF XEROX CORPORATION IS ADVISED OF THE POSSIBILITY OF SUCH DAMAGES.
*** Copyright Notice
Copyright (C) 1997-2001 Shigeru Chiba, Tokyo Institute of Technology.
Permission to use, copy, distribute and modify this software and its documentation for any purpose is hereby granted without fee, provided that the above copyright notice appear in all copies and that both that copyright notice and this permission notice appear in supporting documentation.
Shigeru Chiba makes no representations about the suitability of this software for any purpose. It is provided "as is" without express or implied warranty.
*** Copyright Notice
Permission to use, copy, distribute and modify this software and its documentation for any purpose is hereby granted without fee, provided that the above copyright notice appear in all copies and that both that copyright notice and this permission notice appear in supporting documentation. Other Contributors make no representations about the suitability of this software for any purpose. It is provided "as is" without express or implied warranty.
2001-2003 (C) Copyright by Other Contributors.
The LLVM compiler
PVS-Studio can use Clang as preprocessor. Read Clang/LLVM license:
==============================================================================
LLVM Release License
==============================================================================
University of Illinois/NCSA
Open Source License
Copyright (c) 2007-2011 University of Illinois at Urbana-Champaign.
All rights reserved.
Developed by:
LLVM Team
University of Illinois at Urbana-Champaign
http://llvm.org
Permission is hereby granted, free of charge, to any person obtaining a copy of this software and associated documentation files (the "Software"), to deal with the Software without restriction, including without limitation the rights to use, copy, modify, merge, publish, distribute, sublicense, and/or sell copies of the Software, and to permit persons to whom the Software is furnished to do so, subject to the following conditions:
* Redistributions of source code must retain the above copyright notice, this list of conditions and the following disclaimers.
* Redistributions in binary form must reproduce the above copyright notice, this list of conditions and the following disclaimers in the documentation and/or other materials provided with the distribution.
* Neither the names of the LLVM Team, University of Illinois at Urbana-Champaign, nor the names of its contributors may be used to endorse or promote products derived from this Software without specific prior written permission.
THE SOFTWARE IS PROVIDED "AS IS", WITHOUT WARRANTY OF ANY KIND, EXPRESS OR IMPLIED, INCLUDING BUT NOT LIMITED TO THE WARRANTIES OF MERCHANTABILITY, FITNESS FOR A PARTICULAR PURPOSE AND NONINFRINGEMENT. IN NO EVENT SHALL THE CONTRIBUTORS OR COPYRIGHT HOLDERS BE LIABLE FOR ANY CLAIM, DAMAGES OR OTHER LIABILITY, WHETHER IN AN ACTION OF CONTRACT, TORT OR OTHERWISE, ARISING FROM, OUT OF OR IN CONNECTION WITH THE SOFTWARE OR THE USE OR OTHER DEALINGS WITH THE SOFTWARE.
==============================================================================
The LLVM software contains code written by third parties. Such software will have its own individual LICENSE.TXT file in the directory in which it appears. This file will describe the copyrights, license, and restrictions which apply to that code.
The disclaimer of warranty in the University of Illinois Open Source License applies to all code in the LLVM Distribution, and nothing in any of the other licenses gives permission to use the names of the LLVM Team or the University of Illinois to endorse or promote products derived from this Software.
The following pieces of software have additional or alternate copyrights, licenses, and/or restrictions:
Program Directory
------- ---------
<none yet>
GNU C Library
PVS-Studio uses GNU C Library. GNU C Library is licensed under GNU LESSER GENERAL PUBLIC LICENSE Version 2.1. PVS-Studio provides object code in accordance with section 6.a of GNU LESSER GENERAL PUBLIC LICENSE. Bellow you can read GNU C Library License.
GNU LESSER GENERAL PUBLIC LICENSE
Version 2.1, February 1999
Copyright (C) 1991, 1999 Free Software Foundation, Inc.
51 Franklin Street, Fifth Floor, Boston, MA 02110-1301 USA
Everyone is permitted to copy and distribute verbatim copies
of this license document, but changing it is not allowed.
[This is the first released version of the Lesser GPL. It also counts
as the successor of the GNU Library Public License, version 2, hence
the version number 2.1.]
Preamble
The licenses for most software are designed to take away your freedom to share and change it. By contrast, the GNU General Public Licenses are intended to guarantee your freedom to share and change free software--to make sure the software is free for all its users.
This license, the Lesser General Public License, applies to some specially designated software packages--typically libraries--of the Free Software Foundation and other authors who decide to use it. You can use it too, but we suggest you first think carefully about whether this license or the ordinary General Public License is the better strategy to use in any particular case, based on the explanations below.
When we speak of free software, we are referring to freedom of use, not price. Our General Public Licenses are designed to make sure that you have the freedom to distribute copies of free software (and charge for this service if you wish); that you receive source code or can get it if you want it; that you can change the software and use pieces of it in new free programs; and that you are informed that you can do these things.
To protect your rights, we need to make restrictions that forbid distributors to deny you these rights or to ask you to surrender these rights. These restrictions translate to certain responsibilities for you if you distribute copies of the library or if you modify it.
For example, if you distribute copies of the library, whether gratis or for a fee, you must give the recipients all the rights that we gave you. You must make sure that they, too, receive or can get the source code. If you link other code with the library, you must provide complete object files to the recipients, so that they can relink them with the library after making changes to the library and recompiling it. And you must show them these terms so they know their rights.
We protect your rights with a two-step method: (1) we copyright the library, and (2) we offer you this license, which gives you legal permission to copy, distribute and/or modify the library.
To protect each distributor, we want to make it very clear that there is no warranty for the free library. Also, if the library is modified by someone else and passed on, the recipients should know that what they have is not the original version, so that the original author's reputation will not be affected by problems that might be introduced by others.
Finally, software patents pose a constant threat to the existence of any free program. We wish to make sure that a company cannot effectively restrict the users of a free program by obtaining a restrictive license from a patent holder. Therefore, we insist that any patent license obtained for a version of the library must be consistent with the full freedom of use specified in this license.
Most GNU software, including some libraries, is covered by the ordinary GNU General Public License. This license, the GNU Lesser General Public License, applies to certain designated libraries, and is quite different from the ordinary General Public License. We use this license for certain libraries in order to permit linking those libraries into non-free programs.
When a program is linked with a library, whether statically or using a shared library, the combination of the two is legally speaking a combined work, a derivative of the original library. The ordinary General Public License therefore permits such linking only if the entire combination fits its criteria of freedom. The Lesser General Public License permits more lax criteria for linking other code with the library.
We call this license the "Lesser" General Public License because it does Less to protect the user's freedom than the ordinary General Public License. It also provides other free software developers Less of an advantage over competing non-free programs. These disadvantages are the reason we use the ordinary General Public License for many libraries. However, the Lesser license provides advantages in certain special circumstances.
For example, on rare occasions, there may be a special need to encourage the widest possible use of a certain library, so that it becomes a de-facto standard. To achieve this, non-free programs must be allowed to use the library. A more frequent case is that a free library does the same job as widely used non-free libraries. In this case, there is little to gain by limiting the free library to free software only, so we use the Lesser General Public License.
In other cases, permission to use a particular library in non-free programs enables a greater number of people to use a large body of free software. For example, permission to use the GNU C Library in non-free programs enables many more people to use the whole GNU operating system, as well as its variant, the GNU/Linux operating system.
Although the Lesser General Public License is Less protective of the users' freedom, it does ensure that the user of a program that is linked with the Library has the freedom and the wherewithal to run that program using a modified version of the Library.
The precise terms and conditions for copying, distribution and modification follow. Pay close attention to the difference between a "work based on the library" and a "work that uses the library". The former contains code derived from the library, whereas the latter must be combined with the library in order to run.
TERMS AND CONDITIONS FOR COPYING, DISTRIBUTION AND MODIFICATION
0. This License Agreement applies to any software library or other program which contains a notice placed by the copyright holder or other authorized party saying it may be distributed under the terms of this Lesser General Public License (also called "this License"). Each licensee is addressed as "you".
A "library" means a collection of software functions and/or data prepared so as to be conveniently linked with application programs (which use some of those functions and data) to form executables.
The "Library", below, refers to any such software library or work which has been distributed under these terms. A "work based on the Library" means either the Library or any derivative work under copyright law: that is to say, a work containing the Library or a portion of it, either verbatim or with modifications and/or translated straightforwardly into another language. (Hereinafter, translation is included without limitation in the term "modification".)
"Source code" for a work means the preferred form of the work for making modifications to it. For a library, complete source code means all the source code for all modules it contains, plus any associated interface definition files, plus the scripts used to control compilation and installation of the library.
Activities other than copying, distribution and modification are not covered by this License; they are outside its scope. The act of running a program using the Library is not restricted, and output from such a program is covered only if its contents constitute a work based on the Library (independent of the use of the Library in a tool for writing it). Whether that is true depends on what the Library does and what the program that uses the Library does.
1. You may copy and distribute verbatim copies of the Library's complete source code as you receive it, in any medium, provided that you conspicuously and appropriately publish on each copy an appropriate copyright notice and disclaimer of warranty; keep intact all the notices that refer to this License and to the absence of any warranty; and distribute a copy of this License along with the Library.
You may charge a fee for the physical act of transferring a copy, and you may at your option offer warranty protection in exchange for a fee.
2. You may modify your copy or copies of the Library or any portion of it, thus forming a work based on the Library, and copy and distribute such modifications or work under the terms of Section 1 above, provided that you also meet all of these conditions:
a) The modified work must itself be a software library.
b) You must cause the files modified to carry prominent notices stating that you changed the files and the date of any change.
c) You must cause the whole of the work to be licensed at no charge to all third parties under the terms of this License.
d) If a facility in the modified Library refers to a function or a table of data to be supplied by an application program that uses the facility, other than as an argument passed when the facility is invoked, then you must make a good faith effort to ensure that, in the event an application does not supply such function or table, the facility still operates, and performs whatever part of its purpose remains meaningful.
(For example, a function in a library to compute square roots has a purpose that is entirely well-defined independent of the application. Therefore, Subsection 2d requires that any application-supplied function or table used by this function must be optional: if the application does not supply it, the square root function must still compute square roots.)
These requirements apply to the modified work as a whole. If identifiable sections of that work are not derived from the Library, and can be reasonably considered independent and separate works in themselves, then this License, and its terms, do not apply to those sections when you distribute them as separate works. But when you distribute the same sections as part of a whole which is a work based on the Library, the distribution of the whole must be on the terms of this License, whose permissions for other licensees extend to the entire whole, and thus to each and every part regardless of who wrote it.
Thus, it is not the intent of this section to claim rights or contest your rights to work written entirely by you; rather, the intent is to exercise the right to control the distribution of derivative or collective works based on the Library.
In addition, mere aggregation of another work not based on the Library with the Library (or with a work based on the Library) on a volume of a storage or distribution medium does not bring the other work under the scope of this License.
3. You may opt to apply the terms of the ordinary GNU General Public License instead of this License to a given copy of the Library. To do this, you must alter all the notices that refer to this License, so that they refer to the ordinary GNU General Public License, version 2, instead of to this License. (If a newer version than version 2 of the ordinary GNU General Public License has appeared, then you can specify that version instead if you wish.) Do not make any other change in these notices.
Once this change is made in a given copy, it is irreversible for that copy, so the ordinary GNU General Public License applies to all subsequent copies and derivative works made from that copy.
This option is useful when you wish to copy part of the code of the Library into a program that is not a library.
4. You may copy and distribute the Library (or a portion or derivative of it, under Section 2) in object code or executable form under the terms of Sections 1 and 2 above provided that you accompany it with the complete corresponding machine-readable source code, which must be distributed under the terms of Sections 1 and 2 above on a medium customarily used for software interchange.
If distribution of object code is made by offering access to copy from a designated place, then offering equivalent access to copy the source code from the same place satisfies the requirement to distribute the source code, even though third parties are not compelled to copy the source along with the object code.
5. A program that contains no derivative of any portion of the Library, but is designed to work with the Library by being compiled or linked with it, is called a "work that uses the Library". Such a work, in isolation, is not a derivative work of the Library, and therefore falls outside the scope of this License.
However, linking a "work that uses the Library" with the Library creates an executable that is a derivative of the Library (because it contains portions of the Library), rather than a "work that uses the library". The executable is therefore covered by this License. Section 6 states terms for distribution of such executables.
When a "work that uses the Library" uses material from a header file that is part of the Library, the object code for the work may be a derivative work of the Library even though the source code is not. Whether this is true is especially significant if the work can be linked without the Library, or if the work is itself a library. The threshold for this to be true is not precisely defined by law.
If such an object file uses only numerical parameters, data structure layouts and accessors, and small macros and small inline functions (ten lines or less in length), then the use of the object file is unrestricted, regardless of whether it is legally a derivative work. (Executables containing this object code plus portions of the Library will still fall under Section 6.)
Otherwise, if the work is a derivative of the Library, you may distribute the object code for the work under the terms of Section 6. Any executables containing that work also fall under Section 6, whether or not they are linked directly with the Library itself.
6. As an exception to the Sections above, you may also combine or link a "work that uses the Library" with the Library to produce a work containing portions of the Library, and distribute that work under terms of your choice, provided that the terms permit modification of the work for the customer's own use and reverse engineering for debugging such modifications.
You must give prominent notice with each copy of the work that the Library is used in it and that the Library and its use are covered by this License. You must supply a copy of this License. If the work during execution displays copyright notices, you must include the copyright notice for the Library among them, as well as a reference directing the user to the copy of this License. Also, you must do one of these things:
a) Accompany the work with the complete corresponding machine-readable source code for the Library including whatever changes were used in the work (which must be distributed under Sections 1 and 2 above); and, if the work is an executable linked with the Library, with the complete machine-readable "work that uses the Library", as object code and/or source code, so that the user can modify the Library and then relink to produce a modified executable containing the modified Library. (It is understood that the user who changes the contents of definitions files in the Library will not necessarily be able to recompile the application to use the modified definitions.)
b) Use a suitable shared library mechanism for linking with the Library. A suitable mechanism is one that (1) uses at run time a copy of the library already present on the user's computer system, rather than copying library functions into the executable, and (2) will operate properly with a modified version of the library, if the user installs one, as long as the modified version is interface-compatible with the version that the work was made with.
c) Accompany the work with a written offer, valid for at least three years, to give the same user the materials specified in Subsection 6a, above, for a charge no more than the cost of performing this distribution.
d) If distribution of the work is made by offering access to copy from a designated place, offer equivalent access to copy the above specified materials from the same place.
e) Verify that the user has already received a copy of these materials or that you have already sent this user a copy.
For an executable, the required form of the "work that uses the Library" must include any data and utility programs needed for reproducing the executable from it. However, as a special exception, the materials to be distributed need not include anything that is normally distributed (in either source or binary form) with the major components (compiler, kernel, and so on) of the operating system on which the executable runs, unless that component itself accompanies the executable.
It may happen that this requirement contradicts the license restrictions of other proprietary libraries that do not normally accompany the operating system. Such a contradiction means you cannot use both them and the Library together in an executable that you distribute.
7. You may place library facilities that are a work based on the Library side-by-side in a single library together with other library facilities not covered by this License, and distribute such a combined library, provided that the separate distribution of the work based on the Library and of the other library facilities is otherwise permitted, and provided that you do these two things:
a) Accompany the combined library with a copy of the same work based on the Library, uncombined with any other library facilities. This must be distributed under the terms of the Sections above.
b) Give prominent notice with the combined library of the fact that part of it is a work based on the Library, and explaining where to find the accompanying uncombined form of the same work.
8. You may not copy, modify, sublicense, link with, or distribute the Library except as expressly provided under this License. Any attempt otherwise to copy, modify, sublicense, link with, or distribute the Library is void, and will automatically terminate your rights under this License. However, parties who have received copies, or rights, from you under this License will not have their licenses terminated so long as such parties remain in full compliance.
9. You are not required to accept this License, since you have not signed it. However, nothing else grants you permission to modify or distribute the Library or its derivative works. These actions are prohibited by law if you do not accept this License. Therefore, by modifying or distributing the Library (or any work based on the Library), you indicate your acceptance of this License to do so, and all its terms and conditions for copying, distributing or modifying the Library or works based on it.
10. Each time you redistribute the Library (or any work based on the Library), the recipient automatically receives a license from the original licensor to copy, distribute, link with or modify the Library subject to these terms and conditions. You may not impose any further restrictions on the recipients' exercise of the rights granted herein. You are not responsible for enforcing compliance by third parties with this License.
11. If, as a consequence of a court judgment or allegation of patent infringement or for any other reason (not limited to patent issues), conditions are imposed on you (whether by court order, agreement or otherwise) that contradict the conditions of this License, they do not excuse you from the conditions of this License. If you cannot distribute so as to satisfy simultaneously your obligations under this License and any other pertinent obligations, then as a consequence you may not distribute the Library at all. For example, if a patent license would not permit royalty-free redistribution of the Library by all those who receive copies directly or indirectly through you, then the only way you could satisfy both it and this License would be to refrain entirely from distribution of the Library.
If any portion of this section is held invalid or unenforceable under any particular circumstance, the balance of the section is intended to apply, and the section as a whole is intended to apply in other circumstances.
It is not the purpose of this section to induce you to infringe any patents or other property right claims or to contest validity of any such claims; this section has the sole purpose of protecting the integrity of the free software distribution system which is implemented by public license practices. Many people have made generous contributions to the wide range of software distributed through that system in reliance on consistent application of that system; it is up to the author/donor to decide if he or she is willing to distribute software through any other system and a licensee cannot impose that choice.
This section is intended to make thoroughly clear what is believed to be a consequence of the rest of this License.
12. If the distribution and/or use of the Library is restricted in certain countries either by patents or by copyrighted interfaces, the original copyright holder who places the Library under this License may add an explicit geographical distribution limitation excluding those countries, so that distribution is permitted only in or among countries not thus excluded. In such case, this License incorporates the limitation as if written in the body of this License.
13. The Free Software Foundation may publish revised and/or new versions of the Lesser General Public License from time to time. Such new versions will be similar in spirit to the present version, but may differ in detail to address new problems or concerns.
Each version is given a distinguishing version number. If the Library specifies a version number of this License which applies to it and "any later version", you have the option of following the terms and conditions either of that version or of any later version published by the Free Software Foundation. If the Library does not specify a license version number, you may choose any version ever published by the Free Software Foundation.
14. If you wish to incorporate parts of the Library into other free programs whose distribution conditions are incompatible with these, write to the author to ask for permission. For software which is copyrighted by the Free Software Foundation, write to the Free Software Foundation; we sometimes make exceptions for this. Our decision will be guided by the two goals of preserving the free status of all derivatives of our free software and of promoting the sharing and reuse of software generally.
NO WARRANTY
15. BECAUSE THE LIBRARY IS LICENSED FREE OF CHARGE, THERE IS NO WARRANTY FOR THE LIBRARY, TO THE EXTENT PERMITTED BY APPLICABLE LAW. EXCEPT WHEN OTHERWISE STATED IN WRITING THE COPYRIGHT HOLDERS AND/OR OTHER PARTIES PROVIDE THE LIBRARY "AS IS" WITHOUT WARRANTY OF ANY KIND, EITHER EXPRESSED OR IMPLIED, INCLUDING, BUT NOT LIMITED TO, THE IMPLIED WARRANTIES OF MERCHANTABILITY AND FITNESS FOR A PARTICULAR PURPOSE. THE ENTIRE RISK AS TO THE QUALITY AND PERFORMANCE OF THE LIBRARY IS WITH YOU. SHOULD THE LIBRARY PROVE DEFECTIVE, YOU ASSUME THE COST OF ALL NECESSARY SERVICING, REPAIR OR CORRECTION.
16. IN NO EVENT UNLESS REQUIRED BY APPLICABLE LAW OR AGREED TO IN WRITING WILL ANY COPYRIGHT HOLDER, OR ANY OTHER PARTY WHO MAY MODIFY AND/OR REDISTRIBUTE THE LIBRARY AS PERMITTED ABOVE, BE LIABLE TO YOU FOR DAMAGES, INCLUDING ANY GENERAL, SPECIAL, INCIDENTAL OR CONSEQUENTIAL DAMAGES ARISING OUT OF THE USE OR INABILITY TO USE THE LIBRARY (INCLUDING BUT NOT LIMITED TO LOSS OF DATA OR DATA BEING RENDERED INACCURATE OR LOSSES SUSTAINED BY YOU OR THIRD PARTIES OR A FAILURE OF THE LIBRARY TO OPERATE WITH ANY OTHER SOFTWARE), EVEN IF SUCH HOLDER OR OTHER PARTY HAS BEEN ADVISED OF THE POSSIBILITY OF SUCH DAMAGES.
END OF TERMS AND CONDITIONS
JSON for Modern C++
MIT License
Copyright (c) 2013-2017 Niels Lohmann
Permission is hereby granted, free of charge, to any person obtaining a copy of this software and associated documentation files (the "Software"), to deal in the Software without restriction, including without limitation the rights to use, copy, modify, merge, publish, distribute, sublicense, and/or sell copies of the Software, and to permit persons to whom the Software is furnished to do so, subject to the following conditions:
The above copyright notice and this permission notice shall be included in all copies or substantial portions of the Software.
THE SOFTWARE IS PROVIDED "AS IS", WITHOUT WARRANTY OF ANY KIND, EXPRESS OR IMPLIED, INCLUDING BUT NOT LIMITED TO THE WARRANTIES OF MERCHANTABILITY, FITNESS FOR A PARTICULAR PURPOSE AND NONINFRINGEMENT. IN NO EVENT SHALL THE AUTHORS OR COPYRIGHT HOLDERS BE LIABLE FOR ANY CLAIM, DAMAGES OR OTHER LIABILITY, WHETHER IN AN ACTION OF CONTRACT, TORT OR OTHERWISE, ARISING FROM, OUT OF OR IN CONNECTION WITH THE SOFTWARE OR THE USE OR OTHER DEALINGS IN THE SOFTWARE.
Taywee/args C++ library
MIT License
Copyright (c) 2016-2017 Taylor C. Richberger <taywee@gmx.com> and Pavel Belikov
Permission is hereby granted, free of charge, to any person obtaining a copy of this software and associated documentation files (the "Software"), to deal in the Software without restriction, including without limitation the rights to use, copy, modify, merge, publish, distribute, sublicense, and/or sell copies of the Software, and to permit persons to whom the Software is furnished to do so, subject to the following conditions:
The above copyright notice and this permission notice shall be included in all copies or substantial portions of the Software.
THE SOFTWARE IS PROVIDED "AS IS", WITHOUT WARRANTY OF ANY KIND, EXPRESS OR IMPLIED, INCLUDING BUT NOT LIMITED TO THE WARRANTIES OF MERCHANTABILITY, FITNESS FOR A PARTICULAR PURPOSE AND NONINFRINGEMENT. IN NO EVENT SHALL THE AUTHORS OR COPYRIGHT HOLDERS BE LIABLE FOR ANY CLAIM, DAMAGES OR OTHER LIABILITY, WHETHER IN AN ACTION OF CONTRACT, TORT OR OTHERWISE, ARISING FROM, OUT OF OR IN CONNECTION WITH THE SOFTWARE OR THE USE OR OTHER DEALINGS IN THE SOFTWARE.
CED C++ library
PVS-Studio uses Compact Encoding Detection C++ library. Bellow you can read CED License.
Apache License
Version 2.0, January 2004
http://www.apache.org/licenses/
TERMS AND CONDITIONS FOR USE, REPRODUCTION, AND DISTRIBUTION
1. Definitions.
"License" shall mean the terms and conditions for use, reproduction, and distribution as defined by Sections 1 through 9 of this document.
"Licensor" shall mean the copyright owner or entity authorized by the copyright owner that is granting the License.
"Legal Entity" shall mean the union of the acting entity and all other entities that control, are controlled by, or are under common control with that entity. For the purposes of this definition, "control" means (i) the power, direct or indirect, to cause the direction or management of such entity, whether by contract or otherwise, or (ii) ownership of fifty percent (50%) or more of the outstanding shares, or (iii) beneficial ownership of such entity.
"You" (or "Your") shall mean an individual or Legal Entity exercising permissions granted by this License.
"Source" form shall mean the preferred form for making modifications, including but not limited to software source code, documentation source, and configuration files.
"Object" form shall mean any form resulting from mechanical transformation or translation of a Source form, including but not limited to compiled object code, generated documentation, and conversions to other media types.
"Work" shall mean the work of authorship, whether in Source or Object form, made available under the License, as indicated by a copyright notice that is included in or attached to the work (an example is provided in the Appendix below).
"Derivative Works" shall mean any work, whether in Source or Object form, that is based on (or derived from) the Work and for which the editorial revisions, annotations, elaborations, or other modifications represent, as a whole, an original work of authorship. For the purposes of this License, Derivative Works shall not include works that remain separable from, or merely link (or bind by name) to the interfaces of, the Work and Derivative Works thereof.
"Contribution" shall mean any work of authorship, including the original version of the Work and any modifications or additions to that Work or Derivative Works thereof, that is intentionally submitted to Licensor for inclusion in the Work by the copyright owner or by an individual or Legal Entity authorized to submit on behalf of the copyright owner. For the purposes of this definition, "submitted" means any form of electronic, verbal, or written communication sent to the Licensor or its representatives, including but not limited to communication on electronic mailing lists, source code control systems, and issue tracking systems that are managed by, or on behalf of, the Licensor for the purpose of discussing and improving the Work, but excluding communication that is conspicuously marked or otherwise designated in writing by the copyright owner as "Not a Contribution."
"Contributor" shall mean Licensor and any individual or Legal Entity on behalf of whom a Contribution has been received by Licensor and subsequently incorporated within the Work.
2. Grant of Copyright License. Subject to the terms and conditions of this License, each Contributor hereby grants to You a perpetual, worldwide, non-exclusive, no-charge, royalty-free, irrevocable copyright license to reproduce, prepare Derivative Works of, publicly display, publicly perform, sublicense, and distribute the Work and such Derivative Works in Source or Object form.
3. Grant of Patent License. Subject to the terms and conditions of this License, each Contributor hereby grants to You a perpetual, worldwide, non-exclusive, no-charge, royalty-free, irrevocable (except as stated in this section) patent license to make, have made, use, offer to sell, sell, import, and otherwise transfer the Work, where such license applies only to those patent claims licensable by such Contributor that are necessarily infringed by their Contribution(s) alone or by combination of their Contribution(s) with the Work to which such Contribution(s) was submitted. If You institute patent litigation against any entity (including a cross-claim or counterclaim in a lawsuit) alleging that the Work or a Contribution incorporated within the Work constitutes direct or contributory patent infringement, then any patent licenses granted to You under this License for that Work shall terminate as of the date such litigation is filed.
4. Redistribution. You may reproduce and distribute copies of the Work or Derivative Works thereof in any medium, with or without modifications, and in Source or Object form, provided that You meet the following conditions:
(a) You must give any other recipients of the Work or Derivative Works a copy of this License; and
(b) You must cause any modified files to carry prominent notices stating that You changed the files; and
(c) You must retain, in the Source form of any Derivative Works that You distribute, all copyright, patent, trademark, and attribution notices from the Source form of the Work, excluding those notices that do not pertain to any part of the Derivative Works; and
(d) If the Work includes a "NOTICE" text file as part of its distribution, then any Derivative Works that You distribute must include a readable copy of the attribution notices contained within such NOTICE file, excluding those notices that do not pertain to any part of the Derivative Works, in at least one of the following places: within a NOTICE text file distributed as part of the Derivative Works; within the Source form or documentation, if provided along with the Derivative Works; or, within a display generated by the Derivative Works, if and wherever such third-party notices normally appear. The contents of the NOTICE file are for informational purposes only and do not modify the License. You may add Your own attribution notices within Derivative Works that You distribute, alongside or as an addendum to the NOTICE text from the Work, provided that such additional attribution notices cannot be construed as modifying the License.
You may add Your own copyright statement to Your modifications and may provide additional or different license terms and conditions for use, reproduction, or distribution of Your modifications, or for any such Derivative Works as a whole, provided Your use, reproduction, and distribution of the Work otherwise complies with the conditions stated in this License.
5. Submission of Contributions. Unless You explicitly state otherwise, any Contribution intentionally submitted for inclusion in the Work by You to the Licensor shall be under the terms and conditions of this License, without any additional terms or conditions. Notwithstanding the above, nothing herein shall supersede or modify the terms of any separate license agreement you may have executed with Licensor regarding such Contributions.
6. Trademarks. This License does not grant permission to use the trade names, trademarks, service marks, or product names of the Licensor, except as required for reasonable and customary use in describing the origin of the Work and reproducing the content of the NOTICE file.
7. Disclaimer of Warranty. Unless required by applicable law or agreed to in writing, Licensor provides the Work (and each Contributor provides its Contributions) on an "AS IS" BASIS, WITHOUT WARRANTIES OR CONDITIONS OF ANY KIND, either express or implied, including, without limitation, any warranties or conditions of TITLE, NON-INFRINGEMENT, MERCHANTABILITY, or FITNESS FOR A PARTICULAR PURPOSE. You are solely responsible for determining the appropriateness of using or redistributing the Work and assume any risks associated with Your exercise of permissions under this License.
8. Limitation of Liability. In no event and under no legal theory, whether in tort (including negligence), contract, or otherwise, unless required by applicable law (such as deliberate and grossly negligent acts) or agreed to in writing, shall any Contributor be liable to You for damages, including any direct, indirect, special, incidental, or consequential damages of any character arising as a result of this License or out of the use or inability to use the Work (including but not limited to damages for loss of goodwill, work stoppage, computer failure or malfunction, or any and all other commercial damages or losses), even if such Contributor has been advised of the possibility of such damages.
9. Accepting Warranty or Additional Liability. While redistributing the Work or Derivative Works thereof, You may choose to offer, and charge a fee for, acceptance of support, warranty, indemnity, or other liability obligations and/or rights consistent with this License. However, in accepting such obligations, You may act only on Your own behalf and on Your sole responsibility, not on behalf of any other Contributor, and only if You agree to indemnify, defend, and hold each Contributor harmless for any liability incurred by, or claims asserted against, such Contributor by reason of your accepting any such warranty or additional liability.
END OF TERMS AND CONDITIONS
APPENDIX: How to apply the Apache License to your work.
To apply the Apache License to your work, attach the following boilerplate notice, with the fields enclosed by brackets "[]" replaced with your own identifying information. (Don't include the brackets!) The text should be enclosed in the appropriate comment syntax for the file format. We also recommend that a file or class name and description of purpose be included on the same "printed page" as the copyright notice for easier identification within third-party archives.
Copyright [yyyy] [name of copyright owner]
Licensed under the Apache License, Version 2.0 (the "License"); you may not use this file except in compliance with the License. You may obtain a copy of the License at
http://www.apache.org/licenses/LICENSE-2.0
Unless required by applicable law or agreed to in writing, software distributed under the License is distributed on an "AS IS" BASIS, WITHOUT WARRANTIES OR CONDITIONS OF ANY KIND, either express or implied. See the License for the specific language governing permissions and limitations under the License.
Scintilla
ScintillaNET uses Scintilla. This is Scintilla license:
License for Scintilla and SciTE
Copyright 1998-2003 by Neil Hodgson <neilh@scintilla.org>
All Rights Reserved
Permission to use, copy, modify, and distribute this software and its documentation for any purpose and without fee is hereby granted, provided that the above copyright notice appear in all copies and that both that copyright notice and this permission notice appear in supporting documentation.
NEIL HODGSON DISCLAIMS ALL WARRANTIES WITH REGARD TO THIS SOFTWARE, INCLUDING ALL IMPLIED WARRANTIES OF MERCHANTABILITY AND FITNESS, IN NO EVENT SHALL NEIL HODGSON BE LIABLE FOR ANY SPECIAL, INDIRECT OR CONSEQUENTIAL DAMAGES OR ANY DAMAGES WHATSOEVER RESULTING FROM LOSS OF USE, DATA OR PROFITS, WHETHER IN AN ACTION OF CONTRACT, NEGLIGENCE OR OTHER TORTIOUS ACTION, ARISING OUT OF OR IN CONNECTION WITH THE USE OR PERFORMANCE OF THIS SOFTWARE.
C#
SourceGrid control
PVS-Studio uses SourceGrid control (sourcegrid.codeplex.com). Bellow you can read Source Grid License.
SourceGrid LICENSE (MIT style)
Copyright (c) 2009 Davide Icardi
Permission is hereby granted, free of charge, to any person obtaining a copy of this software and associated documentation files (the "Software"), to deal in the Software without restriction, including without limitation the rights to use, copy, modify, merge, publish, distribute, sublicense, and/or sell copies of the Software, and to permit persons to whom the Software is furnished to do so, subject to the following conditions:
The above copyright notice and this permission notice shall be included in all copies or substantial portions of the Software.
THE SOFTWARE IS PROVIDED "AS IS", WITHOUT WARRANTY OF ANY KIND, EXPRESS OR IMPLIED, INCLUDING BUT NOT LIMITED TO THE WARRANTIES OF MERCHANTABILITY, FITNESS FOR A PARTICULAR PURPOSE AND NONINFRINGEMENT. IN NO EVENT SHALL THE AUTHORS OR COPYRIGHT HOLDERS BE LIABLE FOR ANY CLAIM, DAMAGES OR OTHER LIABILITY, WHETHER IN AN ACTION OF CONTRACT, TORT OR OTHERWISE, ARISING FROM, OUT OF OR IN CONNECTION WITH THE SOFTWARE OR THE USE OR OTHER DEALINGS IN THE SOFTWARE.
ScintillaNET control
C and C++ Compiler Monitoring UI uses ScintillaNET. This is ScintillaNET license:
The MIT License (MIT)
Copyright (c) 2017, Jacob Slusser, https://github.com/jacobslusser
Permission is hereby granted, free of charge, to any person obtaining a copy of this software and associated documentation files (the "Software"), to deal in the Software without restriction, including without limitation the rights to use, copy, modify, merge, publish, distribute, sublicense, and/or sell copies of the Software, and to permit persons to whom the Software is furnished to do so, subject to the following conditions:
The above copyright notice and this permission notice shall be included in all copies or substantial portions of the Software.
THE SOFTWARE IS PROVIDED "AS IS", WITHOUT WARRANTY OF ANY KIND, EXPRESS OR IMPLIED, INCLUDING BUT NOT LIMITED TO THE WARRANTIES OF MERCHANTABILITY, FITNESS FOR A PARTICULAR PURPOSE AND NONINFRINGEMENT. IN NO EVENT SHALL THE AUTHORS OR COPYRIGHT HOLDERS BE LIABLE FOR ANY CLAIM, DAMAGES OR OTHER LIABILITY, WHETHER IN AN ACTION OF CONTRACT, TORT OR OTHERWISE, ARISING FROM, OUT OF OR IN CONNECTION WITH THE SOFTWARE OR THE USE OR OTHER DEALINGS IN THE SOFTWARE.
ScintillaNET-FindReplaceDialog
C and C++ Compiler Monitoring UI uses ScintillaNet-FindReplaceDialog. This is ScintillaNet-FindReplaceDialog license:
MIT License
Copyright (c) 2017 Steve Towner
Permission is hereby granted, free of charge, to any person obtaining a copy of this software and associated documentation files (the "Software"), to deal in the Software without restriction, including without limitation the rights to use, copy, modify, merge, publish, distribute, sublicense, and/or sell copies of the Software, and to permit persons to whom the Software is furnished to do so, subject to the following conditions:
The above copyright notice and this permission notice shall be included in all copies or substantial portions of the Software.
THE SOFTWARE IS PROVIDED "AS IS", WITHOUT WARRANTY OF ANY KIND, EXPRESS OR IMPLIED, INCLUDING BUT NOT LIMITED TO THE WARRANTIES OF MERCHANTABILITY, FITNESS FOR A PARTICULAR PURPOSE AND NONINFRINGEMENT. IN NO EVENT SHALL THE AUTHORS OR COPYRIGHT HOLDERS BE LIABLE FOR ANY CLAIM, DAMAGES OR OTHER LIABILITY, WHETHER IN AN ACTION OF CONTRACT, TORT OR OTHERWISE, ARISING FROM, OUT OF OR IN CONNECTION WITH THE SOFTWARE OR THE USE OR OTHER DEALINGS IN THE SOFTWARE.
DockPanel Suite library
C and C++ Compiler Monitoring UI uses DockPanel_Suite. This is DockPanel_Suite license:
The MIT License
Copyright (c) 2007 Weifen Luo (email: weifenluo@yahoo.com)
Permission is hereby granted, free of charge, to any person obtaining a copy of this software and associated documentation files (the "Software"), to deal in the Software without restriction, including without limitation the rights to use, copy, modify, merge, publish, distribute, sublicense, and/or sell copies of the Software, and to permit persons to whom the Software is furnished to do so, subject to the following conditions:
The above copyright notice and this permission notice shall be included in all copies or substantial portions of the Software.
THE SOFTWARE IS PROVIDED "AS IS", WITHOUT WARRANTY OF ANY KIND, EXPRESS OR IMPLIED, INCLUDING BUT NOT LIMITED TO THE WARRANTIES OF MERCHANTABILITY, FITNESS FOR A PARTICULAR PURPOSE AND NONINFRINGEMENT. IN NO EVENT SHALL THE AUTHORS OR COPYRIGHT HOLDERS BE LIABLE FOR ANY CLAIM, DAMAGES OR OTHER LIABILITY, WHETHER IN AN ACTION OF CONTRACT, TORT OR OTHERWISE, ARISING FROM, OUT OF OR IN CONNECTION WITH THE SOFTWARE OR THE USE OR OTHER DEALINGS IN THE SOFTWARE.
PVS-Studio uses Font Awesome. Bellow you can read Font Awesome License.
This Font Software is licensed under the SIL Open Font License, Version 1.1.
This license is copied below, and is also available with a FAQ at:
http://scripts.sil.org/OFL
-----------------------------------------------------------
SIL OPEN FONT LICENSE Version 1.1 - 26 February 2007
-----------------------------------------------------------
PREAMBLE
The goals of the Open Font License (OFL) are to stimulate worldwide development of collaborative font projects, to support the font creation efforts of academic and linguistic communities, and to provide a free and open framework in which fonts may be shared and improved in partnership with others.
The OFL allows the licensed fonts to be used, studied, modified and redistributed freely as long as they are not sold by themselves. The fonts, including any derivative works, can be bundled, embedded, redistributed and/or sold with any software provided that any reserved names are not used by derivative works. The fonts and derivatives, however, cannot be released under any other type of license. The requirement for fonts to remain under this license does not apply to any document created using the fonts or their derivatives.
DEFINITIONS
"Font Software" refers to the set of files released by the Copyright Holder(s) under this license and clearly marked as such. This may include source files, build scripts and documentation. "Reserved Font Name" refers to any names specified as such after the copyright statement(s).
"Original Version" refers to the collection of Font Software components as distributed by the Copyright Holder(s).
"Modified Version" refers to any derivative made by adding to, deleting, or substituting -- in part or in whole -- any of the components of the Original Version, by changing formats or by porting the Font Software to a new environment.
"Author" refers to any designer, engineer, programmer, technical writer or other person who contributed to the Font Software.
PERMISSION & CONDITIONS
Permission is hereby granted, free of charge, to any person obtaining a copy of the Font Software, to use, study, copy, merge, embed, modify, redistribute, and sell modified and unmodified copies of the Font Software, subject to the following conditions:
1) Neither the Font Software nor any of its individual components, in Original or Modified Versions, may be sold by itself.
2) Original or Modified Versions of the Font Software may be bundled, redistributed and/or sold with any software, provided that each copy contains the above copyright notice and this license. These can be included either as stand-alone text files, human-readable headers or in the appropriate machine-readable metadata fields within text or binary files as long as those fields can be easily viewed by the user.
3) No Modified Version of the Font Software may use the Reserved Font Name(s) unless explicit written permission is granted by the corresponding Copyright Holder. This restriction only applies to the primary font name as presented to the users.
4) The name(s) of the Copyright Holder(s) or the Author(s) of the Font Software shall not be used to promote, endorse or advertise any Modified Version, except to acknowledge the contribution(s) of the Copyright Holder(s) and the Author(s) or with their explicit written permission.
5) The Font Software, modified or unmodified, in part or in whole, must be distributed entirely under this license, and must not be distributed under any other license. The requirement for fonts to remain under this license does not apply to any document created using the Font Software.
TERMINATION
This license becomes null and void if any of the above conditions are not met.
DISCLAIMER
THE FONT SOFTWARE IS PROVIDED "AS IS", WITHOUT WARRANTY OF ANY KIND, EXPRESS OR IMPLIED, INCLUDING BUT NOT LIMITED TO ANY WARRANTIES OF MERCHANTABILITY, FITNESS FOR A PARTICULAR PURPOSE AND NONINFRINGEMENT OF COPYRIGHT, PATENT, TRADEMARK, OR OTHER RIGHT. IN NO EVENT SHALL THE COPYRIGHT HOLDER BE LIABLE FOR ANY CLAIM, DAMAGES OR OTHER LIABILITY, INCLUDING ANY GENERAL, SPECIAL, INDIRECT, INCIDENTAL, OR CONSEQUENTIAL DAMAGES, WHETHER IN AN ACTION OF CONTRACT, TORT OR OTHERWISE, ARISING FROM, OUT OF THE USE OR INABILITY TO USE THE FONT SOFTWARE OR FROM OTHER DEALINGS IN THE FONT SOFTWARE.
The .NET Compiler Platform ("Roslyn")
PVS-Studio uses Roslyn. This is Roslyn license:
Apache License
Version 2.0, January 2004
http://www.apache.org/licenses/
TERMS AND CONDITIONS FOR USE, REPRODUCTION, AND DISTRIBUTION
1. Definitions.
"License" shall mean the terms and conditions for use, reproduction, and distribution as defined by Sections 1 through 9 of this document.
"Licensor" shall mean the copyright owner or entity authorized by the copyright owner that is granting the License.
"Legal Entity" shall mean the union of the acting entity and all other entities that control, are controlled by, or are under common control with that entity. For the purposes of this definition, "control" means (i) the power, direct or indirect, to cause the direction or management of such entity, whether by contract or otherwise, or (ii) ownership of fifty percent (50%) or more of the outstanding shares, or (iii) beneficial ownership of such entity.
"You" (or "Your") shall mean an individual or Legal Entity exercising permissions granted by this License.
"Source" form shall mean the preferred form for making modifications, including but not limited to software source code, documentation source, and configuration files.
"Object" form shall mean any form resulting from mechanical transformation or translation of a Source form, including but not limited to compiled object code, generated documentation, and conversions to other media types.
"Work" shall mean the work of authorship, whether in Source or Object form, made available under the License, as indicated by a copyright notice that is included in or attached to the work (an example is provided in the Appendix below).
"Derivative Works" shall mean any work, whether in Source or Object form, that is based on (or derived from) the Work and for which the editorial revisions, annotations, elaborations, or other modifications represent, as a whole, an original work of authorship. For the purposes of this License, Derivative Works shall not include works that remain separable from, or merely link (or bind by name) to the interfaces of, the Work and Derivative Works thereof.
"Contribution" shall mean any work of authorship, including the original version of the Work and any modifications or additions to that Work or Derivative Works thereof, that is intentionally submitted to Licensor for inclusion in the Work by the copyright owner or by an individual or Legal Entity authorized to submit on behalf of the copyright owner. For the purposes of this definition, "submitted" means any form of electronic, verbal, or written communication sent to the Licensor or its representatives, including but not limited to communication on electronic mailing lists, source code control systems, and issue tracking systems that are managed by, or on behalf of, the Licensor for the purpose of discussing and improving the Work, but excluding communication that is conspicuously marked or otherwise designated in writing by the copyright owner as "Not a Contribution."
"Contributor" shall mean Licensor and any individual or Legal Entity on behalf of whom a Contribution has been received by Licensor and subsequently incorporated within the Work.
2. Grant of Copyright License. Subject to the terms and conditions of this License, each Contributor hereby grants to You a perpetual, worldwide, non-exclusive, no-charge, royalty-free, irrevocable copyright license to reproduce, prepare Derivative Works of, publicly display, publicly perform, sublicense, and distribute the Work and such Derivative Works in Source or Object form.
3. Grant of Patent License. Subject to the terms and conditions of this License, each Contributor hereby grants to You a perpetual, worldwide, non-exclusive, no-charge, royalty-free, irrevocable (except as stated in this section) patent license to make, have made, use, offer to sell, sell, import, and otherwise transfer the Work, where such license applies only to those patent claims licensable by such Contributor that are necessarily infringed by their Contribution(s) alone or by combination of their Contribution(s) with the Work to which such Contribution(s) was submitted. If You institute patent litigation against any entity (including a cross-claim or counterclaim in a lawsuit) alleging that the Work or a Contribution incorporated within the Work constitutes direct or contributory patent infringement, then any patent licenses granted to You under this License for that Work shall terminate as of the date such litigation is filed.
4. Redistribution. You may reproduce and distribute copies of the Work or Derivative Works thereof in any medium, with or without modifications, and in Source or Object form, provided that You meet the following conditions:
(a) You must give any other recipients of the Work or Derivative Works a copy of this License; and
(b) You must cause any modified files to carry prominent notices stating that You changed the files; and
(c) You must retain, in the Source form of any Derivative Works that You distribute, all copyright, patent, trademark, and attribution notices from the Source form of the Work, excluding those notices that do not pertain to any part of the Derivative Works; and
(d) If the Work includes a "NOTICE" text file as part of its distribution, then any Derivative Works that You distribute must include a readable copy of the attribution notices contained within such NOTICE file, excluding those notices that do not pertain to any part of the Derivative Works, in at least one of the following places: within a NOTICE text file distributed as part of the Derivative Works; within the Source form or documentation, if provided along with the Derivative Works; or, within a display generated by the Derivative Works, if and wherever such third-party notices normally appear. The contents of the NOTICE file are for informational purposes only and do not modify the License. You may add Your own attribution notices within Derivative Works that You distribute, alongside or as an addendum to the NOTICE text from the Work, provided that such additional attribution notices cannot be construed as modifying the License.
You may add Your own copyright statement to Your modifications and may provide additional or different license terms and conditions for use, reproduction, or distribution of Your modifications, or for any such Derivative Works as a whole, provided Your use, reproduction, and distribution of the Work otherwise complies with the conditions stated in this License.
5. Submission of Contributions. Unless You explicitly state otherwise, any Contribution intentionally submitted for inclusion in the Work by You to the Licensor shall be under the terms and conditions of this License, without any additional terms or conditions. Notwithstanding the above, nothing herein shall supersede or modify the terms of any separate license agreement you may have executed with Licensor regarding such Contributions.
6. Trademarks. This License does not grant permission to use the trade names, trademarks, service marks, or product names of the Licensor, except as required for reasonable and customary use in describing the origin of the Work and reproducing the content of the NOTICE file.
7. Disclaimer of Warranty. Unless required by applicable law or agreed to in writing, Licensor provides the Work (and each Contributor provides its Contributions) on an "AS IS" BASIS, WITHOUT WARRANTIES OR CONDITIONS OF ANY KIND, either express or implied, including, without limitation, any warranties or conditions of TITLE, NON-INFRINGEMENT, MERCHANTABILITY, or FITNESS FOR A PARTICULAR PURPOSE. You are solely responsible for determining the appropriateness of using or redistributing the Work and assume any risks associated with Your exercise of permissions under this License.
8. Limitation of Liability. In no event and under no legal theory, whether in tort (including negligence), contract, or otherwise, unless required by applicable law (such as deliberate and grossly negligent acts) or agreed to in writing, shall any Contributor be liable to You for damages, including any direct, indirect, special, incidental, or consequential damages of any character arising as a result of this License or out of the use or inability to use the Work (including but not limited to damages for loss of goodwill, work stoppage, computer failure or malfunction, or any and all other commercial damages or losses), even if such Contributor has been advised of the possibility of such damages.
9. Accepting Warranty or Additional Liability. While redistributing the Work or Derivative Works thereof, You may choose to offer, and charge a fee for, acceptance of support, warranty, indemnity, or other liability obligations and/or rights consistent with this License. However, in accepting such obligations, You may act only on Your own behalf and on Your sole responsibility, not on behalf of any other Contributor, and only if You agree to indemnify, defend, and hold each Contributor harmless for any liability incurred by, or claims asserted against, such Contributor by reason of your accepting any such warranty or additional liability.
END OF TERMS AND CONDITIONS
APPENDIX: How to apply the Apache License to your work.
To apply the Apache License to your work, attach the following boilerplate notice, with the fields enclosed by brackets "[]" replaced with your own identifying information. (Don't include the brackets!) The text should be enclosed in the appropriate comment syntax for the file format. We also recommend that a file or class name and description of purpose be included on the same "printed page" as the copyright notice for easier identification within third-party archives.
Copyright [yyyy] [name of copyright owner]
Licensed under the Apache License, Version 2.0 (the "License");
you may not use this file except in compliance with the License.
You may obtain a copy of the License at http://www.apache.org/licenses/LICENSE-2.0
Unless required by applicable law or agreed to in writing, software distributed under the License is distributed on an "AS IS" BASIS, WITHOUT WARRANTIES OR CONDITIONS OF ANY KIND, either express or implied. See the License for the specific language governing permissions and limitations under the License.
Command Line Parser Library
PVS-Studio uses Command Line Parser Library. This is Command Line Parser Library license:
The MIT License (MIT)
Copyright (c) 2005 - 2015 Giacomo Stelluti Scala & Contributors
Permission is hereby granted, free of charge, to any person obtaining a copy of this software and associated documentation files (the "Software"), to deal in the Software without restriction, including without limitation the rights to use, copy, modify, merge, publish, distribute, sublicense, and/or sell copies of the Software, and to permit persons to whom the Software is furnished to do so, subject to the following conditions:
The above copyright notice and this permission notice shall be included in all copies or substantial portions of the Software.
THE SOFTWARE IS PROVIDED "AS IS", WITHOUT WARRANTY OF ANY KIND, EXPRESS OR IMPLIED, INCLUDING BUT NOT LIMITED TO THE WARRANTIES OF MERCHANTABILITY, FITNESS FOR A PARTICULAR PURPOSE AND NONINFRINGEMENT. IN NO EVENT SHALL THE AUTHORS OR COPYRIGHT HOLDERS BE LIABLE FOR ANY CLAIM, DAMAGES OR OTHER LIABILITY, WHETHER IN AN ACTION OF CONTRACT, TORT OR OTHERWISE, ARISING FROM, OUT OF OR IN CONNECTION WITH THE SOFTWARE OR THE USE OR OTHER DEALINGS IN THE SOFTWARE.
Protocol Buffers library for .NET
The core Protocol Buffers technology is provided courtesy of Google. At the time of writing, this is released under the BSD license. Full details can be found here:
http://code.google.com/p/protobuf/
This .NET implementation is Copyright 2008 Marc Gravell
Licensed under the Apache License, Version 2.0 (the "License"); you may not use this file except in compliance with the License. You may obtain a copy of the License at
http://www.apache.org/licenses/LICENSE-2.0
Unless required by applicable law or agreed to in writing, software distributed under the License is distributed on an "AS IS" BASIS, WITHOUT WARRANTIES OR CONDITIONS OF ANY KIND, either express or implied. See the License for the specific language governing permissions and limitations under the License.
MSBuild
PVS-Studio uses MSBuild. This is MSBuild license:
MSBuild
The MIT License (MIT)
Copyright (c) .NET Foundation and contributors
Permission is hereby granted, free of charge, to any person obtaining a copy of this software and associated documentation files (the "Software"), to deal in the Software without restriction, including without limitation the rights to use, copy, modify, merge, publish, distribute, sublicense, and/or sell copies of the Software, and to permit persons to whom the Software is furnished to do so, subject to the following conditions:
The above copyright notice and this permission notice shall be included in all copies or substantial portions of the Software.
THE SOFTWARE IS PROVIDED "AS IS", WITHOUT WARRANTY OF ANY KIND, EXPRESS OR IMPLIED, INCLUDING BUT NOT LIMITED TO THE WARRANTIES OF MERCHANTABILITY, FITNESS FOR A PARTICULAR PURPOSE AND NONINFRINGEMENT. IN NO EVENT SHALL THE AUTHORS OR COPYRIGHT HOLDERS BE LIABLE FOR ANY CLAIM, DAMAGES OR OTHER LIABILITY, WHETHER IN AN ACTION OF CONTRACT, TORT OR OTHERWISE, ARISING FROM, OUT OF OR IN CONNECTION WITH THE SOFTWARE OR THE USE OR OTHER DEALINGS IN THE SOFTWARE.
Java
jsoup library
PVS-Studio plugin for Jenkins uses jsoup. This is jsoup license:
The MIT License
Copyright © 2009 - 2017 Jonathan Hedley (jonathan@hedley.net)
Permission is hereby granted, free of charge, to any person obtaining a copy of this software and associated documentation files (the "Software"), to deal in the Software without restriction, including without limitation the rights to use, copy, modify, merge, publish, distribute, sublicense, and/or sell copies of the Software, and to permit persons to whom the Software is furnished to do so, subject to the following conditions:
The above copyright notice and this permission notice shall be included in all copies or substantial portions of the Software.
THE SOFTWARE IS PROVIDED "AS IS", WITHOUT WARRANTY OF ANY KIND, EXPRESS OR IMPLIED, INCLUDING BUT NOT LIMITED TO THE WARRANTIES OF MERCHANTABILITY, FITNESS FOR A PARTICULAR PURPOSE AND NONINFRINGEMENT. IN NO EVENT SHALL THE AUTHORS OR COPYRIGHT HOLDERS BE LIABLE FOR ANY CLAIM, DAMAGES OR OTHER LIABILITY, WHETHER IN AN ACTION OF CONTRACT, TORT OR OTHERWISE, ARISING FROM, OUT OF OR IN CONNECTION WITH THE SOFTWARE OR THE USE OR OTHER DEALINGS IN THE SOFTWARE.
Spoon library
PVS-Studio uses Spoon. This is Spoon license:
CeCILL-C FREE SOFTWARE LICENSE AGREEMENT
Notice
This Agreement is a Free Software license agreement that is the result of discussions between its authors in order to ensure compliance with the two main principles guiding its drafting:
- firstly, compliance with the principles governing the distribution of Free Software: access to source code, broad rights granted to users,
- secondly, the election of a governing law, French law, with which it is conformant, both as regards the law of torts and intellectual property law, and the protection that it offers to both authors and holders of the economic rights over software.
The authors of the CeCILL-C (for Ce[a] C[nrs] I[nria] L[ogiciel] L[ibre]) license are:
Commissariat à l'Energie Atomique - CEA, a public scientific, technical and industrial research establishment, having its principal place of
business at 25 rue Leblanc, immeuble Le Ponant D, 75015 Paris, France. Centre National de la Recherche Scientifique - CNRS, a public scientific and technological establishment, having its principal place of business at 3 rue Michel-Ange, 75794 Paris cedex 16, France.
Institut National de Recherche en Informatique et en Automatique INRIA, a public scientific and technological establishment, having its principal place of business at Domaine de Voluceau, Rocquencourt, BP 105, 78153 Le Chesnay cedex, France.
Preamble
The purpose of this Free Software license agreement is to grant users the right to modify and re-use the software governed by this license.
The exercising of this right is conditional upon the obligation to make available to the community the modifications made to the source code of the software so as to contribute to its evolution.
In consideration of access to the source code and the rights to copy, modify and redistribute granted by the license, users are provided only with a limited warranty and the software's author, the holder of the economic rights, and the successive licensors only have limited liability.
In this respect, the risks associated with loading, using, modifying and/or developing or reproducing the software by the user are brought to the user's attention, given its Free Software status, which may make it complicated to use, with the result that its use is reserved for developers and experienced professionals having in-depth computer knowledge. Users are therefore encouraged to load and test the suitability of the software as regards their requirements in conditions enabling the security of their systems and/or data to be ensured and, more generally, to use and operate it in the same conditions of security. This Agreement may be freely reproduced and published, provided it is not altered, and that no provisions are either added or removed herefrom.
This Agreement may apply to any or all software for which the holder of the economic rights decides to submit the use thereof to its provisions.
Article 1 - DEFINITIONS
For the purpose of this Agreement, when the following expressions commence with a capital letter, they shall have the following meaning:
Agreement: means this license agreement, and its possible subsequent versions and annexes.
Software: means the software in its Object Code and/or Source Code form and, where applicable, its documentation, "as is" when the Licensee accepts the Agreement.
Initial Software: means the Software in its Source Code and possibly its Object Code form and, where applicable, its documentation, "as is" when it is first distributed under the terms and conditions of the Agreement.
Modified Software: means the Software modified by at least one Integrated Contribution.
Source Code: means all the Software's instructions and program lines to which access is required so as to modify the Software.
Object Code: means the binary files originating from the compilation of the Source Code.
Holder: means the holder(s) of the economic rights over the Initial Software.
Licensee: means the Software user(s) having accepted the Agreement.
Contributor: means a Licensee having made at least one Integrated Contribution.
Licensor: means the Holder, or any other individual or legal entity, who distributes the Software under the Agreement.
Integrated Contribution: means any or all modifications, corrections, translations, adaptations and/or new functions integrated into the Source Code by any or all Contributors.
Related Module: means a set of sources files including their documentation that, without modification to the Source Code, enables supplementary functions or services in addition to those offered by the
Software.
Derivative Software: means any combination of the Software, modified or not, and of a Related Module.
Parties: mean both the Licensee and the Licensor.
These expressions may be used both in singular and plural form.
Article 2 - PURPOSE
The purpose of the Agreement is the grant by the Licensor to the Licensee of a non-exclusive, transferable and worldwide license for the Software as set forth in Article 5 hereinafter for the whole term of the protection granted by the rights over said Software.
Article 3 - ACCEPTANCE
3.1 The Licensee shall be deemed as having accepted the terms and conditions of this Agreement upon the occurrence of the first of the following events:
- (i)loading the Software by any or all means, notably, by downloading from a remote server, or by loading from a physical medium;
- (ii) the first time the Licensee exercises any of the rights granted hereunder.
3.2 One copy of the Agreement, containing a notice relating to the characteristics of the Software, to the limited warranty, and to the fact that its use is restricted to experienced users has been provided to the Licensee prior to its acceptance as set forth in Article 3.1 hereinabove, and the Licensee hereby acknowledges that it has read and understood it.
Article 4 - EFFECTIVE DATE AND TERM
4.1 EFFECTIVE DATE
The Agreement shall become effective on the date when it is accepted by the Licensee as set forth in Article 3.1.
4.2 TERM
The Agreement shall remain in force for the entire legal term of protection of the economic rights over the Software.
Article 5 - SCOPE OF RIGHTS GRANTED
The Licensor hereby grants to the Licensee, who accepts, the following rights over the Software for any or all use, and for the term of the Agreement, on the basis of the terms and conditions set forth hereinafter.
Besides, if the Licensor owns or comes to own one or more patents protecting all or part of the functions of the Software or of its components, the Licensor undertakes not to enforce the rights granted by these patents against successive Licensees using, exploiting or modifying the Software. If these patents are transferred, the Licensor undertakes to have the transferees subscribe to the obligations set forth in this paragraph.
5.1 RIGHT OF USE
The Licensee is authorized to use the Software, without any limitation as to its fields of application, with it being hereinafter specified that this comprises:
1. permanent or temporary reproduction of all or part of the Software by any or all means and in any or all form.
2. loading, displaying, running, or storing the Software on any or all medium.
3. entitlement to observe, study or test its operation so as to determine the ideas and principles behind any or all constituent elements of said Software. This shall apply when the Licensee carries out any or all loading, displaying, running, transmission or storage operation as regards the Software, that it is entitled to carry out hereunder.
5.2 RIGHT OF MODIFICATION
The right of modification includes the right to translate, adapt, arrange, or make any or all modifications to the Software, and the right to reproduce the resulting software. It includes, in particular, the right to create a Derivative Software.
The Licensee is authorized to make any or all modification to the Software provided that it includes an explicit notice that it is the author of said modification and indicates the date of the creation thereof.
5.3 RIGHT OF DISTRIBUTION
In particular, the right of distribution includes the right to publish, transmit and communicate the Software to the general public on any or all medium, and by any or all means, and the right to market, either in consideration of a fee, or free of charge, one or more copies of the Software by any means.
The Licensee is further authorized to distribute copies of the modified or unmodified Software to third parties according to the terms and conditions set forth hereinafter.
5.3.1 DISTRIBUTION OF SOFTWARE WITHOUT MODIFICATION
The Licensee is authorized to distribute true copies of the Software in Source Code or Object Code form, provided that said distribution complies with all the provisions of the Agreement and is accompanied by:
1. a copy of the Agreement,
2. a notice relating to the limitation of both the Licensor's warranty and liability as set forth in Articles 8 and 9,
and that, in the event that only the Object Code of the Software is redistributed, the Licensee allows effective access to the full Source Code of the Software at a minimum during the entire period of its distribution of the Software, it being understood that the additional cost of acquiring the Source Code shall not exceed the cost of transferring the data.
5.3.2 DISTRIBUTION OF MODIFIED SOFTWARE
When the Licensee makes an Integrated Contribution to the Software, the terms and conditions for the distribution of the resulting Modified Software become subject to all the provisions of this Agreement.
The Licensee is authorized to distribute the Modified Software, in source code or object code form, provided that said distribution complies with all the provisions of the Agreement and is accompanied by:
1. a copy of the Agreement,
2. a notice relating to the limitation of both the Licensor's warranty and liability as set forth in Articles 8 and 9,
and that, in the event that only the object code of the Modified Software is redistributed, the Licensee allows effective access to the full source code of the Modified Software at a minimum during the entire period of its distribution of the Modified Software, it being understood that the additional cost of acquiring the source code shall not exceed the cost of transferring the data.
5.3.3 DISTRIBUTION OF DERIVATIVE SOFTWARE
When the Licensee creates Derivative Software, this Derivative Software may be distributed under a license agreement other than this Agreement, subject to compliance with the requirement to include a notice concerning the rights over the Software as defined in Article 6.4.
In the event the creation of the Derivative Software required modification of the Source Code, the Licensee undertakes that:
1. the resulting Modified Software will be governed by this Agreement,
2. the Integrated Contributions in the resulting Modified Software will be clearly identified and documented,
3. the Licensee will allow effective access to the source code of the Modified Software, at a minimum during the entire period of distribution of the Derivative Software, such that such modifications may be carried over in a subsequent version of the Software; it being understood that the additional cost of purchasing the source code of the Modified Software shall not exceed the cost of transferring the data.
5.3.4 COMPATIBILITY WITH THE CeCILL LICENSE
When a Modified Software contains an Integrated Contribution subject to the CeCILL license agreement, or when a Derivative Software contains a Related Module subject to the CeCILL license agreement, the provisions set forth in the third item of Article 6.4 are optional.
Article 6 - INTELLECTUAL PROPERTY
6.1 OVER THE INITIAL SOFTWARE
The Holder owns the economic rights over the Initial Software. Any or all use of the Initial Software is subject to compliance with the terms and conditions under which the Holder has elected to distribute its work and no one shall be entitled to modify the terms and conditions for the distribution of said Initial Software.
The Holder undertakes that the Initial Software will remain ruled at least by this Agreement, for the duration set forth in Article 4.2.
6.2 OVER THE INTEGRATED CONTRIBUTIONS
The Licensee who develops an Integrated Contribution is the owner of the intellectual property rights over this Contribution as defined by applicable law.
6.3 OVER THE RELATED MODULES
The Licensee who develops a Related Module is the owner of the intellectual property rights over this Related Module as defined by applicable law and is free to choose the type of agreement that shall govern its distribution under the conditions defined in Article 5.3.3.
6.4 NOTICE OF RIGHTS
The Licensee expressly undertakes:
1. not to remove, or modify, in any manner, the intellectual property notices attached to the Software;
2. to reproduce said notices, in an identical manner, in the copies of the Software modified or not;
3. to ensure that use of the Software, its intellectual property notices and the fact that it is governed by the Agreement is indicated in a text that is easily accessible, specifically from the interface of any Derivative Software.
The Licensee undertakes not to directly or indirectly infringe the intellectual property rights of the Holder and/or Contributors on the Software and to take, where applicable, vis-à-vis its staff, any and all measures required to ensure respect of said intellectual property rights of the Holder and/or Contributors.
Article 7 - RELATED SERVICES
7.1 Under no circumstances shall the Agreement oblige the Licensor to provide technical assistance or maintenance services for the Software.
However, the Licensor is entitled to offer this type of services. The terms and conditions of such technical assistance, and/or such maintenance, shall be set forth in a separate instrument. Only theLicensor offering said maintenance and/or technical assistance services shall incur liability therefor.
7.2 Similarly, any Licensor is entitled to offer to its licensees, underits sole responsibility, a warranty, that shall only be binding upon itself, for the redistribution of the Software and/or the Modified Software, under terms and conditions that it is free to decide. Said warranty, and the financial terms and conditions of its application, shall be subject of a separate instrument executed between the Licensor and the Licensee.
Article 8 - LIABILITY
8.1 Subject to the provisions of Article 8.2, the Licensee shall be entitled to claim compensation for any direct loss it may have suffered from the Software as a result of a fault on the part of the relevant Licensor, subject to providing evidence thereof.
8.2 The Licensor's liability is limited to the commitments made under this Agreement and shall not be incurred as a result of in particular: (i) loss due the Licensee's total or partial failure to fulfill its obligations, (ii) direct or consequential loss that is suffered by the Licensee due to the use or performance of the Software, and (iii) more generally, any consequential loss. In particular the Parties expressly agree that any or all pecuniary or business loss (i.e. loss of data, loss of profits, operating loss, loss of customers or orders, opportunity cost, any disturbance to business activities) or any or all legal proceedings instituted against the Licensee by a third party, shall constitute consequential loss and shall not provide entitlement to any or all compensation from the Licensor.
Article 9 - WARRANTY
9.1 The Licensee acknowledges that the scientific and technical state-of-the-art when the Software was distributed did not enable all possible uses to be tested and verified, nor for the presence of possible defects to be detected. In this respect, the Licensee's attention has been drawn to the risks associated with loading, using, modifying and/or developing and reproducing the Software which are reserved for experienced users.
The Licensee shall be responsible for verifying, by any or all means, the suitability of the product for its requirements, its good working order, and for ensuring that it shall not cause damage to either persons or properties.
9.2 The Licensor hereby represents, in good faith, that it is entitled to grant all the rights over the Software (including in particular the rights set forth in Article 5).
9.3 The Licensee acknowledges that the Software is supplied "as is" by the Licensor without any other express or tacit warranty, other than that provided for in Article 9.2 and, in particular, without any warranty as to its commercial value, its secured, safe, innovative or relevant nature.
Specifically, the Licensor does not warrant that the Software is free from any error, that it will operate without interruption, that it will be compatible with the Licensee's own equipment and software configuration, nor that it will meet the Licensee's requirements.
9.4 The Licensor does not either expressly or tacitly warrant that the Software does not infringe any third party intellectual property right relating to a patent, software or any other property right. Therefore, the Licensor disclaims any and all liability towards the Licensee arising out of any or all proceedings for infringement that may be instituted in respect of the use, modification and redistribution of the Software. Nevertheless, should such proceedings be instituted against the Licensee, the Licensor shall provide it with technical and legal assistance for its defense. Such technical and legal assistance shall be decided on a case-by-case basis between the relevant Licensor and the Licensee pursuant to a memorandum of understanding. The Licensor disclaims any and all liability as regards the Licensee's use of the name of the Software. No warranty is given as regards the existence of prior rights over the name of the Software or as regards the existence of a trademark.
Article 10 - TERMINATION
10.1 In the event of a breach by the Licensee of its obligations hereunder, the Licensor may automatically terminate this Agreement thirty (30) days after notice has been sent to the Licensee and has remained ineffective.
10.2 A Licensee whose Agreement is terminated shall no longer be authorized to use, modify or distribute the Software. However, any licenses that it may have granted prior to termination of the Agreement shall remain valid subject to their having been granted in compliance with the terms and conditions hereof.
Article 11 - MISCELLANEOUS
11.1 EXCUSABLE EVENTS
Neither Party shall be liable for any or all delay, or failure to perform the Agreement, that may be attributable to an event of force majeure, an act of God or an outside cause, such as defective functioning or interruptions of the electricity or telecommunications networks, network paralysis following a virus attack, intervention by government authorities, natural disasters, water damage, earthquakes, fire, explosions, strikes and labor unrest, war, etc.
11.2 Any failure by either Party, on one or more occasions, to invoke one or more of the provisions hereof, shall under no circumstances be interpreted as being a waiver by the interested Party of its right to invoke said provision(s) subsequently.
11.3 The Agreement cancels and replaces any or all previous agreements, whether written or oral, between the Parties and having the same purpose, and constitutes the entirety of the agreement between said Parties concerning said purpose. No supplement or modification to the terms and conditions hereof shall be effective as between the Parties unless it is made in writing and signed by their duly authorized representatives.
11.4 In the event that one or more of the provisions hereof were to conflict with a current or future applicable act or legislative text, said act or legislative text shall prevail, and the Parties shall make the necessary amendments so as to comply with said act or legislative text. All other provisions shall remain effective. Similarly, invalidity of a provision of the Agreement, for any reason whatsoever, shall not cause the Agreement as a whole to be invalid.
11.5 LANGUAGE
The Agreement is drafted in both French and English and both versions are deemed authentic.
Article 12 - NEW VERSIONS OF THE AGREEMENT
12.1 Any person is authorized to duplicate and distribute copies of this Agreement.
12.2 So as to ensure coherence, the wording of this Agreement is protected and may only be modified by the authors of the License, who reserve the right to periodically publish updates or new versions of the Agreement, each with a separate number. These subsequent versions may address new issues encountered by Free Software.
12.3 Any Software distributed under a given version of the Agreement may only be subsequently distributed under the same version of the Agreement or a subsequent version.
Article 13 - GOVERNING LAW AND JURISDICTION
13.1 The Agreement is governed by French law. The Parties agree to endeavor to seek an amicable solution to any disagreements or disputes that may arise during the performance of the Agreement.
13.2 Failing an amicable solution within two (2) months as from their occurrence, and unless emergency proceedings are necessary, the disagreements or disputes shall be referred to the Paris Courts having jurisdiction, by the more diligent Party.
Version 1.0 dated 2006-09-05.
Gson library
PVS-Studio uses Gson. This is Gson license:
Apache License
Version 2.0, January 2004
http://www.apache.org/licenses/
TERMS AND CONDITIONS FOR USE, REPRODUCTION, AND DISTRIBUTION
1. Definitions.
"License" shall mean the terms and conditions for use, reproduction, and distribution as defined by Sections 1 through 9 of this document.
"Licensor" shall mean the copyright owner or entity authorized by the copyright owner that is granting the License.
"Legal Entity" shall mean the union of the acting entity and all other entities that control, are controlled by, or are under common control with that entity. For the purposes of this definition, "control" means (i) the power, direct or indirect, to cause the direction or management of such entity, whether by contract or otherwise, or (ii) ownership of fifty percent (50%) or more of the outstanding shares, or (iii) beneficial ownership of such entity.
"You" (or "Your") shall mean an individual or Legal Entity exercising permissions granted by this License.
"Source" form shall mean the preferred form for making modifications, including but not limited to software source code, documentation source, and configuration files.
"Object" form shall mean any form resulting from mechanical transformation or translation of a Source form, including but not limited to compiled object code, generated documentation, and conversions to other media types.
"Work" shall mean the work of authorship, whether in Source or Object form, made available under the License, as indicated by a copyright notice that is included in or attached to the work (an example is provided in the Appendix below).
"Derivative Works" shall mean any work, whether in Source or Object form, that is based on (or derived from) the Work and for which the editorial revisions, annotations, elaborations, or other modifications represent, as a whole, an original work of authorship. For the purposes of this License, Derivative Works shall not include works that remain separable from, or merely link (or bind by name) to the interfaces of, the Work and Derivative Works thereof.
"Contribution" shall mean any work of authorship, including the original version of the Work and any modifications or additions to that Work or Derivative Works thereof, that is intentionally submitted to Licensor for inclusion in the Work by the copyright owner or by an individual or Legal Entity authorized to submit on behalf of the copyright owner. For the purposes of this definition, "submitted" means any form of electronic, verbal, or written communication sent to the Licensor or its representatives, including but not limited to communication on electronic mailing lists, source code control systems, and issue tracking systems that are managed by, or on behalf of, the Licensor for the purpose of discussing and improving the Work, but excluding communication that is conspicuously marked or otherwise designated in writing by the copyright owner as "Not a Contribution."
"Contributor" shall mean Licensor and any individual or Legal Entity on behalf of whom a Contribution has been received by Licensor and subsequently incorporated within the Work.
2. Grant of Copyright License. Subject to the terms and conditions of this License, each Contributor hereby grants to You a perpetual, worldwide, non-exclusive, no-charge, royalty-free, irrevocable copyright license to reproduce, prepare Derivative Works of, publicly display, publicly perform, sublicense, and distribute the Work and such Derivative Works in Source or Object form.
3. Grant of Patent License. Subject to the terms and conditions of this License, each Contributor hereby grants to You a perpetual, worldwide, non-exclusive, no-charge, royalty-free, irrevocable (except as stated in this section) patent license to make, have made, use, offer to sell, sell, import, and otherwise transfer the Work, where such license applies only to those patent claims licensable by such Contributor that are necessarily infringed by their Contribution(s) alone or by combination of their Contribution(s) with the Work to which such Contribution(s) was submitted. If You institute patent litigation against any entity (including a cross-claim or counterclaim in a lawsuit) alleging that the Work or a Contribution incorporated within the Work constitutes direct or contributory patent infringement, then any patent licenses granted to You under this License for that Work shall terminate as of the date such litigation is filed.
4. Redistribution. You may reproduce and distribute copies of the Work or Derivative Works thereof in any medium, with or without modifications, and in Source or Object form, provided that You meet the following conditions:
(a) You must give any other recipients of the Work or Derivative Works a copy of this License; and
(b) You must cause any modified files to carry prominent notices stating that You changed the files; and
(c) You must retain, in the Source form of any Derivative Works that You distribute, all copyright, patent, trademark, and attribution notices from the Source form of the Work, excluding those notices that do not pertain to any part of the Derivative Works; and
(d) If the Work includes a "NOTICE" text file as part of its distribution, then any Derivative Works that You distribute must include a readable copy of the attribution notices contained within such NOTICE file, excluding those notices that do not pertain to any part of the Derivative Works, in at least one of the following places: within a NOTICE text file distributed as part of the Derivative Works; within the Source form or documentation, if provided along with the Derivative Works; or, within a display generated by the Derivative Works, if and wherever such third-party notices normally appear. The contents of the NOTICE file are for informational purposes only and do not modify the License. You may add Your own attribution notices within Derivative Works that You distribute, alongside or as an addendum to the NOTICE text from the Work, provided that such additional attribution notices cannot be construed as modifying the License.
You may add Your own copyright statement to Your modifications and may provide additional or different license terms and conditions for use, reproduction, or distribution of Your modifications, or for any such Derivative Works as a whole, provided Your use, reproduction, and distribution of the Work otherwise complies with the conditions stated in this License.
5. Submission of Contributions. Unless You explicitly state otherwise, any Contribution intentionally submitted for inclusion in the Work by You to the Licensor shall be under the terms and conditions of this License, without any additional terms or conditions. Notwithstanding the above, nothing herein shall supersede or modify the terms of any separate license agreement you may have executed with Licensor regarding such Contributions.
6. Trademarks. This License does not grant permission to use the trade names, trademarks, service marks, or product names of the Licensor, except as required for reasonable and customary use in describing the origin of the Work and reproducing the content of the NOTICE file.
7. Disclaimer of Warranty. Unless required by applicable law or agreed to in writing, Licensor provides the Work (and each Contributor provides its Contributions) on an "AS IS" BASIS, WITHOUT WARRANTIES OR CONDITIONS OF ANY KIND, either express or implied, including, without limitation, any warranties or conditions of TITLE, NON-INFRINGEMENT, MERCHANTABILITY, or FITNESS FOR A PARTICULAR PURPOSE. You are solely responsible for determining the appropriateness of using or redistributing the Work and assume any risks associated with Your exercise of permissions under this License.
8. Limitation of Liability. In no event and under no legal theory, whether in tort (including negligence), contract, or otherwise, unless required by applicable law (such as deliberate and grossly negligent acts) or agreed to in writing, shall any Contributor be liable to You for damages, including any direct, indirect, special, incidental, or consequential damages of any character arising as a result of this License or out of the use or inability to use the Work (including but not limited to damages for loss of goodwill, work stoppage, computer failure or malfunction, or any and all other commercial damages or losses), even if such Contributor has been advised of the possibility of such damages.
9. Accepting Warranty or Additional Liability. While redistributing the Work or Derivative Works thereof, You may choose to offer, and charge a fee for, acceptance of support, warranty, indemnity, or other liability obligations and/or rights consistent with this License. However, in accepting such obligations, You may act only on Your own behalf and on Your sole responsibility, not on behalf of any other Contributor, and only if You agree to indemnify, defend, and hold each Contributor harmless for any liability incurred by, or claims asserted against, such Contributor by reason of your accepting any such warranty or additional liability.
END OF TERMS AND CONDITIONS
APPENDIX: How to apply the Apache License to your work.
To apply the Apache License to your work, attach the following boilerplate notice, with the fields enclosed by brackets "[]" replaced with your own identifying information. (Don't include the brackets!) The text should be enclosed in the appropriate comment syntax for the file format. We also recommend that a file or class name and description of purpose be included on the same "printed page" as the copyright notice for easier identification within third-party archives.
Copyright [yyyy] [name of copyright owner]
Licensed under the Apache License, Version 2.0 (the "License"); you may not use this file except in compliance with the License. You may obtain a copy of the License at
http://www.apache.org/licenses/LICENSE-2.0
Unless required by applicable law or agreed to in writing, software distributed under the License is distributed on an "AS IS" BASIS, WITHOUT WARRANTIES OR CONDITIONS OF ANY KIND, either express or implied.
See the License for the specific language governing permissions and
limitations under the License.
picocli library
PVS-Studio uses picocli. This is picocli license:
Apache License
Version 2.0, January 2004
http://www.apache.org/licenses/
TERMS AND CONDITIONS FOR USE, REPRODUCTION, AND DISTRIBUTION
1. Definitions.
"License" shall mean the terms and conditions for use, reproduction, and distribution as defined by Sections 1 through 9 of this document.
"Licensor" shall mean the copyright owner or entity authorized by the copyright owner that is granting the License.
"Legal Entity" shall mean the union of the acting entity and all other entities that control, are controlled by, or are under common control with that entity. For the purposes of this definition, "control" means (i) the power, direct or indirect, to cause the direction or management of such entity, whether by contract or otherwise, or (ii) ownership of fifty percent (50%) or more of the outstanding shares, or (iii) beneficial ownership of such entity.
"You" (or "Your") shall mean an individual or Legal Entity exercising permissions granted by this License.
"Source" form shall mean the preferred form for making modifications, including but not limited to software source code, documentation source, and configuration files.
"Object" form shall mean any form resulting from mechanical transformation or translation of a Source form, including but not limited to compiled object code, generated documentation, and conversions to other media types.
"Work" shall mean the work of authorship, whether in Source or Object form, made available under the License, as indicated by a copyright notice that is included in or attached to the work (an example is provided in the Appendix below).
"Derivative Works" shall mean any work, whether in Source or Object form, that is based on (or derived from) the Work and for which the editorial revisions, annotations, elaborations, or other modifications represent, as a whole, an original work of authorship. For the purposes of this License, Derivative Works shall not include works that remain separable from, or merely link (or bind by name) to the interfaces of, the Work and Derivative Works thereof.
"Contribution" shall mean any work of authorship, including the original version of the Work and any modifications or additions to that Work or Derivative Works thereof, that is intentionally submitted to Licensor for inclusion in the Work by the copyright owner or by an individual or Legal Entity authorized to submit on behalf of the copyright owner. For the purposes of this definition, "submitted" means any form of electronic, verbal, or written communication sent to the Licensor or its representatives, including but not limited to communication on electronic mailing lists, source code control systems, and issue tracking systems that are managed by, or on behalf of, the Licensor for the purpose of discussing and improving the Work, but excluding communication that is conspicuously marked or otherwise designated in writing by the copyright owner as "Not a Contribution."
"Contributor" shall mean Licensor and any individual or Legal Entity on behalf of whom a Contribution has been received by Licensor and subsequently incorporated within the Work.
2. Grant of Copyright License. Subject to the terms and conditions of this License, each Contributor hereby grants to You a perpetual, worldwide, non-exclusive, no-charge, royalty-free, irrevocable copyright license to reproduce, prepare Derivative Works of, publicly display, publicly perform, sublicense, and distribute the Work and such Derivative Works in Source or Object form.
3. Grant of Patent License. Subject to the terms and conditions of this License, each Contributor hereby grants to You a perpetual, worldwide, non-exclusive, no-charge, royalty-free, irrevocable (except as stated in this section) patent license to make, have made, use, offer to sell, sell, import, and otherwise transfer the Work, where such license applies only to those patent claims licensable by such Contributor that are necessarily infringed by their Contribution(s) alone or by combination of their Contribution(s) with the Work to which such Contribution(s) was submitted. If You institute patent litigation against any entity (including a cross-claim or counterclaim in a lawsuit) alleging that the Work or a Contribution incorporated within the Work constitutes direct or contributory patent infringement, then any patent licenses granted to You under this License for that Work shall terminate as of the date such litigation is filed.
4. Redistribution. You may reproduce and distribute copies of the Work or Derivative Works thereof in any medium, with or without modifications, and in Source or Object form, provided that You meet the following conditions:
(a) You must give any other recipients of the Work or Derivative Works a copy of this License; and
(b) You must cause any modified files to carry prominent notices stating that You changed the files; and
(c) You must retain, in the Source form of any Derivative Works that You distribute, all copyright, patent, trademark, and attribution notices from the Source form of the Work, excluding those notices that do not pertain to any part of the Derivative Works; and
(d) If the Work includes a "NOTICE" text file as part of its distribution, then any Derivative Works that You distribute must include a readable copy of the attribution notices contained within such NOTICE file, excluding those notices that do not pertain to any part of the Derivative Works, in at least one of the following places: within a NOTICE text file distributed as part of the Derivative Works; within the Source form or documentation, if provided along with the Derivative Works; or, within a display generated by the Derivative Works, if and wherever such third-party notices normally appear. The contents of the NOTICE file are for informational purposes only and do not modify the License. You may add Your own attribution notices within Derivative Works that You distribute, alongside or as an addendum to the NOTICE text from the Work, provided that such additional attribution notices cannot be construed as modifying the License.
You may add Your own copyright statement to Your modifications and may provide additional or different license terms and conditions for use, reproduction, or distribution of Your modifications, or for any such Derivative Works as a whole, provided Your use, reproduction, and distribution of the Work otherwise complies with the conditions stated in this License.
5. Submission of Contributions. Unless You explicitly state otherwise, any Contribution intentionally submitted for inclusion in the Work by You to the Licensor shall be under the terms and conditions of this License, without any additional terms or conditions. Notwithstanding the above, nothing herein shall supersede or modify the terms of any separate license agreement you may have executed with Licensor regarding such Contributions.
6. Trademarks. This License does not grant permission to use the trade names, trademarks, service marks, or product names of the Licensor, except as required for reasonable and customary use in describing the origin of the Work and reproducing the content of the NOTICE file.
7. Disclaimer of Warranty. Unless required by applicable law or agreed to in writing, Licensor provides the Work (and each Contributor provides its Contributions) on an "AS IS" BASIS, WITHOUT WARRANTIES OR CONDITIONS OF ANY KIND, either express or implied, including, without limitation, any warranties or conditions of TITLE, NON-INFRINGEMENT, MERCHANTABILITY, or FITNESS FOR A PARTICULAR PURPOSE. You are solely responsible for determining the appropriateness of using or redistributing the Work and assume any risks associated with Your exercise of permissions under this License.
8. Limitation of Liability. In no event and under no legal theory, whether in tort (including negligence), contract, or otherwise, unless required by applicable law (such as deliberate and grossly negligent acts) or agreed to in writing, shall any Contributor be liable to You for damages, including any direct, indirect, special, incidental, or consequential damages of any character arising as a result of this License or out of the use or inability to use the Work (including but not limited to damages for loss of goodwill, work stoppage, computer failure or malfunction, or any and all other commercial damages or losses), even if such Contributor has been advised of the possibility of such damages.
9. Accepting Warranty or Additional Liability. While redistributing the Work or Derivative Works thereof, You may choose to offer, and charge a fee for, acceptance of support, warranty, indemnity, or other liability obligations and/or rights consistent with this License. However, in accepting such obligations, You may act only on Your own behalf and on Your sole responsibility, not on behalf of any other Contributor, and only if You agree to indemnify, defend, and hold each Contributor harmless for any liability incurred by, or claims asserted against, such Contributor by reason of your accepting any such warranty or additional liability.
END OF TERMS AND CONDITIONS
APPENDIX: How to apply the Apache License to your work.
To apply the Apache License to your work, attach the following boilerplate notice, with the fields enclosed by brackets "[]" replaced with your own identifying information. (Don't include the brackets!) The text should be enclosed in the appropriate comment syntax for the file format. We also recommend that a file or class name and description of purpose be included on the same "printed page" as the copyright notice for easier identification within third-party archives.
Copyright [yyyy] [name of copyright owner]
Licensed under the Apache License, Version 2.0 (the "License"); you may not use this file except in compliance with the License. You may obtain a copy of the License at
http://www.apache.org/licenses/LICENSE-2.0
Unless required by applicable law or agreed to in writing, software distributed under the License is distributed on an "AS IS" BASIS, WITHOUT WARRANTIES OR CONDITIONS OF ANY KIND, either express or implied.
See the License for the specific language governing permissions and
limitations under the License.
fastutil framework
PVS-Studio uses fastutil. This is fastutil license:
Apache License
Version 2.0, January 2004
http://www.apache.org/licenses/
TERMS AND CONDITIONS FOR USE, REPRODUCTION, AND DISTRIBUTION
1. Definitions.
"License" shall mean the terms and conditions for use, reproduction, and distribution as defined by Sections 1 through 9 of this document.
"Licensor" shall mean the copyright owner or entity authorized by the copyright owner that is granting the License.
"Legal Entity" shall mean the union of the acting entity and all other entities that control, are controlled by, or are under common control with that entity. For the purposes of this definition, "control" means (i) the power, direct or indirect, to cause the direction or management of such entity, whether by contract or otherwise, or (ii) ownership of fifty percent (50%) or more of the outstanding shares, or (iii) beneficial ownership of such entity.
"You" (or "Your") shall mean an individual or Legal Entity exercising permissions granted by this License.
"Source" form shall mean the preferred form for making modifications, including but not limited to software source code, documentation source, and configuration files.
"Object" form shall mean any form resulting from mechanical transformation or translation of a Source form, including but not limited to compiled object code, generated documentation, and conversions to other media types.
"Work" shall mean the work of authorship, whether in Source or Object form, made available under the License, as indicated by a copyright notice that is included in or attached to the work (an example is provided in the Appendix below).
"Derivative Works" shall mean any work, whether in Source or Object form, that is based on (or derived from) the Work and for which the editorial revisions, annotations, elaborations, or other modifications represent, as a whole, an original work of authorship. For the purposes of this License, Derivative Works shall not include works that remain separable from, or merely link (or bind by name) to the interfaces of, the Work and Derivative Works thereof.
"Contribution" shall mean any work of authorship, including the original version of the Work and any modifications or additions to that Work or Derivative Works thereof, that is intentionally submitted to Licensor for inclusion in the Work by the copyright owner or by an individual or Legal Entity authorized to submit on behalf of the copyright owner. For the purposes of this definition, "submitted" means any form of electronic, verbal, or written communication sent to the Licensor or its representatives, including but not limited to communication on electronic mailing lists, source code control systems, and issue tracking systems that are managed by, or on behalf of, the Licensor for the purpose of discussing and improving the Work, but excluding communication that is conspicuously marked or otherwise designated in writing by the copyright owner as "Not a Contribution."
"Contributor" shall mean Licensor and any individual or Legal Entity on behalf of whom a Contribution has been received by Licensor and subsequently incorporated within the Work.
2. Grant of Copyright License. Subject to the terms and conditions of this License, each Contributor hereby grants to You a perpetual, worldwide, non-exclusive, no-charge, royalty-free, irrevocable copyright license to reproduce, prepare Derivative Works of, publicly display, publicly perform, sublicense, and distribute the Work and such Derivative Works in Source or Object form.
3. Grant of Patent License. Subject to the terms and conditions of this License, each Contributor hereby grants to You a perpetual, worldwide, non-exclusive, no-charge, royalty-free, irrevocable (except as stated in this section) patent license to make, have made, use, offer to sell, sell, import, and otherwise transfer the Work, where such license applies only to those patent claims licensable by such Contributor that are necessarily infringed by their Contribution(s) alone or by combination of their Contribution(s) with the Work to which such Contribution(s) was submitted. If You institute patent litigation against any entity (including a cross-claim or counterclaim in a lawsuit) alleging that the Work or a Contribution incorporated within the Work constitutes direct or contributory patent infringement, then any patent licenses granted to You under this License for that Work shall terminate as of the date such litigation is filed.
4. Redistribution. You may reproduce and distribute copies of the Work or Derivative Works thereof in any medium, with or without modifications, and in Source or Object form, provided that You meet the following conditions:
(a) You must give any other recipients of the Work or Derivative Works a copy of this License; and
(b) You must cause any modified files to carry prominent notices stating that You changed the files; and
(c) You must retain, in the Source form of any Derivative Works that You distribute, all copyright, patent, trademark, and attribution notices from the Source form of the Work, excluding those notices that do not pertain to any part of the Derivative Works; and
(d) If the Work includes a "NOTICE" text file as part of its distribution, then any Derivative Works that You distribute must include a readable copy of the attribution notices contained within such NOTICE file, excluding those notices that do not pertain to any part of the Derivative Works, in at least one of the following places: within a NOTICE text file distributed as part of the Derivative Works; within the Source form or documentation, if provided along with the Derivative Works; or, within a display generated by the Derivative Works, if and wherever such third-party notices normally appear. The contents of the NOTICE file are for informational purposes only and do not modify the License. You may add Your own attribution notices within Derivative Works that You distribute, alongside or as an addendum to the NOTICE text from the Work, provided that such additional attribution notices cannot be construed as modifying the License.
You may add Your own copyright statement to Your modifications and may provide additional or different license terms and conditions for use, reproduction, or distribution of Your modifications, or for any such Derivative Works as a whole, provided Your use, reproduction, and distribution of the Work otherwise complies with the conditions stated in this License.
5. Submission of Contributions. Unless You explicitly state otherwise, any Contribution intentionally submitted for inclusion in the Work by You to the Licensor shall be under the terms and conditions of this License, without any additional terms or conditions. Notwithstanding the above, nothing herein shall supersede or modify the terms of any separate license agreement you may have executed with Licensor regarding such Contributions.
6. Trademarks. This License does not grant permission to use the trade names, trademarks, service marks, or product names of the Licensor, except as required for reasonable and customary use in describing the origin of the Work and reproducing the content of the NOTICE file.
7. Disclaimer of Warranty. Unless required by applicable law or agreed to in writing, Licensor provides the Work (and each Contributor provides its Contributions) on an "AS IS" BASIS, WITHOUT WARRANTIES OR CONDITIONS OF ANY KIND, either express or implied, including, without limitation, any warranties or conditions of TITLE, NON-INFRINGEMENT, MERCHANTABILITY, or FITNESS FOR A PARTICULAR PURPOSE. You are solely responsible for determining the appropriateness of using or redistributing the Work and assume any risks associated with Your exercise of permissions under this License.
8. Limitation of Liability. In no event and under no legal theory, whether in tort (including negligence), contract, or otherwise, unless required by applicable law (such as deliberate and grossly negligent acts) or agreed to in writing, shall any Contributor be liable to You for damages, including any direct, indirect, special, incidental, or consequential damages of any character arising as a result of this License or out of the use or inability to use the Work (including but not limited to damages for loss of goodwill, work stoppage, computer failure or malfunction, or any and all other commercial damages or losses), even if such Contributor has been advised of the possibility of such damages.
9. Accepting Warranty or Additional Liability. While redistributing the Work or Derivative Works thereof, You may choose to offer, and charge a fee for, acceptance of support, warranty, indemnity, or other liability obligations and/or rights consistent with this License. However, in accepting such obligations, You may act only on Your own behalf and on Your sole responsibility, not on behalf of any other Contributor, and only if You agree to indemnify, defend, and hold each Contributor harmless for any liability incurred by, or claims asserted against, such Contributor by reason of your accepting any such warranty or additional liability.
END OF TERMS AND CONDITIONS
APPENDIX: How to apply the Apache License to your work.
To apply the Apache License to your work, attach the following boilerplate notice, with the fields enclosed by brackets "[]" replaced with your own identifying information. (Don't include the brackets!) The text should be enclosed in the appropriate comment syntax for the file format. We also recommend that a file or class name and description of purpose be included on the same "printed page" as the copyright notice for easier identification within third-party archives.
Copyright [yyyy] [name of copyright owner]
Licensed under the Apache License, Version 2.0 (the "License"); you may not use this file except in compliance with the License. You may obtain a copy of the License at
http://www.apache.org/licenses/LICENSE-2.0
Unless required by applicable law or agreed to in writing, software distributed under the License is distributed on an "AS IS" BASIS, WITHOUT WARRANTIES OR CONDITIONS OF ANY KIND, either express or implied.
See the License for the specific language governing permissions and
limitations under the License.
StreamEx library
PVS-Studio uses StreamEx. This is StreamEx license:
Apache License
Version 2.0, January 2004
http://www.apache.org/licenses/
TERMS AND CONDITIONS FOR USE, REPRODUCTION, AND DISTRIBUTION
1. Definitions.
"License" shall mean the terms and conditions for use, reproduction, and distribution as defined by Sections 1 through 9 of this document.
"Licensor" shall mean the copyright owner or entity authorized by the copyright owner that is granting the License.
"Legal Entity" shall mean the union of the acting entity and all other entities that control, are controlled by, or are under common control with that entity. For the purposes of this definition, "control" means (i) the power, direct or indirect, to cause the direction or management of such entity, whether by contract or otherwise, or (ii) ownership of fifty percent (50%) or more of the outstanding shares, or (iii) beneficial ownership of such entity.
"You" (or "Your") shall mean an individual or Legal Entity exercising permissions granted by this License.
"Source" form shall mean the preferred form for making modifications, including but not limited to software source code, documentation source, and configuration files.
"Object" form shall mean any form resulting from mechanical transformation or translation of a Source form, including but not limited to compiled object code, generated documentation, and conversions to other media types.
"Work" shall mean the work of authorship, whether in Source or Object form, made available under the License, as indicated by a copyright notice that is included in or attached to the work (an example is provided in the Appendix below).
"Derivative Works" shall mean any work, whether in Source or Object form, that is based on (or derived from) the Work and for which the editorial revisions, annotations, elaborations, or other modifications represent, as a whole, an original work of authorship. For the purposes of this License, Derivative Works shall not include works that remain separable from, or merely link (or bind by name) to the interfaces of, the Work and Derivative Works thereof.
"Contribution" shall mean any work of authorship, including the original version of the Work and any modifications or additions to that Work or Derivative Works thereof, that is intentionally submitted to Licensor for inclusion in the Work by the copyright owner or by an individual or Legal Entity authorized to submit on behalf of the copyright owner. For the purposes of this definition, "submitted" means any form of electronic, verbal, or written communication sent to the Licensor or its representatives, including but not limited to communication on electronic mailing lists, source code control systems, and issue tracking systems that are managed by, or on behalf of, the Licensor for the purpose of discussing and improving the Work, but excluding communication that is conspicuously marked or otherwise designated in writing by the copyright owner as "Not a Contribution."
"Contributor" shall mean Licensor and any individual or Legal Entity on behalf of whom a Contribution has been received by Licensor and subsequently incorporated within the Work.
2. Grant of Copyright License. Subject to the terms and conditions of this License, each Contributor hereby grants to You a perpetual, worldwide, non-exclusive, no-charge, royalty-free, irrevocable copyright license to reproduce, prepare Derivative Works of, publicly display, publicly perform, sublicense, and distribute the Work and such Derivative Works in Source or Object form.
3. Grant of Patent License. Subject to the terms and conditions of this License, each Contributor hereby grants to You a perpetual, worldwide, non-exclusive, no-charge, royalty-free, irrevocable (except as stated in this section) patent license to make, have made, use, offer to sell, sell, import, and otherwise transfer the Work, where such license applies only to those patent claims licensable by such Contributor that are necessarily infringed by their Contribution(s) alone or by combination of their Contribution(s) with the Work to which such Contribution(s) was submitted. If You institute patent litigation against any entity (including a cross-claim or counterclaim in a lawsuit) alleging that the Work or a Contribution incorporated within the Work constitutes direct or contributory patent infringement, then any patent licenses granted to You under this License for that Work shall terminate as of the date such litigation is filed.
4. Redistribution. You may reproduce and distribute copies of the Work or Derivative Works thereof in any medium, with or without modifications, and in Source or Object form, provided that You meet the following conditions:
(a) You must give any other recipients of the Work or Derivative Works a copy of this License; and
(b) You must cause any modified files to carry prominent notices stating that You changed the files; and
(c) You must retain, in the Source form of any Derivative Works that You distribute, all copyright, patent, trademark, and attribution notices from the Source form of the Work, excluding those notices that do not pertain to any part of the Derivative Works; and
(d) If the Work includes a "NOTICE" text file as part of its distribution, then any Derivative Works that You distribute must include a readable copy of the attribution notices contained within such NOTICE file, excluding those notices that do not pertain to any part of the Derivative Works, in at least one of the following places: within a NOTICE text file distributed as part of the Derivative Works; within the Source form or documentation, if provided along with the Derivative Works; or, within a display generated by the Derivative Works, if and wherever such third-party notices normally appear. The contents of the NOTICE file are for informational purposes only and do not modify the License. You may add Your own attribution notices within Derivative Works that You distribute, alongside or as an addendum to the NOTICE text from the Work, provided that such additional attribution notices cannot be construed as modifying the License.
You may add Your own copyright statement to Your modifications and may provide additional or different license terms and conditions for use, reproduction, or distribution of Your modifications, or for any such Derivative Works as a whole, provided Your use, reproduction, and distribution of the Work otherwise complies with the conditions stated in this License.
5. Submission of Contributions. Unless You explicitly state otherwise, any Contribution intentionally submitted for inclusion in the Work by You to the Licensor shall be under the terms and conditions of this License, without any additional terms or conditions. Notwithstanding the above, nothing herein shall supersede or modify the terms of any separate license agreement you may have executed with Licensor regarding such Contributions.
6. Trademarks. This License does not grant permission to use the trade names, trademarks, service marks, or product names of the Licensor, except as required for reasonable and customary use in describing the origin of the Work and reproducing the content of the NOTICE file.
7. Disclaimer of Warranty. Unless required by applicable law or agreed to in writing, Licensor provides the Work (and each Contributor provides its Contributions) on an "AS IS" BASIS, WITHOUT WARRANTIES OR CONDITIONS OF ANY KIND, either express or implied, including, without limitation, any warranties or conditions of TITLE, NON-INFRINGEMENT, MERCHANTABILITY, or FITNESS FOR A PARTICULAR PURPOSE. You are solely responsible for determining the appropriateness of using or redistributing the Work and assume any risks associated with Your exercise of permissions under this License.
8. Limitation of Liability. In no event and under no legal theory, whether in tort (including negligence), contract, or otherwise, unless required by applicable law (such as deliberate and grossly negligent acts) or agreed to in writing, shall any Contributor be liable to You for damages, including any direct, indirect, special, incidental, or consequential damages of any character arising as a result of this License or out of the use or inability to use the Work (including but not limited to damages for loss of goodwill, work stoppage, computer failure or malfunction, or any and all other commercial damages or losses), even if such Contributor has been advised of the possibility of such damages.
9. Accepting Warranty or Additional Liability. While redistributing the Work or Derivative Works thereof, You may choose to offer, and charge a fee for, acceptance of support, warranty, indemnity, or other liability obligations and/or rights consistent with this License. However, in accepting such obligations, You may act only on Your own behalf and on Your sole responsibility, not on behalf of any other Contributor, and only if You agree to indemnify, defend, and hold each Contributor harmless for any liability incurred by, or claims asserted against, such Contributor by reason of your accepting any such warranty or additional liability.
END OF TERMS AND CONDITIONS
APPENDIX: How to apply the Apache License to your work.
To apply the Apache License to your work, attach the following boilerplate notice, with the fields enclosed by brackets "[]" replaced with your own identifying information. (Don't include the brackets!) The text should be enclosed in the appropriate comment syntax for the file format. We also recommend that a file or class name and description of purpose be included on the same "printed page" as the copyright notice for easier identification within third-party archives.
Copyright [yyyy] [name of copyright owner]
Licensed under the Apache License, Version 2.0 (the "License"); you may not use this file except in compliance with the License. You may obtain a copy of the License at
http://www.apache.org/licenses/LICENSE-2.0
Unless required by applicable law or agreed to in writing, software distributed under the License is distributed on an "AS IS" BASIS, WITHOUT WARRANTIES OR CONDITIONS OF ANY KIND, either express or implied.
See the License for the specific language governing permissions and
limitations under the License.
Maven Model
PVS-Studio uses Maven Model. This is Maven Model license:
Apache License
Version 2.0, January 2004
http://www.apache.org/licenses/
TERMS AND CONDITIONS FOR USE, REPRODUCTION, AND DISTRIBUTION
1. Definitions.
"License" shall mean the terms and conditions for use, reproduction, and distribution as defined by Sections 1 through 9 of this document.
"Licensor" shall mean the copyright owner or entity authorized by the copyright owner that is granting the License.
"Legal Entity" shall mean the union of the acting entity and all other entities that control, are controlled by, or are under common control with that entity. For the purposes of this definition, "control" means (i) the power, direct or indirect, to cause the direction or management of such entity, whether by contract or otherwise, or (ii) ownership of fifty percent (50%) or more of the outstanding shares, or (iii) beneficial ownership of such entity.
"You" (or "Your") shall mean an individual or Legal Entity exercising permissions granted by this License.
"Source" form shall mean the preferred form for making modifications, including but not limited to software source code, documentation source, and configuration files.
"Object" form shall mean any form resulting from mechanical transformation or translation of a Source form, including but not limited to compiled object code, generated documentation, and conversions to other media types.
"Work" shall mean the work of authorship, whether in Source or Object form, made available under the License, as indicated by a copyright notice that is included in or attached to the work (an example is provided in the Appendix below).
"Derivative Works" shall mean any work, whether in Source or Object form, that is based on (or derived from) the Work and for which the editorial revisions, annotations, elaborations, or other modifications represent, as a whole, an original work of authorship. For the purposes of this License, Derivative Works shall not include works that remain separable from, or merely link (or bind by name) to the interfaces of, the Work and Derivative Works thereof.
"Contribution" shall mean any work of authorship, including the original version of the Work and any modifications or additions to that Work or Derivative Works thereof, that is intentionally submitted to Licensor for inclusion in the Work by the copyright owner or by an individual or Legal Entity authorized to submit on behalf of the copyright owner. For the purposes of this definition, "submitted" means any form of electronic, verbal, or written communication sent to the Licensor or its representatives, including but not limited to communication on electronic mailing lists, source code control systems, and issue tracking systems that are managed by, or on behalf of, the Licensor for the purpose of discussing and improving the Work, but excluding communication that is conspicuously marked or otherwise designated in writing by the copyright owner as "Not a Contribution."
"Contributor" shall mean Licensor and any individual or Legal Entity on behalf of whom a Contribution has been received by Licensor and subsequently incorporated within the Work.
2. Grant of Copyright License. Subject to the terms and conditions of this License, each Contributor hereby grants to You a perpetual, worldwide, non-exclusive, no-charge, royalty-free, irrevocable copyright license to reproduce, prepare Derivative Works of, publicly display, publicly perform, sublicense, and distribute the Work and such Derivative Works in Source or Object form.
3. Grant of Patent License. Subject to the terms and conditions of this License, each Contributor hereby grants to You a perpetual, worldwide, non-exclusive, no-charge, royalty-free, irrevocable (except as stated in this section) patent license to make, have made, use, offer to sell, sell, import, and otherwise transfer the Work, where such license applies only to those patent claims licensable by such Contributor that are necessarily infringed by their Contribution(s) alone or by combination of their Contribution(s) with the Work to which such Contribution(s) was submitted. If You institute patent litigation against any entity (including a cross-claim or counterclaim in a lawsuit) alleging that the Work or a Contribution incorporated within the Work constitutes direct or contributory patent infringement, then any patent licenses granted to You under this License for that Work shall terminate as of the date such litigation is filed.
4. Redistribution. You may reproduce and distribute copies of the Work or Derivative Works thereof in any medium, with or without modifications, and in Source or Object form, provided that You meet the following conditions:
(a) You must give any other recipients of the Work or Derivative Works a copy of this License; and
(b) You must cause any modified files to carry prominent notices stating that You changed the files; and
(c) You must retain, in the Source form of any Derivative Works that You distribute, all copyright, patent, trademark, and attribution notices from the Source form of the Work, excluding those notices that do not pertain to any part of the Derivative Works; and
(d) If the Work includes a "NOTICE" text file as part of its distribution, then any Derivative Works that You distribute must include a readable copy of the attribution notices contained within such NOTICE file, excluding those notices that do not pertain to any part of the Derivative Works, in at least one of the following places: within a NOTICE text file distributed as part of the Derivative Works; within the Source form or documentation, if provided along with the Derivative Works; or, within a display generated by the Derivative Works, if and wherever such third-party notices normally appear. The contents of the NOTICE file are for informational purposes only and do not modify the License. You may add Your own attribution notices within Derivative Works that You distribute, alongside or as an addendum to the NOTICE text from the Work, provided that such additional attribution notices cannot be construed as modifying the License.
You may add Your own copyright statement to Your modifications and may provide additional or different license terms and conditions for use, reproduction, or distribution of Your modifications, or for any such Derivative Works as a whole, provided Your use, reproduction, and distribution of the Work otherwise complies with the conditions stated in this License.
5. Submission of Contributions. Unless You explicitly state otherwise, any Contribution intentionally submitted for inclusion in the Work by You to the Licensor shall be under the terms and conditions of this License, without any additional terms or conditions. Notwithstanding the above, nothing herein shall supersede or modify the terms of any separate license agreement you may have executed with Licensor regarding such Contributions.
6. Trademarks. This License does not grant permission to use the trade names, trademarks, service marks, or product names of the Licensor, except as required for reasonable and customary use in describing the origin of the Work and reproducing the content of the NOTICE file.
7. Disclaimer of Warranty. Unless required by applicable law or agreed to in writing, Licensor provides the Work (and each Contributor provides its Contributions) on an "AS IS" BASIS, WITHOUT WARRANTIES OR CONDITIONS OF ANY KIND, either express or implied, including, without limitation, any warranties or conditions of TITLE, NON-INFRINGEMENT, MERCHANTABILITY, or FITNESS FOR A PARTICULAR PURPOSE. You are solely responsible for determining the appropriateness of using or redistributing the Work and assume any risks associated with Your exercise of permissions under this License.
8. Limitation of Liability. In no event and under no legal theory, whether in tort (including negligence), contract, or otherwise, unless required by applicable law (such as deliberate and grossly negligent acts) or agreed to in writing, shall any Contributor be liable to You for damages, including any direct, indirect, special, incidental, or consequential damages of any character arising as a result of this License or out of the use or inability to use the Work (including but not limited to damages for loss of goodwill, work stoppage, computer failure or malfunction, or any and all other commercial damages or losses), even if such Contributor has been advised of the possibility of such damages.
9. Accepting Warranty or Additional Liability. While redistributing the Work or Derivative Works thereof, You may choose to offer, and charge a fee for, acceptance of support, warranty, indemnity, or other liability obligations and/or rights consistent with this License. However, in accepting such obligations, You may act only on Your own behalf and on Your sole responsibility, not on behalf of any other Contributor, and only if You agree to indemnify, defend, and hold each Contributor harmless for any liability incurred by, or claims asserted against, such Contributor by reason of your accepting any such warranty or additional liability.
END OF TERMS AND CONDITIONS
APPENDIX: How to apply the Apache License to your work.
To apply the Apache License to your work, attach the following boilerplate notice, with the fields enclosed by brackets "[]" replaced with your own identifying information. (Don't include the brackets!) The text should be enclosed in the appropriate comment syntax for the file format. We also recommend that a file or class name and description of purpose be included on the same "printed page" as the copyright notice for easier identification within third-party archives.
Copyright [yyyy] [name of copyright owner]
Licensed under the Apache License, Version 2.0 (the "License"); you may not use this file except in compliance with the License. You may obtain a copy of the License at
http://www.apache.org/licenses/LICENSE-2.0
Unless required by applicable law or agreed to in writing, software distributed under the License is distributed on an "AS IS" BASIS, WITHOUT WARRANTIES OR CONDITIONS OF ANY KIND, either express or implied.
See the License for the specific language governing permissions and
limitations under the License.
Maven Plugin Tools
PVS-Studio uses Maven Plugin Tools. This is Maven Plugin Tools license:
Apache License
Version 2.0, January 2004
http://www.apache.org/licenses/
TERMS AND CONDITIONS FOR USE, REPRODUCTION, AND DISTRIBUTION
1. Definitions.
"License" shall mean the terms and conditions for use, reproduction, and distribution as defined by Sections 1 through 9 of this document.
"Licensor" shall mean the copyright owner or entity authorized by the copyright owner that is granting the License.
"Legal Entity" shall mean the union of the acting entity and all other entities that control, are controlled by, or are under common control with that entity. For the purposes of this definition, "control" means (i) the power, direct or indirect, to cause the direction or management of such entity, whether by contract or otherwise, or (ii) ownership of fifty percent (50%) or more of the outstanding shares, or (iii) beneficial ownership of such entity.
"You" (or "Your") shall mean an individual or Legal Entity exercising permissions granted by this License.
"Source" form shall mean the preferred form for making modifications, including but not limited to software source code, documentation source, and configuration files.
"Object" form shall mean any form resulting from mechanical transformation or translation of a Source form, including but not limited to compiled object code, generated documentation, and conversions to other media types.
"Work" shall mean the work of authorship, whether in Source or Object form, made available under the License, as indicated by a copyright notice that is included in or attached to the work (an example is provided in the Appendix below).
"Derivative Works" shall mean any work, whether in Source or Object form, that is based on (or derived from) the Work and for which the editorial revisions, annotations, elaborations, or other modifications represent, as a whole, an original work of authorship. For the purposes of this License, Derivative Works shall not include works that remain separable from, or merely link (or bind by name) to the interfaces of, the Work and Derivative Works thereof.
"Contribution" shall mean any work of authorship, including the original version of the Work and any modifications or additions to that Work or Derivative Works thereof, that is intentionally submitted to Licensor for inclusion in the Work by the copyright owner or by an individual or Legal Entity authorized to submit on behalf of the copyright owner. For the purposes of this definition, "submitted" means any form of electronic, verbal, or written communication sent to the Licensor or its representatives, including but not limited to communication on electronic mailing lists, source code control systems, and issue tracking systems that are managed by, or on behalf of, the Licensor for the purpose of discussing and improving the Work, but excluding communication that is conspicuously marked or otherwise designated in writing by the copyright owner as "Not a Contribution."
"Contributor" shall mean Licensor and any individual or Legal Entity on behalf of whom a Contribution has been received by Licensor and subsequently incorporated within the Work.
2. Grant of Copyright License. Subject to the terms and conditions of this License, each Contributor hereby grants to You a perpetual, worldwide, non-exclusive, no-charge, royalty-free, irrevocable copyright license to reproduce, prepare Derivative Works of, publicly display, publicly perform, sublicense, and distribute the Work and such Derivative Works in Source or Object form.
3. Grant of Patent License. Subject to the terms and conditions of this License, each Contributor hereby grants to You a perpetual, worldwide, non-exclusive, no-charge, royalty-free, irrevocable (except as stated in this section) patent license to make, have made, use, offer to sell, sell, import, and otherwise transfer the Work, where such license applies only to those patent claims licensable by such Contributor that are necessarily infringed by their Contribution(s) alone or by combination of their Contribution(s) with the Work to which such Contribution(s) was submitted. If You institute patent litigation against any entity (including a cross-claim or counterclaim in a lawsuit) alleging that the Work or a Contribution incorporated within the Work constitutes direct or contributory patent infringement, then any patent licenses granted to You under this License for that Work shall terminate as of the date such litigation is filed.
4. Redistribution. You may reproduce and distribute copies of the Work or Derivative Works thereof in any medium, with or without modifications, and in Source or Object form, provided that You meet the following conditions:
(a) You must give any other recipients of the Work or Derivative Works a copy of this License; and
(b) You must cause any modified files to carry prominent notices stating that You changed the files; and
(c) You must retain, in the Source form of any Derivative Works that You distribute, all copyright, patent, trademark, and attribution notices from the Source form of the Work, excluding those notices that do not pertain to any part of the Derivative Works; and
(d) If the Work includes a "NOTICE" text file as part of its distribution, then any Derivative Works that You distribute must include a readable copy of the attribution notices contained within such NOTICE file, excluding those notices that do not pertain to any part of the Derivative Works, in at least one of the following places: within a NOTICE text file distributed as part of the Derivative Works; within the Source form or documentation, if provided along with the Derivative Works; or, within a display generated by the Derivative Works, if and wherever such third-party notices normally appear. The contents of the NOTICE file are for informational purposes only and do not modify the License. You may add Your own attribution notices within Derivative Works that You distribute, alongside or as an addendum to the NOTICE text from the Work, provided that such additional attribution notices cannot be construed as modifying the License.
You may add Your own copyright statement to Your modifications and may provide additional or different license terms and conditions for use, reproduction, or distribution of Your modifications, or for any such Derivative Works as a whole, provided Your use, reproduction, and distribution of the Work otherwise complies with the conditions stated in this License.
5. Submission of Contributions. Unless You explicitly state otherwise, any Contribution intentionally submitted for inclusion in the Work by You to the Licensor shall be under the terms and conditions of this License, without any additional terms or conditions. Notwithstanding the above, nothing herein shall supersede or modify the terms of any separate license agreement you may have executed with Licensor regarding such Contributions.
6. Trademarks. This License does not grant permission to use the trade names, trademarks, service marks, or product names of the Licensor, except as required for reasonable and customary use in describing the origin of the Work and reproducing the content of the NOTICE file.
7. Disclaimer of Warranty. Unless required by applicable law or agreed to in writing, Licensor provides the Work (and each Contributor provides its Contributions) on an "AS IS" BASIS, WITHOUT WARRANTIES OR CONDITIONS OF ANY KIND, either express or implied, including, without limitation, any warranties or conditions of TITLE, NON-INFRINGEMENT, MERCHANTABILITY, or FITNESS FOR A PARTICULAR PURPOSE. You are solely responsible for determining the appropriateness of using or redistributing the Work and assume any risks associated with Your exercise of permissions under this License.
8. Limitation of Liability. In no event and under no legal theory, whether in tort (including negligence), contract, or otherwise, unless required by applicable law (such as deliberate and grossly negligent acts) or agreed to in writing, shall any Contributor be liable to You for damages, including any direct, indirect, special, incidental, or consequential damages of any character arising as a result of this License or out of the use or inability to use the Work (including but not limited to damages for loss of goodwill, work stoppage, computer failure or malfunction, or any and all other commercial damages or losses), even if such Contributor has been advised of the possibility of such damages.
9. Accepting Warranty or Additional Liability. While redistributing the Work or Derivative Works thereof, You may choose to offer, and charge a fee for, acceptance of support, warranty, indemnity, or other liability obligations and/or rights consistent with this License. However, in accepting such obligations, You may act only on Your own behalf and on Your sole responsibility, not on behalf of any other Contributor, and only if You agree to indemnify, defend, and hold each Contributor harmless for any liability incurred by, or claims asserted against, such Contributor by reason of your accepting any such warranty or additional liability.
END OF TERMS AND CONDITIONS
APPENDIX: How to apply the Apache License to your work.
To apply the Apache License to your work, attach the following boilerplate notice, with the fields enclosed by brackets "[]" replaced with your own identifying information. (Don't include the brackets!) The text should be enclosed in the appropriate comment syntax for the file format. We also recommend that a file or class name and description of purpose be included on the same "printed page" as the copyright notice for easier identification within third-party archives.
Copyright [yyyy] [name of copyright owner]
Licensed under the Apache License, Version 2.0 (the "License"); you may not use this file except in compliance with the License. You may obtain a copy of the License at
http://www.apache.org/licenses/LICENSE-2.0
Unless required by applicable law or agreed to in writing, software distributed under the License is distributed on an "AS IS" BASIS, WITHOUT WARRANTIES OR CONDITIONS OF ANY KIND, either express or implied.
See the License for the specific language governing permissions and
limitations under the License.
Commons IO library
PVS-Studio uses Commons IO Library. This is Commons IO Library license:
Apache License
Version 2.0, January 2004
http://www.apache.org/licenses/
TERMS AND CONDITIONS FOR USE, REPRODUCTION, AND DISTRIBUTION
1. Definitions.
"License" shall mean the terms and conditions for use, reproduction, and distribution as defined by Sections 1 through 9 of this document.
"Licensor" shall mean the copyright owner or entity authorized by the copyright owner that is granting the License.
"Legal Entity" shall mean the union of the acting entity and all other entities that control, are controlled by, or are under common control with that entity. For the purposes of this definition, "control" means (i) the power, direct or indirect, to cause the direction or management of such entity, whether by contract or otherwise, or (ii) ownership of fifty percent (50%) or more of the outstanding shares, or (iii) beneficial ownership of such entity.
"You" (or "Your") shall mean an individual or Legal Entity exercising permissions granted by this License.
"Source" form shall mean the preferred form for making modifications, including but not limited to software source code, documentation source, and configuration files.
"Object" form shall mean any form resulting from mechanical transformation or translation of a Source form, including but not limited to compiled object code, generated documentation, and conversions to other media types.
"Work" shall mean the work of authorship, whether in Source or Object form, made available under the License, as indicated by a copyright notice that is included in or attached to the work (an example is provided in the Appendix below).
"Derivative Works" shall mean any work, whether in Source or Object form, that is based on (or derived from) the Work and for which the editorial revisions, annotations, elaborations, or other modifications represent, as a whole, an original work of authorship. For the purposes of this License, Derivative Works shall not include works that remain separable from, or merely link (or bind by name) to the interfaces of, the Work and Derivative Works thereof.
"Contribution" shall mean any work of authorship, including the original version of the Work and any modifications or additions to that Work or Derivative Works thereof, that is intentionally submitted to Licensor for inclusion in the Work by the copyright owner or by an individual or Legal Entity authorized to submit on behalf of the copyright owner. For the purposes of this definition, "submitted" means any form of electronic, verbal, or written communication sent to the Licensor or its representatives, including but not limited to communication on electronic mailing lists, source code control systems, and issue tracking systems that are managed by, or on behalf of, the Licensor for the purpose of discussing and improving the Work, but excluding communication that is conspicuously marked or otherwise designated in writing by the copyright owner as "Not a Contribution."
"Contributor" shall mean Licensor and any individual or Legal Entity on behalf of whom a Contribution has been received by Licensor and subsequently incorporated within the Work.
2. Grant of Copyright License. Subject to the terms and conditions of this License, each Contributor hereby grants to You a perpetual, worldwide, non-exclusive, no-charge, royalty-free, irrevocable copyright license to reproduce, prepare Derivative Works of, publicly display, publicly perform, sublicense, and distribute the Work and such Derivative Works in Source or Object form.
3. Grant of Patent License. Subject to the terms and conditions of this License, each Contributor hereby grants to You a perpetual, worldwide, non-exclusive, no-charge, royalty-free, irrevocable (except as stated in this section) patent license to make, have made, use, offer to sell, sell, import, and otherwise transfer the Work, where such license applies only to those patent claims licensable by such Contributor that are necessarily infringed by their Contribution(s) alone or by combination of their Contribution(s) with the Work to which such Contribution(s) was submitted. If You institute patent litigation against any entity (including a cross-claim or counterclaim in a lawsuit) alleging that the Work or a Contribution incorporated within the Work constitutes direct or contributory patent infringement, then any patent licenses granted to You under this License for that Work shall terminate as of the date such litigation is filed.
4. Redistribution. You may reproduce and distribute copies of the Work or Derivative Works thereof in any medium, with or without modifications, and in Source or Object form, provided that You meet the following conditions:
(a) You must give any other recipients of the Work or Derivative Works a copy of this License; and
(b) You must cause any modified files to carry prominent notices stating that You changed the files; and
(c) You must retain, in the Source form of any Derivative Works that You distribute, all copyright, patent, trademark, and attribution notices from the Source form of the Work, excluding those notices that do not pertain to any part of the Derivative Works; and
(d) If the Work includes a "NOTICE" text file as part of its distribution, then any Derivative Works that You distribute must include a readable copy of the attribution notices contained within such NOTICE file, excluding those notices that do not pertain to any part of the Derivative Works, in at least one of the following places: within a NOTICE text file distributed as part of the Derivative Works; within the Source form or documentation, if provided along with the Derivative Works; or, within a display generated by the Derivative Works, if and wherever such third-party notices normally appear. The contents of the NOTICE file are for informational purposes only and do not modify the License. You may add Your own attribution notices within Derivative Works that You distribute, alongside or as an addendum to the NOTICE text from the Work, provided that such additional attribution notices cannot be construed as modifying the License.
You may add Your own copyright statement to Your modifications and may provide additional or different license terms and conditions for use, reproduction, or distribution of Your modifications, or for any such Derivative Works as a whole, provided Your use, reproduction, and distribution of the Work otherwise complies with the conditions stated in this License.
5. Submission of Contributions. Unless You explicitly state otherwise, any Contribution intentionally submitted for inclusion in the Work by You to the Licensor shall be under the terms and conditions of this License, without any additional terms or conditions. Notwithstanding the above, nothing herein shall supersede or modify the terms of any separate license agreement you may have executed with Licensor regarding such Contributions.
6. Trademarks. This License does not grant permission to use the trade names, trademarks, service marks, or product names of the Licensor, except as required for reasonable and customary use in describing the origin of the Work and reproducing the content of the NOTICE file.
7. Disclaimer of Warranty. Unless required by applicable law or agreed to in writing, Licensor provides the Work (and each Contributor provides its Contributions) on an "AS IS" BASIS, WITHOUT WARRANTIES OR CONDITIONS OF ANY KIND, either express or implied, including, without limitation, any warranties or conditions of TITLE, NON-INFRINGEMENT, MERCHANTABILITY, or FITNESS FOR A PARTICULAR PURPOSE. You are solely responsible for determining the appropriateness of using or redistributing the Work and assume any risks associated with Your exercise of permissions under this License.
8. Limitation of Liability. In no event and under no legal theory, whether in tort (including negligence), contract, or otherwise, unless required by applicable law (such as deliberate and grossly negligent acts) or agreed to in writing, shall any Contributor be liable to You for damages, including any direct, indirect, special, incidental, or consequential damages of any character arising as a result of this License or out of the use or inability to use the Work (including but not limited to damages for loss of goodwill, work stoppage, computer failure or malfunction, or any and all other commercial damages or losses), even if such Contributor has been advised of the possibility of such damages.
9. Accepting Warranty or Additional Liability. While redistributing the Work or Derivative Works thereof, You may choose to offer, and charge a fee for, acceptance of support, warranty, indemnity, or other liability obligations and/or rights consistent with this License. However, in accepting such obligations, You may act only on Your own behalf and on Your sole responsibility, not on behalf of any other Contributor, and only if You agree to indemnify, defend, and hold each Contributor harmless for any liability incurred by, or claims asserted against, such Contributor by reason of your accepting any such warranty or additional liability.
END OF TERMS AND CONDITIONS
APPENDIX: How to apply the Apache License to your work.
To apply the Apache License to your work, attach the following boilerplate notice, with the fields enclosed by brackets "[]" replaced with your own identifying information. (Don't include the brackets!) The text should be enclosed in the appropriate comment syntax for the file format. We also recommend that a file or class name and description of purpose be included on the same "printed page" as the copyright notice for easier identification within third-party archives.
Copyright [yyyy] [name of copyright owner]
Licensed under the Apache License, Version 2.0 (the "License"); you may not use this file except in compliance with the License. You may obtain a copy of the License at
http://www.apache.org/licenses/LICENSE-2.0
Unless required by applicable law or agreed to in writing, software distributed under the License is distributed on an "AS IS" BASIS, WITHOUT WARRANTIES OR CONDITIONS OF ANY KIND, either express or implied.
See the License for the specific language governing permissions and
limitations under the License.
Apache Commons Lang
PVS-Studio uses Apache Commons Lang. This is Apache Commons Lang license:
Apache License
Version 2.0, January 2004
http://www.apache.org/licenses/
TERMS AND CONDITIONS FOR USE, REPRODUCTION, AND DISTRIBUTION
1. Definitions.
"License" shall mean the terms and conditions for use, reproduction, and distribution as defined by Sections 1 through 9 of this document.
"Licensor" shall mean the copyright owner or entity authorized by the copyright owner that is granting the License.
"Legal Entity" shall mean the union of the acting entity and all other entities that control, are controlled by, or are under common control with that entity. For the purposes of this definition, "control" means (i) the power, direct or indirect, to cause the direction or management of such entity, whether by contract or otherwise, or (ii) ownership of fifty percent (50%) or more of the outstanding shares, or (iii) beneficial ownership of such entity.
"You" (or "Your") shall mean an individual or Legal Entity exercising permissions granted by this License.
"Source" form shall mean the preferred form for making modifications, including but not limited to software source code, documentation source, and configuration files.
"Object" form shall mean any form resulting from mechanical transformation or translation of a Source form, including but not limited to compiled object code, generated documentation, and conversions to other media types.
"Work" shall mean the work of authorship, whether in Source or Object form, made available under the License, as indicated by a copyright notice that is included in or attached to the work (an example is provided in the Appendix below).
"Derivative Works" shall mean any work, whether in Source or Object form, that is based on (or derived from) the Work and for which the editorial revisions, annotations, elaborations, or other modifications represent, as a whole, an original work of authorship. For the purposes of this License, Derivative Works shall not include works that remain separable from, or merely link (or bind by name) to the interfaces of, the Work and Derivative Works thereof.
"Contribution" shall mean any work of authorship, including the original version of the Work and any modifications or additions to that Work or Derivative Works thereof, that is intentionally submitted to Licensor for inclusion in the Work by the copyright owner or by an individual or Legal Entity authorized to submit on behalf of the copyright owner. For the purposes of this definition, "submitted" means any form of electronic, verbal, or written communication sent to the Licensor or its representatives, including but not limited to communication on electronic mailing lists, source code control systems, and issue tracking systems that are managed by, or on behalf of, the Licensor for the purpose of discussing and improving the Work, but excluding communication that is conspicuously marked or otherwise designated in writing by the copyright owner as "Not a Contribution."
"Contributor" shall mean Licensor and any individual or Legal Entity on behalf of whom a Contribution has been received by Licensor and subsequently incorporated within the Work.
2. Grant of Copyright License. Subject to the terms and conditions of this License, each Contributor hereby grants to You a perpetual, worldwide, non-exclusive, no-charge, royalty-free, irrevocable copyright license to reproduce, prepare Derivative Works of, publicly display, publicly perform, sublicense, and distribute the Work and such Derivative Works in Source or Object form.
3. Grant of Patent License. Subject to the terms and conditions of this License, each Contributor hereby grants to You a perpetual, worldwide, non-exclusive, no-charge, royalty-free, irrevocable (except as stated in this section) patent license to make, have made, use, offer to sell, sell, import, and otherwise transfer the Work, where such license applies only to those patent claims licensable by such Contributor that are necessarily infringed by their Contribution(s) alone or by combination of their Contribution(s) with the Work to which such Contribution(s) was submitted. If You institute patent litigation against any entity (including a cross-claim or counterclaim in a lawsuit) alleging that the Work or a Contribution incorporated within the Work constitutes direct or contributory patent infringement, then any patent licenses granted to You under this License for that Work shall terminate as of the date such litigation is filed.
4. Redistribution. You may reproduce and distribute copies of the Work or Derivative Works thereof in any medium, with or without modifications, and in Source or Object form, provided that You meet the following conditions:
(a) You must give any other recipients of the Work or Derivative Works a copy of this License; and
(b) You must cause any modified files to carry prominent notices stating that You changed the files; and
(c) You must retain, in the Source form of any Derivative Works that You distribute, all copyright, patent, trademark, and attribution notices from the Source form of the Work, excluding those notices that do not pertain to any part of the Derivative Works; and
(d) If the Work includes a "NOTICE" text file as part of its distribution, then any Derivative Works that You distribute must include a readable copy of the attribution notices contained within such NOTICE file, excluding those notices that do not pertain to any part of the Derivative Works, in at least one of the following places: within a NOTICE text file distributed as part of the Derivative Works; within the Source form or documentation, if provided along with the Derivative Works; or, within a display generated by the Derivative Works, if and wherever such third-party notices normally appear. The contents of the NOTICE file are for informational purposes only and do not modify the License. You may add Your own attribution notices within Derivative Works that You distribute, alongside or as an addendum to the NOTICE text from the Work, provided that such additional attribution notices cannot be construed as modifying the License.
You may add Your own copyright statement to Your modifications and may provide additional or different license terms and conditions for use, reproduction, or distribution of Your modifications, or for any such Derivative Works as a whole, provided Your use, reproduction, and distribution of the Work otherwise complies with the conditions stated in this License.
5. Submission of Contributions. Unless You explicitly state otherwise, any Contribution intentionally submitted for inclusion in the Work by You to the Licensor shall be under the terms and conditions of this License, without any additional terms or conditions. Notwithstanding the above, nothing herein shall supersede or modify the terms of any separate license agreement you may have executed with Licensor regarding such Contributions.
6. Trademarks. This License does not grant permission to use the trade names, trademarks, service marks, or product names of the Licensor, except as required for reasonable and customary use in describing the origin of the Work and reproducing the content of the NOTICE file.
7. Disclaimer of Warranty. Unless required by applicable law or agreed to in writing, Licensor provides the Work (and each Contributor provides its Contributions) on an "AS IS" BASIS, WITHOUT WARRANTIES OR CONDITIONS OF ANY KIND, either express or implied, including, without limitation, any warranties or conditions of TITLE, NON-INFRINGEMENT, MERCHANTABILITY, or FITNESS FOR A PARTICULAR PURPOSE. You are solely responsible for determining the appropriateness of using or redistributing the Work and assume any risks associated with Your exercise of permissions under this License.
8. Limitation of Liability. In no event and under no legal theory, whether in tort (including negligence), contract, or otherwise, unless required by applicable law (such as deliberate and grossly negligent acts) or agreed to in writing, shall any Contributor be liable to You for damages, including any direct, indirect, special, incidental, or consequential damages of any character arising as a result of this License or out of the use or inability to use the Work (including but not limited to damages for loss of goodwill, work stoppage, computer failure or malfunction, or any and all other commercial damages or losses), even if such Contributor has been advised of the possibility of such damages.
9. Accepting Warranty or Additional Liability. While redistributing the Work or Derivative Works thereof, You may choose to offer, and charge a fee for, acceptance of support, warranty, indemnity, or other liability obligations and/or rights consistent with this License. However, in accepting such obligations, You may act only on Your own behalf and on Your sole responsibility, not on behalf of any other Contributor, and only if You agree to indemnify, defend, and hold each Contributor harmless for any liability incurred by, or claims asserted against, such Contributor by reason of your accepting any such warranty or additional liability.
END OF TERMS AND CONDITIONS
APPENDIX: How to apply the Apache License to your work.
To apply the Apache License to your work, attach the following boilerplate notice, with the fields enclosed by brackets "[]" replaced with your own identifying information. (Don't include the brackets!) The text should be enclosed in the appropriate comment syntax for the file format. We also recommend that a file or class name and description of purpose be included on the same "printed page" as the copyright notice for easier identification within third-party archives.
Copyright [yyyy] [name of copyright owner]
Licensed under the Apache License, Version 2.0 (the "License"); you may not use this file except in compliance with the License. You may obtain a copy of the License at
http://www.apache.org/licenses/LICENSE-2.0
Unless required by applicable law or agreed to in writing, software distributed under the License is distributed on an "AS IS" BASIS, WITHOUT WARRANTIES OR CONDITIONS OF ANY KIND, either express or implied.
See the License for the specific language governing permissions and
limitations under the License.
JetBrains Java annotations
PVS-Studio uses JetBrains Java annotations. This is JetBrains Java annotations license:
Apache License
Version 2.0, January 2004
http://www.apache.org/licenses/
TERMS AND CONDITIONS FOR USE, REPRODUCTION, AND DISTRIBUTION
1. Definitions.
"License" shall mean the terms and conditions for use, reproduction, and distribution as defined by Sections 1 through 9 of this document.
"Licensor" shall mean the copyright owner or entity authorized by the copyright owner that is granting the License.
"Legal Entity" shall mean the union of the acting entity and all other entities that control, are controlled by, or are under common control with that entity. For the purposes of this definition, "control" means (i) the power, direct or indirect, to cause the direction or management of such entity, whether by contract or otherwise, or (ii) ownership of fifty percent (50%) or more of the outstanding shares, or (iii) beneficial ownership of such entity.
"You" (or "Your") shall mean an individual or Legal Entity exercising permissions granted by this License.
"Source" form shall mean the preferred form for making modifications, including but not limited to software source code, documentation source, and configuration files.
"Object" form shall mean any form resulting from mechanical transformation or translation of a Source form, including but not limited to compiled object code, generated documentation, and conversions to other media types.
"Work" shall mean the work of authorship, whether in Source or Object form, made available under the License, as indicated by a copyright notice that is included in or attached to the work (an example is provided in the Appendix below).
"Derivative Works" shall mean any work, whether in Source or Object form, that is based on (or derived from) the Work and for which the editorial revisions, annotations, elaborations, or other modifications represent, as a whole, an original work of authorship. For the purposes of this License, Derivative Works shall not include works that remain separable from, or merely link (or bind by name) to the interfaces of, the Work and Derivative Works thereof.
"Contribution" shall mean any work of authorship, including the original version of the Work and any modifications or additions to that Work or Derivative Works thereof, that is intentionally submitted to Licensor for inclusion in the Work by the copyright owner or by an individual or Legal Entity authorized to submit on behalf of the copyright owner. For the purposes of this definition, "submitted" means any form of electronic, verbal, or written communication sent to the Licensor or its representatives, including but not limited to communication on electronic mailing lists, source code control systems, and issue tracking systems that are managed by, or on behalf of, the Licensor for the purpose of discussing and improving the Work, but excluding communication that is conspicuously marked or otherwise designated in writing by the copyright owner as "Not a Contribution."
"Contributor" shall mean Licensor and any individual or Legal Entity on behalf of whom a Contribution has been received by Licensor and subsequently incorporated within the Work.
2. Grant of Copyright License. Subject to the terms and conditions of this License, each Contributor hereby grants to You a perpetual, worldwide, non-exclusive, no-charge, royalty-free, irrevocable copyright license to reproduce, prepare Derivative Works of, publicly display, publicly perform, sublicense, and distribute the Work and such Derivative Works in Source or Object form.
3. Grant of Patent License. Subject to the terms and conditions of this License, each Contributor hereby grants to You a perpetual, worldwide, non-exclusive, no-charge, royalty-free, irrevocable (except as stated in this section) patent license to make, have made, use, offer to sell, sell, import, and otherwise transfer the Work, where such license applies only to those patent claims licensable by such Contributor that are necessarily infringed by their Contribution(s) alone or by combination of their Contribution(s) with the Work to which such Contribution(s) was submitted. If You institute patent litigation against any entity (including a cross-claim or counterclaim in a lawsuit) alleging that the Work or a Contribution incorporated within the Work constitutes direct or contributory patent infringement, then any patent licenses granted to You under this License for that Work shall terminate as of the date such litigation is filed.
4. Redistribution. You may reproduce and distribute copies of the Work or Derivative Works thereof in any medium, with or without modifications, and in Source or Object form, provided that You meet the following conditions:
(a) You must give any other recipients of the Work or Derivative Works a copy of this License; and
(b) You must cause any modified files to carry prominent notices stating that You changed the files; and
(c) You must retain, in the Source form of any Derivative Works that You distribute, all copyright, patent, trademark, and attribution notices from the Source form of the Work, excluding those notices that do not pertain to any part of the Derivative Works; and
(d) If the Work includes a "NOTICE" text file as part of its distribution, then any Derivative Works that You distribute must include a readable copy of the attribution notices contained within such NOTICE file, excluding those notices that do not pertain to any part of the Derivative Works, in at least one of the following places: within a NOTICE text file distributed as part of the Derivative Works; within the Source form or documentation, if provided along with the Derivative Works; or, within a display generated by the Derivative Works, if and wherever such third-party notices normally appear. The contents of the NOTICE file are for informational purposes only and do not modify the License. You may add Your own attribution notices within Derivative Works that You distribute, alongside or as an addendum to the NOTICE text from the Work, provided that such additional attribution notices cannot be construed as modifying the License.
You may add Your own copyright statement to Your modifications and may provide additional or different license terms and conditions for use, reproduction, or distribution of Your modifications, or for any such Derivative Works as a whole, provided Your use, reproduction, and distribution of the Work otherwise complies with the conditions stated in this License.
5. Submission of Contributions. Unless You explicitly state otherwise, any Contribution intentionally submitted for inclusion in the Work by You to the Licensor shall be under the terms and conditions of this License, without any additional terms or conditions. Notwithstanding the above, nothing herein shall supersede or modify the terms of any separate license agreement you may have executed with Licensor regarding such Contributions.
6. Trademarks. This License does not grant permission to use the trade names, trademarks, service marks, or product names of the Licensor, except as required for reasonable and customary use in describing the origin of the Work and reproducing the content of the NOTICE file.
7. Disclaimer of Warranty. Unless required by applicable law or agreed to in writing, Licensor provides the Work (and each Contributor provides its Contributions) on an "AS IS" BASIS, WITHOUT WARRANTIES OR CONDITIONS OF ANY KIND, either express or implied, including, without limitation, any warranties or conditions of TITLE, NON-INFRINGEMENT, MERCHANTABILITY, or FITNESS FOR A PARTICULAR PURPOSE. You are solely responsible for determining the appropriateness of using or redistributing the Work and assume any risks associated with Your exercise of permissions under this License.
8. Limitation of Liability. In no event and under no legal theory, whether in tort (including negligence), contract, or otherwise, unless required by applicable law (such as deliberate and grossly negligent acts) or agreed to in writing, shall any Contributor be liable to You for damages, including any direct, indirect, special, incidental, or consequential damages of any character arising as a result of this License or out of the use or inability to use the Work (including but not limited to damages for loss of goodwill, work stoppage, computer failure or malfunction, or any and all other commercial damages or losses), even if such Contributor has been advised of the possibility of such damages.
9. Accepting Warranty or Additional Liability. While redistributing the Work or Derivative Works thereof, You may choose to offer, and charge a fee for, acceptance of support, warranty, indemnity, or other liability obligations and/or rights consistent with this License. However, in accepting such obligations, You may act only on Your own behalf and on Your sole responsibility, not on behalf of any other Contributor, and only if You agree to indemnify, defend, and hold each Contributor harmless for any liability incurred by, or claims asserted against, such Contributor by reason of your accepting any such warranty or additional liability.
END OF TERMS AND CONDITIONS
APPENDIX: How to apply the Apache License to your work.
To apply the Apache License to your work, attach the following boilerplate notice, with the fields enclosed by brackets "[]" replaced with your own identifying information. (Don't include the brackets!) The text should be enclosed in the appropriate comment syntax for the file format. We also recommend that a file or class name and description of purpose be included on the same "printed page" as the copyright notice for easier identification within third-party archives.
Copyright [yyyy] [name of copyright owner]
Licensed under the Apache License, Version 2.0 (the "License"); you may not use this file except in compliance with the License. You may obtain a copy of the License at
http://www.apache.org/licenses/LICENSE-2.0
Unless required by applicable law or agreed to in writing, software distributed under the License is distributed on an "AS IS" BASIS, WITHOUT WARRANTIES OR CONDITIONS OF ANY KIND, either express or implied.
See the License for the specific language governing permissions and
limitations under the License.
JUnit framework
PVS-Studio uses JUnit Framework. This is JUnit Framework license:
Eclipse Public License - v 1.0
THE ACCOMPANYING PROGRAM IS PROVIDED UNDER THE TERMS OF THIS ECLIPSE PUBLIC LICENSE ("AGREEMENT"). ANY USE, REPRODUCTION OR DISTRIBUTION OF THE PROGRAM CONSTITUTES RECIPIENT'S ACCEPTANCE OF THIS AGREEMENT.
1. DEFINITIONS
"Contribution" means:
a) in the case of the initial Contributor, the initial code and documentation distributed under this Agreement, and b) in the case of each subsequent Contributor:
i) changes to the Program, and
ii) additions to the Program;
where such changes and/or additions to the Program originate from and are distributed by that particular Contributor. A Contribution 'originates' from a Contributor if it was added to the Program by such Contributor itself or anyone acting on such Contributor's behalf. Contributions do not include additions to the Program which: (i) are separate modules of software distributed in conjunction with the Program under their own license agreement, and (ii) are not derivative works of the Program.
"Contributor" means any person or entity that distributes the Program.
"Licensed Patents " mean patent claims licensable by a Contributor which are necessarily infringed by the use or sale of its Contribution alone or when combined with the Program.
"Program" means the Contributions distributed in accordance with this Agreement.
"Recipient" means anyone who receives the Program under this Agreement, including all Contributors.
2. GRANT OF RIGHTS
a) Subject to the terms of this Agreement, each Contributor hereby grants Recipient a non-exclusive, worldwide, royalty-free copyright license to reproduce, prepare derivative works of, publicly display, publicly perform, distribute and sublicense the Contribution of such Contributor, if any, and such derivative works, in source code and object code form.
b) Subject to the terms of this Agreement, each Contributor hereby grants Recipient a non-exclusive, worldwide, royalty-free patent license under Licensed Patents to make, use, sell, offer to sell, import and otherwise transfer the Contribution of such Contributor, if any, in source code and object code form. This patent license shall apply to the combination of the Contribution and the Program if, at the time the Contribution is added by the Contributor, such addition of the Contribution causes such combination to be covered by the Licensed Patents. The patent license shall not apply to any other combinations which include the Contribution. No hardware per se is licensed hereunder.
c) Recipient understands that although each Contributor grants the licenses to its Contributions set forth herein, no assurances are provided by any Contributor that the Program does not infringe the patent or other intellectual property rights of any other entity. Each Contributor disclaims any liability to Recipient for claims brought by any other entity based on infringement of intellectual property rights or otherwise. As a condition to exercising the rights and licenses granted hereunder, each Recipient hereby assumes sole responsibility to secure any other intellectual property rights needed, if any. For example, if a third party patent license is required to allow Recipient to distribute the Program, it is Recipient's responsibility to acquire that license before distributing the Program.
d) Each Contributor represents that to its knowledge it has sufficient copyright rights in its Contribution, if any, to grant the copyright license set forth in this Agreement.
3. REQUIREMENTS
A Contributor may choose to distribute the Program in object code form under its own license agreement, provided that:
a) it complies with the terms and conditions of this Agreement; and
b) its license agreement:
i) effectively disclaims on behalf of all Contributors all warranties and conditions, express and implied, including warranties or conditions of title and non-infringement, and implied warranties or conditions of merchantability and fitness for a particular purpose;
ii) effectively excludes on behalf of all Contributors all liability for damages, including direct, indirect, special, incidental and consequential damages, such as lost profits;
iii) states that any provisions which differ from this Agreement are offered by that Contributor alone and not by any other party; and
iv) states that source code for the Program is available from such Contributor, and informs licensees how to obtain it in a reasonable manner on or through a medium customarily used for software exchange.
When the Program is made available in source code form:
a) it must be made available under this Agreement; and
b) a copy of this Agreement must be included with each copy of the Program.
Contributors may not remove or alter any copyright notices contained within the Program.
Each Contributor must identify itself as the originator of its Contribution, if any, in a manner that reasonably allows subsequent Recipients to identify the originator of the Contribution.
4. COMMERCIAL DISTRIBUTION
Commercial distributors of software may accept certain responsibilities with respect to end users, business partners and the like. While this license is intended to facilitate the commercial use of the Program, the Contributor who includes the Program in a commercial product offering should do so in a manner which does not create potential liability for other Contributors. Therefore, if a Contributor includes the Program in a commercial product offering, such Contributor ("Commercial Contributor") hereby agrees to defend and indemnify every other Contributor ("Indemnified Contributor") against any losses, damages and costs (collectively "Losses") arising from claims, lawsuits and other legal actions brought by a third party against the Indemnified Contributor to the extent caused by the acts or omissions of such Commercial Contributor in connection with its distribution of the Program in a commercial product offering. The obligations in this section do not apply to any claims or Losses relating to any actual or alleged intellectual property infringement. In order to qualify, an Indemnified Contributor must: a) promptly notify the Commercial Contributor in writing of such claim, and b) allow the Commercial Contributor to control, and cooperate with the Commercial Contributor in, the defense and any related settlement negotiations. The Indemnified Contributor may participate in any such claim at its own expense.
For example, a Contributor might include the Program in a commercial product offering, Product X. That Contributor is then a Commercial Contributor. If that Commercial Contributor then makes performance claims, or offers warranties related to Product X, those performance claims and warranties are such
Commercial Contributor's responsibility alone. Under this section, the Commercial Contributor would have to defend claims against the other Contributors related to those performance claims and warranties, and if a court requires any other Contributor to pay any damages as a result, the Commercial Contributor must pay those damages.
5. NO WARRANTY
EXCEPT AS EXPRESSLY SET FORTH IN THIS AGREEMENT, THE PROGRAM IS PROVIDED ON AN "AS IS" BASIS, WITHOUT WARRANTIES OR CONDITIONS OF ANY KIND, EITHER EXPRESS OR IMPLIED INCLUDING, WITHOUT LIMITATION, ANY WARRANTIES OR CONDITIONS OF TITLE, NON-INFRINGEMENT, MERCHANTABILITY OR FITNESS FOR A PARTICULAR PURPOSE. Each Recipient is solely responsible for determining the appropriateness of using and distributing the Program and assumes all risks associated with its exercise of rights under this Agreement, including but not limited to the risks and costs of program errors, compliance with applicable laws, damage to or loss of data, programs or equipment, and unavailability or interruption of operations.
6. DISCLAIMER OF LIABILITY
EXCEPT AS EXPRESSLY SET FORTH IN THIS AGREEMENT, NEITHER RECIPIENT NOR ANY CONTRIBUTORS SHALL HAVE ANY LIABILITY FOR ANY DIRECT, INDIRECT, INCIDENTAL, SPECIAL, EXEMPLARY, OR CONSEQUENTIAL DAMAGES (INCLUDING WITHOUT LIMITATION LOST PROFITS), HOWEVER CAUSED AND ON ANY THEORY OF LIABILITY, WHETHER IN CONTRACT, STRICT LIABILITY, OR TORT (INCLUDING NEGLIGENCE OR OTHERWISE) ARISING IN ANY WAY OUT OF THE USE OR DISTRIBUTION OF THE PROGRAM OR THE EXERCISE OF ANY RIGHTS GRANTED HEREUNDER, EVEN IF ADVISED OF THE POSSIBILITY OF SUCH DAMAGES.
7. GENERAL
If any provision of this Agreement is invalid or unenforceable under applicable law, it shall not affect the validity or enforceability of the remainder of the terms of this Agreement, and without further action by the parties hereto, such provision shall be reformed to the minimum extent necessary to make such provision valid and enforceable.
If Recipient institutes patent litigation against any entity (including a cross-claim or counterclaim in a lawsuit) alleging that the Program itself (excluding combinations of the Program with other software or hardware) infringes such Recipient's patent(s), then such Recipient's rights granted under Section 2(b) shall terminate as of the date such litigation is filed.
All Recipient's rights under this Agreement shall terminate if it fails to comply with any of the material terms or conditions of this Agreement and does not cure such failure in a reasonable period of time after becoming aware of such noncompliance. If all Recipient's rights under this Agreement terminate, Recipient agrees to cease use and distribution of the Program as soon as reasonably practicable. However, Recipient's obligations under this Agreement and any licenses granted by Recipient relating to the Program shall continue and survive.
Everyone is permitted to copy and distribute copies of this Agreement, but in order to avoid inconsistency the Agreement is copyrighted and may only be modified in the following manner. The Agreement Steward reserves the right to publish new versions (including revisions) of this Agreement from time to time. No one other than the Agreement Steward has the right to modify this Agreement. The Eclipse Foundation is the initial Agreement Steward. The Eclipse Foundation may assign the responsibility to serve as the Agreement Steward to a suitable separate entity. Each new version of the Agreement will be given a distinguishing version number. The Program (including Contributions) may always be distributed subject to the version of the Agreement under which it was received. In addition, after a new version of the Agreement is published, Contributor may elect to distribute the Program (including its Contributions) under the new version. Except as expressly stated in Sections 2(a) and 2(b) above, Recipient receives no rights or licenses to the intellectual property of any Contributor under this Agreement, whether expressly, by implication, estoppel or otherwise. All rights in the Program not expressly granted under this Agreement are reserved.
This Agreement is governed by the laws of the State of New York and the intellectual property laws of the United States of America. No party to this Agreement will bring a legal action under this Agreement more than one year after the cause of action arose. Each party waives its rights to a jury trial in any resulting litigation.
juniversalchardet
PVS-Studio uses juniversalchardet. This is juniversalchardet license:
MOZILLA PUBLIC LICENSE
Version 1.1
1. Definitions.
1.0.1. "Commercial Use" means distribution or otherwise making the Covered Code available to a third party.
1.1. "Contributor" means each entity that creates or contributes to the creation of Modifications.
1.2. "Contributor Version" means the combination of the Original Code, prior Modifications used by a Contributor, and the Modifications made by that particular Contributor.
1.3. "Covered Code" means the Original Code or Modifications or the combination of the Original Code and Modifications, in each case including portions thereof.
1.4. "Electronic Distribution Mechanism" means a mechanism generally accepted in the software development community for the electronic transfer of data.
1.5. "Executable" means Covered Code in any form other than Source Code.
1.6. "Initial Developer" means the individual or entity identified as the Initial Developer in the Source Code notice required by Exhibit A.
1.7. "Larger Work" means a work which combines Covered Code or portions thereof with code not governed by the terms of this License.
1.8. "License" means this document.
1.8.1. "Licensable" means having the right to grant, to the maximum extent possible, whether at the time of the initial grant or subsequently acquired, any and all of the rights conveyed herein.
1.9. "Modifications" means any addition to or deletion from the substance or structure of either the Original Code or any previous Modifications. When Covered Code is released as a series of files, a Modification is: A. Any addition to or deletion from the contents of a file containing Original Code or previous Modifications.
B. Any new file that contains any part of the Original Code or previous Modifications.
1.10. "Original Code" means Source Code of computer software code which is described in the Source Code notice required by Exhibit A as Original Code, and which, at the time of its release under this License is not already Covered Code governed by this License.
1.10.1. "Patent Claims" means any patent claim(s), now owned or hereafter acquired, including without limitation, method, process, and apparatus claims, in any patent Licensable by grantor.
1.11. "Source Code" means the preferred form of the Covered Code for making modifications to it, including all modules it contains, plus any associated interface definition files, scripts used to control compilation and installation of an Executable, or source code differential comparisons against either the Original Code or another well known, available Covered Code of the Contributor's choice. The Source Code can be in a compressed or archival form, provided the appropriate decompression or de-archiving software is widely available for no charge.
1.12. "You" (or "Your") means an individual or a legal entity exercising rights under, and complying with all of the terms of, this License or a future version of this License issued under Section 6.1. For legal entities, "You" includes any entity which controls, is controlled by, or is under common control with You. For purposes of this definition, "control" means (a) the power, direct or indirect, to cause the direction or management of such entity, whether by contract or otherwise, or (b) ownership of more than fifty percent (50%) of the outstanding shares or beneficial ownership of such entity.
2. Source Code License.
2.1. The Initial Developer Grant. The Initial Developer hereby grants You a world-wide, royalty-free, non-exclusive license, subject to third party intellectual property claims:
(a) under intellectual property rights (other than patent or trademark) Licensable by Initial Developer to use, reproduce, modify, display, perform, sublicense and distribute the Original Code (or portions thereof) with or without Modifications, and/or as part of a Larger Work; and
(b) under Patents Claims infringed by the making, using or selling of Original Code, to make, have made, use, practice, sell, and offer for sale, and/or otherwise dispose of the Original Code (or portions thereof).
(c) the licenses granted in this Section 2.1(a) and (b) are effective on the date Initial Developer first distributes Original Code under the terms of this License.
(d) Notwithstanding Section 2.1(b) above, no patent license is granted: 1) for code that You delete from the Original Code; 2) separate from the Original Code; or 3) for infringements caused by: i) the modification of the Original Code or ii) the combination of the Original Code with other software or devices.
2.2. Contributor Grant. Subject to third party intellectual property claims, each Contributor hereby grants You a world-wide, royalty-free, non-exclusive license
(a) under intellectual property rights (other than patent or trademark) Licensable by Contributor, to use, reproduce, modify, display, perform, sublicense and distribute the Modifications created by such Contributor (or portions thereof) either on an unmodified basis, with other Modifications, as Covered Code and/or as part of a Larger Work; and
(b) under Patent Claims infringed by the making, using, or selling of Modifications made by that Contributor either alone and/or in combination with its Contributor Version (or portions of such combination), to make, use, sell, offer for sale, have made, and/or otherwise dispose of: 1) Modifications made by that Contributor (or portions thereof); and 2) the combination of Modifications made by that Contributor with its Contributor Version (or portions of such combination).
(c) the licenses granted in Sections 2.2(a) and 2.2(b) are effective on the date Contributor first makes Commercial Use of the Covered Code.
(d) Notwithstanding Section 2.2(b) above, no patent license is granted: 1) for any code that Contributor has deleted from the Contributor Version; 2) separate from the Contributor Version; 3) for infringements caused by: i) third party modifications of Contributor Version or ii) the combination of Modifications made by that Contributor with other software (except as part of the Contributor Version) or other devices; or 4) under Patent Claims infringed by Covered Code in the absence of Modifications made by that Contributor.
3. Distribution Obligations.
3.1. Application of License. The Modifications which You create or to which You contribute are governed by the terms of this License, including without limitation Section 2.2. The Source Code version of Covered Code may be distributed only under the terms of this License or a future version of this License released under Section 6.1, and You must include a copy of this License with every copy of the Source Code You distribute. You may not offer or impose any terms on any Source Code version that alters or restricts the applicable version of this License or the recipients' rights hereunder. However, You may include an additional document offering the additional rights described in Section 3.5.
3.2. Availability of Source Code. Any Modification which You create or to which You contribute must be made available in Source Code form under the terms of this License either on the same media as an Executable version or via an accepted Electronic Distribution Mechanism to anyone to whom you made an Executable version available; and if made available via Electronic Distribution Mechanism, must remain available for at least twelve (12) months after the date it initially became available, or at least six
(6) months after a subsequent version of that particular Modification has been made available to such recipients. You are responsible for ensuring that the Source Code version remains available even if the Electronic Distribution Mechanism is maintained by a third party.
3.3. Description of Modifications.
You must cause all Covered Code to which You contribute to contain a file documenting the changes You made to create that Covered Code and the date of any change. You must include a prominent statement that the Modification is derived, directly or indirectly, from Original Code provided by the Initial Developer and including the name of the Initial Developer in (a) the Source Code, and (b) in any notice in an Executable version or related documentation in which You describe the origin or ownership of the Covered Code.
3.4. Intellectual Property Matters
(a) Third Party Claims.
If Contributor has knowledge that a license under a third party's intellectual property rights is required to exercise the rights granted by such Contributor under Sections 2.1 or 2.2, Contributor must include a text file with the Source Code distribution titled "LEGAL" which describes the claim and the party making the claim in sufficient detail that a recipient will know whom to contact. If Contributor obtains such knowledge after the Modification is made available as described in Section 3.2, Contributor shall promptly modify the LEGAL file in all copies Contributor makes available thereafter and shall take other steps (such as notifying appropriate mailing lists or newsgroups) reasonably calculated to inform those who received the Covered Code that new knowledge has been obtained.
(b) Contributor APIs.
If Contributor's Modifications include an application programming interface and Contributor has knowledge of patent licenses which are reasonably necessary to implement that API, Contributor must also include this information in the LEGAL file.
(c) Representations.
Contributor represents that, except as disclosed pursuant to Section 3.4(a) above, Contributor believes that Contributor's Modifications are Contributor's original creation(s) and/or Contributor has sufficient rights to grant the rights conveyed by this License.
3.5. Required Notices.
You must duplicate the notice in Exhibit A in each file of the Source Code. If it is not possible to put such notice in a particular Source Code file due to its structure, then You must include such notice in a location (such as a relevant directory) where a user would be likely to look for such a notice. If You created one or more Modification(s) You may add your name as a Contributor to the notice described in Exhibit A. You must also duplicate this License in any documentation for the Source Code where You describe recipients' rights or ownership rights relating to Covered Code. You may choose to offer, and to charge a fee for, warranty, support, indemnity or liability obligations to one or more recipients of Covered Code. However, You may do so only on Your own behalf, and not on behalf of the Initial Developer or any Contributor. You must make it absolutely clear than any such warranty, support, indemnity or liability obligation is offered by You alone, and You hereby agree to indemnify the Initial Developer and every Contributor for any liability incurred by the Initial Developer or such Contributor as a result of warranty, support, indemnity or liability terms You offer.
3.6. Distribution of Executable Versions. You may distribute Covered Code in Executable form only if the requirements of Section 3.1-3.5 have been met for that Covered Code, and if You include a notice stating that the Source Code version of the Covered Code is available under the terms of this License, including a description of how and where You have fulfilled the obligations of Section 3.2. The notice must be conspicuously included in any notice in an Executable version, related documentation or collateral in which You describe recipients' rights relating to the Covered Code. You may distribute the Executable version of Covered Code or ownership rights under a license of Your choice, which may contain terms different from this License, provided that You are in compliance with the terms of this License and that the license for the Executable version does not attempt to limit or alter the recipient's rights in the Source Code version from the rights set forth in this License. If You distribute the Executable version under a different license You must make it absolutely clear that any terms which differ from this License are offered by You alone, not by the Initial Developer or any Contributor. You hereby agree to indemnify the Initial Developer and every Contributor for any liability incurred by the Initial Developer or such Contributor as a result of any such terms You offer.
3.7. Larger Works.
You may create a Larger Work by combining Covered Code with other code not governed by the terms of this License and distribute the Larger Work as a single product. In such a case, You must make sure the requirements of this License are fulfilled for the Covered Code.
4. Inability to Comply Due to Statute or Regulation.
If it is impossible for You to comply with any of the terms of this License with respect to some or all of the Covered Code due to statute, judicial order, or regulation then You must: (a) comply with the terms of this License to the maximum extent possible; and (b) describe the limitations and the code they affect. Such description must be included in the LEGAL file described in Section 3.4 and must be included with all distributions of the Source Code. Except to the extent prohibited by statute or regulation, such description must be sufficiently detailed for a recipient of ordinary skill to be able to understand it.
5. Application of this License.
This License applies to code to which the Initial Developer has attached the notice in Exhibit A and to related Covered Code.
6. Versions of the License.
6.1. New Versions.
Netscape Communications Corporation ("Netscape") may publish revised and/or new versions of the License from time to time. Each version will be given a distinguishing version number.
6.2. Effect of New Versions.
Once Covered Code has been published under a particular version of the License, You may always continue to use it under the terms of that version. You may also choose to use such Covered Code under the terms of any subsequent version of the License published by Netscape. No one other than Netscape has the right to modify the terms applicable to Covered Code created under this License.
6.3. Derivative Works.
If You create or use a modified version of this License (which you may only do in order to apply it to code which is not already Covered Code governed by this License), You must (a) rename Your license so that the phrases "Mozilla", "MOZILLAPL", "MOZPL", "Netscape", "MPL", "NPL" or any confusingly similar phrase do not appear in your license (except to note that your license differs from this License) and (b) otherwise make it clear that Your version of the license contains terms which differ from the Mozilla Public License and Netscape Public License. (Filling in the name of the Initial Developer, Original Code or Contributor in the notice described in Exhibit A shall not of themselves be deemed to be modifications of this License.)
7. DISCLAIMER OF WARRANTY.
COVERED CODE IS PROVIDED UNDER THIS LICENSE ON AN "AS IS" BASIS, WITHOUT WARRANTY OF ANY KIND, EITHER EXPRESSED OR IMPLIED, INCLUDING, WITHOUT LIMITATION, WARRANTIES THAT THE COVERED CODE IS FREE OF DEFECTS, MERCHANTABLE, FIT FOR A PARTICULAR PURPOSE OR NON-INFRINGING. THE ENTIRE RISK AS TO THE QUALITY AND PERFORMANCE OF THE COVERED CODE IS WITH YOU. SHOULD ANY COVERED CODE PROVE DEFECTIVE IN ANY RESPECT, YOU (NOT THE INITIAL DEVELOPER OR ANY OTHER CONTRIBUTOR) ASSUME THE COST OF ANY NECESSARY SERVICING, REPAIR OR CORRECTION. THIS DISCLAIMER OF WARRANTY CONSTITUTES AN ESSENTIAL PART OF THIS LICENSE. NO USE OF ANY COVERED CODE IS AUTHORIZED HEREUNDER EXCEPT UNDER THIS DISCLAIMER.
8. TERMINATION.
8.1. This License and the rights granted hereunder will terminate automatically if You fail to comply with terms herein and fail to cure such breach within 30 days of becoming aware of the breach. All sublicenses to the Covered Code which are properly granted shall survive any termination of this License. Provisions which, by their nature, must remain in effect beyond the termination of this License shall survive.
8.2. If You initiate litigation by asserting a patent infringement claim (excluding declatory judgment actions) against Initial Developer or a Contributor (the Initial Developer or Contributor against whom You file such action is referred to as "Participant") alleging that:
(a) such Participant's Contributor Version directly or indirectly infringes any patent, then any and all rights granted by such Participant to You under Sections 2.1 and/or 2.2 of this License shall, upon 60 days notice from Participant terminate prospectively, unless if within 60 days after receipt of notice You either: (i) agree in writing to pay Participant a mutually agreeable reasonable royalty for Your past and future use of Modifications made by such Participant, or (ii) withdraw Your litigation claim with respect to the Contributor Version against such Participant. If within 60 days of notice, a reasonable royalty and payment arrangement are not mutually agreed upon in writing by the parties or the litigation claim is not withdrawn, the rights granted by Participant to You under Sections 2.1 and/or 2.2 automatically terminate at the expiration of the 60 day notice period specified above.
(b) any software, hardware, or device, other than such Participant's Contributor Version, directly or indirectly infringes any patent, then any rights granted to You by such Participant under Sections 2.1(b) and 2.2(b) are revoked effective as of the date You first made, used, sold, distributed, or had made, Modifications made by that Participant.
8.3. If You assert a patent infringement claim against Participant alleging that such Participant's Contributor Version directly or indirectly infringes any patent where such claim is resolved (such as by license or settlement) prior to the initiation of patent infringement litigation, then the reasonable value of the licenses granted by such Participant under Sections 2.1 or 2.2 shall be taken into account in determining the amount or value of any payment or license.
8.4. In the event of termination under Sections 8.1 or 8.2 above, all end user license agreements (excluding distributors and resellers) which have been validly granted by You or any distributor hereunder prior to termination shall survive termination.
9. LIMITATION OF LIABILITY.
UNDER NO CIRCUMSTANCES AND UNDER NO LEGAL THEORY, WHETHER TORT (INCLUDING NEGLIGENCE), CONTRACT, OR OTHERWISE, SHALL YOU, THE INITIAL DEVELOPER, ANY OTHER CONTRIBUTOR, OR ANY DISTRIBUTOR OF COVERED CODE, OR ANY SUPPLIER OF ANY OF SUCH PARTIES, BE LIABLE TO ANY PERSON FOR ANY INDIRECT, SPECIAL, INCIDENTAL, OR CONSEQUENTIAL DAMAGES OF ANY CHARACTER INCLUDING, WITHOUT LIMITATION, DAMAGES FOR LOSS OF GOODWILL, WORK STOPPAGE, COMPUTER FAILURE OR MALFUNCTION, OR ANY AND ALL OTHER COMMERCIAL DAMAGES OR LOSSES, EVEN IF SUCH PARTY SHALL HAVE BEEN INFORMED OF THE POSSIBILITY OF SUCH DAMAGES. THIS LIMITATION OF LIABILITY SHALL NOT APPLY TO LIABILITY FOR DEATH OR PERSONAL INJURY RESULTING FROM SUCH PARTY'S NEGLIGENCE TO THE EXTENT APPLICABLE LAW PROHIBITS SUCH LIMITATION. SOME JURISDICTIONS DO NOT ALLOW THE EXCLUSION OR LIMITATION OF INCIDENTAL OR CONSEQUENTIAL DAMAGES, SO THIS EXCLUSION AND LIMITATION MAY NOT APPLY TO YOU.
10. U.S. GOVERNMENT END USERS.
The Covered Code is a "commercial item," as that term is defined in 48 C.F.R. 2.101 (Oct. 1995), consisting of "commercial computer software" and "commercial computer software documentation," as such terms are used in 48 C.F.R. 12.212 (Sept. 1995). Consistent with 48 C.F.R. 12.212 and 48 C.F.R. 227.7202-1 through 227.7202-4 (June 1995), all U.S. Government End Users acquire Covered Code with only those rights set forth herein.
11. MISCELLANEOUS.
This License represents the complete agreement concerning subject matter hereof. If any provision of this License is held to be unenforceable, such provision shall be reformed only to the extent necessary to make it enforceable. This License shall be governed by California law provisions (except to the extent applicable law, if any, provides otherwise), excluding its conflict-of-law provisions. With respect to disputes in which at least one party is a citizen of, or an entity chartered or registered to do business in the United States of America, any litigation relating to this License shall be subject to the jurisdiction of the Federal Courts of the Northern District of California, with venue lying in Santa Clara County, California, with the losing party responsible for costs, including without limitation, court costs and reasonable attorneys' fees and expenses. The application of the United Nations Convention on Contracts for the International Sale of Goods is expressly excluded. Any law or regulation which provides that the language of a contract shall be construed against the drafter shall not apply to this License.
12. RESPONSIBILITY FOR CLAIMS.
As between Initial Developer and the Contributors, each party is responsible for claims and damages arising, directly or indirectly, out of its utilization of rights under this License and You agree to work with Initial Developer and Contributors to distribute such responsibility on an equitable basis. Nothing herein is intended or shall be deemed to constitute any admission of liability.
13. MULTIPLE-LICENSED CODE.
Initial Developer may designate portions of the Covered Code as "Multiple-Licensed". "Multiple-Licensed" means that the Initial Developer permits you to utilize portions of the Covered Code under Your choice of the NPL or the alternative licenses, if any, specified by the Initial Developer in the file described in Exhibit A.
Common Weakness Enumeration (CWE)
PVS-Studio supports CWE. This is CWE license:
LICENSE
The MITRE Corporation (MITRE) hereby grants you a non-exclusive, royalty-free license to use Common Weakness Enumeration (CWE™) for research, development, and commercial purposes. Any copy you make for such purposes is authorized provided that you reproduce MITRE's copyright designation and this license in any such copy.
DISCLAIMERS
ALL DOCUMENTS AND THE INFORMATION CONTAINED THEREIN ARE PROVIDED ON AN "AS IS" BASIS AND THE CONTRIBUTOR, THE ORGANIZATION HE/SHE REPRESENTS OR IS SPONSORED BY (IF ANY), THE MITRE CORPORATION, ITS BOARD OF TRUSTEES, OFFICERS, AGENTS, AND EMPLOYEES, DISCLAIM ALL WARRANTIES, EXPRESS OR IMPLIED, INCLUDING BUT NOT LIMITED TO ANY WARRANTY THAT THE USE OF THE INFORMATION THEREIN WILL NOT INFRINGE ANY RIGHTS OR ANY IMPLIED WARRANTIES OF MERCHANTABILITY OR FITNESS FOR A PARTICULAR PURPOSE.
CWE is free to use by any organization or individual for any research, development, and/or commercial purposes, per these CWE Terms of Use. MITRE has copyrighted the CWE List, Top 25, CWSS, and CWRAF for the benefit of the community in order to ensure each remains a free and open standard, as well as to legally protect the ongoing use of it and any resulting content by government, vendors, and/or users. MITRE has trademarked ™ the CWE and related acronyms and the CWE and related logos to protect their sole and ongoing use by the CWE effort within the information security arena. Please contact cwe@mitre.org if you require further clarification on this issue.
Cross-platform analysis of C and C++ projects in PVS-Studio
- Introduction
- How to activate the license
- How to prepare the project for analysis
- How to analyze the project
- How to use the configuration file
- Baselining analysis results and filtering reports according to suppression rules
- Exit codes
Introduction
PVS-Studio supports cross-platform project checks in C and C++ regardless of the build system used. Such projects can be checked with a special utility. It has different names depending on the target platform: pvs-studio-analyzer for Linux and macOS, and CompilerCommandsAnalyzer.exe for Windows. All examples of launching the analyzer described here use the pvs-studio-analyzer executable file.
To check Visual Studio projects, use the following documentation:
- Get started with PVS-Studio in Visual Studio
- Analyzing Visual Studio / MSBuild / .NET projects from the command line using PVS-Studio
On Windows, you can also use a compilation monitoring server.
Note: pvs-studio-analyzer and CompilerCommandsAnalyzer.exe are the same cross-platform utility and have minor differences. This document describes platform-dependent features of these utilities. All pvs-studio-analyzer launch examples are cross-platform, unless the description says otherwise.
How to activate the license
To make the analyzer work, activate the license using one of the ways described in the documentation.
If you don't have the license, you can request it on our website.
How to prepare the project for analysis
To analyze the project, the pvs-studio-analyzer utility has to know the compilation launch parameters for each translation unit. These parameters can be obtained from JSON Compilation Database (compile_commands.json) or from the build trace file.
Important. The project must be successfully built to be analyzed.
Using the compilation database (Windows, Linux, macOS)
Many build systems (CMake, Ninja, etc.) allow you to generate the compile_commands.json file. For build systems that don't allow you to obtain compile_commands.json directly, there are various utilities (Bear, Text Toolkit, intercept-build, etc.) that allow you to generate it.
The JSON Compilation Database generation and analysis are described here.
Creating a compilation trace file (Linux only)
If you can't generate compile_commands.json for your project, you can use the compilation trace mode. This mode works only under Linux and uses the strace utility to intercept compiler calls.
Note: To monitor compilation on Windows, use CLMonitor, the compilation monitoring server.
Important: to trace the compilation, install strace 4.11 or newer and enable the PTRACE system call. Before starting the compilation tracing, the project should be cleaned. This will provide the most complete information about the structure of the project.
Note: in many distributions, PTRACE is enabled by default. However, there are exceptions. To enable PTRACE, change the value of the kernel.yama.ptrace_scope parameter in the /etc/sysctl.d/10-ptrace.conf file to 1.
The trace result is written to a file named strace_out (by default) located in the current directory. Later, the analyzer will use this file to obtain compilation parameters. You can specify an arbitrary path to the result file with the -o flag.
Before tracing, make sure that there are no artifacts of the previous build in the build directory. Otherwise, the build system may omit compiler calls for unmodified files if it uses incremental build mode.
To start tracing compilation, run the following command:
pvs-studio-analyzer trace [-o <FILE>] -- build_commandbuild_command is a command used to build the project.
Example:
pvs-studio-analyzer trace -- cmake build .How to analyze the project
After forming the JSON Compilation Database or the compilation trace file, you can finally start analyzing the project.
In general, run the following command to start the analysis:
pvs-studio-analyzer analyze [-o /path/to/PVS-Studio.log] \
[-e /path/to/exclude-path]... \
[-j <N>]Below is the description of all command-line flags.
General flags description
‑‑cfg [FILE] (-c [FILE]) specifies the configuration file ( *.cfg), in which you can put some parameters of the analyzer launch (for example, exclude-path, lic-file, etc.). The next section will describe the configuration file settings. You can put the general parameters for checking various projects in this configuration file.
‑‑lic-file [FILE] (-l [FILE]) is a path to the license file. There is a corresponding setting for this parameter in the configuration file.
‑‑threads [N] (-j [N]) specifies the number of threads to which the analysis will be parallelized.
‑‑output-file [FILE] (-o [FILE]) is a path to the file to which the analysis report will be written. By default, if this flag is not specified, the report will be written to the PVS-Studio.log file in the current directory. You can specify this parameter in the configuration file (*.cfg).
‑‑exclude-path [DIR] (-e [DIR]) specifies a path where files should be excluded from the analysis. You can specify an absolute or relative path. You can also use templates (glob) to exclude a set of files. If there are several directories that you want to exclude from the check, add each directory via this flag or write them in the configuration file.
‑‑analysis-mode [MODE] (-a [MODE]) specifies the group of warnings that will be activated during the analysis.
- 64 — diagnostics for 64-bit errors.
- GA — general analysis diagnostics.
- OP – diagnostics for micro-optimizations.
- CS — diagnostics for specific user requests.
- MISRA — diagnostics for checking the code for compliance with the MISRA standards.
- AUTOSAR — diagnostics for checking the code for compliance with the AUTOSAR standards.
- OWASP — diagnostics for checking the code for compliance with the OWASP standards.
You can read more about MISRA, AUTOSAR, and OWASP here.
If you want to specify several groups of warnings, separate them with the ';' or '+' character. For example: 'GA;OP;64' or GA+OP+64. You can omit single quotes if you use '+' as a separator. If you use the ';' character as a separator, then you should wrap the expression in single quotes or escape each semicolon. In shells, the ';' character usually means a command separator.
By default, the analyzer uses the GA group.
You can specify this parameter in the configuration file (*.cfg).
‑‑sourcetree-root [DIR] (-r [DIR]) indicates that the root part of the path (DIR) should be replaced with a special character in the report. Thus, the path to the file with the analyzer warning will become relative. By default, PVS-Studio, when generating diagnostic messages, outputs absolute paths to files that triggered the analyzer. With this setting, you can specify the root part of the path, which the analyzer will automatically replace with a special marker. The replacement will occur if the path to the file begins with the specified root part ([DIR]). Next, the report with relative paths can be used to view the analysis results in an environment with a different location of the source files.
‑‑disableLicenseExpirationCheck sets the exit code to zero if the license expires soon. This flag should be used when you're integrating the analyzer in continuous integration systems (Travis CI, CircleCI, GitLab CI/CD) or automating the verification of commits and Pull Requests and your license expires soon (less than 30 days left).
Note: if you renew the license and forget to remove this flag, then pvs-studio-analyzer replaces the possible zero exit code with code 6.
‑‑file [FILE] (-f [FILE]) specifies a path to the compilation trace file or JSON Compilation Database. By default, if this flag is not specified, PVS-Studio searches for the strace_out or compile_commands.json file in the current directory. Note that PVS-Studio first searches for compile_commands.json and only then strace_out. If you have these two files in your directory, then the analyzer chooses the first one. If you use JSON Compilation DB, make sure to specify the '.json' file extension, otherwise this file will be treated as a trace file.
Specify this flag if the compilation trace file or JSON Compilation Database is saved in a non-default path.
‑‑quiet — do not show the analysis process.
‑‑preprocessor [NAME] specifies the preprocessor type that the analyzer will expect when parsing preprocessed files (*.PVS-Studio.i). Possible values:
- visualcpp,
- clang,
- gcc,
- bcc,
- bcc_clang64,
- iar,
- keil5,
- keil5_gnu,
- c6000.
While the preprocessor is running, macros are expanded and the contents of files included via #include are substituted into the resulting preprocessed file. To make compilers and various utilities correctly navigate such a file, a preprocessor inserts special #line directives. They point to the file, the contents of which were inserted in this location.
The PVS-Studio needs to know the preprocessor type so the analyzer can correctly process the #line directives specific for different compilers.
By default, if this flag isn't specified, the analyzer tries to determine the preprocessor type on its own. However, there are situations when the analyzer may incorrectly determine it. In this case the preprocessor can be specified explicitly.
This parameter can be specified in the configuration file (*.cfg).
‑‑platform [NAME] allows you to specify the target platform for which the project is compiled.
This flag expects the following parameters:
- for Windows: win32, x64, Itanium, arm;
- for Linux: linux32, linux64, Itanium, arm;
- for macOS: macOS;
- For Embedded: pic8, tms (Texas instruments).
The analyzer needs information about the platform to correctly determine the data model.
By default, if you don't specify this flag, PVS-Studio will try to determine the platform based on the compiler launch parameters.
This parameter can be also specified in the configuration file.
‑‑ignore-ccache enables analysis of all source files regardless of the ccache state. If your project uses a wrapper over the compiler call (ccache) to speed up the build, the analysis will not find the compilation files. This flag allows you to omit the ccache call and process the compiler command wrapped in it.
--incremental (-i) enables incremental analysis of the project.
‑‑source-files [FILE] (-S [FILE]) specifies a list of source files for file list checking mode. This list is a text file where the path to each source file is located on a new line. You can use absolute and relative paths. Relative paths will be expanded relative to the directory from which you want to run the analysis.
This approach is convenient to use when you analyze commits and Pull Requests.
‑‑regenerate-depend-info [OPTION] updates information about compilation dependencies for each source file. Information about dependencies is stored in the depend_info.json file.
This flag supports the following modes:
- run-analysis – update the dependency information and run the analysis,
- skip-analysis – update information about dependencies without running the analysis.
The analyzer needs the dependencies file to correctly perform the file list checking mode or incremental analysis. You can read more about it here.
‑‑suppress-file [FILE] (-s [FILE]) specifies a path to the file with suppressed warnings. Warnings included in the suppression file are ignored when the analyzer report is generated. You can read more about it here. By default, the suppress file is named suppress_file.suppress.json.
‑‑analyze-specified-system-paths includes files from custom system directories (specified via compilation flags: isystem, isysroot, system_include_dir, etc.) in the analysis.
--compiler [COMPILER_NAME[=COMPILER_TYPE]] (-C [COMPILER_NAME[=COMPILER_TYPE]]) allows you to specify the compiler's name and type.
Use this flag when PVS-Studio cannot recognize compiler calls (when analyzing from a trace file) or starts the compiler with incorrect preprocessing flags, because it sets the wrong compiler type.
COMPILE_NAME is used to filter compiler commands when you parse a trace file (strace_out).
COMPILE_TYPE specifies the compiler's type. This allows the analyzer to to run the file preprocessing command correctly. Possible values: gcc, clang, keil5, keil5gnu, keil6, tiarmcgt, cl, clangcl, gccarm, iararm_v7_orolder, iararm, qcc, xc8. If the compiler type is not specified, the analyzer tries to determine it by name or via the version information. If it's impossible to determine the type, the analyzer will consider it as GCC (on Linux, macOS) or cl (on Windows).
For example, the following command tells the analyzer that there is an unknown CustomCompiler compiler in the strace_out file and it should be considered as GCC:
pvs-studio-analyzer analyzer -f /path/to/strace_out \
-C CustomCompiler=gcc--env [VAR=VALUE] (-E [VAR=VALUE]) specifies the environment variable to be preprocessed with.
--rules-config [FILE] (-R [FILE]) is a diagnostics configuration file (*.pvsconfig). Find more information about the configuration of diagnostics here.
‑‑intermodular enables the intermodular analysis mode. In this mode, the analyzer performs a deeper code analysis by increasing the analysis time.
How to use the configuration file
The configuration file allows you to set general parameters for running the analyzer.
You can create a separate configuration file for the project and put specific parameters in this file.
The parameters are written as the "key=value" pair. You can use the '#' symbol to comment on lines.
Possible values in the configuration file:
exclude-path specifies a path (absolute or relative) to files or directories that should be excluded from the analysis. The relative path is expanded relative to the directory containing the configuration file. You can also use the command shell templates (glob) '?' and '*' to specify the path.
timeout specifies the time (in seconds) after which the analysis of a translation unit will be terminated. By default, one file should be analyzed for no more than 10 minutes (600 seconds). If you pass here the 0 value, the time limit will be removed. Please note: removing the time limit may cause the analysis to hang.
platform specifies the platform to use. Possible options: win32, x64, Itanium, linux32, linux64, macOS, pic8, tms.
preprocessor specifies the preprocessor to use. Possible options: visualcpp, clang, gcc, bcc, bcc_clang64, iar, keil5, keil5_gnu, c6000.
lic-file specifies an absolute or relative path to the license file. The path is expanded relative to the directory containing configuration file.
analysis-mode specifies the type of warnings to be issued. The type is a bit mask. Using the bitwise OR, you can specify several groups of diagnostics that will be used in the analysis.
Possible values:
- '0' – full analysis;
- '1' – 64-bit diagnostics;
- '4' – general analysis diagnostics (recommended and used by default);
- '8' – diagnostics of micro-optimizations;
- '16' – diagnostics for customer specific requests;
- '32' – diagnostics for code compliance with MISRA recommendations;
- '64' – diagnostics for code compliance with AUTOSAR recommendations;
- '128' – diagnostics for code compliance with OWASP recommendations.
output-file is an absolute or relative path to the file to which the analyzer operation report should be written. By default, the report will be written to the 'PVS-Studio.log' file. Relative paths will be expanded relative to the directory from which you want to run the analysis. When the analysis is parallelized, all PVS-Studio core processes write a report in a single file. Therefore, this file remains locked until the last process writes information to it.
funsigned-char specifies the signedness of the char type. If it's true — the analyzer treats char as an unsigned type, otherwise it treats it as signed.
rules-config specifies the path to the diagnostics configuration file (*.pvsconfig). The path is expanded relative to the directory containing configuration file.
no-noise allows you to exclude all warnings of the 3-rd level of certainty. If it's true — warnings of this level won't appear in the analyzer's report. By default, it's false.
errors-off specifies the list of deactivated diagnostics. The list is separated by a space or comma: 'V1024 V591' or 'V1024, V591'. The diagnostics in this list will be excluded from the analysis.
analyzer-errors specifies the list of active diagnostics. The list is separated by a space or comma: 'V1024 V591' or 'V1024, V591'. Only the diagnostics in this list will be used during the analysis.
Please note: the list of deactivated diagnostics specified in errors-off has a higher priority than the list of activated ones.
Example: let's specify the basic parameters for running PVS-Studio in the configuration file and run the project analysis by passing our '*.cfg' file to the analyzer.
File MyProject.cfg:
lic-file=~/.config/PVS-Studio/PVS-Studio.lic
exclude-path=*/tests/*
exclude-path=*/lib/*
exclude-path=*/third-party/*
platform=linux64
preprocessor=clang
analysis-mode=4
output-file=~/MyProject/MyProject.PVS-Studio.logLet's start the analysis (assuming that there is strace_out or compile_commands.json in the current directory):
pvs-studio-analyzer analyze --cfg ./MyProject.cfg ....Using the configuration file makes it easier to integrate the analyzer with CI/CD systems.
Baselining analysis results and filtering reports according to suppression rules
The PVS-Studio analyzer has the message suppression mechanism that can be used in the following scenarios:
- when you introduce the analyzer into your project and PVS-Studio issues a lot of warnings on the code. You can suppress these warnings and return to them when you have time. In this case, PVS-Studio will issue warnings only on new code during regular checks;
- when you want to suppress the analyzer's false positives without modifying source code files.
The pvs-studio-analyzer allows you to suppress analyzer messages and filter a report by excluding suppressed messages.
How to baseline messages
To baseline messages, the analyzer creates a special file (by default, it's named suppress_file.suppress.json). This file contains analyzer warnings that should be ignored.
The general syntax for running the baselining mode is as follows:
pvs-studio-analyzer suppress [-a <TYPES>] [-f <FILE...>] \
[-v <NUMBER...>] [-o <FILE>] [log][log] is a path to the report created by the analyzer. By default, the analyzer searches for the PVS-Studio.log file in the current directory.
‑‑analyzer [TYPES] (-a [TYPES]) allows you to specify groups and levels of warnings to move to the suppress file. This parameter takes a string of the 'Diagnostic group: Diagnostic level [, Diagnostic level]*' form. Diagnostic group defines a specific group (possible groups: GA, 64, OP, CS, MISRA, AUTOSAR, OWASP), and Diagnostic level — the level of certainty (possible levels: 1, 2, 3). You can combine various groups and levels via the ';' or '+' character.
For example: the 'GA:1;OP:1' string tells the analyzer to suppress only diagnostics with the first level of certainty from general analysis and micro-optimization groups. By default, the analyzer filters warnings by all groups and levels.
‑‑file [FILE...] (-f [FILE...]) allows you to suppress all warnings for a specific file:
pvs-studio-analyzer suppress -f test.cpp -f test2.cpp /path/to/PVS-Studio.logor for a specific line in a specific file:
pvs-studio-analyzer suppress -f test.cpp:15 /path/to/PVS=Studio.log--warning [NUMBER...] (-v[NUMBER...]) specifies the number of diagnostic, warnings of which should be suppressed:
pvs-studio-analyzer suppress -v512 /path/to/PVS-Studio.log--output [FILE], (-o[FILE]) specifies a path and a name for the suppress file. By default, PVS-Studio writes all information about suppressed warnings to the suppress_file.suppress.json file in the current directory.
Note: you can combine the ‑‑file, ‑‑warning, and ‑‑analyzer flags. For example, the following command will suppress all V1040 warnings on line 12:
pvs-studio-analyzer suppress -f test.cpp:12 -v1040 /path/to/PVS-Studio.logThe following command suppresses all GA diagnostics of the 3-rd level for the file:
pvs-studio-analyzer suppress -f test.cpp -a 'GA:3' /path/to/PVS-Studio.logHow to filter a report by the suppress file
You can filter out warnings that were previously placed in the suppress file from the analyzer's report. To do this, execute the following command:
pvs-studio-analyzer filter-suppressed [-o <FILE>] [-s <FILE>] [log]--output [FILE] (-o [FILE]) is a name of the file to write the filtered report. By default, if the flag is not set, pvs-studio-analyzer will overwrite the existing report file.
--suppress-file [FILE] (-s [FILE]) is a message suppression file. By default, pvs-studio-analyzer searches for the suppress_file.suppress.json file in the startup directory.
[log] is a report file from which warnings should be filtered
The pvs-studio-analyzer utility always searches for the suppress file in the analysis mode to create a filtered report. If the file has a non-standard path, you can specify it via the -s flag:
pvs-studio-analyzer analyze -s /path/to/suppress_file.suppress.json ....Exit codes
The utility can return the following values:
0 – analysis completed successfully;
1 – various internal errors. For example, file preprocessing failed or an error occurred during trace file parsing. Usually, a crash with such code is followed by an error description in stdout.
2 – the license expires in less than a month;
3 – an internal error occurred during the analysis of some files;
5 — the license has expired;
6 — the utility was started with the –disableLicenseExpirationCheck flag, and received a new license valid for more than 30 days.
Was this page helpful?